Zip Codes with the Highest Percentage of Households with Income Above $100,000 in Akron, OH
RELATED REPORTS & OPTIONS
Household Income | $100k+
Akron
Compare Zip Codes
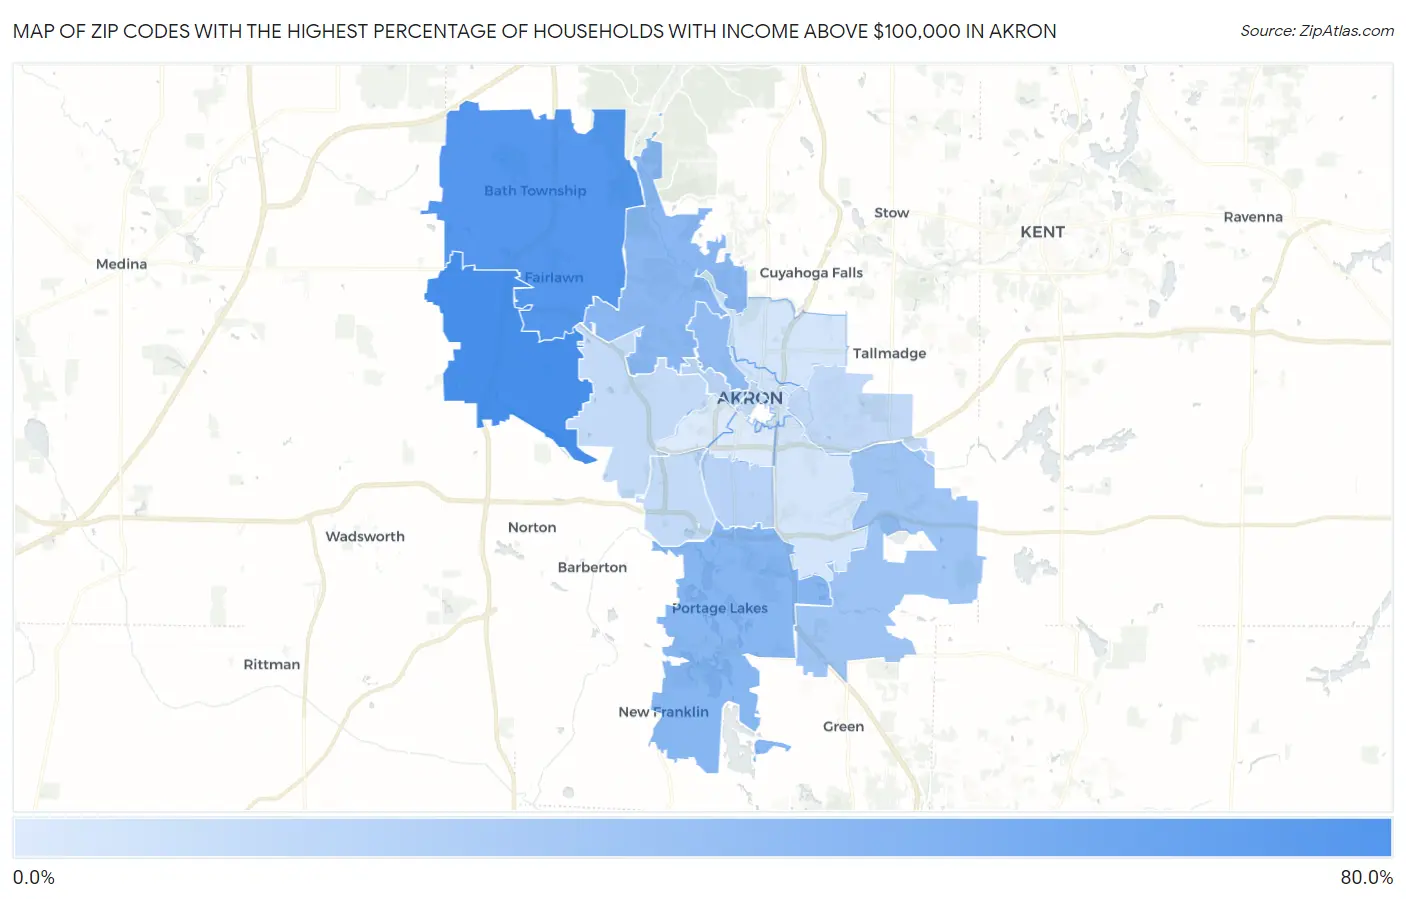
Map of Zip Codes with the Highest Percentage of Households with Income Above $100,000 in Akron
5.3%
60.5%
Zip Codes with the Highest Percentage of Households with Income Above $100,000 in Akron, OH
| Zip Code | Households with Income > $100k | vs State | vs National | |
| 1. | 44321 | 60.5% | 31.5%(+29.0)#39 | 37.3%(+23.2)#2,270 |
| 2. | 44333 | 54.8% | 31.5%(+23.3)#64 | 37.3%(+17.5)#3,503 |
| 3. | 44319 | 33.6% | 31.5%(+2.10)#400 | 37.3%(-3.70)#12,708 |
| 4. | 44313 | 33.0% | 31.5%(+1.50)#418 | 37.3%(-4.30)#13,104 |
| 5. | 44303 | 29.7% | 31.5%(-1.80)#523 | 37.3%(-7.60)#15,683 |
| 6. | 44312 | 25.3% | 31.5%(-6.20)#687 | 37.3%(-12.0)#19,480 |
| 7. | 44301 | 16.5% | 31.5%(-15.0)#972 | 37.3%(-20.8)#26,556 |
| 8. | 44302 | 16.1% | 31.5%(-15.4)#983 | 37.3%(-21.2)#26,873 |
| 9. | 44308 | 13.7% | 31.5%(-17.8)#1,040 | 37.3%(-23.6)#28,275 |
| 10. | 44305 | 13.6% | 31.5%(-17.9)#1,043 | 37.3%(-23.7)#28,302 |
| 11. | 44314 | 13.3% | 31.5%(-18.2)#1,050 | 37.3%(-24.0)#28,438 |
| 12. | 44320 | 13.2% | 31.5%(-18.3)#1,054 | 37.3%(-24.1)#28,487 |
| 13. | 44304 | 8.7% | 31.5%(-22.8)#1,108 | 37.3%(-28.6)#30,235 |
| 14. | 44306 | 8.3% | 31.5%(-23.2)#1,114 | 37.3%(-29.0)#30,344 |
| 15. | 44310 | 8.0% | 31.5%(-23.5)#1,123 | 37.3%(-29.3)#30,435 |
| 16. | 44311 | 5.3% | 31.5%(-26.2)#1,145 | 37.3%(-32.0)#30,992 |
| 17. | 44307 | 5.3% | 31.5%(-26.2)#1,146 | 37.3%(-32.0)#30,993 |
1
Common Questions
What are the Top 10 Zip Codes with the Highest Percentage of Households with Income Above $100,000 in Akron, OH?
Top 10 Zip Codes with the Highest Percentage of Households with Income Above $100,000 in Akron, OH are:
What zip code has the Highest Percentage of Households with Income Above $100,000 in Akron, OH?
44321 has the Highest Percentage of Households with Income Above $100,000 in Akron, OH with 60.5%.
What is the Percentage of Households with Income Above $100,000 in Akron, OH?
Percentage of Households with Income Above $100,000 in Akron is 16.5%.
What is the Percentage of Households with Income Above $100,000 in Ohio?
Percentage of Households with Income Above $100,000 in Ohio is 31.5%.
What is the Percentage of Households with Income Above $100,000 in the United States?
Percentage of Households with Income Above $100,000 in the United States is 37.3%.