Zip Codes with the Highest Percentage of Population Employed in Legal Services & Support in Akron, OH
RELATED REPORTS & OPTIONS
Legal Services & Support
Akron
Compare Zip Codes
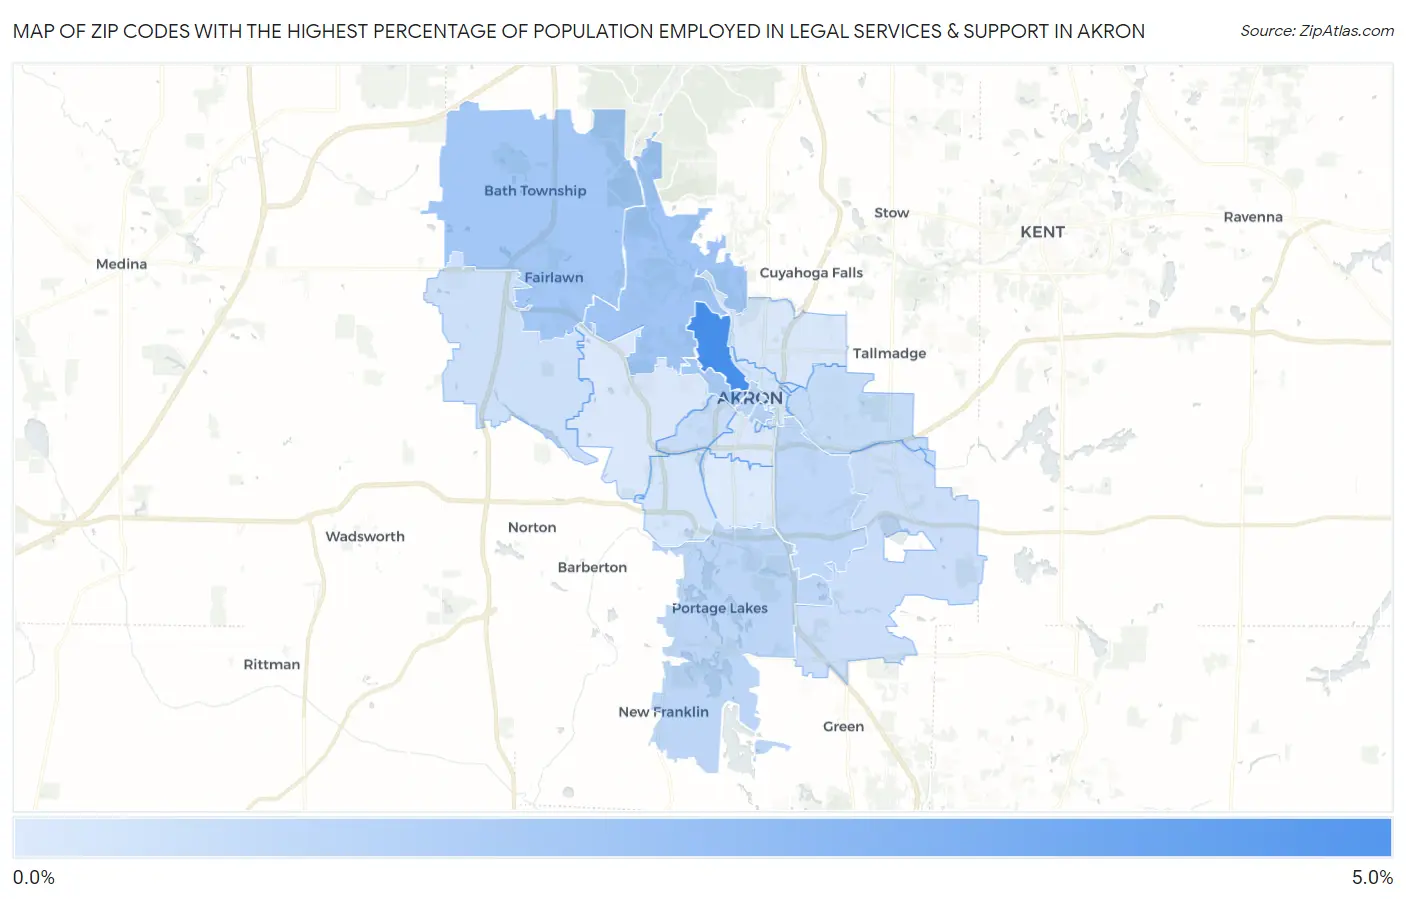
Map of Zip Codes with the Highest Percentage of Population Employed in Legal Services & Support in Akron
0.060%
4.6%
Zip Codes with the Highest Percentage of Population Employed in Legal Services & Support in Akron, OH
| Zip Code | % Employed | vs State | vs National | |
| 1. | 44303 | 4.6% | 0.92%(+3.71)#14 | 1.2%(+3.45)#840 |
| 2. | 44313 | 1.9% | 0.92%(+0.938)#98 | 1.2%(+0.679)#3,833 |
| 3. | 44333 | 1.8% | 0.92%(+0.865)#106 | 1.2%(+0.606)#4,031 |
| 4. | 44302 | 1.7% | 0.92%(+0.732)#119 | 1.2%(+0.473)#4,471 |
| 5. | 44325 | 1.3% | 0.92%(+0.408)#163 | 1.2%(+0.150)#5,770 |
| 6. | 44308 | 1.0% | 0.92%(+0.089)#225 | 1.2%(-0.170)#7,727 |
| 7. | 44319 | 1.0% | 0.92%(+0.076)#230 | 1.2%(-0.183)#7,816 |
| 8. | 44306 | 0.97% | 0.92%(+0.045)#238 | 1.2%(-0.214)#8,038 |
| 9. | 44305 | 0.75% | 0.92%(-0.177)#308 | 1.2%(-0.436)#9,949 |
| 10. | 44307 | 0.66% | 0.92%(-0.268)#350 | 1.2%(-0.527)#10,868 |
| 11. | 44312 | 0.64% | 0.92%(-0.282)#355 | 1.2%(-0.541)#11,007 |
| 12. | 44321 | 0.56% | 0.92%(-0.369)#392 | 1.2%(-0.628)#11,986 |
| 13. | 44304 | 0.36% | 0.92%(-0.566)#495 | 1.2%(-0.825)#14,349 |
| 14. | 44314 | 0.32% | 0.92%(-0.609)#517 | 1.2%(-0.868)#14,845 |
| 15. | 44310 | 0.17% | 0.92%(-0.757)#598 | 1.2%(-1.02)#16,505 |
| 16. | 44320 | 0.15% | 0.92%(-0.770)#605 | 1.2%(-1.03)#16,649 |
| 17. | 44311 | 0.15% | 0.92%(-0.777)#608 | 1.2%(-1.04)#16,709 |
| 18. | 44301 | 0.060% | 0.92%(-0.865)#638 | 1.2%(-1.12)#17,393 |
1
Common Questions
What are the Top 10 Zip Codes with the Highest Percentage of Population Employed in Legal Services & Support in Akron, OH?
Top 10 Zip Codes with the Highest Percentage of Population Employed in Legal Services & Support in Akron, OH are:
What zip code has the Highest Percentage of Population Employed in Legal Services & Support in Akron, OH?
44303 has the Highest Percentage of Population Employed in Legal Services & Support in Akron, OH with 4.6%.
What is the Percentage of Population Employed in Legal Services & Support in Akron, OH?
Percentage of Population Employed in Legal Services & Support in Akron is 0.97%.
What is the Percentage of Population Employed in Legal Services & Support in Ohio?
Percentage of Population Employed in Legal Services & Support in Ohio is 0.92%.
What is the Percentage of Population Employed in Legal Services & Support in the United States?
Percentage of Population Employed in Legal Services & Support in the United States is 1.2%.