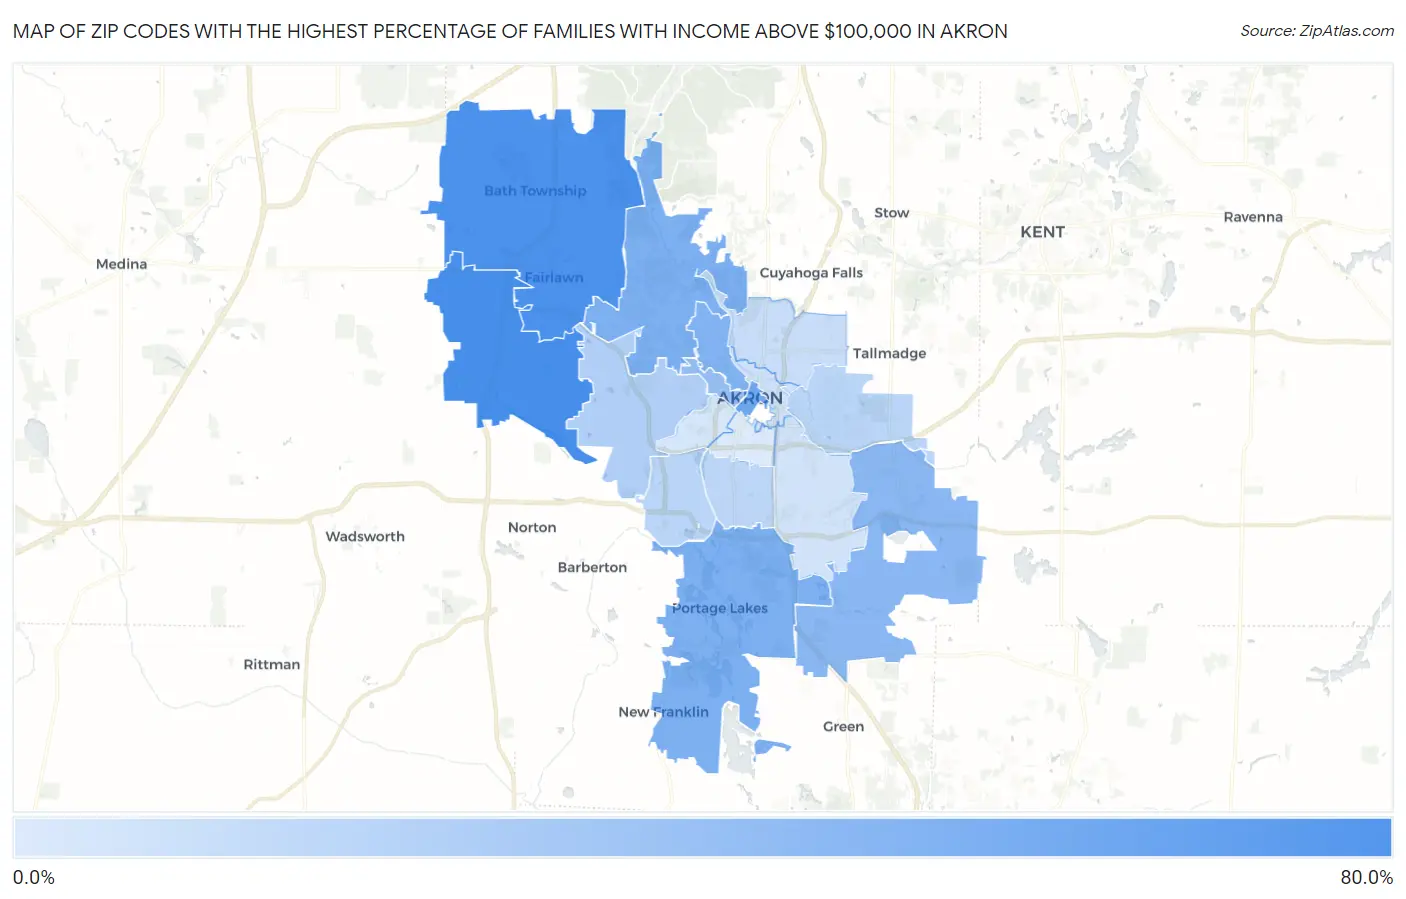
Zip Codes with the Highest Percentage of Families with Income Above $100,000 in Akron, OH
RELATED REPORTS & OPTIONS
Family Income | $100k+
Akron
Compare Zip Codes
Map of Zip Codes with the Highest Percentage of Families with Income Above $100,000 in Akron
5.4%
71.7%
Zip Codes with the Highest Percentage of Families with Income Above $100,000 in Akron, OH
| Zip Code | Families with Income > $100k | vs State | vs National | |
| 1. | 44321 | 71.7% | 42.3%(+29.4)#43 | 46.1%(+25.6)#2,278 |
| 2. | 44333 | 69.2% | 42.3%(+26.9)#53 | 46.1%(+23.1)#2,775 |
| 3. | 44308 | 50.0% | 42.3%(+7.70)#259 | 46.1%(+3.90)#8,827 |
| 4. | 44313 | 44.4% | 42.3%(+2.10)#349 | 46.1%(-1.70)#11,659 |
| 5. | 44319 | 44.3% | 42.3%(+2.00)#354 | 46.1%(-1.80)#11,751 |
| 6. | 44303 | 42.8% | 42.3%(+0.500)#391 | 46.1%(-3.30)#12,625 |
| 7. | 44312 | 38.0% | 42.3%(-4.30)#528 | 46.1%(-8.10)#15,748 |
| 8. | 44302 | 31.6% | 42.3%(-10.7)#731 | 46.1%(-14.5)#20,286 |
| 9. | 44320 | 21.9% | 42.3%(-20.4)#978 | 46.1%(-24.2)#26,346 |
| 10. | 44314 | 18.2% | 42.3%(-24.1)#1,034 | 46.1%(-27.9)#27,987 |
| 11. | 44305 | 17.8% | 42.3%(-24.5)#1,037 | 46.1%(-28.3)#28,140 |
| 12. | 44301 | 16.8% | 42.3%(-25.5)#1,052 | 46.1%(-29.3)#28,512 |
| 13. | 44310 | 13.1% | 42.3%(-29.2)#1,089 | 46.1%(-33.0)#29,673 |
| 14. | 44304 | 10.2% | 42.3%(-32.1)#1,116 | 46.1%(-35.9)#30,297 |
| 15. | 44306 | 9.1% | 42.3%(-33.2)#1,122 | 46.1%(-37.0)#30,471 |
| 16. | 44307 | 7.9% | 42.3%(-34.4)#1,129 | 46.1%(-38.2)#30,665 |
| 17. | 44311 | 5.4% | 42.3%(-36.9)#1,143 | 46.1%(-40.7)#30,937 |
1
Common Questions
What are the Top 10 Zip Codes with the Highest Percentage of Families with Income Above $100,000 in Akron, OH?
Top 10 Zip Codes with the Highest Percentage of Families with Income Above $100,000 in Akron, OH are:
What zip code has the Highest Percentage of Families with Income Above $100,000 in Akron, OH?
44321 has the Highest Percentage of Families with Income Above $100,000 in Akron, OH with 71.7%.
What is the Percentage of Families with Income Above $100,000 in Akron, OH?
Percentage of Families with Income Above $100,000 in Akron is 22.8%.
What is the Percentage of Families with Income Above $100,000 in Ohio?
Percentage of Families with Income Above $100,000 in Ohio is 42.3%.
What is the Percentage of Families with Income Above $100,000 in the United States?
Percentage of Families with Income Above $100,000 in the United States is 46.1%.