Cortland, NY Map & Demographics
Cortland Map
Cortland Overview
$26,198
PER CAPITA INCOME
$74,406
AVG FAMILY INCOME
$55,042
AVG HOUSEHOLD INCOME
33.0%
WAGE / INCOME GAP [ % ]
67.0¢/ $1
WAGE / INCOME GAP [ $ ]
$10,446
FAMILY INCOME DEFICIT
0.43
INEQUALITY / GINI INDEX
17,574
TOTAL POPULATION
8,408
MALE POPULATION
9,166
FEMALE POPULATION
91.73
MALES / 100 FEMALES
109.02
FEMALES / 100 MALES
27.1
MEDIAN AGE
2.7
AVG FAMILY SIZE
2.1
AVG HOUSEHOLD SIZE
9,303
LABOR FORCE [ PEOPLE ]
60.4%
PERCENT IN LABOR FORCE
6.5%
UNEMPLOYMENT RATE
Cortland Zip Codes
Cortland Area Codes
Income in Cortland
Income Overview in Cortland
Per Capita Income in Cortland is $26,198, while median incomes of families and households are $74,406 and $55,042 respectively.
| Characteristic | Number | Measure |
| Per Capita Income | 17,574 | $26,198 |
| Median Family Income | 3,228 | $74,406 |
| Mean Family Income | 3,228 | $85,863 |
| Median Household Income | 6,934 | $55,042 |
| Mean Household Income | 6,934 | $66,039 |
| Income Deficit | 3,228 | $10,446 |
| Wage / Income Gap (%) | 17,574 | 33.00% |
| Wage / Income Gap ($) | 17,574 | 67.00¢ per $1 |
| Gini / Inequality Index | 17,574 | 0.43 |
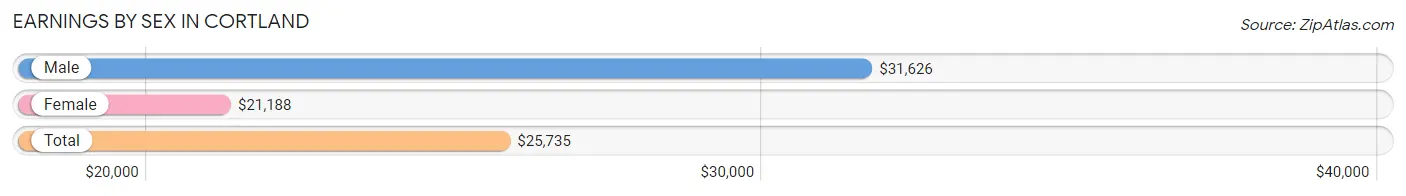
Earnings by Sex in Cortland
Average Earnings in Cortland are $25,735, $31,626 for men and $21,188 for women, a difference of 33.0%.
| Sex | Number | Average Earnings |
| Male | 4,969 (47.8%) | $31,626 |
| Female | 5,415 (52.1%) | $21,188 |
| Total | 10,384 (100.0%) | $25,735 |
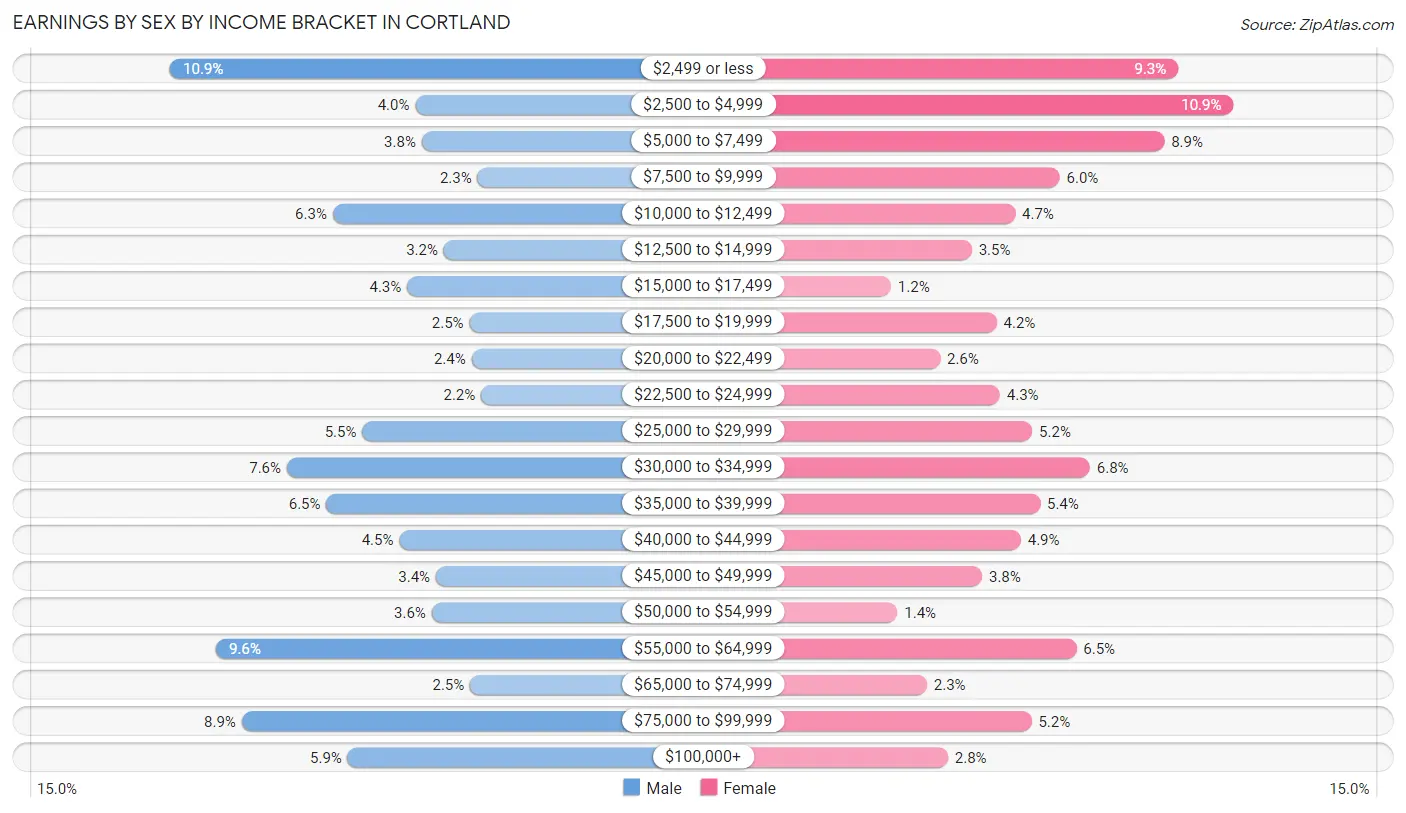
Earnings by Sex by Income Bracket in Cortland
The most common earnings brackets in Cortland are $2,499 or less for men (542 | 10.9%) and $2,500 to $4,999 for women (588 | 10.9%).
| Income | Male | Female |
| $2,499 or less | 542 (10.9%) | 504 (9.3%) |
| $2,500 to $4,999 | 200 (4.0%) | 588 (10.9%) |
| $5,000 to $7,499 | 191 (3.8%) | 483 (8.9%) |
| $7,500 to $9,999 | 113 (2.3%) | 324 (6.0%) |
| $10,000 to $12,499 | 315 (6.3%) | 256 (4.7%) |
| $12,500 to $14,999 | 160 (3.2%) | 190 (3.5%) |
| $15,000 to $17,499 | 211 (4.3%) | 67 (1.2%) |
| $17,500 to $19,999 | 124 (2.5%) | 228 (4.2%) |
| $20,000 to $22,499 | 121 (2.4%) | 142 (2.6%) |
| $22,500 to $24,999 | 108 (2.2%) | 233 (4.3%) |
| $25,000 to $29,999 | 274 (5.5%) | 282 (5.2%) |
| $30,000 to $34,999 | 379 (7.6%) | 370 (6.8%) |
| $35,000 to $39,999 | 324 (6.5%) | 294 (5.4%) |
| $40,000 to $44,999 | 222 (4.5%) | 265 (4.9%) |
| $45,000 to $49,999 | 171 (3.4%) | 206 (3.8%) |
| $50,000 to $54,999 | 177 (3.6%) | 77 (1.4%) |
| $55,000 to $64,999 | 478 (9.6%) | 349 (6.5%) |
| $65,000 to $74,999 | 123 (2.5%) | 122 (2.2%) |
| $75,000 to $99,999 | 442 (8.9%) | 281 (5.2%) |
| $100,000+ | 294 (5.9%) | 154 (2.8%) |
| Total | 4,969 (100.0%) | 5,415 (100.0%) |
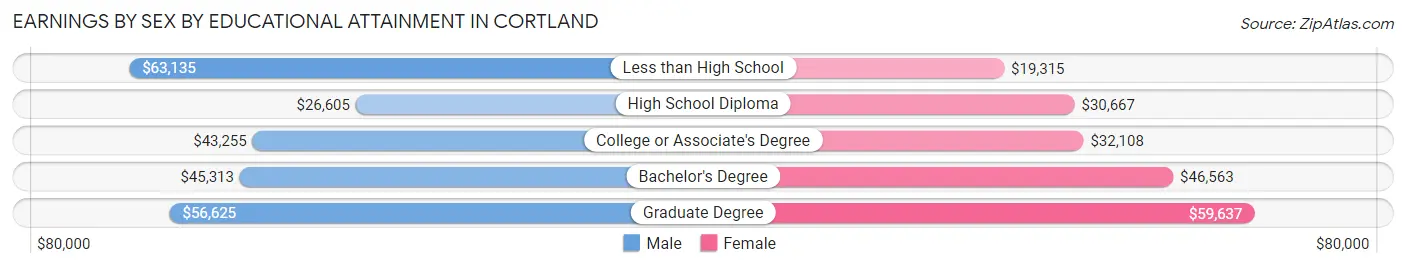
Earnings by Sex by Educational Attainment in Cortland
Average earnings in Cortland are $40,864 for men and $35,598 for women, a difference of 12.9%. Men with an educational attainment of less than high school enjoy the highest average annual earnings of $63,135, while those with high school diploma education earn the least with $26,605. Women with an educational attainment of graduate degree earn the most with the average annual earnings of $59,637, while those with less than high school education have the smallest earnings of $19,315.
| Educational Attainment | Male Income | Female Income |
| Less than High School | $63,135 | $19,315 |
| High School Diploma | $26,605 | $30,667 |
| College or Associate's Degree | $43,255 | $32,108 |
| Bachelor's Degree | $45,313 | $46,563 |
| Graduate Degree | $56,625 | $59,637 |
| Total | $40,864 | $35,598 |
Family Income in Cortland
Family Income Brackets in Cortland
According to the Cortland family income data, there are 671 families falling into the $100,000 to $149,999 income range, which is the most common income bracket and makes up 20.8% of all families. Conversely, the $10,000 to $14,999 income bracket is the least frequent group with only 58 families (1.8%) belonging to this category.
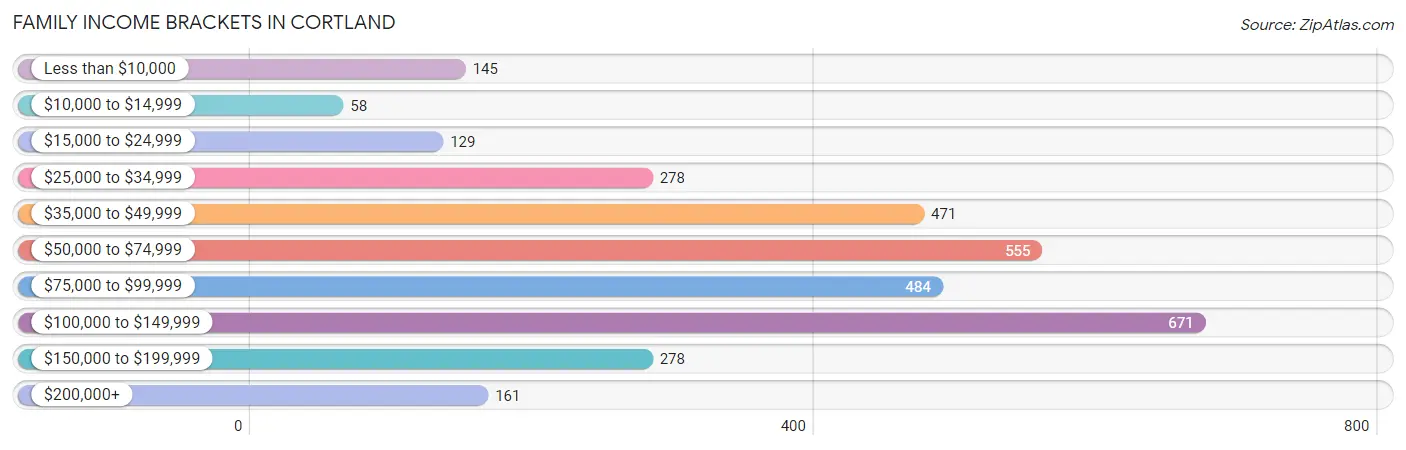
| Income Bracket | # Families | % Families |
| Less than $10,000 | 145 | 4.5% |
| $10,000 to $14,999 | 58 | 1.8% |
| $15,000 to $24,999 | 129 | 4.0% |
| $25,000 to $34,999 | 278 | 8.6% |
| $35,000 to $49,999 | 471 | 14.6% |
| $50,000 to $74,999 | 555 | 17.2% |
| $75,000 to $99,999 | 484 | 15.0% |
| $100,000 to $149,999 | 671 | 20.8% |
| $150,000 to $199,999 | 278 | 8.6% |
| $200,000+ | 161 | 5.0% |
Family Income by Famaliy Size in Cortland
3-person families (687 | 21.3%) account for the highest median family income in Cortland with $106,103 per family, while 3-person families (687 | 21.3%) have the highest median income of $35,368 per family member.
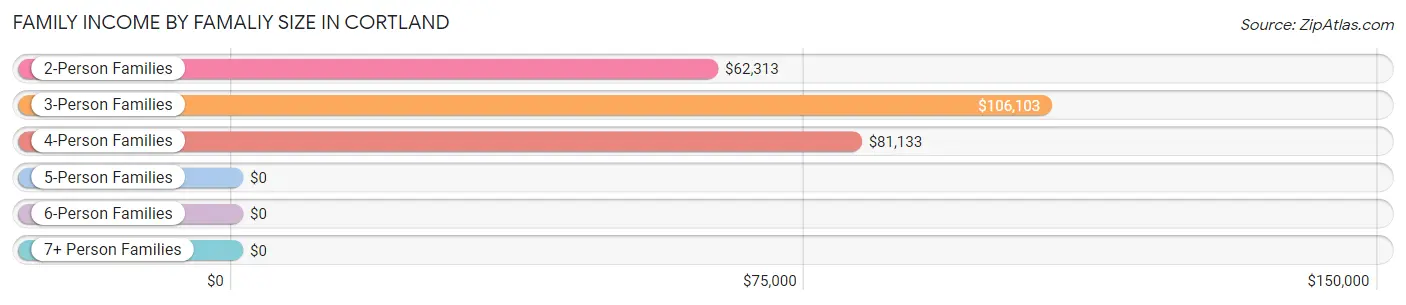
| Income Bracket | # Families | Median Income |
| 2-Person Families | 1,687 (52.3%) | $62,313 |
| 3-Person Families | 687 (21.3%) | $106,103 |
| 4-Person Families | 599 (18.6%) | $81,133 |
| 5-Person Families | 146 (4.5%) | $0 |
| 6-Person Families | 84 (2.6%) | $0 |
| 7+ Person Families | 25 (0.8%) | $0 |
| Total | 3,228 (100.0%) | $74,406 |
Family Income by Number of Earners in Cortland
The median family income in Cortland is $74,406, with families comprising 3+ earners (463) having the highest median family income of $122,244, while families with no earners (384) have the lowest median family income of $35,417, accounting for 14.3% and 11.9% of families, respectively.
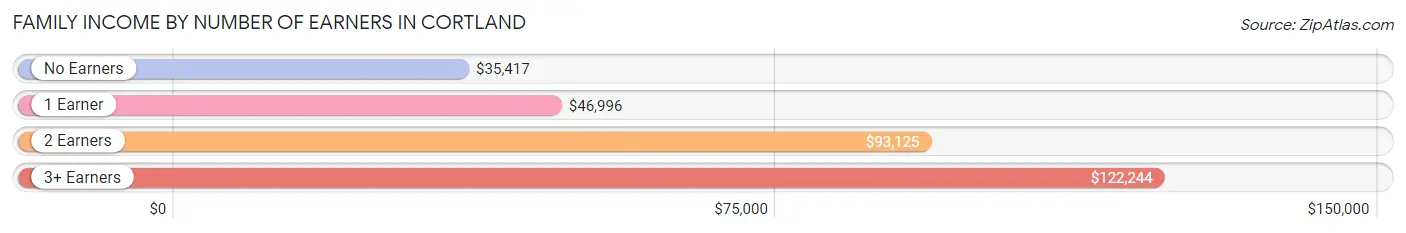
| Number of Earners | # Families | Median Income |
| No Earners | 384 (11.9%) | $35,417 |
| 1 Earner | 1,213 (37.6%) | $46,996 |
| 2 Earners | 1,168 (36.2%) | $93,125 |
| 3+ Earners | 463 (14.3%) | $122,244 |
| Total | 3,228 (100.0%) | $74,406 |
Household Income in Cortland
Household Income Brackets in Cortland
With 1,290 households falling in the category, the $50,000 to $74,999 income range is the most frequent in Cortland, accounting for 18.6% of all households. In contrast, only 201 households (2.9%) fall into the $200,000+ income bracket, making it the least populous group.
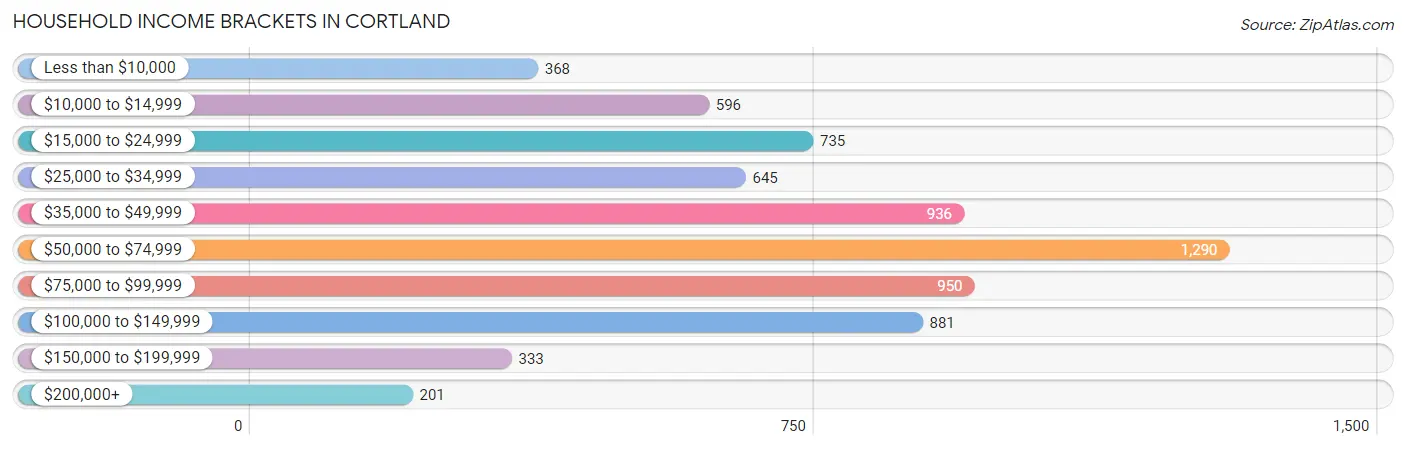
| Income Bracket | # Households | % Households |
| Less than $10,000 | 368 | 5.3% |
| $10,000 to $14,999 | 596 | 8.6% |
| $15,000 to $24,999 | 735 | 10.6% |
| $25,000 to $34,999 | 645 | 9.3% |
| $35,000 to $49,999 | 936 | 13.5% |
| $50,000 to $74,999 | 1,290 | 18.6% |
| $75,000 to $99,999 | 950 | 13.7% |
| $100,000 to $149,999 | 881 | 12.7% |
| $150,000 to $199,999 | 333 | 4.8% |
| $200,000+ | 201 | 2.9% |
Household Income by Householder Age in Cortland
The median household income in Cortland is $55,042, with the highest median household income of $66,500 found in the 45 to 64 years age bracket for the primary householder. A total of 2,188 households (31.6%) fall into this category. Meanwhile, the 65+ years age bracket for the primary householder has the lowest median household income of $46,645, with 1,489 households (21.5%) in this group.
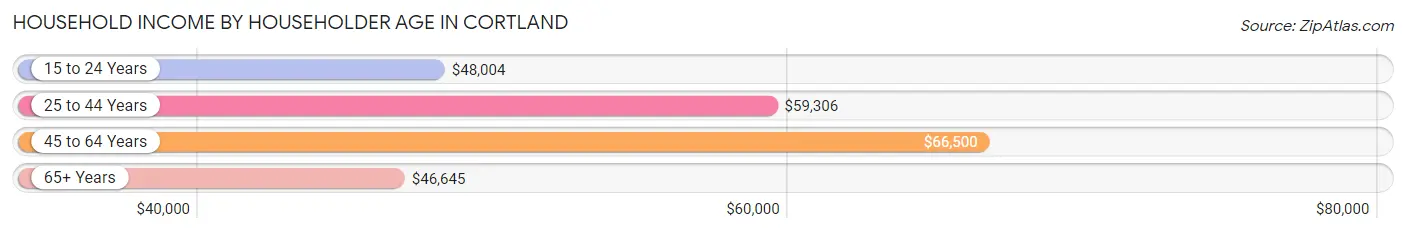
| Income Bracket | # Households | Median Income |
| 15 to 24 Years | 1,165 (16.8%) | $48,004 |
| 25 to 44 Years | 2,092 (30.2%) | $59,306 |
| 45 to 64 Years | 2,188 (31.6%) | $66,500 |
| 65+ Years | 1,489 (21.5%) | $46,645 |
| Total | 6,934 (100.0%) | $55,042 |
Poverty in Cortland
Income Below Poverty by Sex and Age in Cortland
With 20.6% poverty level for males and 23.8% for females among the residents of Cortland, 18 to 24 year old males and 15 year old females are the most vulnerable to poverty, with 698 males (45.9%) and 29 females (82.9%) in their respective age groups living below the poverty level.
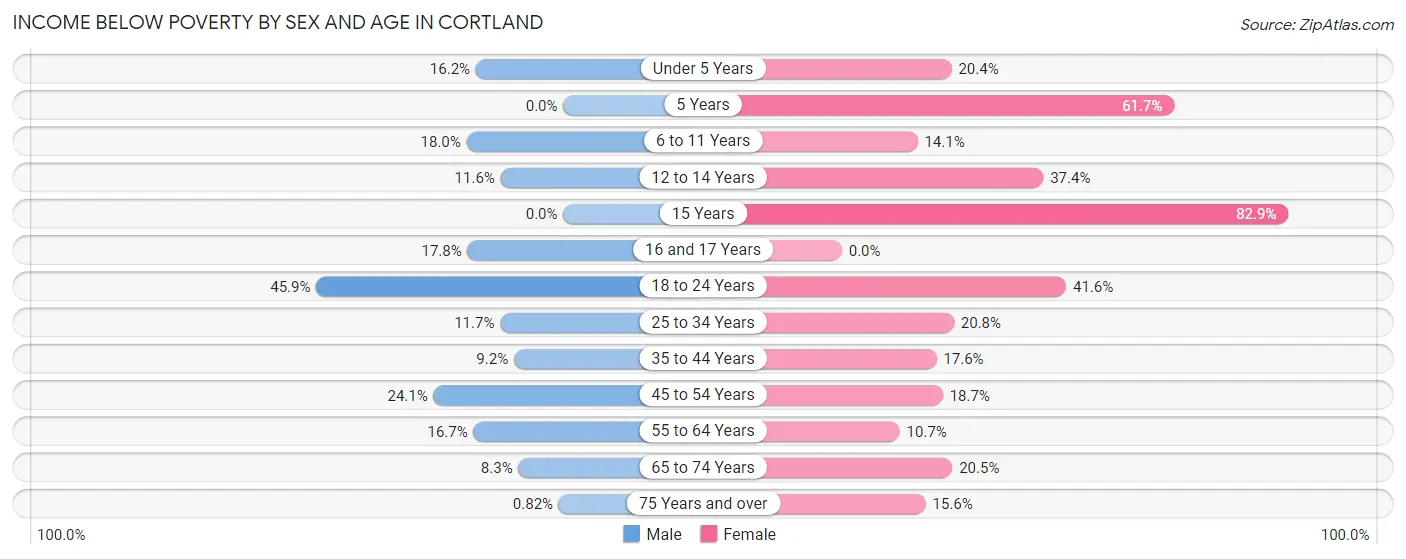
| Age Bracket | Male | Female |
| Under 5 Years | 50 (16.2%) | 57 (20.4%) |
| 5 Years | 0 (0.0%) | 29 (61.7%) |
| 6 to 11 Years | 95 (18.0%) | 51 (14.1%) |
| 12 to 14 Years | 17 (11.6%) | 86 (37.4%) |
| 15 Years | 0 (0.0%) | 29 (82.9%) |
| 16 and 17 Years | 24 (17.8%) | 0 (0.0%) |
| 18 to 24 Years | 698 (45.9%) | 694 (41.6%) |
| 25 to 34 Years | 125 (11.7%) | 251 (20.8%) |
| 35 to 44 Years | 80 (9.2%) | 110 (17.6%) |
| 45 to 54 Years | 179 (24.1%) | 142 (18.7%) |
| 55 to 64 Years | 151 (16.7%) | 92 (10.7%) |
| 65 to 74 Years | 48 (8.3%) | 147 (20.5%) |
| 75 Years and over | 2 (0.8%) | 77 (15.6%) |
| Total | 1,469 (20.6%) | 1,765 (23.8%) |
Income Above Poverty by Sex and Age in Cortland
According to the poverty statistics in Cortland, males aged 5 years and females aged 16 and 17 years are the age groups that are most secure financially, with 100.0% of males and 100.0% of females in these age groups living above the poverty line.
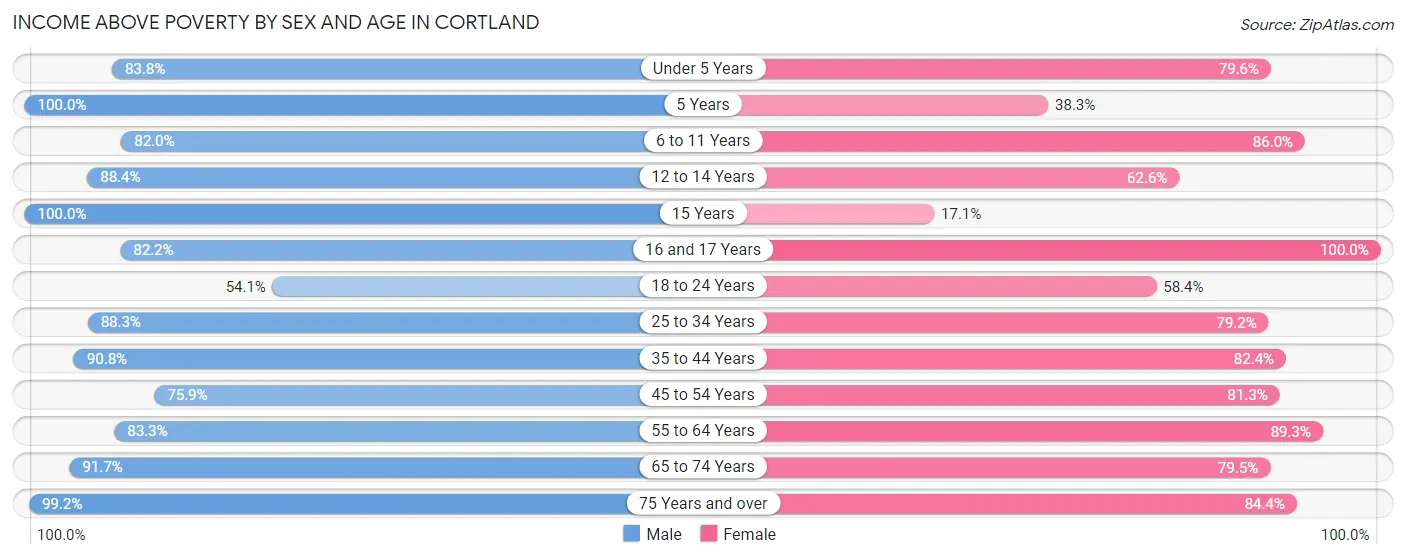
| Age Bracket | Male | Female |
| Under 5 Years | 258 (83.8%) | 223 (79.6%) |
| 5 Years | 60 (100.0%) | 18 (38.3%) |
| 6 to 11 Years | 434 (82.0%) | 312 (86.0%) |
| 12 to 14 Years | 129 (88.4%) | 144 (62.6%) |
| 15 Years | 35 (100.0%) | 6 (17.1%) |
| 16 and 17 Years | 111 (82.2%) | 136 (100.0%) |
| 18 to 24 Years | 824 (54.1%) | 973 (58.4%) |
| 25 to 34 Years | 942 (88.3%) | 956 (79.2%) |
| 35 to 44 Years | 793 (90.8%) | 516 (82.4%) |
| 45 to 54 Years | 564 (75.9%) | 616 (81.3%) |
| 55 to 64 Years | 755 (83.3%) | 765 (89.3%) |
| 65 to 74 Years | 528 (91.7%) | 570 (79.5%) |
| 75 Years and over | 241 (99.2%) | 418 (84.4%) |
| Total | 5,674 (79.4%) | 5,653 (76.2%) |
Income Below Poverty Among Married-Couple Families in Cortland
The poverty statistics for married-couple families in Cortland show that 2.2% or 44 of the total 2,000 families live below the poverty line. Families with no children have the highest poverty rate of 2.6%, comprising of 28 families. On the other hand, families with 3 or 4 children have the lowest poverty rate of 0.0%, which includes 0 families.
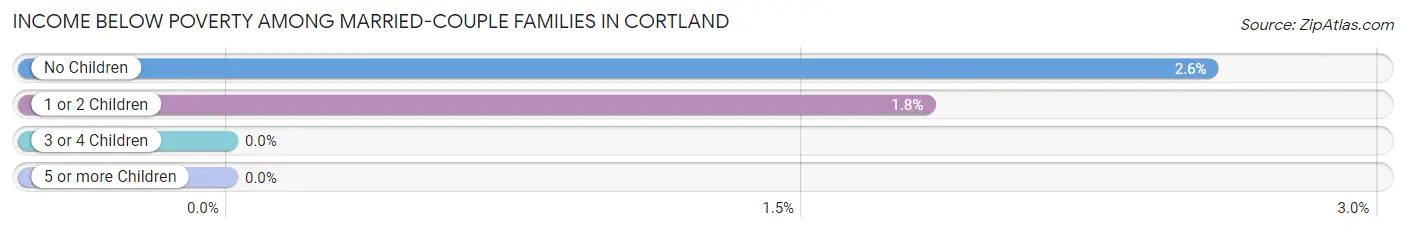
| Children | Above Poverty | Below Poverty |
| No Children | 1,067 (97.4%) | 28 (2.6%) |
| 1 or 2 Children | 862 (98.2%) | 16 (1.8%) |
| 3 or 4 Children | 27 (100.0%) | 0 (0.0%) |
| 5 or more Children | 0 (0.0%) | 0 (0.0%) |
| Total | 1,956 (97.8%) | 44 (2.2%) |
Income Below Poverty Among Single-Parent Households in Cortland
According to the poverty data in Cortland, 11.2% or 44 single-father households and 32.1% or 268 single-mother households are living below the poverty line. Among single-father households, those with 3 or 4 children have the highest poverty rate, with 15 households (35.7%) experiencing poverty. Likewise, among single-mother households, those with 5 or more children have the highest poverty rate, with 24 households (100.0%) falling below the poverty line.
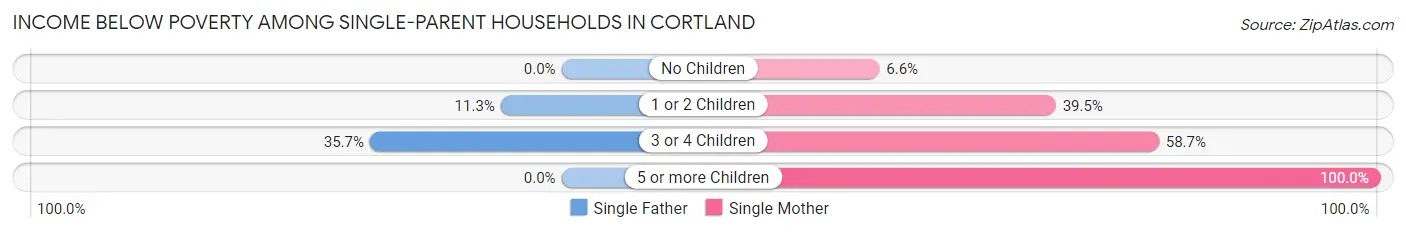
| Children | Single Father | Single Mother |
| No Children | 0 (0.0%) | 19 (6.6%) |
| 1 or 2 Children | 29 (11.3%) | 171 (39.5%) |
| 3 or 4 Children | 15 (35.7%) | 54 (58.7%) |
| 5 or more Children | 0 (0.0%) | 24 (100.0%) |
| Total | 44 (11.2%) | 268 (32.1%) |
Income Below Poverty Among Married-Couple vs Single-Parent Households in Cortland
The poverty data for Cortland shows that 44 of the married-couple family households (2.2%) and 312 of the single-parent households (25.4%) are living below the poverty level. Within the married-couple family households, those with no children have the highest poverty rate, with 28 households (2.6%) falling below the poverty line. Among the single-parent households, those with 5 or more children have the highest poverty rate, with 24 household (100.0%) living below poverty.
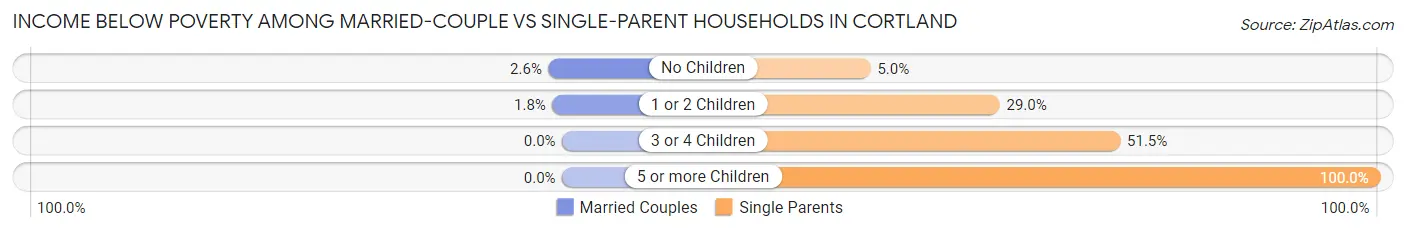
| Children | Married-Couple Families | Single-Parent Households |
| No Children | 28 (2.6%) | 19 (5.0%) |
| 1 or 2 Children | 16 (1.8%) | 200 (29.0%) |
| 3 or 4 Children | 0 (0.0%) | 69 (51.5%) |
| 5 or more Children | 0 (0.0%) | 24 (100.0%) |
| Total | 44 (2.2%) | 312 (25.4%) |
Race in Cortland
The most populous races in Cortland are White / Caucasian (15,647 | 89.0%), Hispanic or Latino (785 | 4.5%), and Two or more Races (706 | 4.0%).
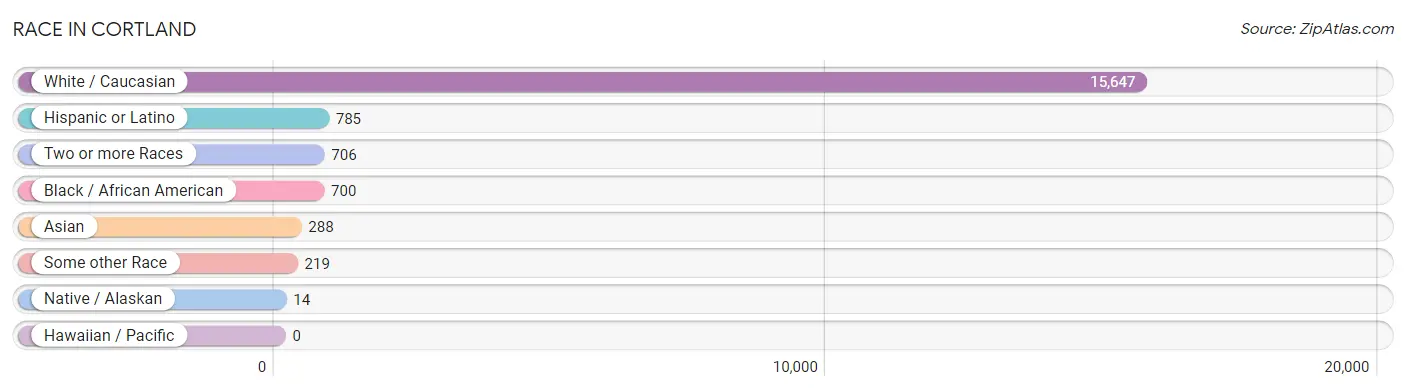
| Race | # Population | % Population |
| Asian | 288 | 1.6% |
| Black / African American | 700 | 4.0% |
| Hawaiian / Pacific | 0 | 0.0% |
| Hispanic or Latino | 785 | 4.5% |
| Native / Alaskan | 14 | 0.1% |
| White / Caucasian | 15,647 | 89.0% |
| Two or more Races | 706 | 4.0% |
| Some other Race | 219 | 1.3% |
| Total | 17,574 | 100.0% |
Ancestry in Cortland
The most populous ancestries reported in Cortland are Irish (3,015 | 17.2%), English (2,579 | 14.7%), German (2,216 | 12.6%), Italian (1,583 | 9.0%), and American (1,178 | 6.7%), together accounting for 60.2% of all Cortland residents.
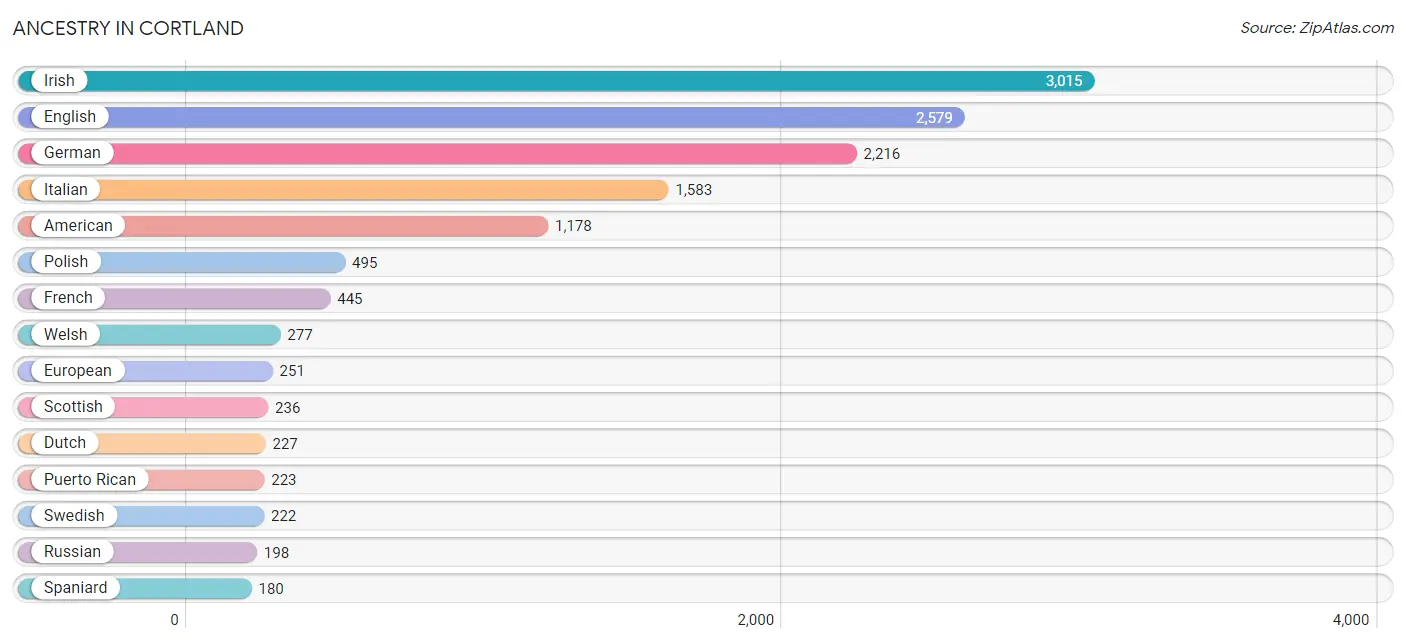
| Ancestry | # Population | % Population |
| African | 16 | 0.1% |
| American | 1,178 | 6.7% |
| Arab | 104 | 0.6% |
| Austrian | 13 | 0.1% |
| Barbadian | 29 | 0.2% |
| Bhutanese | 81 | 0.5% |
| Blackfeet | 2 | 0.0% |
| Brazilian | 26 | 0.2% |
| British | 144 | 0.8% |
| Canadian | 4 | 0.0% |
| Central American | 35 | 0.2% |
| Central American Indian | 14 | 0.1% |
| Cherokee | 100 | 0.6% |
| Colombian | 38 | 0.2% |
| Croatian | 8 | 0.1% |
| Cuban | 14 | 0.1% |
| Czech | 107 | 0.6% |
| Czechoslovakian | 7 | 0.0% |
| Dominican | 58 | 0.3% |
| Dutch | 227 | 1.3% |
| Eastern European | 71 | 0.4% |
| Ecuadorian | 4 | 0.0% |
| English | 2,579 | 14.7% |
| Ethiopian | 20 | 0.1% |
| European | 251 | 1.4% |
| Finnish | 11 | 0.1% |
| French | 445 | 2.5% |
| French Canadian | 104 | 0.6% |
| German | 2,216 | 12.6% |
| Ghanaian | 8 | 0.1% |
| Greek | 72 | 0.4% |
| Guatemalan | 14 | 0.1% |
| Haitian | 2 | 0.0% |
| Hungarian | 28 | 0.2% |
| Indian (Asian) | 149 | 0.9% |
| Iranian | 10 | 0.1% |
| Irish | 3,015 | 17.2% |
| Iroquois | 3 | 0.0% |
| Italian | 1,583 | 9.0% |
| Jamaican | 8 | 0.1% |
| Jordanian | 5 | 0.0% |
| Korean | 43 | 0.2% |
| Lebanese | 7 | 0.0% |
| Lithuanian | 60 | 0.3% |
| Luxembourger | 7 | 0.0% |
| Malaysian | 15 | 0.1% |
| Mexican | 145 | 0.8% |
| Nigerian | 30 | 0.2% |
| Northern European | 6 | 0.0% |
| Norwegian | 52 | 0.3% |
| Pennsylvania German | 59 | 0.3% |
| Polish | 495 | 2.8% |
| Puerto Rican | 223 | 1.3% |
| Romanian | 10 | 0.1% |
| Russian | 198 | 1.1% |
| Salvadoran | 14 | 0.1% |
| Scandinavian | 21 | 0.1% |
| Scotch-Irish | 105 | 0.6% |
| Scottish | 236 | 1.3% |
| Slovak | 10 | 0.1% |
| Slovene | 40 | 0.2% |
| South American | 42 | 0.2% |
| Spaniard | 180 | 1.0% |
| Spanish | 11 | 0.1% |
| Sri Lankan | 6 | 0.0% |
| Subsaharan African | 66 | 0.4% |
| Swedish | 222 | 1.3% |
| Swiss | 39 | 0.2% |
| Syrian | 92 | 0.5% |
| Thai | 19 | 0.1% |
| Turkish | 15 | 0.1% |
| Ukrainian | 54 | 0.3% |
| Welsh | 277 | 1.6% |
| West Indian | 56 | 0.3% |
| Yugoslavian | 18 | 0.1% | View All 75 Rows |
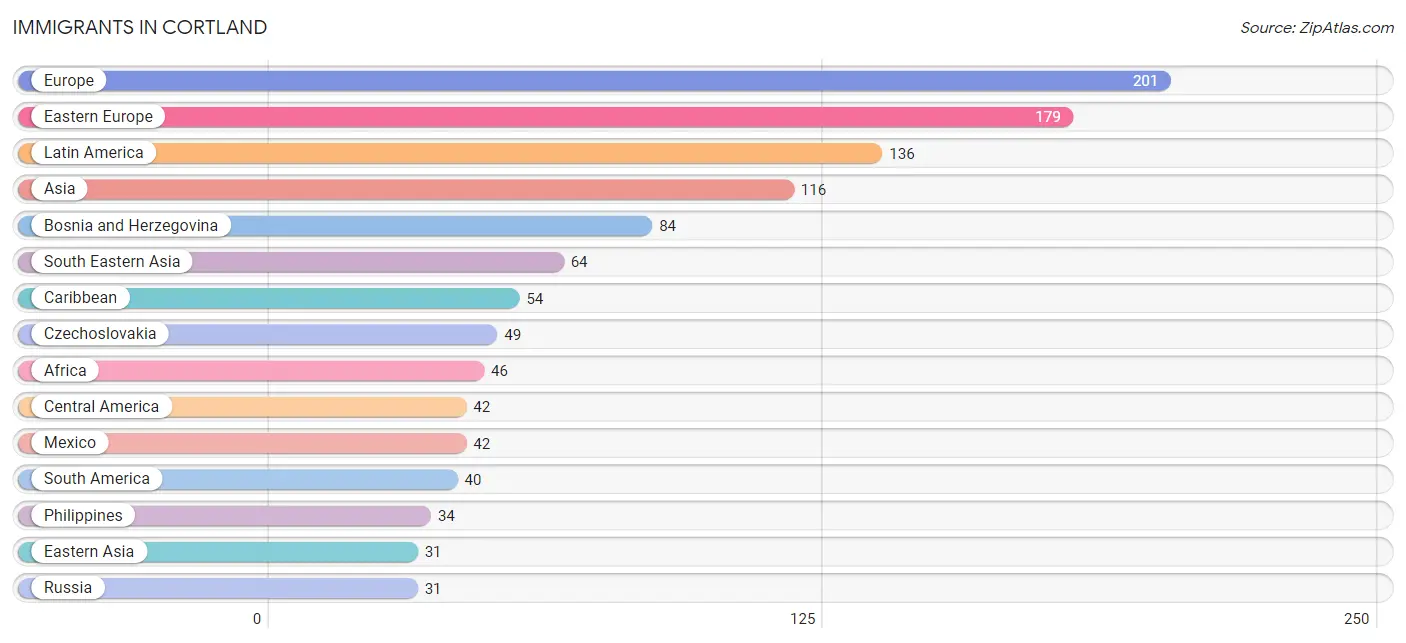
Immigrants in Cortland
The most numerous immigrant groups reported in Cortland came from Europe (201 | 1.1%), Eastern Europe (179 | 1.0%), Latin America (136 | 0.8%), Asia (116 | 0.7%), and Bosnia and Herzegovina (84 | 0.5%), together accounting for 4.1% of all Cortland residents.
| Immigration Origin | # Population | % Population |
| Africa | 46 | 0.3% |
| Asia | 116 | 0.7% |
| Australia | 6 | 0.0% |
| Barbados | 29 | 0.2% |
| Bosnia and Herzegovina | 84 | 0.5% |
| Brazil | 24 | 0.1% |
| Canada | 7 | 0.0% |
| Caribbean | 54 | 0.3% |
| Central America | 42 | 0.2% |
| China | 18 | 0.1% |
| Czechoslovakia | 49 | 0.3% |
| Dominican Republic | 5 | 0.0% |
| Eastern Africa | 20 | 0.1% |
| Eastern Asia | 31 | 0.2% |
| Eastern Europe | 179 | 1.0% |
| Ecuador | 9 | 0.1% |
| England | 8 | 0.1% |
| Ethiopia | 20 | 0.1% |
| Europe | 201 | 1.1% |
| France | 5 | 0.0% |
| Germany | 9 | 0.1% |
| Ghana | 7 | 0.0% |
| Haiti | 15 | 0.1% |
| India | 7 | 0.0% |
| Jamaica | 5 | 0.0% |
| Japan | 13 | 0.1% |
| Jordan | 5 | 0.0% |
| Laos | 15 | 0.1% |
| Latin America | 136 | 0.8% |
| Mexico | 42 | 0.2% |
| Nigeria | 19 | 0.1% |
| Northern Europe | 8 | 0.1% |
| Oceania | 6 | 0.0% |
| Peru | 7 | 0.0% |
| Philippines | 34 | 0.2% |
| Russia | 31 | 0.2% |
| South America | 40 | 0.2% |
| South Central Asia | 7 | 0.0% |
| South Eastern Asia | 64 | 0.4% |
| Taiwan | 8 | 0.1% |
| Thailand | 15 | 0.1% |
| Turkey | 9 | 0.1% |
| Ukraine | 15 | 0.1% |
| Western Africa | 26 | 0.2% |
| Western Asia | 14 | 0.1% |
| Western Europe | 14 | 0.1% | View All 46 Rows |
Sex and Age in Cortland
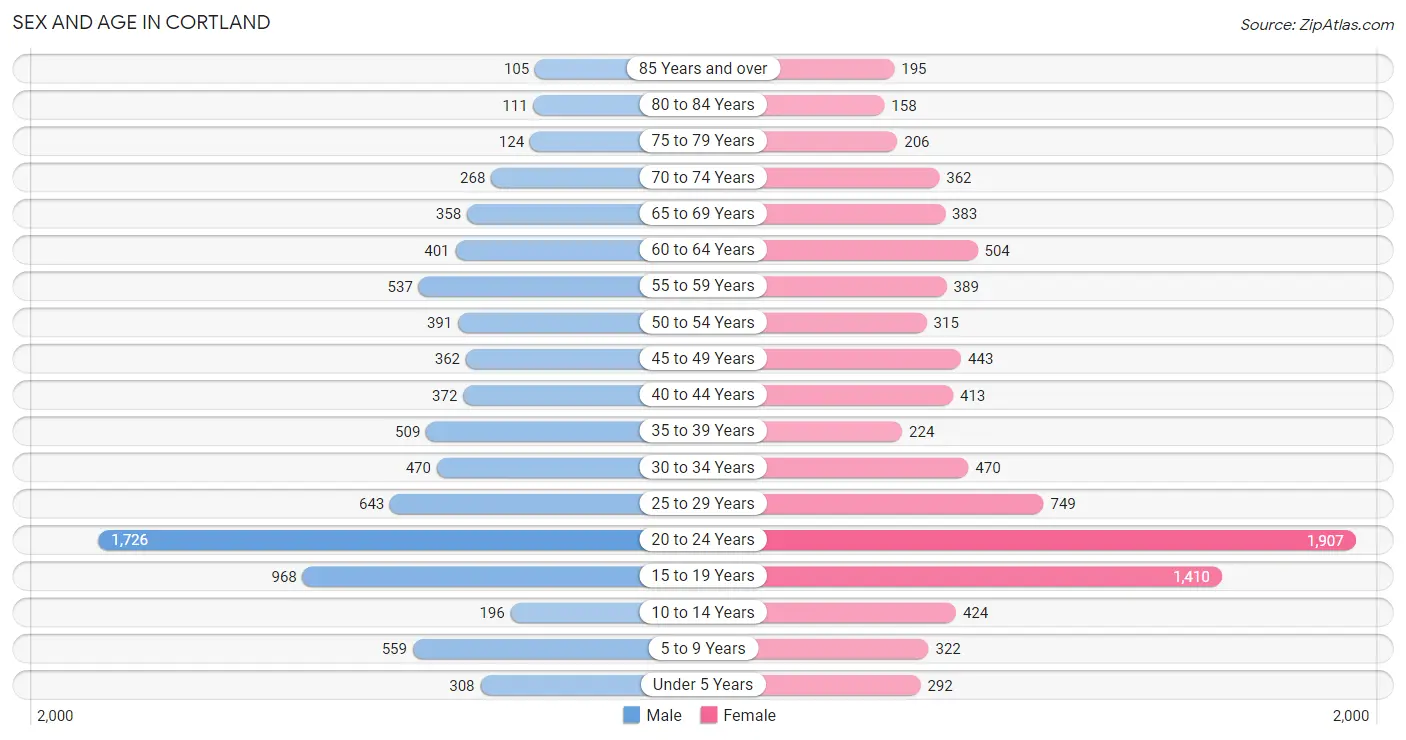
Sex and Age in Cortland
The most populous age groups in Cortland are 20 to 24 Years (1,726 | 20.5%) for men and 20 to 24 Years (1,907 | 20.8%) for women.
| Age Bracket | Male | Female |
| Under 5 Years | 308 (3.7%) | 292 (3.2%) |
| 5 to 9 Years | 559 (6.7%) | 322 (3.5%) |
| 10 to 14 Years | 196 (2.3%) | 424 (4.6%) |
| 15 to 19 Years | 968 (11.5%) | 1,410 (15.4%) |
| 20 to 24 Years | 1,726 (20.5%) | 1,907 (20.8%) |
| 25 to 29 Years | 643 (7.6%) | 749 (8.2%) |
| 30 to 34 Years | 470 (5.6%) | 470 (5.1%) |
| 35 to 39 Years | 509 (6.0%) | 224 (2.4%) |
| 40 to 44 Years | 372 (4.4%) | 413 (4.5%) |
| 45 to 49 Years | 362 (4.3%) | 443 (4.8%) |
| 50 to 54 Years | 391 (4.6%) | 315 (3.4%) |
| 55 to 59 Years | 537 (6.4%) | 389 (4.2%) |
| 60 to 64 Years | 401 (4.8%) | 504 (5.5%) |
| 65 to 69 Years | 358 (4.3%) | 383 (4.2%) |
| 70 to 74 Years | 268 (3.2%) | 362 (4.0%) |
| 75 to 79 Years | 124 (1.5%) | 206 (2.2%) |
| 80 to 84 Years | 111 (1.3%) | 158 (1.7%) |
| 85 Years and over | 105 (1.3%) | 195 (2.1%) |
| Total | 8,408 (100.0%) | 9,166 (100.0%) |
Families and Households in Cortland
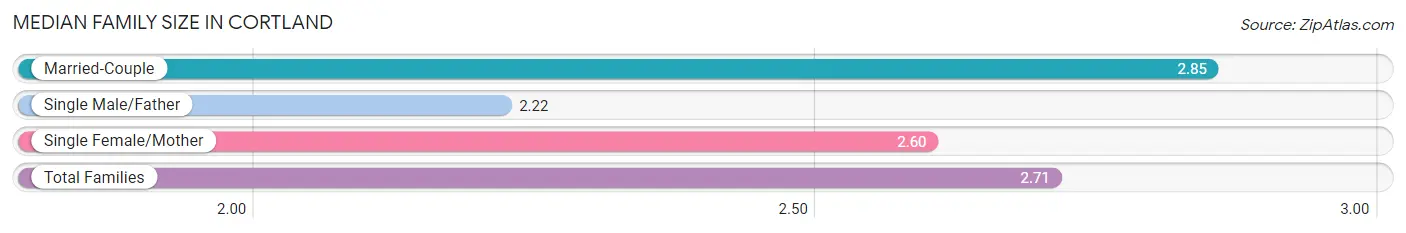
Median Family Size in Cortland
The median family size in Cortland is 2.71 persons per family, with married-couple families (2,000 | 62.0%) accounting for the largest median family size of 2.85 persons per family. On the other hand, single male/father families (393 | 12.2%) represent the smallest median family size with 2.22 persons per family.
| Family Type | # Families | Family Size |
| Married-Couple | 2,000 (62.0%) | 2.85 |
| Single Male/Father | 393 (12.2%) | 2.22 |
| Single Female/Mother | 835 (25.9%) | 2.60 |
| Total Families | 3,228 (100.0%) | 2.71 |
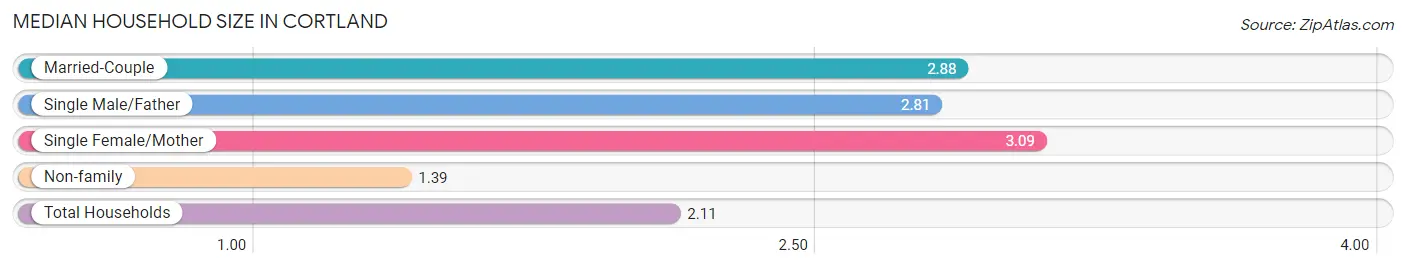
Median Household Size in Cortland
The median household size in Cortland is 2.11 persons per household, with single female/mother households (835 | 12.0%) accounting for the largest median household size of 3.09 persons per household. non-family households (3,706 | 53.4%) represent the smallest median household size with 1.39 persons per household.
| Household Type | # Households | Household Size |
| Married-Couple | 2,000 (28.8%) | 2.88 |
| Single Male/Father | 393 (5.7%) | 2.81 |
| Single Female/Mother | 835 (12.0%) | 3.09 |
| Non-family | 3,706 (53.4%) | 1.39 |
| Total Households | 6,934 (100.0%) | 2.11 |
Household Size by Marriage Status in Cortland
Out of a total of 6,934 households in Cortland, 3,228 (46.6%) are family households, while 3,706 (53.4%) are nonfamily households. The most numerous type of family households are 2-person households, comprising 1,386, and the most common type of nonfamily households are 1-person households, comprising 2,591.
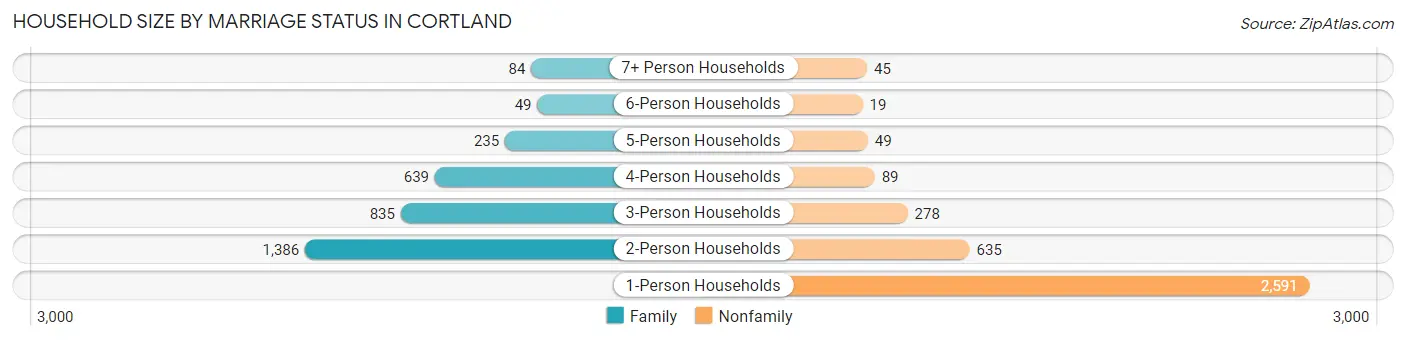
| Household Size | Family Households | Nonfamily Households |
| 1-Person Households | - | 2,591 (37.4%) |
| 2-Person Households | 1,386 (20.0%) | 635 (9.2%) |
| 3-Person Households | 835 (12.0%) | 278 (4.0%) |
| 4-Person Households | 639 (9.2%) | 89 (1.3%) |
| 5-Person Households | 235 (3.4%) | 49 (0.7%) |
| 6-Person Households | 49 (0.7%) | 19 (0.3%) |
| 7+ Person Households | 84 (1.2%) | 45 (0.6%) |
| Total | 3,228 (46.6%) | 3,706 (53.4%) |
Female Fertility in Cortland
Fertility by Age in Cortland
Average fertility rate in Cortland is 26.0 births per 1,000 women. Women in the age bracket of 35 to 50 years have the highest fertility rate with 36.0 births per 1,000 women. Women in the age bracket of 20 to 34 years acount for 73.3% of all women with births.
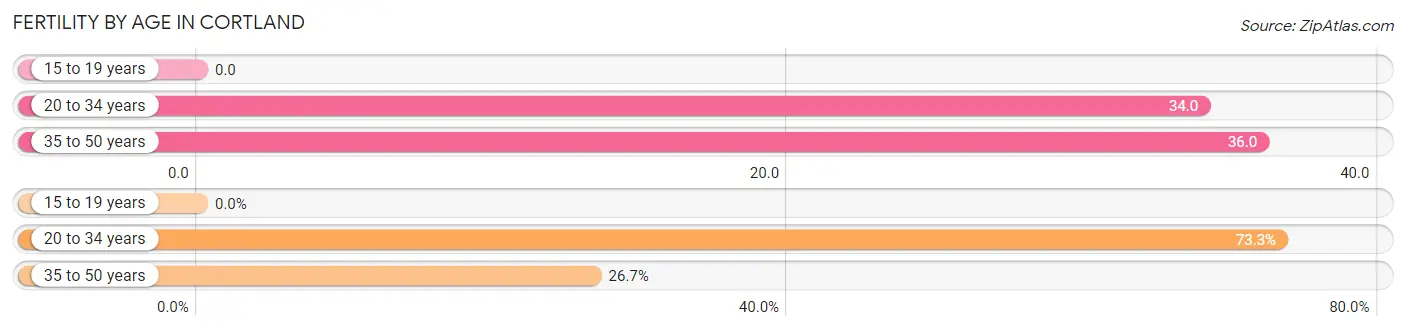
| Age Bracket | Women with Births | Births / 1,000 Women |
| 15 to 19 years | 0 (0.0%) | 0.0 |
| 20 to 34 years | 107 (73.3%) | 34.0 |
| 35 to 50 years | 39 (26.7%) | 36.0 |
| Total | 146 (100.0%) | 26.0 |
Fertility by Age by Marriage Status in Cortland
61.6% of women with births (146) in Cortland are married. The highest percentage of unmarried women with births falls into 20 to 34 years age bracket with 52.3% of them unmarried at the time of birth, while the lowest percentage of unmarried women with births belong to 35 to 50 years age bracket with 0.0% of them unmarried.
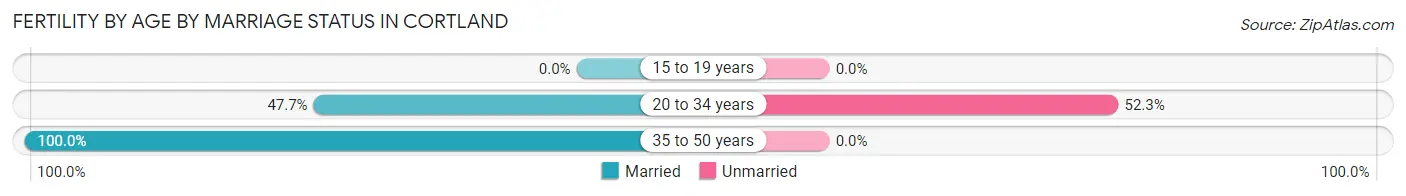
| Age Bracket | Married | Unmarried |
| 15 to 19 years | 0 (0.0%) | 0 (0.0%) |
| 20 to 34 years | 51 (47.7%) | 56 (52.3%) |
| 35 to 50 years | 39 (100.0%) | 0 (0.0%) |
| Total | 90 (61.6%) | 56 (38.4%) |
Fertility by Education in Cortland
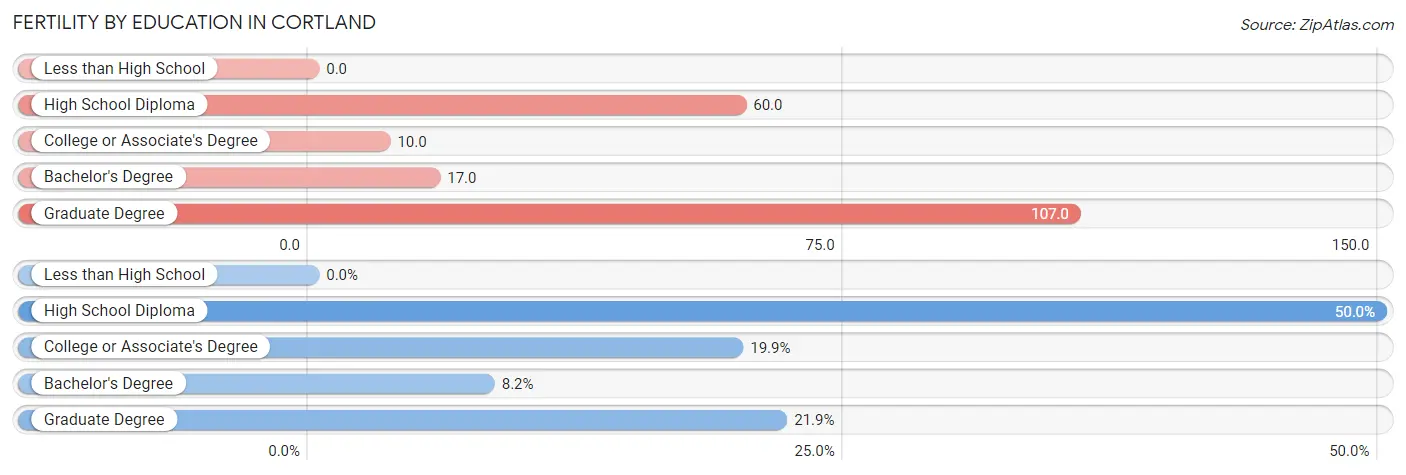
| Educational Attainment | Women with Births | Births / 1,000 Women |
| Less than High School | 0 (0.0%) | 0.0 |
| High School Diploma | 73 (50.0%) | 60.0 |
| College or Associate's Degree | 29 (19.9%) | 10.0 |
| Bachelor's Degree | 12 (8.2%) | 17.0 |
| Graduate Degree | 32 (21.9%) | 107.0 |
| Total | 146 (100.0%) | 26.0 |
Fertility by Education by Marriage Status in Cortland
38.4% of women with births in Cortland are unmarried. Women with the educational attainment of bachelor's degree are most likely to be married with 100.0% of them married at childbirth, while women with the educational attainment of high school diploma are least likely to be married with 65.7% of them unmarried at childbirth.
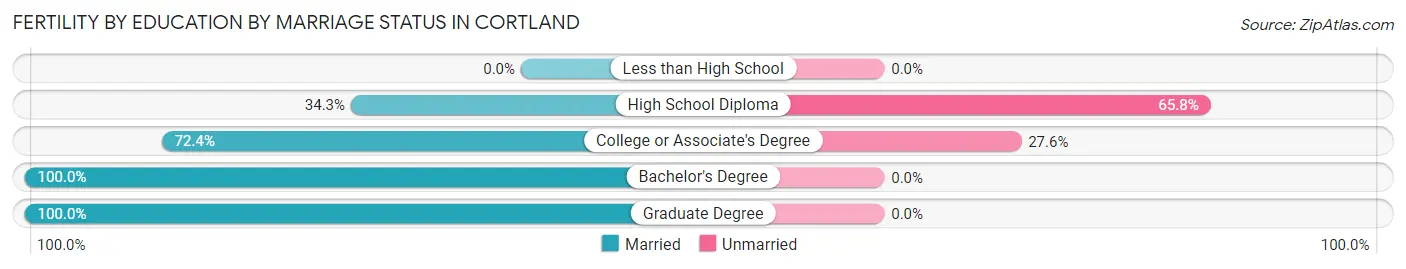
| Educational Attainment | Married | Unmarried |
| Less than High School | 0 (0.0%) | 0 (0.0%) |
| High School Diploma | 25 (34.3%) | 48 (65.7%) |
| College or Associate's Degree | 21 (72.4%) | 8 (27.6%) |
| Bachelor's Degree | 12 (100.0%) | 0 (0.0%) |
| Graduate Degree | 32 (100.0%) | 0 (0.0%) |
| Total | 90 (61.6%) | 56 (38.4%) |
Employment Characteristics in Cortland
Employment by Class of Employer in Cortland
Among the 8,529 employed individuals in Cortland, private company employees (5,722 | 67.1%), not-for-profit organizations (1,135 | 13.3%), and local government employees (768 | 9.0%) make up the most common classes of employment.
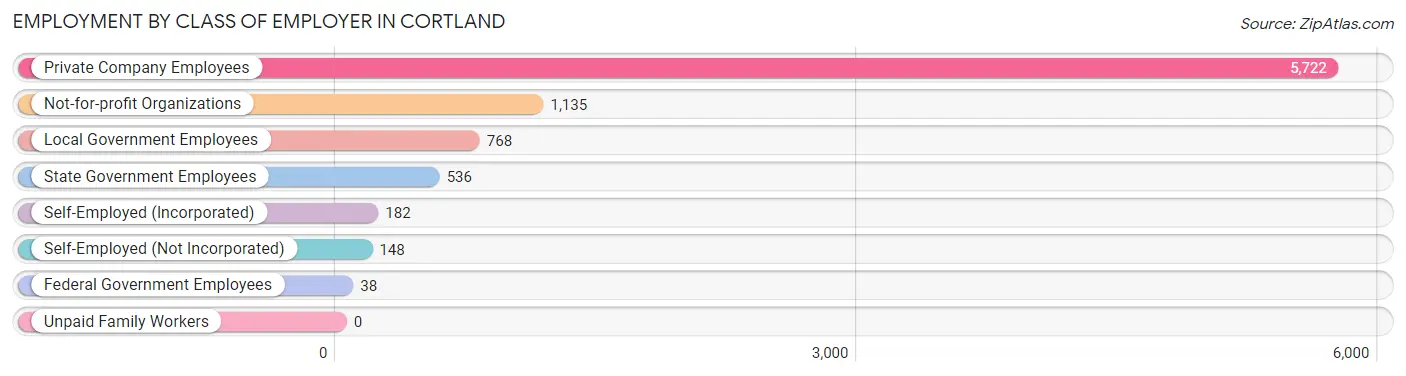
| Employer Class | # Employees | % Employees |
| Private Company Employees | 5,722 | 67.1% |
| Self-Employed (Incorporated) | 182 | 2.1% |
| Self-Employed (Not Incorporated) | 148 | 1.7% |
| Not-for-profit Organizations | 1,135 | 13.3% |
| Local Government Employees | 768 | 9.0% |
| State Government Employees | 536 | 6.3% |
| Federal Government Employees | 38 | 0.4% |
| Unpaid Family Workers | 0 | 0.0% |
| Total | 8,529 | 100.0% |
Employment Status by Age in Cortland
According to the labor force statistics for Cortland, out of the total population over 16 years of age (15,403), 60.4% or 9,303 individuals are in the labor force, with 6.5% or 605 of them unemployed. The age group with the highest labor force participation rate is 25 to 29 years, with 87.5% or 1,218 individuals in the labor force. Within the labor force, the 20 to 24 years age range has the highest percentage of unemployed individuals, with 15.8% or 401 of them being unemployed.
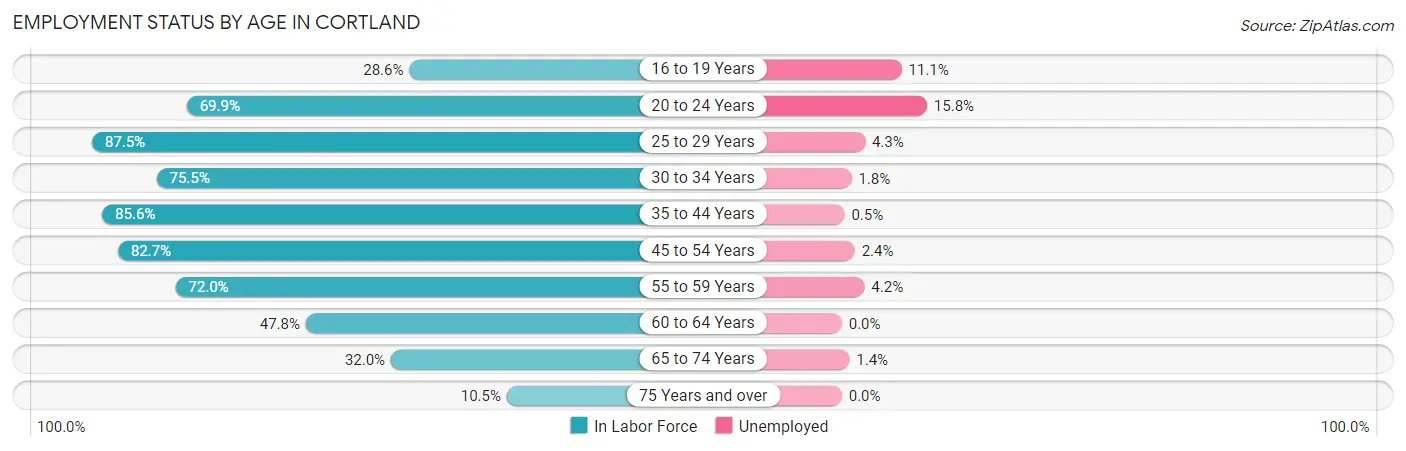
| Age Bracket | In Labor Force | Unemployed |
| 16 to 19 Years | 660 (28.6%) | 73 (11.1%) |
| 20 to 24 Years | 2,539 (69.9%) | 401 (15.8%) |
| 25 to 29 Years | 1,218 (87.5%) | 52 (4.3%) |
| 30 to 34 Years | 710 (75.5%) | 13 (1.8%) |
| 35 to 44 Years | 1,299 (85.6%) | 6 (0.5%) |
| 45 to 54 Years | 1,250 (82.7%) | 30 (2.4%) |
| 55 to 59 Years | 667 (72.0%) | 28 (4.2%) |
| 60 to 64 Years | 433 (47.8%) | 0 (0.0%) |
| 65 to 74 Years | 439 (32.0%) | 6 (1.4%) |
| 75 Years and over | 94 (10.5%) | 0 (0.0%) |
| Total | 9,303 (60.4%) | 605 (6.5%) |
Employment Status by Educational Attainment in Cortland
According to labor force statistics for Cortland, 77.5% of individuals (5,574) out of the total population between 25 and 64 years of age (7,192) are in the labor force, with 2.3% or 128 of them being unemployed. The group with the highest labor force participation rate are those with the educational attainment of bachelor's degree or higher, with 89.8% or 1,663 individuals in the labor force. Within the labor force, individuals with college / associate degree education have the highest percentage of unemployment, with 3.6% or 79 of them being unemployed.
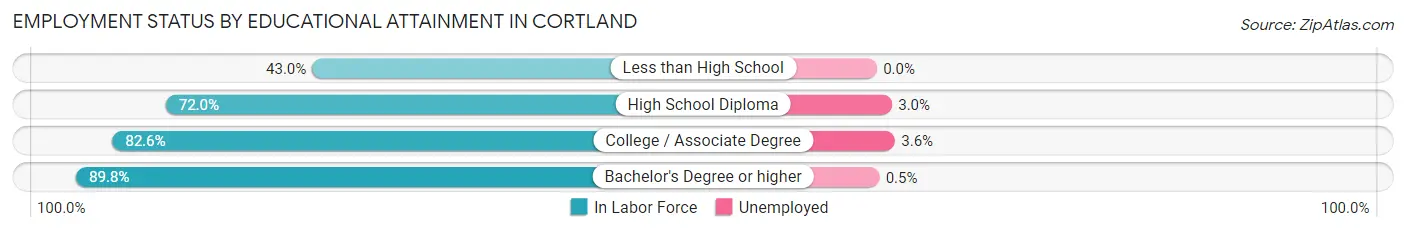
| Educational Attainment | In Labor Force | Unemployed |
| Less than High School | 317 (43.0%) | 0 (0.0%) |
| High School Diploma | 1,398 (72.0%) | 58 (3.0%) |
| College / Associate Degree | 2,198 (82.6%) | 96 (3.6%) |
| Bachelor's Degree or higher | 1,663 (89.8%) | 9 (0.5%) |
| Total | 5,574 (77.5%) | 165 (2.3%) |
Employment Occupations by Sex in Cortland
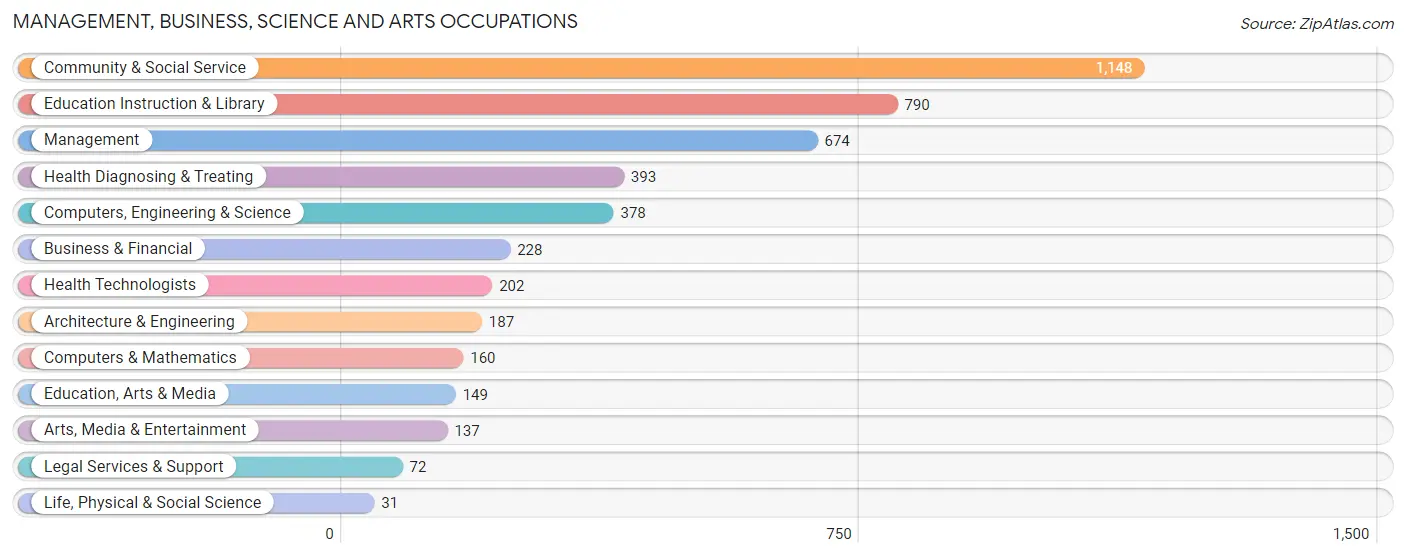
Management, Business, Science and Arts Occupations
The most common Management, Business, Science and Arts occupations in Cortland are Community & Social Service (1,148 | 13.2%), Education Instruction & Library (790 | 9.1%), Management (674 | 7.7%), Health Diagnosing & Treating (393 | 4.5%), and Computers, Engineering & Science (378 | 4.3%).
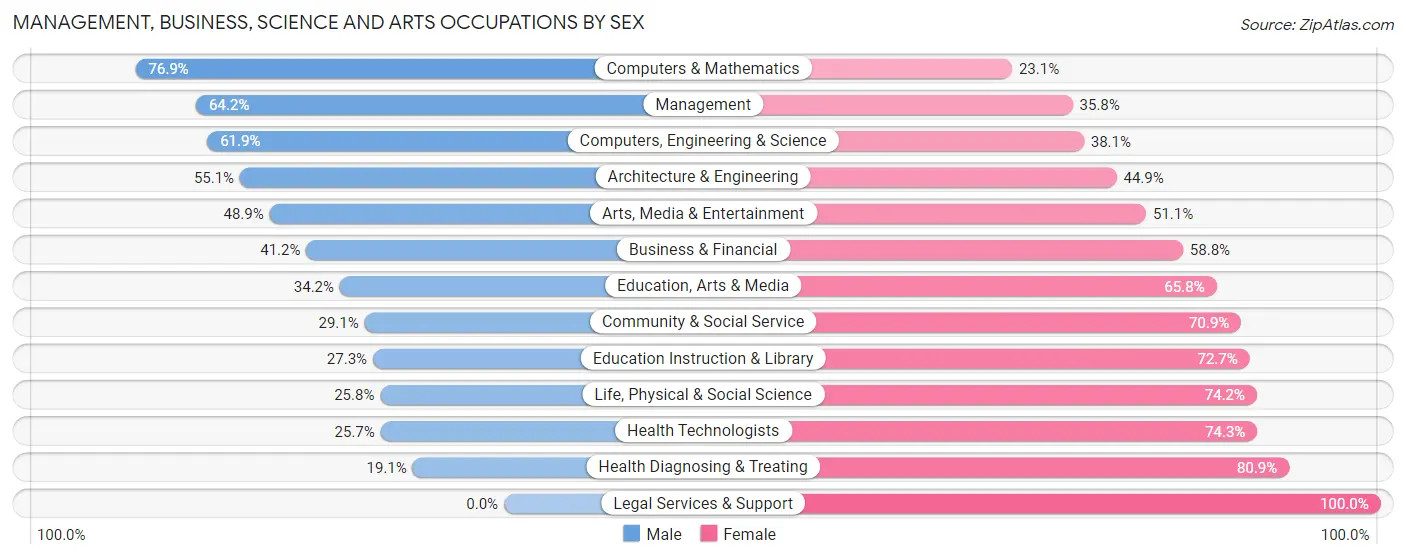
Management, Business, Science and Arts Occupations by Sex
Within the Management, Business, Science and Arts occupations in Cortland, the most male-oriented occupations are Computers & Mathematics (76.9%), Management (64.2%), and Computers, Engineering & Science (61.9%), while the most female-oriented occupations are Legal Services & Support (100.0%), Health Diagnosing & Treating (80.9%), and Health Technologists (74.3%).
| Occupation | Male | Female |
| Management | 433 (64.2%) | 241 (35.8%) |
| Business & Financial | 94 (41.2%) | 134 (58.8%) |
| Computers, Engineering & Science | 234 (61.9%) | 144 (38.1%) |
| Computers & Mathematics | 123 (76.9%) | 37 (23.1%) |
| Architecture & Engineering | 103 (55.1%) | 84 (44.9%) |
| Life, Physical & Social Science | 8 (25.8%) | 23 (74.2%) |
| Community & Social Service | 334 (29.1%) | 814 (70.9%) |
| Education, Arts & Media | 51 (34.2%) | 98 (65.8%) |
| Legal Services & Support | 0 (0.0%) | 72 (100.0%) |
| Education Instruction & Library | 216 (27.3%) | 574 (72.7%) |
| Arts, Media & Entertainment | 67 (48.9%) | 70 (51.1%) |
| Health Diagnosing & Treating | 75 (19.1%) | 318 (80.9%) |
| Health Technologists | 52 (25.7%) | 150 (74.3%) |
| Total (Category) | 1,170 (41.5%) | 1,651 (58.5%) |
| Total (Overall) | 4,169 (47.9%) | 4,530 (52.1%) |
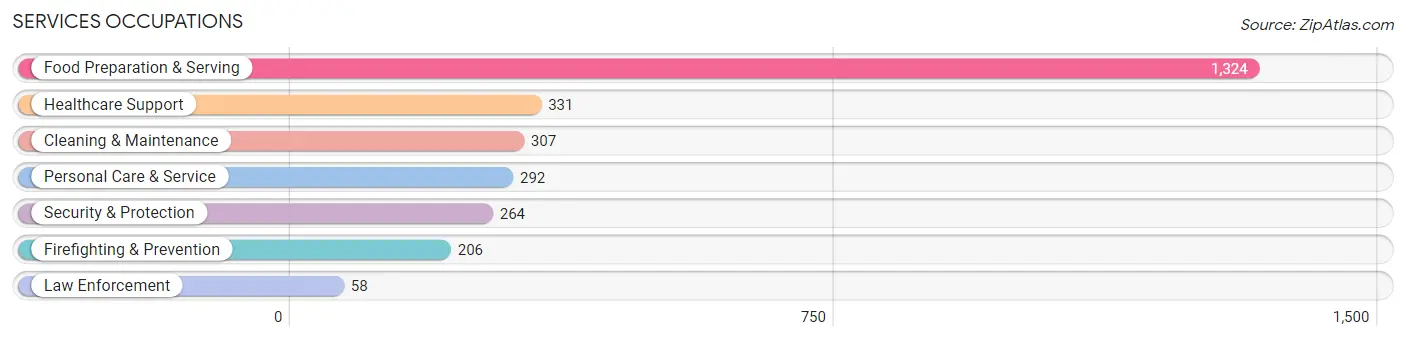
Services Occupations
The most common Services occupations in Cortland are Food Preparation & Serving (1,324 | 15.2%), Healthcare Support (331 | 3.8%), Cleaning & Maintenance (307 | 3.5%), Personal Care & Service (292 | 3.4%), and Security & Protection (264 | 3.0%).
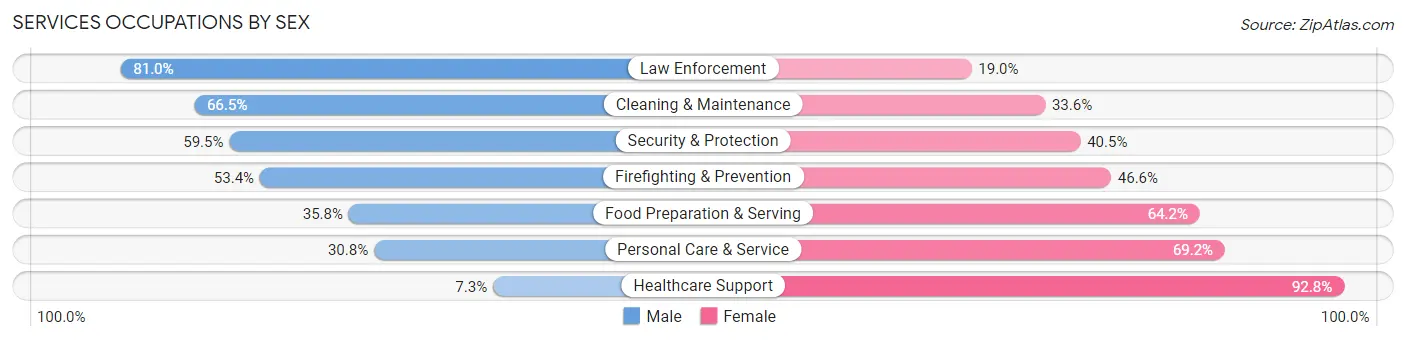
Services Occupations by Sex
Within the Services occupations in Cortland, the most male-oriented occupations are Law Enforcement (81.0%), Cleaning & Maintenance (66.4%), and Security & Protection (59.5%), while the most female-oriented occupations are Healthcare Support (92.7%), Personal Care & Service (69.2%), and Food Preparation & Serving (64.2%).
| Occupation | Male | Female |
| Healthcare Support | 24 (7.2%) | 307 (92.7%) |
| Security & Protection | 157 (59.5%) | 107 (40.5%) |
| Firefighting & Prevention | 110 (53.4%) | 96 (46.6%) |
| Law Enforcement | 47 (81.0%) | 11 (19.0%) |
| Food Preparation & Serving | 474 (35.8%) | 850 (64.2%) |
| Cleaning & Maintenance | 204 (66.4%) | 103 (33.6%) |
| Personal Care & Service | 90 (30.8%) | 202 (69.2%) |
| Total (Category) | 949 (37.7%) | 1,569 (62.3%) |
| Total (Overall) | 4,169 (47.9%) | 4,530 (52.1%) |
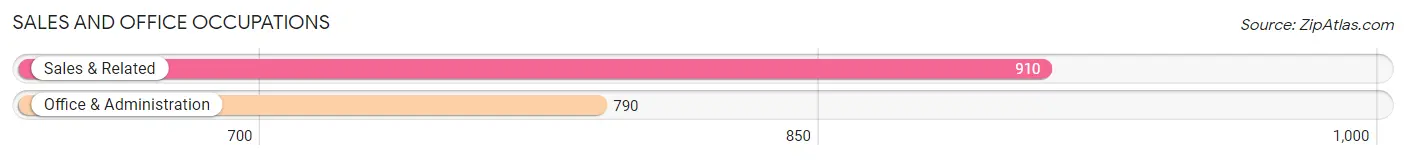
Sales and Office Occupations
The most common Sales and Office occupations in Cortland are Sales & Related (910 | 10.5%), and Office & Administration (790 | 9.1%).
Sales and Office Occupations by Sex
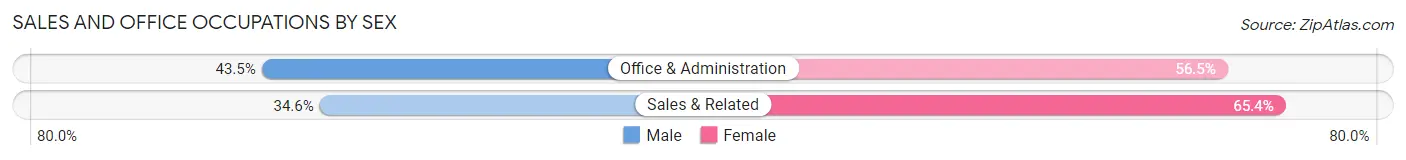
| Occupation | Male | Female |
| Sales & Related | 315 (34.6%) | 595 (65.4%) |
| Office & Administration | 344 (43.5%) | 446 (56.5%) |
| Total (Category) | 659 (38.8%) | 1,041 (61.2%) |
| Total (Overall) | 4,169 (47.9%) | 4,530 (52.1%) |
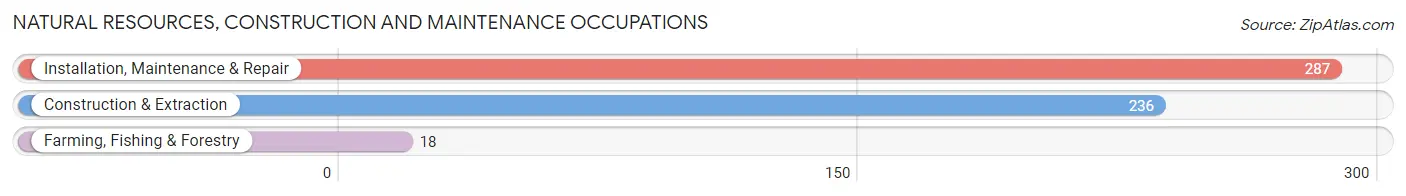
Natural Resources, Construction and Maintenance Occupations
The most common Natural Resources, Construction and Maintenance occupations in Cortland are Installation, Maintenance & Repair (287 | 3.3%), Construction & Extraction (236 | 2.7%), and Farming, Fishing & Forestry (18 | 0.2%).
Natural Resources, Construction and Maintenance Occupations by Sex
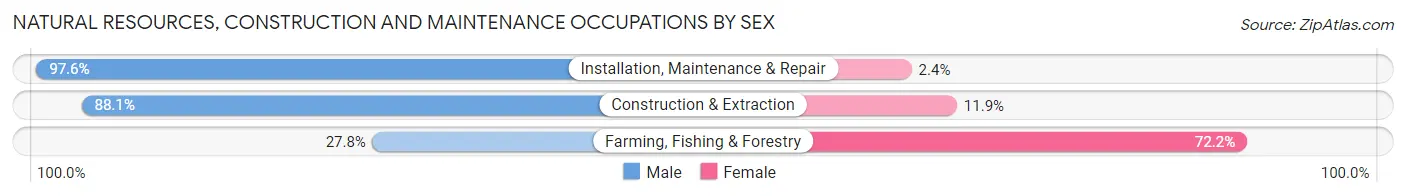
| Occupation | Male | Female |
| Farming, Fishing & Forestry | 5 (27.8%) | 13 (72.2%) |
| Construction & Extraction | 208 (88.1%) | 28 (11.9%) |
| Installation, Maintenance & Repair | 280 (97.6%) | 7 (2.4%) |
| Total (Category) | 493 (91.1%) | 48 (8.9%) |
| Total (Overall) | 4,169 (47.9%) | 4,530 (52.1%) |
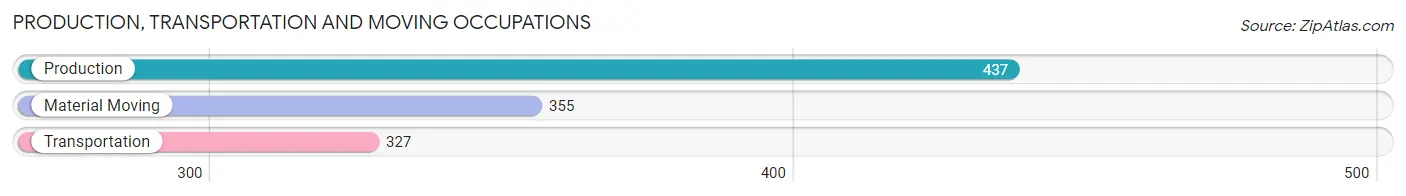
Production, Transportation and Moving Occupations
The most common Production, Transportation and Moving occupations in Cortland are Production (437 | 5.0%), Material Moving (355 | 4.1%), and Transportation (327 | 3.8%).
Production, Transportation and Moving Occupations by Sex
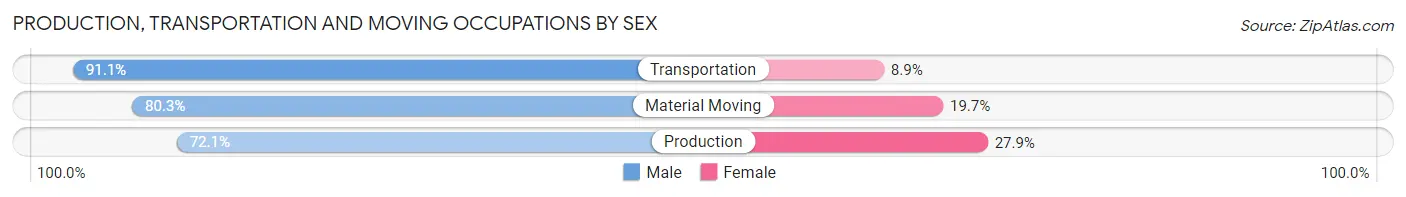
| Occupation | Male | Female |
| Production | 315 (72.1%) | 122 (27.9%) |
| Transportation | 298 (91.1%) | 29 (8.9%) |
| Material Moving | 285 (80.3%) | 70 (19.7%) |
| Total (Category) | 898 (80.2%) | 221 (19.8%) |
| Total (Overall) | 4,169 (47.9%) | 4,530 (52.1%) |
Employment Industries by Sex in Cortland
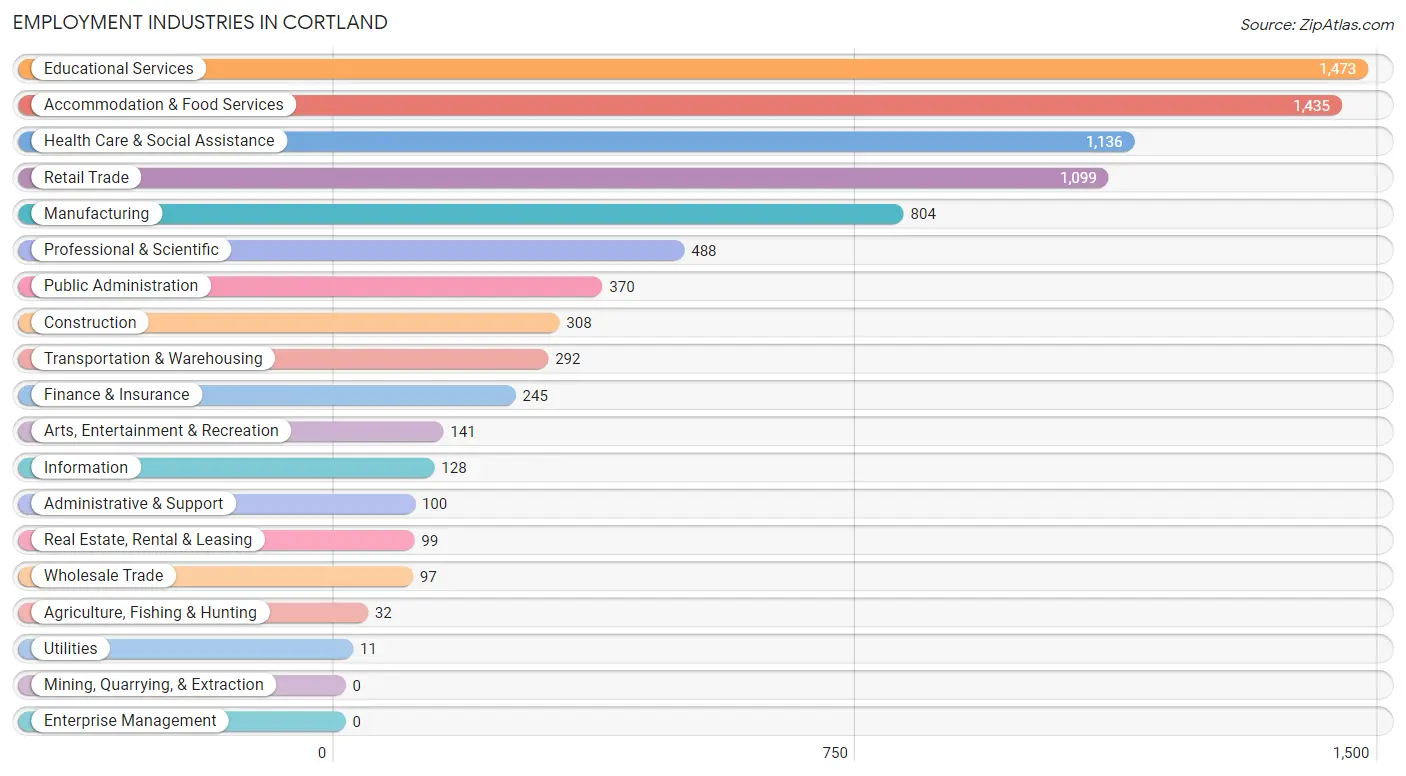
Employment Industries in Cortland
The major employment industries in Cortland include Educational Services (1,473 | 16.9%), Accommodation & Food Services (1,435 | 16.5%), Health Care & Social Assistance (1,136 | 13.1%), Retail Trade (1,099 | 12.6%), and Manufacturing (804 | 9.2%).
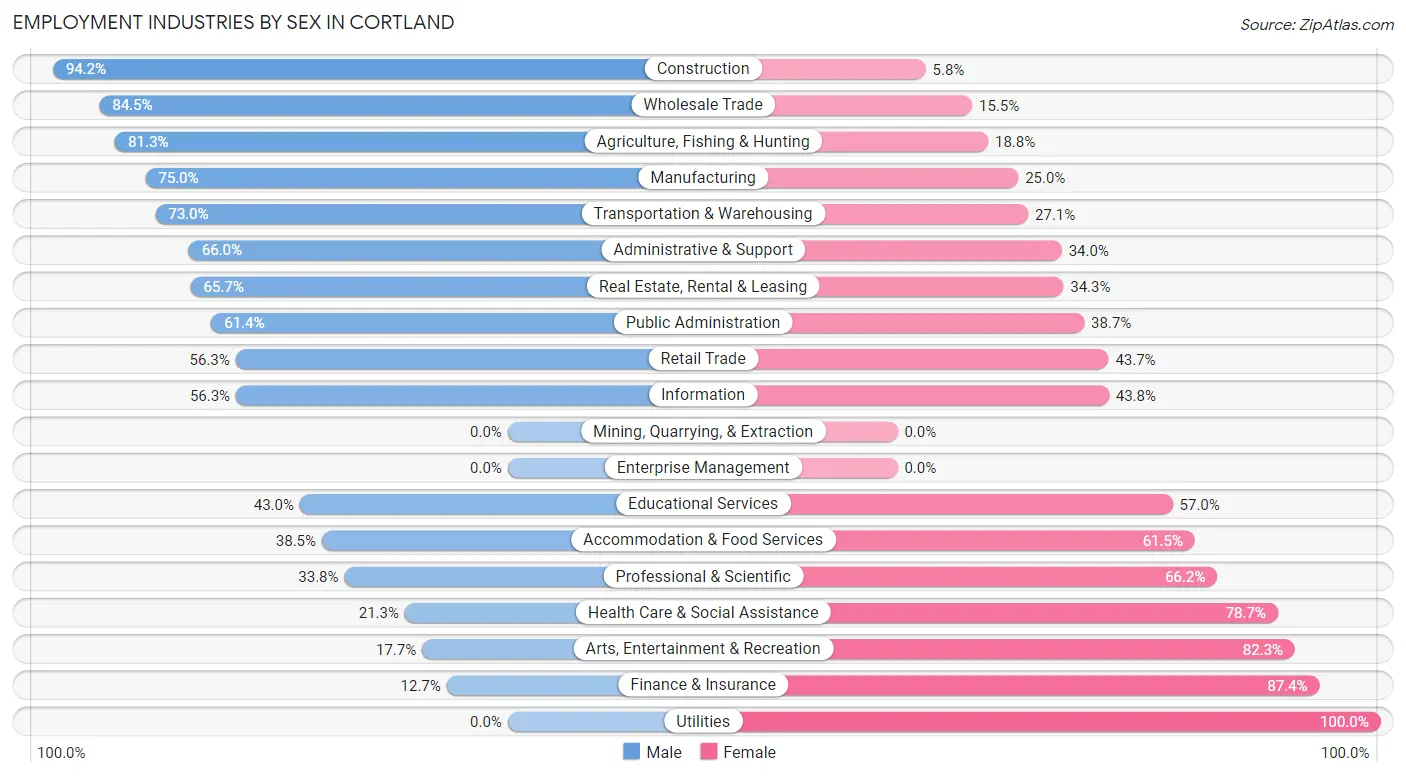
Employment Industries by Sex in Cortland
The Cortland industries that see more men than women are Construction (94.2%), Wholesale Trade (84.5%), and Agriculture, Fishing & Hunting (81.2%), whereas the industries that tend to have a higher number of women are Utilities (100.0%), Finance & Insurance (87.4%), and Arts, Entertainment & Recreation (82.3%).
| Industry | Male | Female |
| Agriculture, Fishing & Hunting | 26 (81.2%) | 6 (18.8%) |
| Mining, Quarrying, & Extraction | 0 (0.0%) | 0 (0.0%) |
| Construction | 290 (94.2%) | 18 (5.8%) |
| Manufacturing | 603 (75.0%) | 201 (25.0%) |
| Wholesale Trade | 82 (84.5%) | 15 (15.5%) |
| Retail Trade | 619 (56.3%) | 480 (43.7%) |
| Transportation & Warehousing | 213 (73.0%) | 79 (27.1%) |
| Utilities | 0 (0.0%) | 11 (100.0%) |
| Information | 72 (56.2%) | 56 (43.8%) |
| Finance & Insurance | 31 (12.7%) | 214 (87.4%) |
| Real Estate, Rental & Leasing | 65 (65.7%) | 34 (34.3%) |
| Professional & Scientific | 165 (33.8%) | 323 (66.2%) |
| Enterprise Management | 0 (0.0%) | 0 (0.0%) |
| Administrative & Support | 66 (66.0%) | 34 (34.0%) |
| Educational Services | 634 (43.0%) | 839 (57.0%) |
| Health Care & Social Assistance | 242 (21.3%) | 894 (78.7%) |
| Arts, Entertainment & Recreation | 25 (17.7%) | 116 (82.3%) |
| Accommodation & Food Services | 552 (38.5%) | 883 (61.5%) |
| Public Administration | 227 (61.4%) | 143 (38.7%) |
| Total | 4,169 (47.9%) | 4,530 (52.1%) |
Education in Cortland
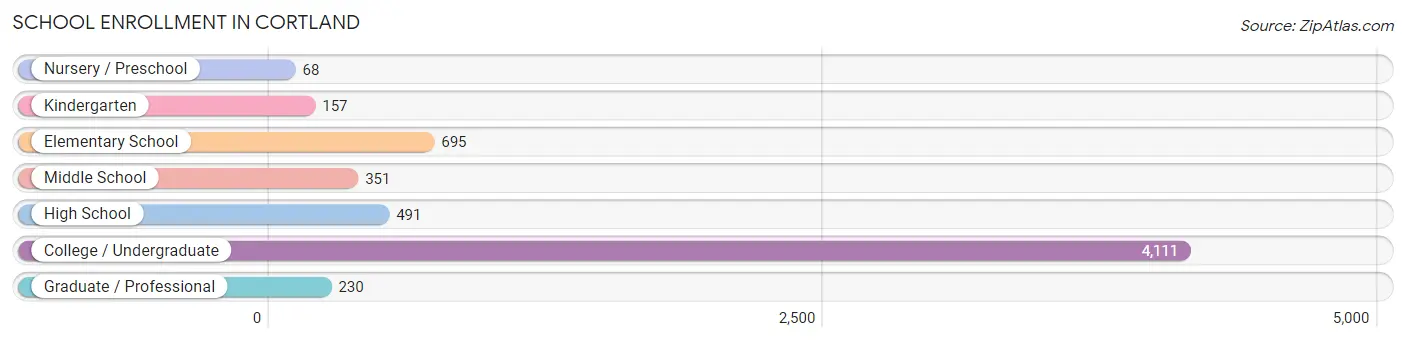
School Enrollment in Cortland
The most common levels of schooling among the 6,103 students in Cortland are college / undergraduate (4,111 | 67.4%), elementary school (695 | 11.4%), and high school (491 | 8.1%).
| School Level | # Students | % Students |
| Nursery / Preschool | 68 | 1.1% |
| Kindergarten | 157 | 2.6% |
| Elementary School | 695 | 11.4% |
| Middle School | 351 | 5.8% |
| High School | 491 | 8.1% |
| College / Undergraduate | 4,111 | 67.4% |
| Graduate / Professional | 230 | 3.8% |
| Total | 6,103 | 100.0% |
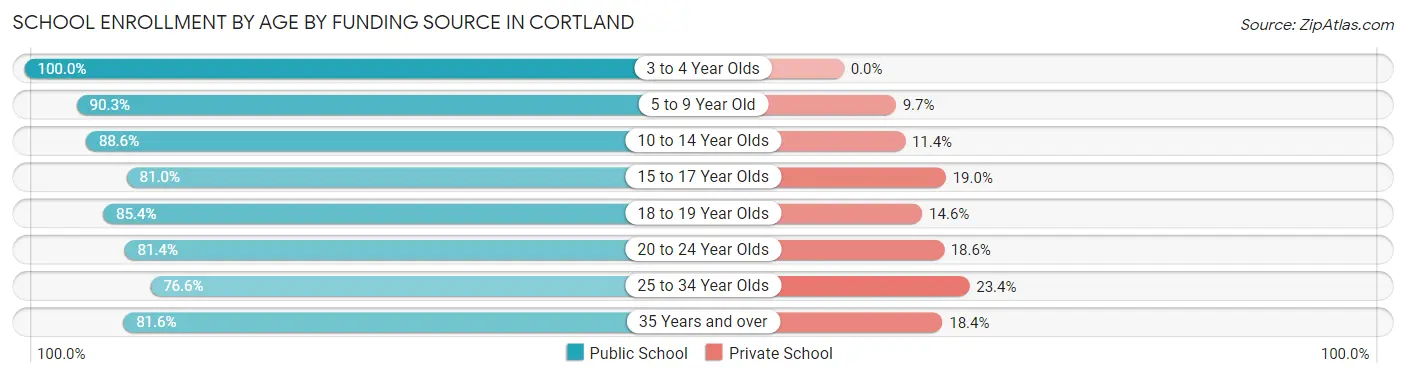
School Enrollment by Age by Funding Source in Cortland
Out of a total of 6,103 students who are enrolled in schools in Cortland, 952 (15.6%) attend a private institution, while the remaining 5,151 (84.4%) are enrolled in public schools. The age group of 25 to 34 year olds has the highest likelihood of being enrolled in private schools, with 73 (23.4% in the age bracket) enrolled. Conversely, the age group of 3 to 4 year olds has the lowest likelihood of being enrolled in a private school, with 64 (100.0% in the age bracket) attending a public institution.
| Age Bracket | Public School | Private School |
| 3 to 4 Year Olds | 64 (100.0%) | 0 (0.0%) |
| 5 to 9 Year Old | 754 (90.3%) | 81 (9.7%) |
| 10 to 14 Year Olds | 396 (88.6%) | 51 (11.4%) |
| 15 to 17 Year Olds | 294 (81.0%) | 69 (19.0%) |
| 18 to 19 Year Olds | 1,688 (85.4%) | 289 (14.6%) |
| 20 to 24 Year Olds | 1,673 (81.4%) | 383 (18.6%) |
| 25 to 34 Year Olds | 239 (76.6%) | 73 (23.4%) |
| 35 Years and over | 40 (81.6%) | 9 (18.4%) |
| Total | 5,151 (84.4%) | 952 (15.6%) |
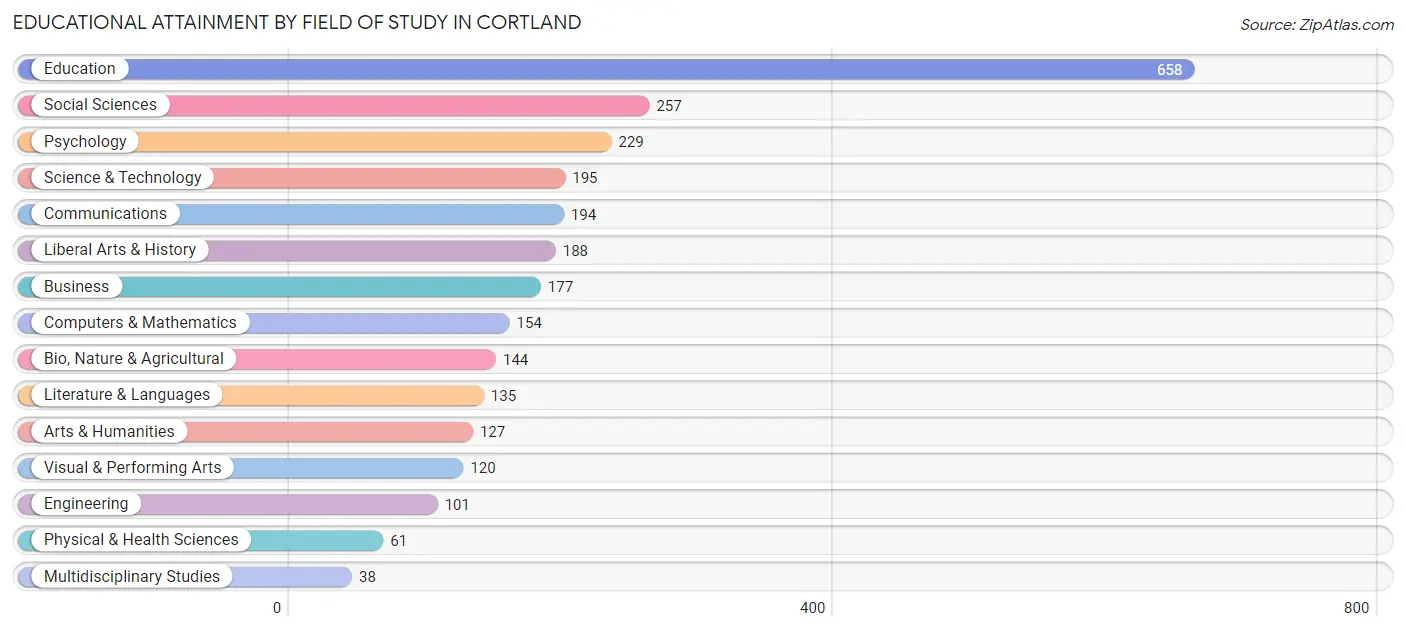
Educational Attainment by Field of Study in Cortland
Education (658 | 23.7%), social sciences (257 | 9.2%), psychology (229 | 8.2%), science & technology (195 | 7.0%), and communications (194 | 7.0%) are the most common fields of study among 2,778 individuals in Cortland who have obtained a bachelor's degree or higher.
| Field of Study | # Graduates | % Graduates |
| Computers & Mathematics | 154 | 5.5% |
| Bio, Nature & Agricultural | 144 | 5.2% |
| Physical & Health Sciences | 61 | 2.2% |
| Psychology | 229 | 8.2% |
| Social Sciences | 257 | 9.2% |
| Engineering | 101 | 3.6% |
| Multidisciplinary Studies | 38 | 1.4% |
| Science & Technology | 195 | 7.0% |
| Business | 177 | 6.4% |
| Education | 658 | 23.7% |
| Literature & Languages | 135 | 4.9% |
| Liberal Arts & History | 188 | 6.8% |
| Visual & Performing Arts | 120 | 4.3% |
| Communications | 194 | 7.0% |
| Arts & Humanities | 127 | 4.6% |
| Total | 2,778 | 100.0% |
Transportation & Commute in Cortland
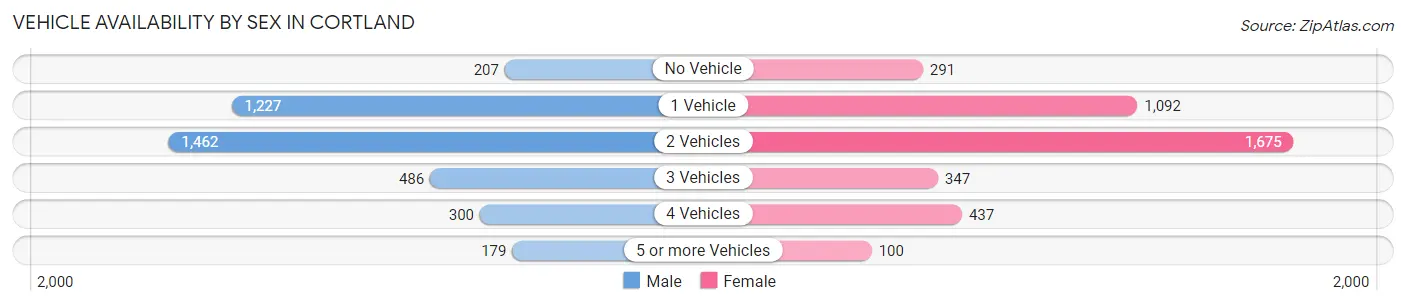
Vehicle Availability by Sex in Cortland
The most prevalent vehicle ownership categories in Cortland are males with 2 vehicles (1,462, accounting for 37.9%) and females with 2 vehicles (1,675, making up 37.1%).
| Vehicles Available | Male | Female |
| No Vehicle | 207 (5.4%) | 291 (7.4%) |
| 1 Vehicle | 1,227 (31.8%) | 1,092 (27.7%) |
| 2 Vehicles | 1,462 (37.9%) | 1,675 (42.5%) |
| 3 Vehicles | 486 (12.6%) | 347 (8.8%) |
| 4 Vehicles | 300 (7.8%) | 437 (11.1%) |
| 5 or more Vehicles | 179 (4.6%) | 100 (2.5%) |
| Total | 3,861 (100.0%) | 3,942 (100.0%) |
Commute Time in Cortland
The most frequently occuring commute durations in Cortland are 5 to 9 minutes (2,494 commuters, 30.9%), 10 to 14 minutes (1,891 commuters, 23.4%), and 15 to 19 minutes (671 commuters, 8.3%).
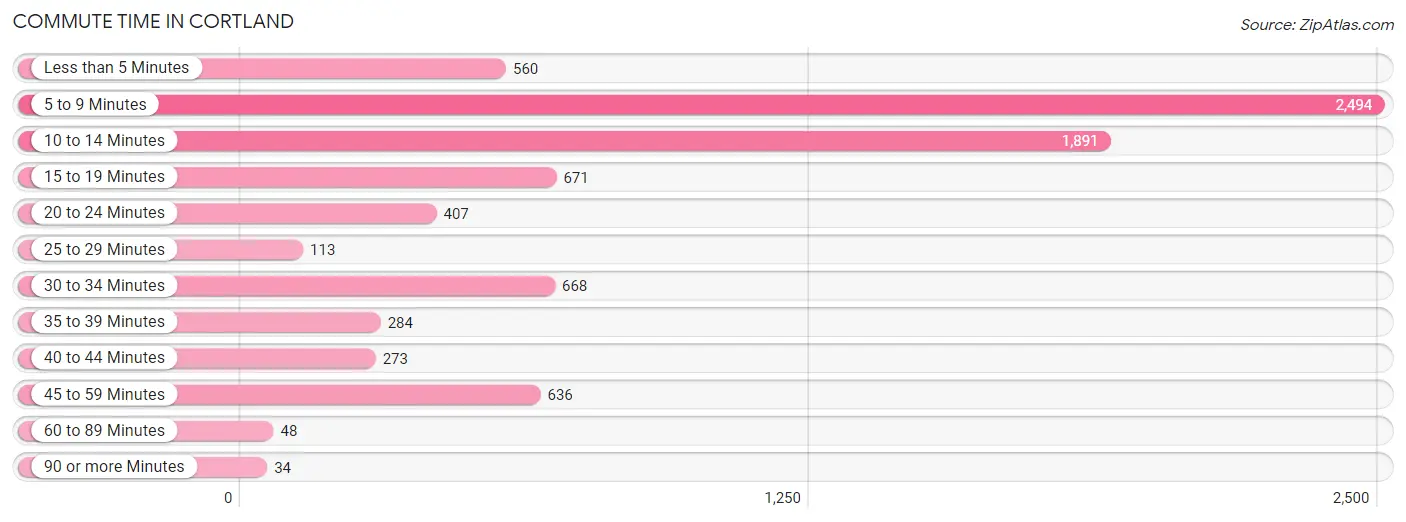
| Commute Time | # Commuters | % Commuters |
| Less than 5 Minutes | 560 | 6.9% |
| 5 to 9 Minutes | 2,494 | 30.9% |
| 10 to 14 Minutes | 1,891 | 23.4% |
| 15 to 19 Minutes | 671 | 8.3% |
| 20 to 24 Minutes | 407 | 5.0% |
| 25 to 29 Minutes | 113 | 1.4% |
| 30 to 34 Minutes | 668 | 8.3% |
| 35 to 39 Minutes | 284 | 3.5% |
| 40 to 44 Minutes | 273 | 3.4% |
| 45 to 59 Minutes | 636 | 7.9% |
| 60 to 89 Minutes | 48 | 0.6% |
| 90 or more Minutes | 34 | 0.4% |
Commute Time by Sex in Cortland
The most common commute times in Cortland are 5 to 9 minutes (1,035 commuters, 26.4%) for males and 5 to 9 minutes (1,459 commuters, 35.1%) for females.
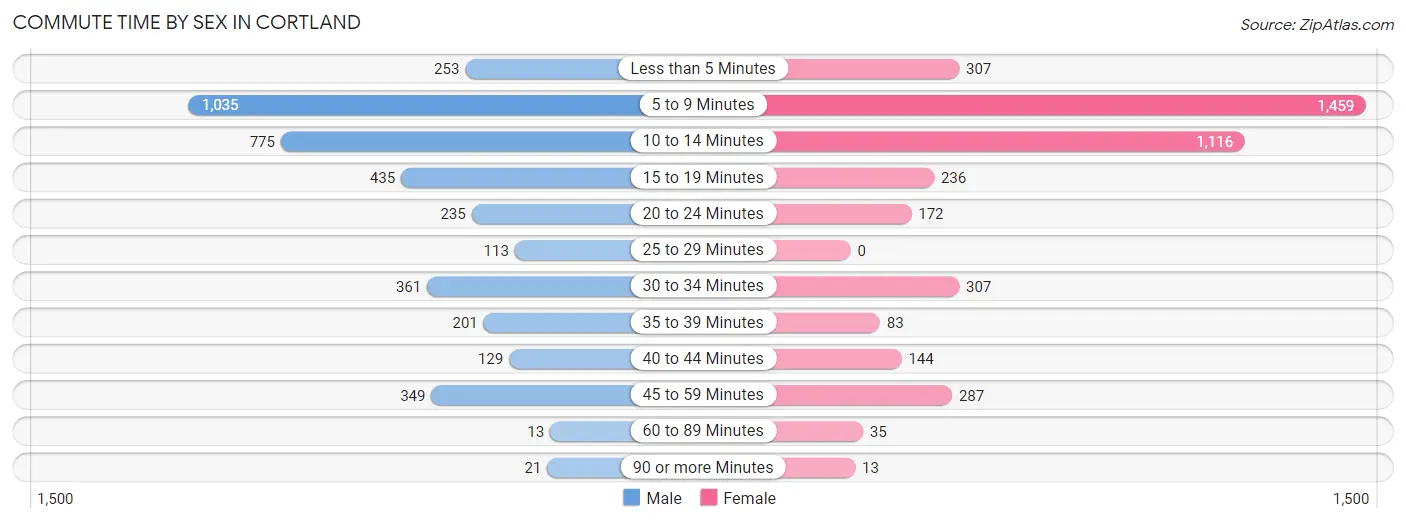
| Commute Time | Male | Female |
| Less than 5 Minutes | 253 (6.5%) | 307 (7.4%) |
| 5 to 9 Minutes | 1,035 (26.4%) | 1,459 (35.1%) |
| 10 to 14 Minutes | 775 (19.8%) | 1,116 (26.8%) |
| 15 to 19 Minutes | 435 (11.1%) | 236 (5.7%) |
| 20 to 24 Minutes | 235 (6.0%) | 172 (4.1%) |
| 25 to 29 Minutes | 113 (2.9%) | 0 (0.0%) |
| 30 to 34 Minutes | 361 (9.2%) | 307 (7.4%) |
| 35 to 39 Minutes | 201 (5.1%) | 83 (2.0%) |
| 40 to 44 Minutes | 129 (3.3%) | 144 (3.5%) |
| 45 to 59 Minutes | 349 (8.9%) | 287 (6.9%) |
| 60 to 89 Minutes | 13 (0.3%) | 35 (0.8%) |
| 90 or more Minutes | 21 (0.5%) | 13 (0.3%) |
Time of Departure to Work by Sex in Cortland
The most frequent times of departure to work in Cortland are 8:00 AM to 8:29 AM (631, 16.1%) for males and 7:30 AM to 7:59 AM (826, 19.9%) for females.
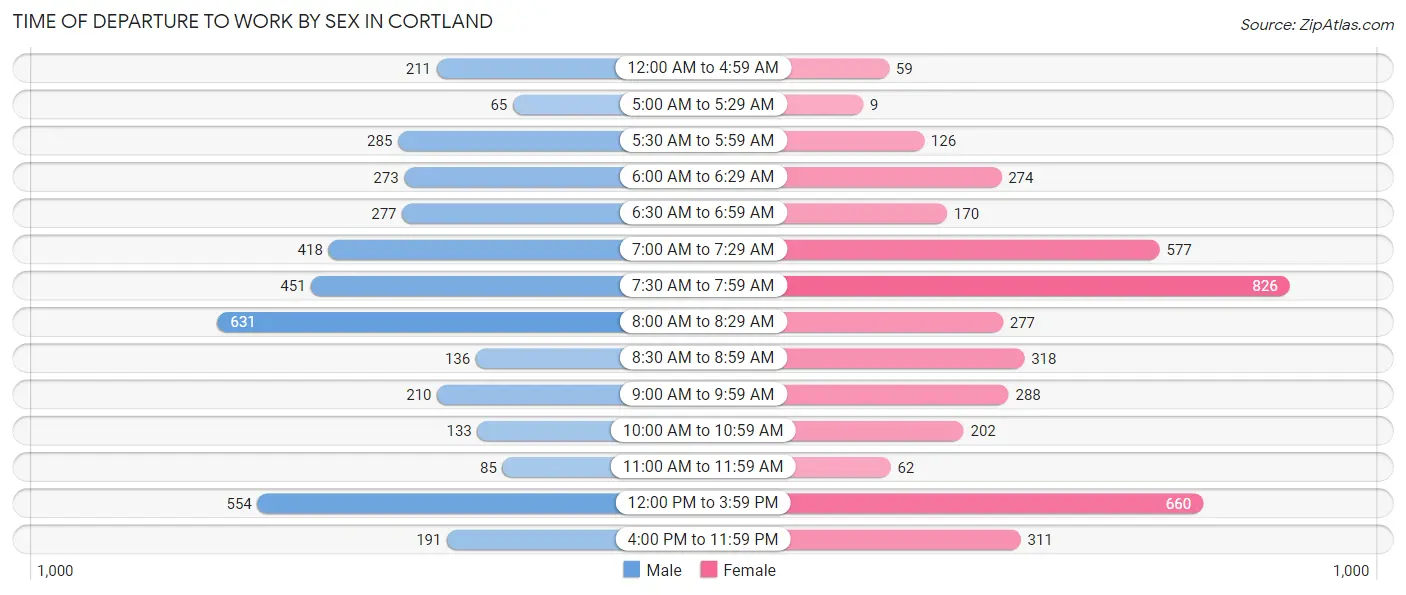
| Time of Departure | Male | Female |
| 12:00 AM to 4:59 AM | 211 (5.4%) | 59 (1.4%) |
| 5:00 AM to 5:29 AM | 65 (1.7%) | 9 (0.2%) |
| 5:30 AM to 5:59 AM | 285 (7.3%) | 126 (3.0%) |
| 6:00 AM to 6:29 AM | 273 (7.0%) | 274 (6.6%) |
| 6:30 AM to 6:59 AM | 277 (7.1%) | 170 (4.1%) |
| 7:00 AM to 7:29 AM | 418 (10.7%) | 577 (13.9%) |
| 7:30 AM to 7:59 AM | 451 (11.5%) | 826 (19.9%) |
| 8:00 AM to 8:29 AM | 631 (16.1%) | 277 (6.7%) |
| 8:30 AM to 8:59 AM | 136 (3.5%) | 318 (7.6%) |
| 9:00 AM to 9:59 AM | 210 (5.4%) | 288 (6.9%) |
| 10:00 AM to 10:59 AM | 133 (3.4%) | 202 (4.9%) |
| 11:00 AM to 11:59 AM | 85 (2.2%) | 62 (1.5%) |
| 12:00 PM to 3:59 PM | 554 (14.1%) | 660 (15.9%) |
| 4:00 PM to 11:59 PM | 191 (4.9%) | 311 (7.5%) |
| Total | 3,920 (100.0%) | 4,159 (100.0%) |
Housing Occupancy in Cortland
Occupancy by Ownership in Cortland
Of the total 6,934 dwellings in Cortland, owner-occupied units account for 3,078 (44.4%), while renter-occupied units make up 3,856 (55.6%).
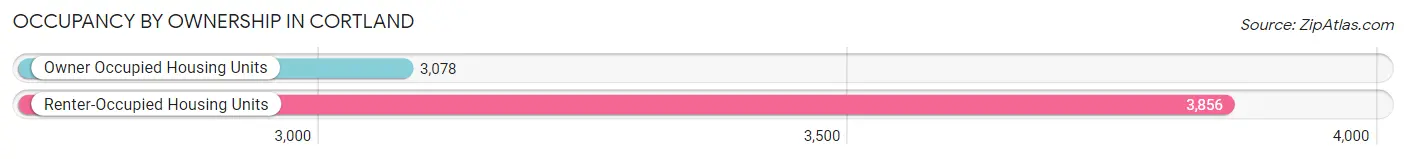
| Occupancy | # Housing Units | % Housing Units |
| Owner Occupied Housing Units | 3,078 | 44.4% |
| Renter-Occupied Housing Units | 3,856 | 55.6% |
| Total Occupied Housing Units | 6,934 | 100.0% |
Occupancy by Household Size in Cortland
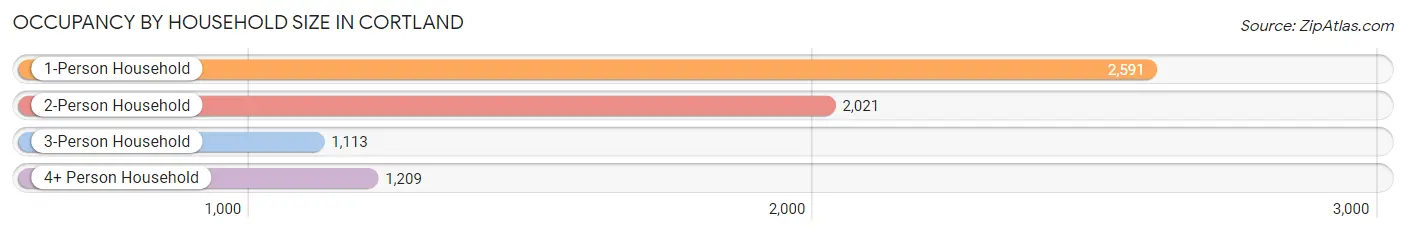
| Household Size | # Housing Units | % Housing Units |
| 1-Person Household | 2,591 | 37.4% |
| 2-Person Household | 2,021 | 29.1% |
| 3-Person Household | 1,113 | 16.1% |
| 4+ Person Household | 1,209 | 17.4% |
| Total Housing Units | 6,934 | 100.0% |
Occupancy by Ownership by Household Size in Cortland
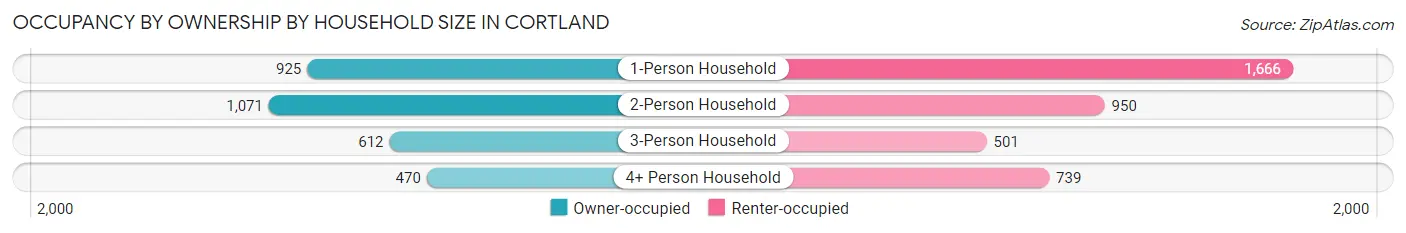
| Household Size | Owner-occupied | Renter-occupied |
| 1-Person Household | 925 (35.7%) | 1,666 (64.3%) |
| 2-Person Household | 1,071 (53.0%) | 950 (47.0%) |
| 3-Person Household | 612 (55.0%) | 501 (45.0%) |
| 4+ Person Household | 470 (38.9%) | 739 (61.1%) |
| Total Housing Units | 3,078 (44.4%) | 3,856 (55.6%) |
Occupancy by Educational Attainment in Cortland
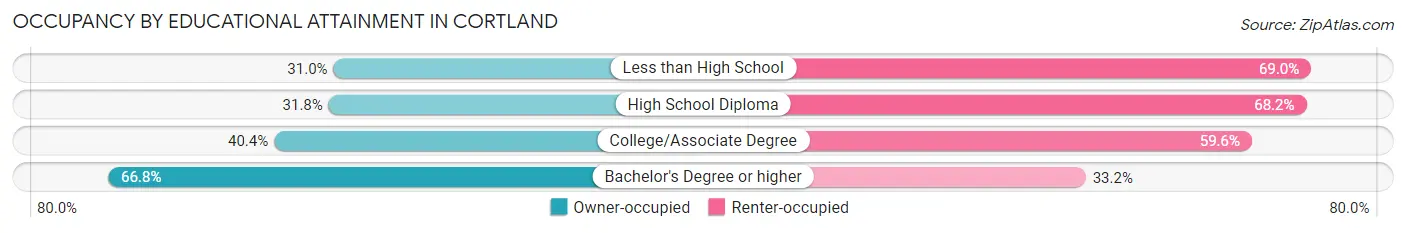
| Household Size | Owner-occupied | Renter-occupied |
| Less than High School | 192 (31.0%) | 427 (69.0%) |
| High School Diploma | 558 (31.8%) | 1,198 (68.2%) |
| College/Associate Degree | 1,099 (40.4%) | 1,619 (59.6%) |
| Bachelor's Degree or higher | 1,229 (66.8%) | 612 (33.2%) |
Occupancy by Age of Householder in Cortland
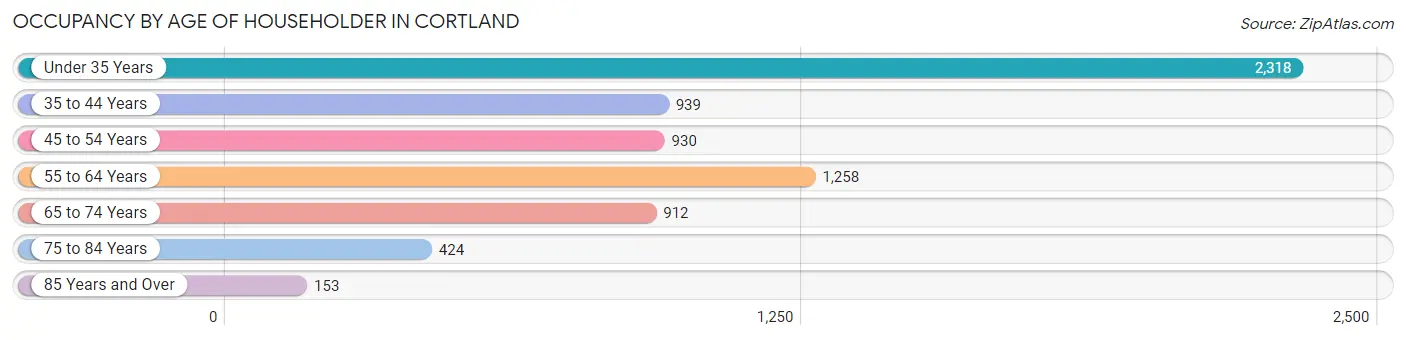
| Age Bracket | # Households | % Households |
| Under 35 Years | 2,318 | 33.4% |
| 35 to 44 Years | 939 | 13.5% |
| 45 to 54 Years | 930 | 13.4% |
| 55 to 64 Years | 1,258 | 18.1% |
| 65 to 74 Years | 912 | 13.2% |
| 75 to 84 Years | 424 | 6.1% |
| 85 Years and Over | 153 | 2.2% |
| Total | 6,934 | 100.0% |
Housing Finances in Cortland
Median Income by Occupancy in Cortland
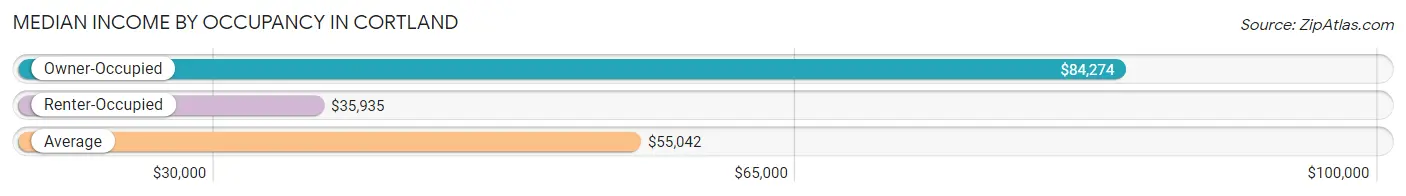
| Occupancy Type | # Households | Median Income |
| Owner-Occupied | 3,078 (44.4%) | $84,274 |
| Renter-Occupied | 3,856 (55.6%) | $35,935 |
| Average | 6,934 (100.0%) | $55,042 |
Occupancy by Householder Income Bracket in Cortland
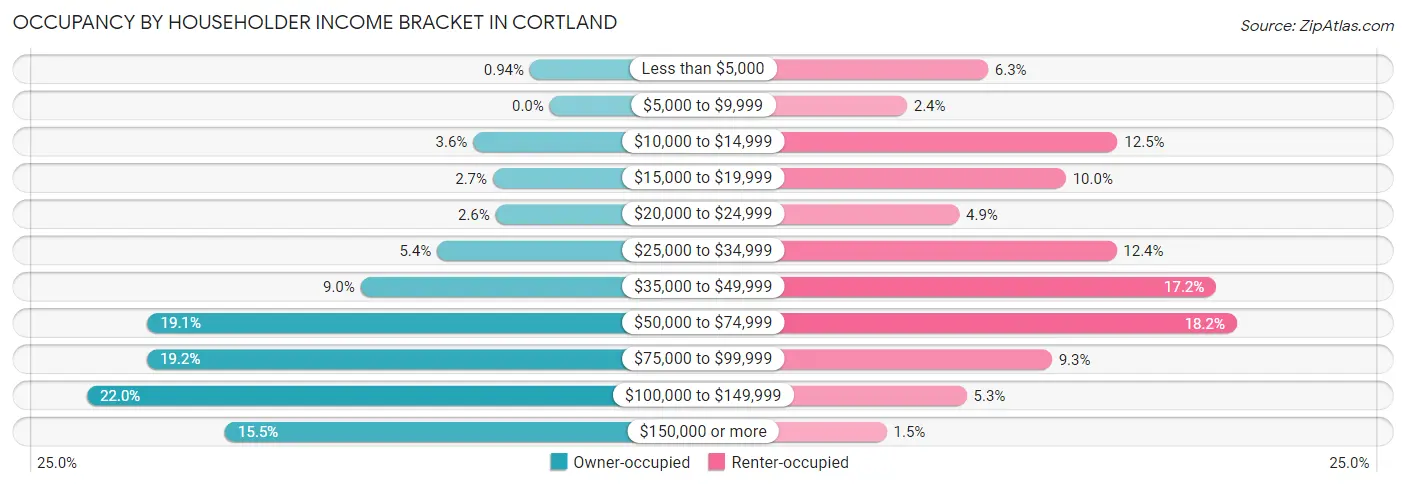
| Income Bracket | Owner-occupied | Renter-occupied |
| Less than $5,000 | 29 (0.9%) | 243 (6.3%) |
| $5,000 to $9,999 | 0 (0.0%) | 94 (2.4%) |
| $10,000 to $14,999 | 112 (3.6%) | 481 (12.5%) |
| $15,000 to $19,999 | 83 (2.7%) | 386 (10.0%) |
| $20,000 to $24,999 | 79 (2.6%) | 190 (4.9%) |
| $25,000 to $34,999 | 165 (5.4%) | 479 (12.4%) |
| $35,000 to $49,999 | 277 (9.0%) | 662 (17.2%) |
| $50,000 to $74,999 | 589 (19.1%) | 700 (18.1%) |
| $75,000 to $99,999 | 590 (19.2%) | 360 (9.3%) |
| $100,000 to $149,999 | 678 (22.0%) | 204 (5.3%) |
| $150,000 or more | 476 (15.5%) | 57 (1.5%) |
| Total | 3,078 (100.0%) | 3,856 (100.0%) |
Monthly Housing Cost Tiers in Cortland
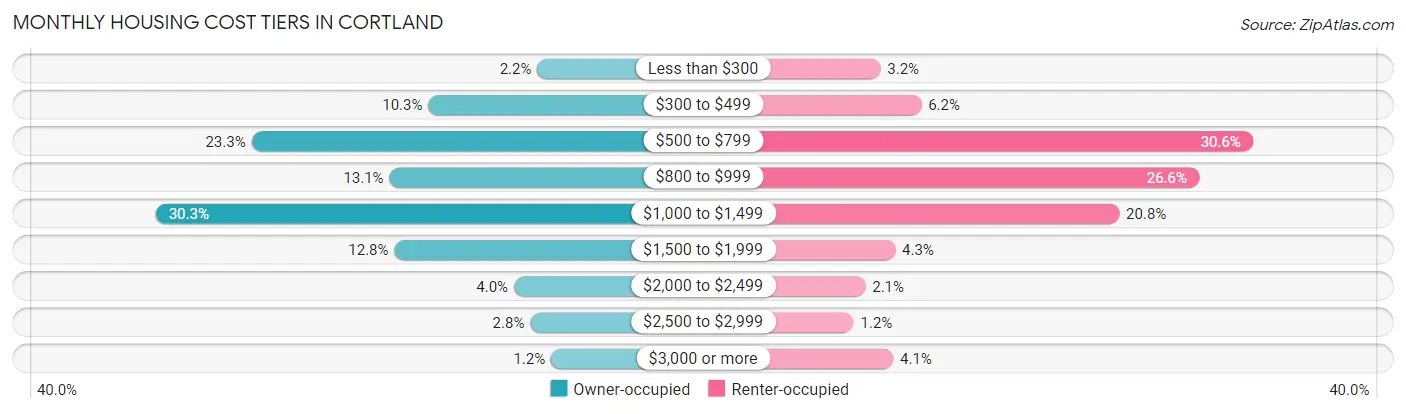
| Monthly Cost | Owner-occupied | Renter-occupied |
| Less than $300 | 69 (2.2%) | 122 (3.2%) |
| $300 to $499 | 316 (10.3%) | 238 (6.2%) |
| $500 to $799 | 717 (23.3%) | 1,179 (30.6%) |
| $800 to $999 | 404 (13.1%) | 1,026 (26.6%) |
| $1,000 to $1,499 | 934 (30.3%) | 800 (20.7%) |
| $1,500 to $1,999 | 393 (12.8%) | 164 (4.3%) |
| $2,000 to $2,499 | 122 (4.0%) | 79 (2.1%) |
| $2,500 to $2,999 | 85 (2.8%) | 46 (1.2%) |
| $3,000 or more | 38 (1.2%) | 158 (4.1%) |
| Total | 3,078 (100.0%) | 3,856 (100.0%) |
Physical Housing Characteristics in Cortland
Housing Structures in Cortland
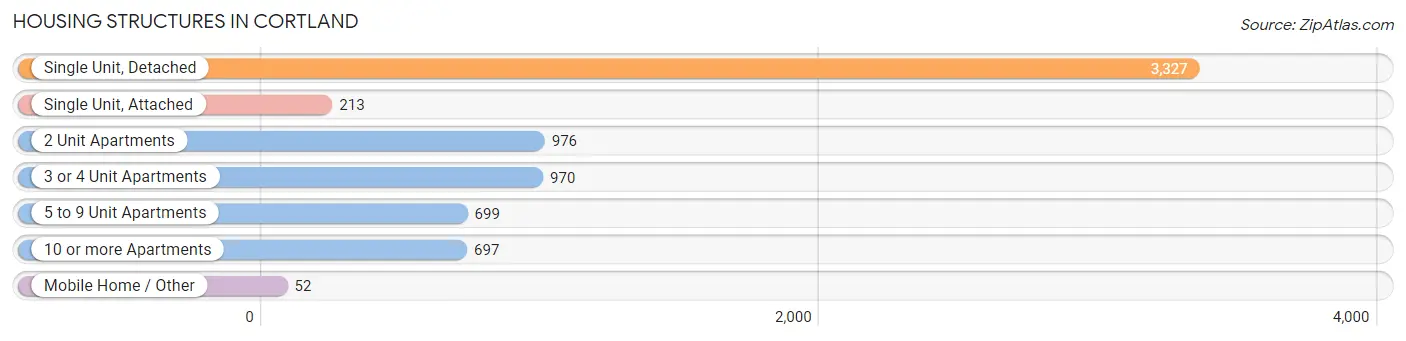
| Structure Type | # Housing Units | % Housing Units |
| Single Unit, Detached | 3,327 | 48.0% |
| Single Unit, Attached | 213 | 3.1% |
| 2 Unit Apartments | 976 | 14.1% |
| 3 or 4 Unit Apartments | 970 | 14.0% |
| 5 to 9 Unit Apartments | 699 | 10.1% |
| 10 or more Apartments | 697 | 10.1% |
| Mobile Home / Other | 52 | 0.7% |
| Total | 6,934 | 100.0% |
Housing Structures by Occupancy in Cortland
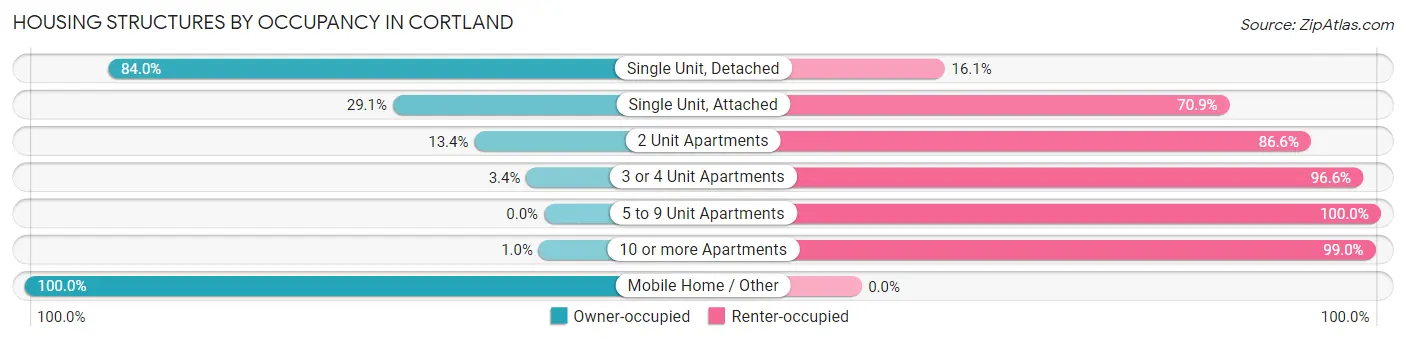
| Structure Type | Owner-occupied | Renter-occupied |
| Single Unit, Detached | 2,793 (84.0%) | 534 (16.1%) |
| Single Unit, Attached | 62 (29.1%) | 151 (70.9%) |
| 2 Unit Apartments | 131 (13.4%) | 845 (86.6%) |
| 3 or 4 Unit Apartments | 33 (3.4%) | 937 (96.6%) |
| 5 to 9 Unit Apartments | 0 (0.0%) | 699 (100.0%) |
| 10 or more Apartments | 7 (1.0%) | 690 (99.0%) |
| Mobile Home / Other | 52 (100.0%) | 0 (0.0%) |
| Total | 3,078 (44.4%) | 3,856 (55.6%) |
Housing Structures by Number of Rooms in Cortland
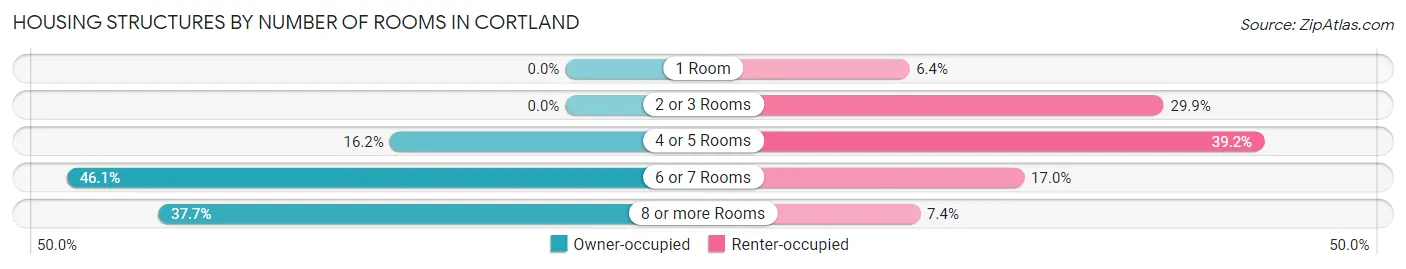
| Number of Rooms | Owner-occupied | Renter-occupied |
| 1 Room | 0 (0.0%) | 247 (6.4%) |
| 2 or 3 Rooms | 0 (0.0%) | 1,154 (29.9%) |
| 4 or 5 Rooms | 500 (16.2%) | 1,512 (39.2%) |
| 6 or 7 Rooms | 1,419 (46.1%) | 657 (17.0%) |
| 8 or more Rooms | 1,159 (37.7%) | 286 (7.4%) |
| Total | 3,078 (100.0%) | 3,856 (100.0%) |
Housing Structure by Heating Type in Cortland
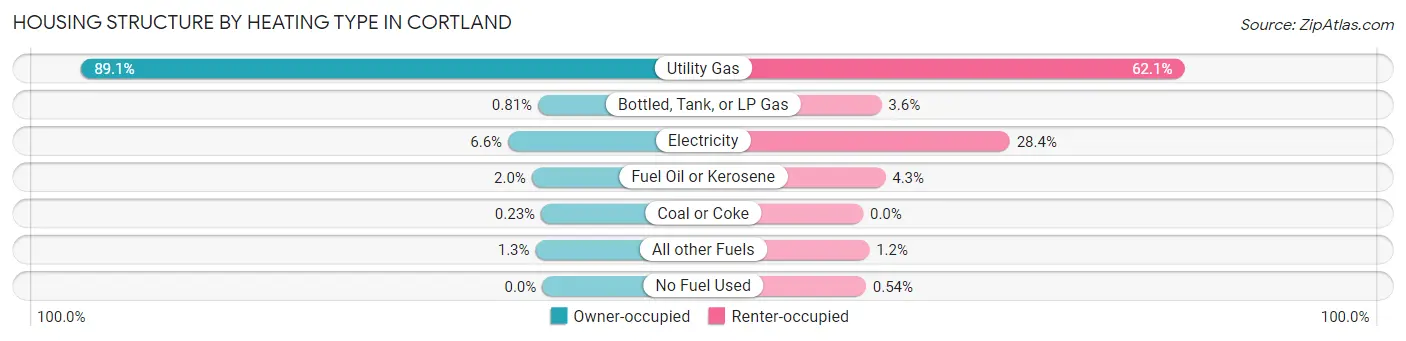
| Heating Type | Owner-occupied | Renter-occupied |
| Utility Gas | 2,741 (89.0%) | 2,393 (62.1%) |
| Bottled, Tank, or LP Gas | 25 (0.8%) | 137 (3.5%) |
| Electricity | 203 (6.6%) | 1,093 (28.3%) |
| Fuel Oil or Kerosene | 62 (2.0%) | 166 (4.3%) |
| Coal or Coke | 7 (0.2%) | 0 (0.0%) |
| All other Fuels | 40 (1.3%) | 46 (1.2%) |
| No Fuel Used | 0 (0.0%) | 21 (0.5%) |
| Total | 3,078 (100.0%) | 3,856 (100.0%) |
Household Vehicle Usage in Cortland
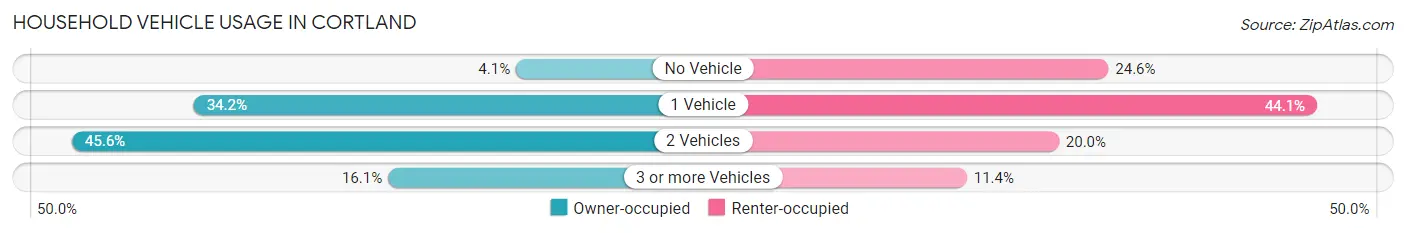
| Vehicles per Household | Owner-occupied | Renter-occupied |
| No Vehicle | 127 (4.1%) | 948 (24.6%) |
| 1 Vehicle | 1,053 (34.2%) | 1,699 (44.1%) |
| 2 Vehicles | 1,403 (45.6%) | 770 (20.0%) |
| 3 or more Vehicles | 495 (16.1%) | 439 (11.4%) |
| Total | 3,078 (100.0%) | 3,856 (100.0%) |
Real Estate & Mortgages in Cortland
Real Estate and Mortgage Overview in Cortland
| Characteristic | Without Mortgage | With Mortgage |
| Housing Units | 1,223 | 1,855 |
| Median Property Value | $122,000 | $135,400 |
| Median Household Income | $75,302 | $323 |
| Monthly Housing Costs | $585 | $38 |
| Real Estate Taxes | $3,699 | $48 |
Property Value by Mortgage Status in Cortland
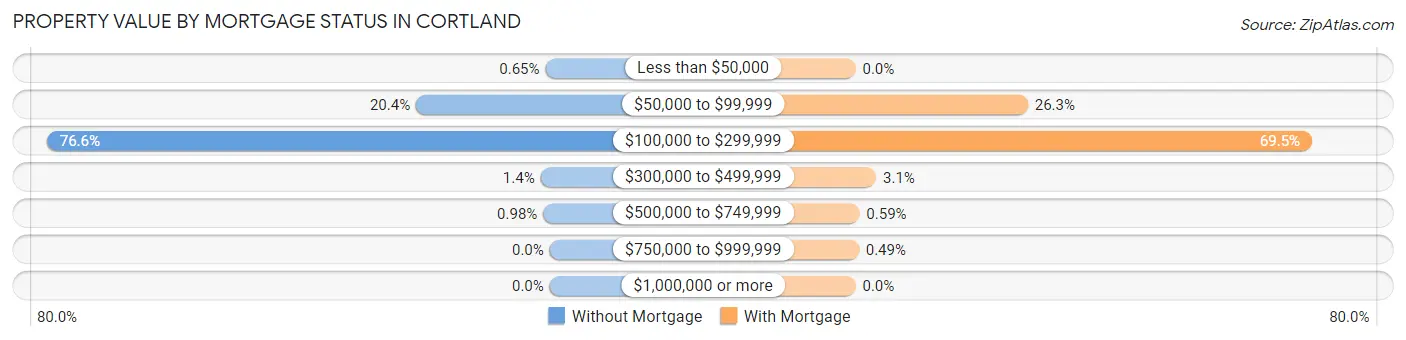
| Property Value | Without Mortgage | With Mortgage |
| Less than $50,000 | 8 (0.6%) | 0 (0.0%) |
| $50,000 to $99,999 | 249 (20.4%) | 487 (26.3%) |
| $100,000 to $299,999 | 937 (76.6%) | 1,290 (69.5%) |
| $300,000 to $499,999 | 17 (1.4%) | 58 (3.1%) |
| $500,000 to $749,999 | 12 (1.0%) | 11 (0.6%) |
| $750,000 to $999,999 | 0 (0.0%) | 9 (0.5%) |
| $1,000,000 or more | 0 (0.0%) | 0 (0.0%) |
| Total | 1,223 (100.0%) | 1,855 (100.0%) |
Household Income by Mortgage Status in Cortland
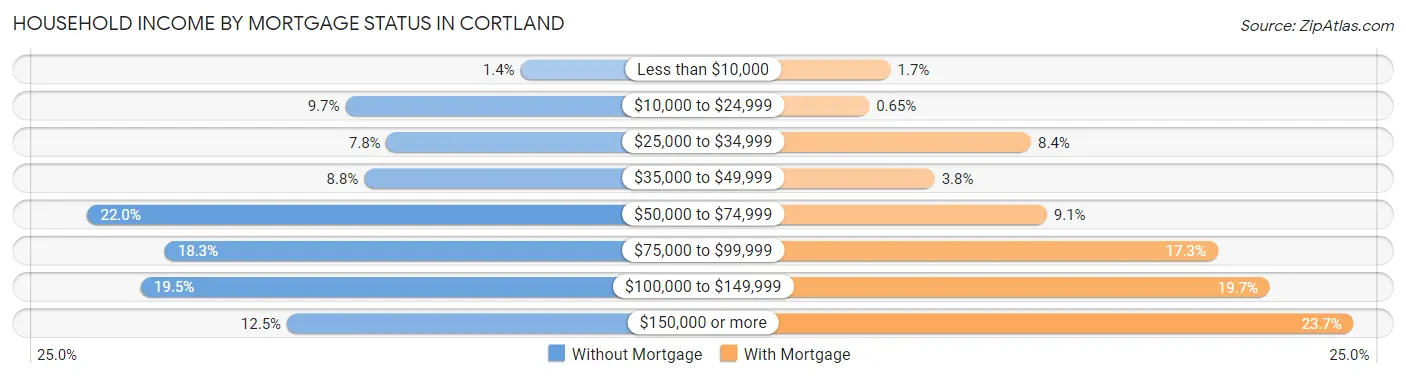
| Household Income | Without Mortgage | With Mortgage |
| Less than $10,000 | 17 (1.4%) | 31 (1.7%) |
| $10,000 to $24,999 | 119 (9.7%) | 12 (0.6%) |
| $25,000 to $34,999 | 95 (7.8%) | 155 (8.4%) |
| $35,000 to $49,999 | 108 (8.8%) | 70 (3.8%) |
| $50,000 to $74,999 | 269 (22.0%) | 169 (9.1%) |
| $75,000 to $99,999 | 224 (18.3%) | 320 (17.2%) |
| $100,000 to $149,999 | 238 (19.5%) | 366 (19.7%) |
| $150,000 or more | 153 (12.5%) | 440 (23.7%) |
| Total | 1,223 (100.0%) | 1,855 (100.0%) |
Property Value to Household Income Ratio in Cortland
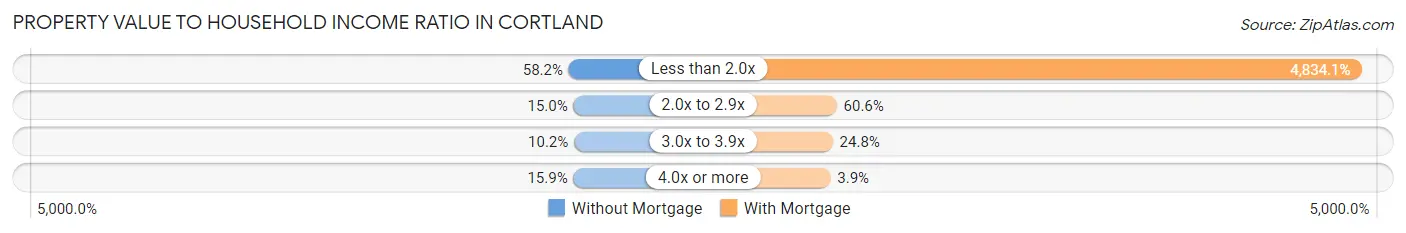
| Value-to-Income Ratio | Without Mortgage | With Mortgage |
| Less than 2.0x | 712 (58.2%) | 89,673 (4,834.1%) |
| 2.0x to 2.9x | 183 (15.0%) | 1,124 (60.6%) |
| 3.0x to 3.9x | 125 (10.2%) | 460 (24.8%) |
| 4.0x or more | 195 (15.9%) | 73 (3.9%) |
| Total | 1,223 (100.0%) | 1,855 (100.0%) |
Real Estate Taxes by Mortgage Status in Cortland
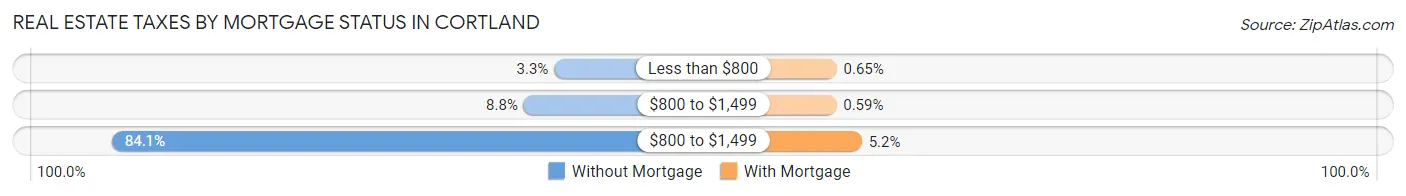
| Property Taxes | Without Mortgage | With Mortgage |
| Less than $800 | 40 (3.3%) | 12 (0.6%) |
| $800 to $1,499 | 108 (8.8%) | 11 (0.6%) |
| $800 to $1,499 | 1,028 (84.1%) | 97 (5.2%) |
| Total | 1,223 (100.0%) | 1,855 (100.0%) |
Health & Disability in Cortland
Health Insurance Coverage by Age in Cortland
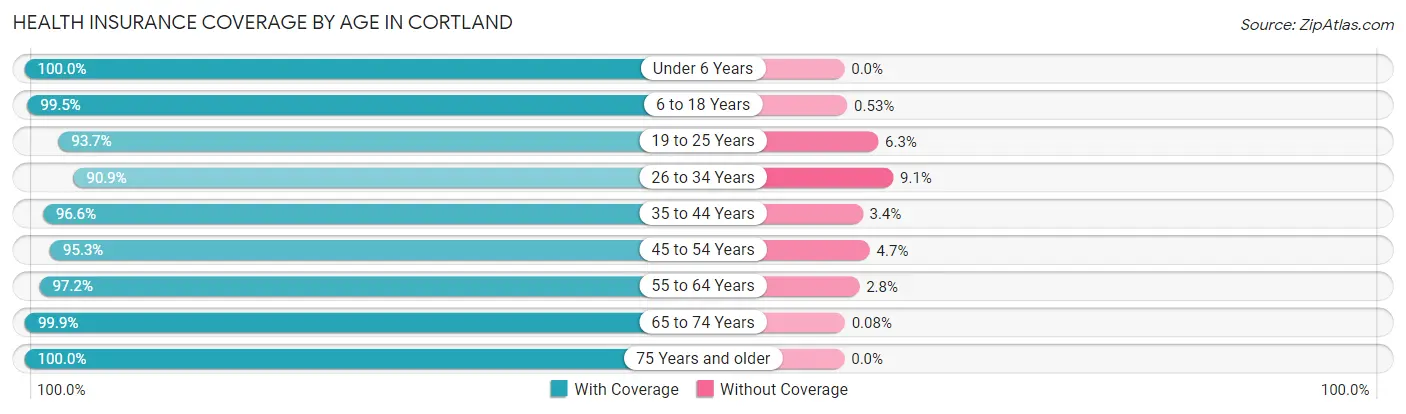
| Age Bracket | With Coverage | Without Coverage |
| Under 6 Years | 707 (100.0%) | 0 (0.0%) |
| 6 to 18 Years | 2,649 (99.5%) | 14 (0.5%) |
| 19 to 25 Years | 4,640 (93.7%) | 312 (6.3%) |
| 26 to 34 Years | 1,877 (90.9%) | 188 (9.1%) |
| 35 to 44 Years | 1,448 (96.6%) | 51 (3.4%) |
| 45 to 54 Years | 1,430 (95.3%) | 71 (4.7%) |
| 55 to 64 Years | 1,714 (97.2%) | 49 (2.8%) |
| 65 to 74 Years | 1,292 (99.9%) | 1 (0.1%) |
| 75 Years and older | 738 (100.0%) | 0 (0.0%) |
| Total | 16,495 (96.0%) | 686 (4.0%) |
Health Insurance Coverage by Citizenship Status in Cortland
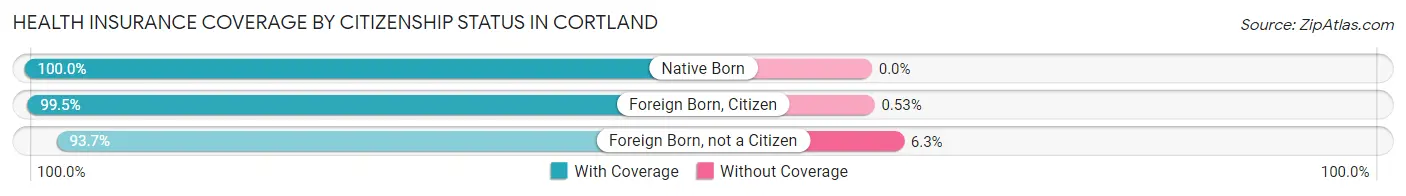
| Citizenship Status | With Coverage | Without Coverage |
| Native Born | 707 (100.0%) | 0 (0.0%) |
| Foreign Born, Citizen | 2,649 (99.5%) | 14 (0.5%) |
| Foreign Born, not a Citizen | 4,640 (93.7%) | 312 (6.3%) |
Health Insurance Coverage by Household Income in Cortland
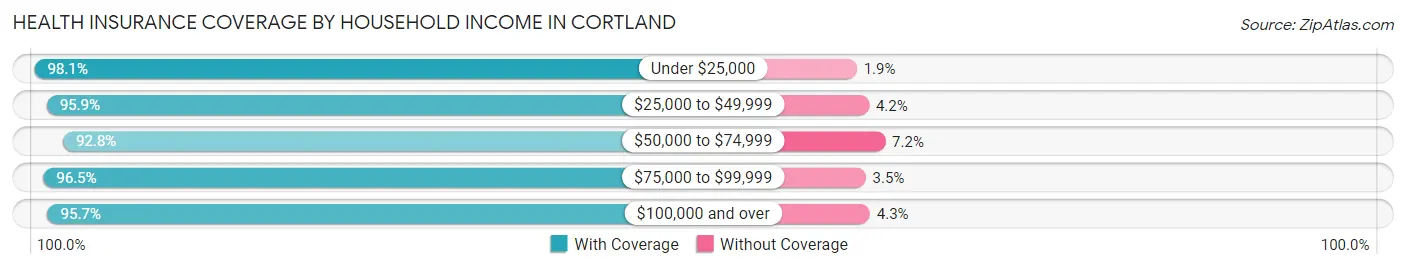
| Household Income | With Coverage | Without Coverage |
| Under $25,000 | 2,268 (98.1%) | 43 (1.9%) |
| $25,000 to $49,999 | 2,957 (95.9%) | 128 (4.2%) |
| $50,000 to $74,999 | 2,517 (92.8%) | 195 (7.2%) |
| $75,000 to $99,999 | 2,028 (96.5%) | 74 (3.5%) |
| $100,000 and over | 4,209 (95.7%) | 190 (4.3%) |
Public vs Private Health Insurance Coverage by Age in Cortland
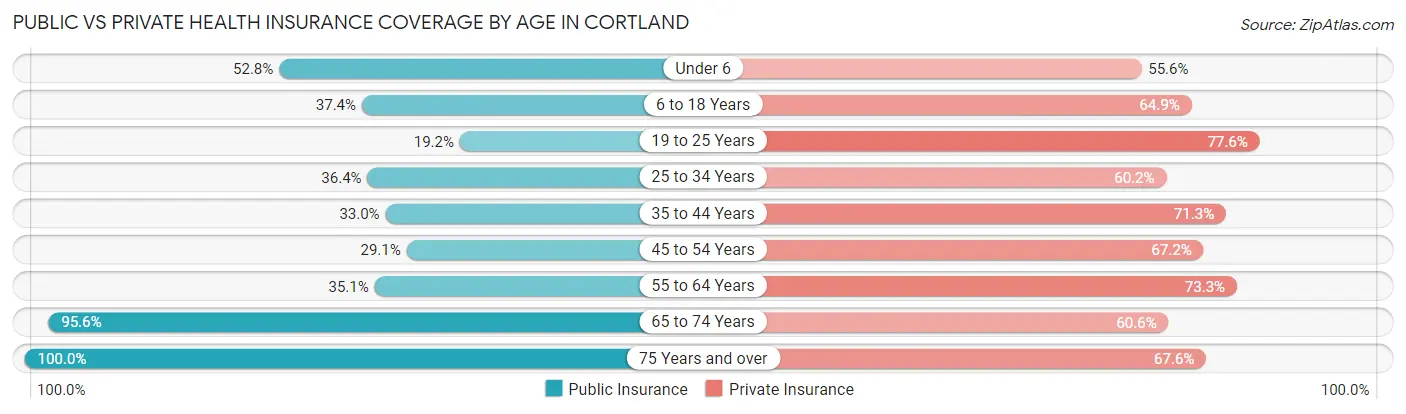
| Age Bracket | Public Insurance | Private Insurance |
| Under 6 | 373 (52.8%) | 393 (55.6%) |
| 6 to 18 Years | 996 (37.4%) | 1,729 (64.9%) |
| 19 to 25 Years | 952 (19.2%) | 3,841 (77.6%) |
| 25 to 34 Years | 751 (36.4%) | 1,244 (60.2%) |
| 35 to 44 Years | 495 (33.0%) | 1,069 (71.3%) |
| 45 to 54 Years | 437 (29.1%) | 1,008 (67.2%) |
| 55 to 64 Years | 618 (35.0%) | 1,293 (73.3%) |
| 65 to 74 Years | 1,236 (95.6%) | 784 (60.6%) |
| 75 Years and over | 738 (100.0%) | 499 (67.6%) |
| Total | 6,596 (38.4%) | 11,860 (69.0%) |
Disability Status by Sex by Age in Cortland
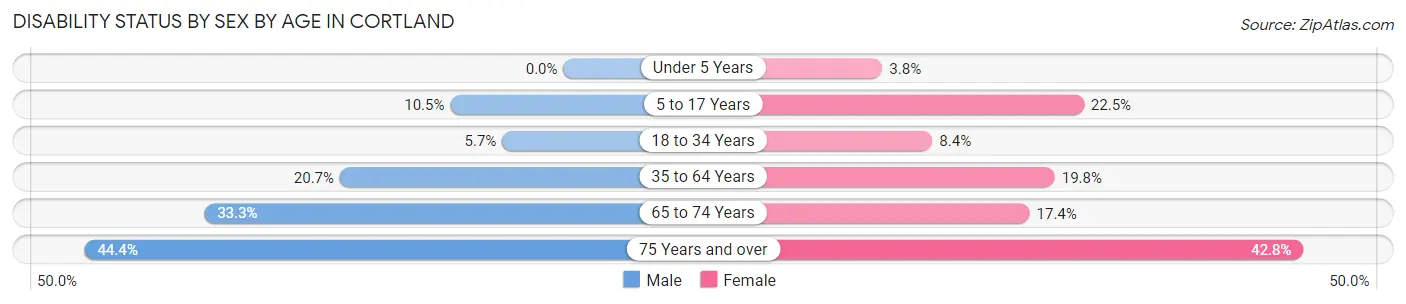
| Age Bracket | Male | Female |
| Under 5 Years | 0 (0.0%) | 11 (3.8%) |
| 5 to 17 Years | 97 (10.5%) | 211 (22.5%) |
| 18 to 34 Years | 204 (5.7%) | 364 (8.4%) |
| 35 to 64 Years | 523 (20.7%) | 443 (19.8%) |
| 65 to 74 Years | 192 (33.3%) | 125 (17.4%) |
| 75 Years and over | 108 (44.4%) | 212 (42.8%) |
Disability Class by Sex by Age in Cortland
Disability Class: Hearing Difficulty
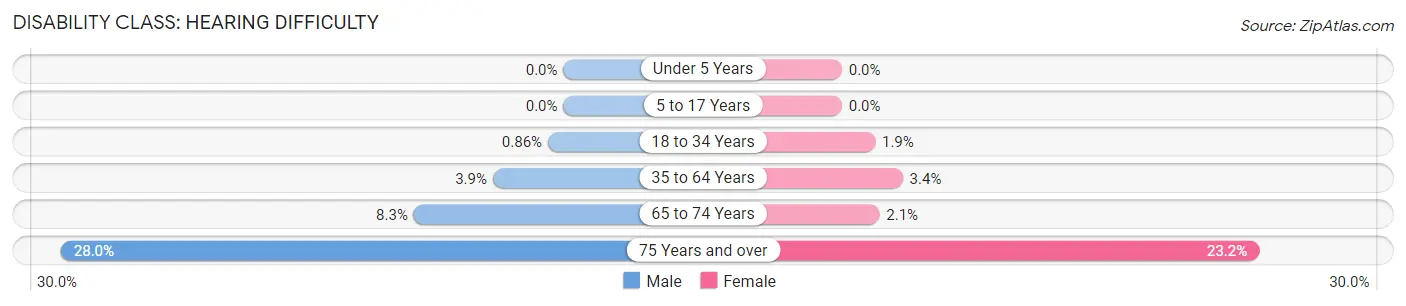
| Age Bracket | Male | Female |
| Under 5 Years | 0 (0.0%) | 0 (0.0%) |
| 5 to 17 Years | 0 (0.0%) | 0 (0.0%) |
| 18 to 34 Years | 31 (0.9%) | 80 (1.8%) |
| 35 to 64 Years | 99 (3.9%) | 76 (3.4%) |
| 65 to 74 Years | 48 (8.3%) | 15 (2.1%) |
| 75 Years and over | 68 (28.0%) | 115 (23.2%) |
Disability Class: Vision Difficulty
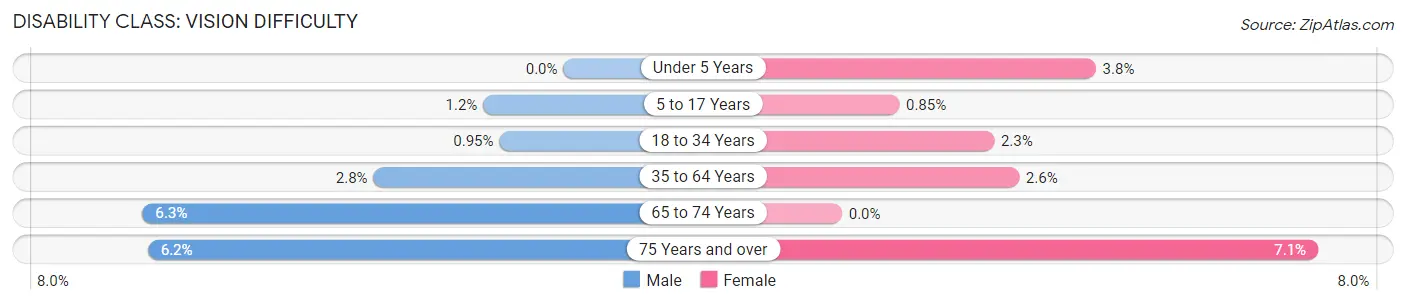
| Age Bracket | Male | Female |
| Under 5 Years | 0 (0.0%) | 11 (3.8%) |
| 5 to 17 Years | 11 (1.2%) | 8 (0.9%) |
| 18 to 34 Years | 34 (0.9%) | 98 (2.3%) |
| 35 to 64 Years | 71 (2.8%) | 59 (2.6%) |
| 65 to 74 Years | 36 (6.2%) | 0 (0.0%) |
| 75 Years and over | 15 (6.2%) | 35 (7.1%) |
Disability Class: Cognitive Difficulty
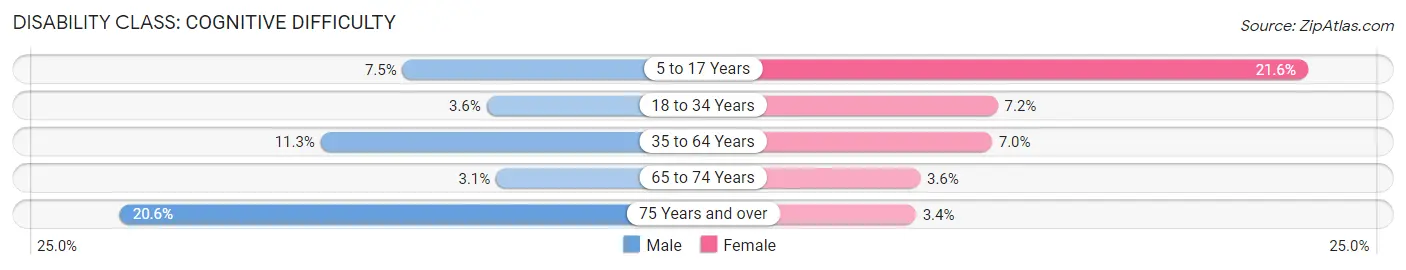
| Age Bracket | Male | Female |
| 5 to 17 Years | 69 (7.5%) | 203 (21.6%) |
| 18 to 34 Years | 128 (3.6%) | 313 (7.2%) |
| 35 to 64 Years | 284 (11.3%) | 156 (7.0%) |
| 65 to 74 Years | 18 (3.1%) | 26 (3.6%) |
| 75 Years and over | 50 (20.6%) | 17 (3.4%) |
Disability Class: Ambulatory Difficulty
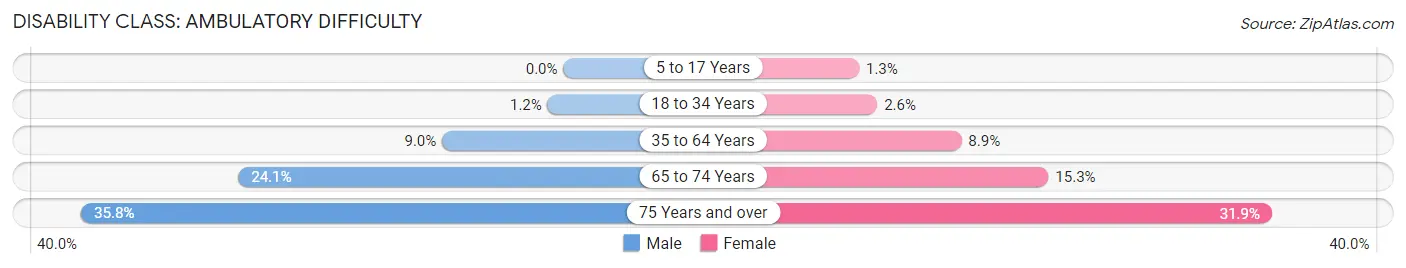
| Age Bracket | Male | Female |
| 5 to 17 Years | 0 (0.0%) | 12 (1.3%) |
| 18 to 34 Years | 42 (1.2%) | 114 (2.6%) |
| 35 to 64 Years | 227 (9.0%) | 199 (8.9%) |
| 65 to 74 Years | 139 (24.1%) | 110 (15.3%) |
| 75 Years and over | 87 (35.8%) | 158 (31.9%) |
Disability Class: Self-Care Difficulty
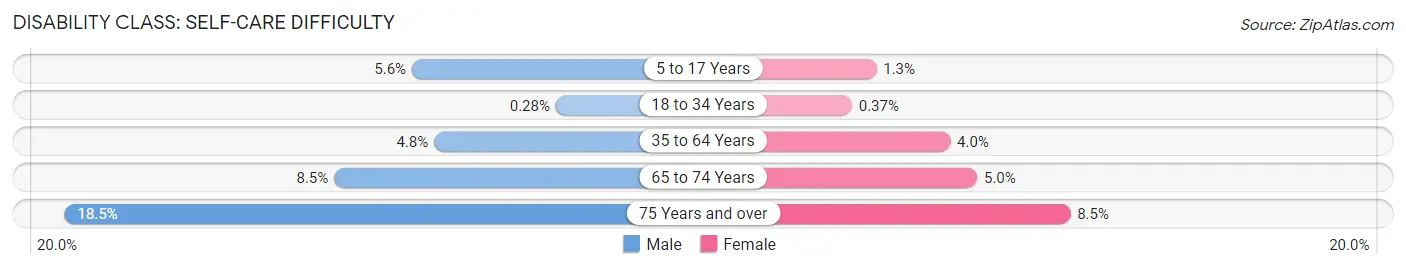
| Age Bracket | Male | Female |
| 5 to 17 Years | 52 (5.6%) | 12 (1.3%) |
| 18 to 34 Years | 10 (0.3%) | 16 (0.4%) |
| 35 to 64 Years | 121 (4.8%) | 90 (4.0%) |
| 65 to 74 Years | 49 (8.5%) | 36 (5.0%) |
| 75 Years and over | 45 (18.5%) | 42 (8.5%) |
Technology Access in Cortland
Computing Device Access in Cortland
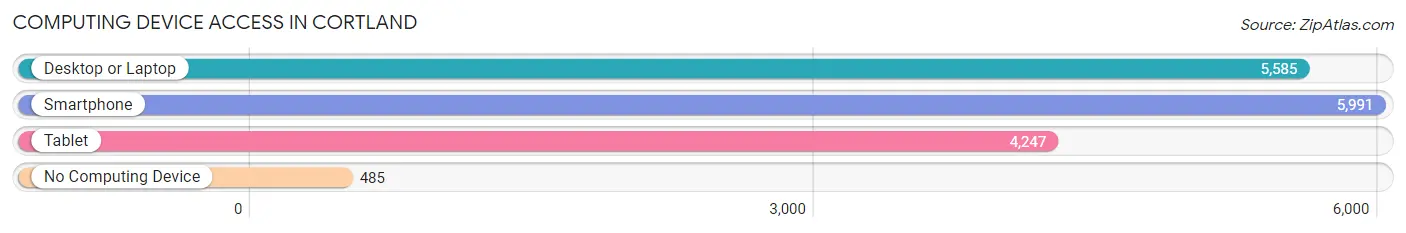
| Device Type | # Households | % Households |
| Desktop or Laptop | 5,585 | 80.5% |
| Smartphone | 5,991 | 86.4% |
| Tablet | 4,247 | 61.3% |
| No Computing Device | 485 | 7.0% |
| Total | 6,934 | 100.0% |
Internet Access in Cortland
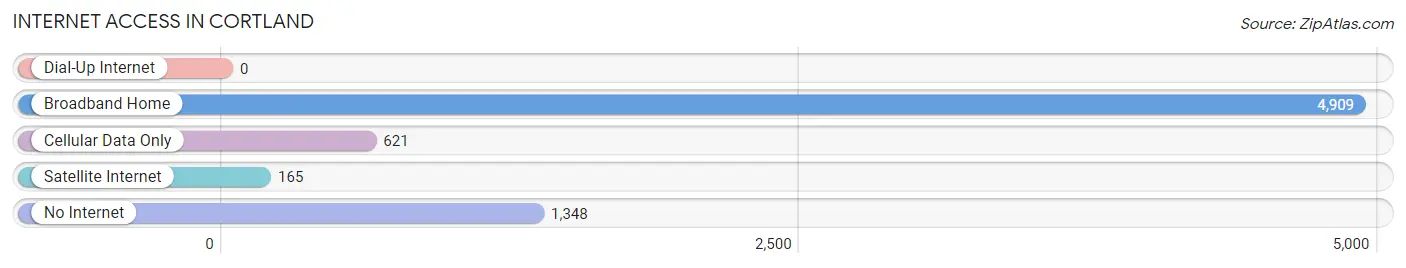
| Internet Type | # Households | % Households |
| Dial-Up Internet | 0 | 0.0% |
| Broadband Home | 4,909 | 70.8% |
| Cellular Data Only | 621 | 9.0% |
| Satellite Internet | 165 | 2.4% |
| No Internet | 1,348 | 19.4% |
| Total | 6,934 | 100.0% |
Cortland Summary
Cortland, New York is a city located in Cortland County in the state of New York. It is situated in the Finger Lakes region of the state, and is the county seat of Cortland County. The city has a population of 19,204 as of the 2010 census, and is the largest city in the county.
Geography
Cortland is located in the Finger Lakes region of New York, in the south-central part of the state. It is situated in the valley of the Tioughnioga River, which flows through the city. The city is located at the intersection of Interstate 81 and New York State Route 13. The city is surrounded by the towns of Homer, Virgil, and Cortlandville. The city is located approximately 30 miles south of Syracuse, and is about a two-hour drive from both Buffalo and Albany.
The city has a total area of 5.2 square miles, of which 5.1 square miles is land and 0.1 square miles is water. The terrain of the city is mostly flat, with some rolling hills in the surrounding area.
History
Cortland was first settled in 1791 by settlers from Connecticut. The city was originally known as the Village of Cortlandville, and was incorporated in 1853. The city was named after Pierre Van Cortlandt, the first lieutenant governor of New York.
The city grew rapidly in the late 19th and early 20th centuries, due to its location on the New York Central Railroad. The city was a major center for the production of furniture, and was home to several large furniture factories. The city also became a major center for the production of paper products, and was home to several paper mills.
The city was also home to several large manufacturing companies, including the Cortland Manufacturing Company, which produced a variety of products, including bicycles, automobiles, and farm equipment. The city was also home to several large shoe factories, which produced shoes for the military during World War II.
Economy
Cortland has a diverse economy, with a variety of industries represented. The city is home to several large manufacturing companies, including Cortland Manufacturing Company, which produces a variety of products, including bicycles, automobiles, and farm equipment. The city is also home to several paper mills, which produce paper products for a variety of industries.
The city is also home to several large retail stores, including Walmart, Target, and Lowe's. The city is also home to several restaurants, bars, and other businesses.
Demographics
As of the 2010 census, the city had a population of 19,204. The racial makeup of the city was 92.3% White, 3.3% African American, 0.3% Native American, 1.2% Asian, 0.1% Pacific Islander, 1.2% from other races, and 1.7% from two or more races. Hispanic or Latino of any race were 4.2% of the population.
The median income for a household in the city was $37,945, and the median income for a family was $45,945. The per capita income for the city was $20,845. About 11.3% of families and 14.2% of the population were below the poverty line, including 19.2% of those under age 18 and 8.2% of those age 65 or over.
Conclusion
Cortland, New York is a city located in Cortland County in the state of New York. It is situated in the Finger Lakes region of the state, and is the county seat of Cortland County. The city has a population of 19,204 as of the 2010 census, and is the largest city in the county. The city has a diverse economy, with a variety of industries represented. The city is home to several large manufacturing companies, including Cortland Manufacturing Company, which produces a variety of products, including bicycles, automobiles, and farm equipment. The city is also home to several paper mills, which produce paper products for a variety of industries. The city is also home to several large retail stores, including Walmart, Target, and Lowe's. The city is also home to several restaurants, bars, and other businesses. The median income for a household in the city was $37,945, and the median income for a family was $45,945. The per capita income for the city was $20,845. About 11.3% of families and 14.2% of the population were below the poverty line, including 19.2% of those under age 18 and 8.2% of those age 65 or over.
Common Questions
What is Per Capita Income in Cortland?
Per Capita income in Cortland is $26,198.
What is the Median Family Income in Cortland?
Median Family Income in Cortland is $74,406.
What is the Median Household income in Cortland?
Median Household Income in Cortland is $55,042.
What is Income or Wage Gap in Cortland?
Income or Wage Gap in Cortland is 33.0%.
Women in Cortland earn 67.0 cents for every dollar earned by a man.
What is Family Income Deficit in Cortland?
Family Income Deficit in Cortland is $10,446.
Families that are below poverty line in Cortland earn $10,446 less on average than the poverty threshold level.
What is Inequality or Gini Index in Cortland?
Inequality or Gini Index in Cortland is 0.43.
What is the Total Population of Cortland?
Total Population of Cortland is 17,574.
What is the Total Male Population of Cortland?
Total Male Population of Cortland is 8,408.
What is the Total Female Population of Cortland?
Total Female Population of Cortland is 9,166.
What is the Ratio of Males per 100 Females in Cortland?
There are 91.73 Males per 100 Females in Cortland.
What is the Ratio of Females per 100 Males in Cortland?
There are 109.02 Females per 100 Males in Cortland.
What is the Median Population Age in Cortland?
Median Population Age in Cortland is 27.1 Years.
What is the Average Family Size in Cortland
Average Family Size in Cortland is 2.7 People.
What is the Average Household Size in Cortland
Average Household Size in Cortland is 2.1 People.
How Large is the Labor Force in Cortland?
There are 9,303 People in the Labor Forcein in Cortland.
What is the Percentage of People in the Labor Force in Cortland?
60.4% of People are in the Labor Force in Cortland.
What is the Unemployment Rate in Cortland?
Unemployment Rate in Cortland is 6.5%.