Schuylerville, NY Map & Demographics
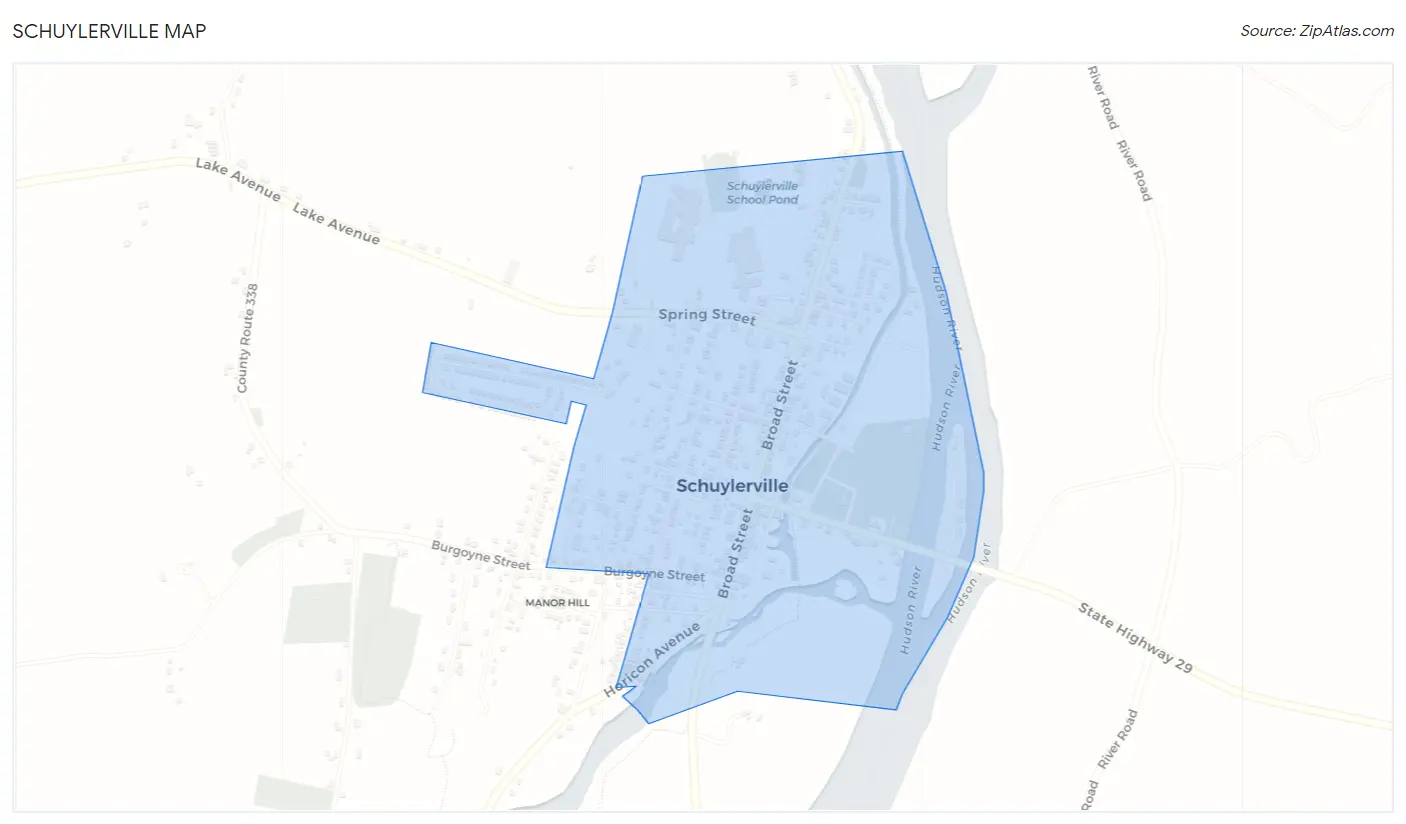
Schuylerville Map
Schuylerville Overview
$35,422
PER CAPITA INCOME
$99,464
AVG FAMILY INCOME
$66,953
AVG HOUSEHOLD INCOME
25.4%
WAGE / INCOME GAP [ % ]
74.6¢/ $1
WAGE / INCOME GAP [ $ ]
0.43
INEQUALITY / GINI INDEX
1,640
TOTAL POPULATION
870
MALE POPULATION
770
FEMALE POPULATION
112.99
MALES / 100 FEMALES
88.51
FEMALES / 100 MALES
34.9
MEDIAN AGE
3.2
AVG FAMILY SIZE
2.3
AVG HOUSEHOLD SIZE
908
LABOR FORCE [ PEOPLE ]
70.4%
PERCENT IN LABOR FORCE
3.0%
UNEMPLOYMENT RATE
Schuylerville Zip Codes
Schuylerville Area Codes
Income in Schuylerville
Income Overview in Schuylerville
Per Capita Income in Schuylerville is $35,422, while median incomes of families and households are $99,464 and $66,953 respectively.
| Characteristic | Number | Measure |
| Per Capita Income | 1,640 | $35,422 |
| Median Family Income | 379 | $99,464 |
| Mean Family Income | 379 | $109,740 |
| Median Household Income | 695 | $66,953 |
| Mean Household Income | 695 | $83,151 |
| Income Deficit | 379 | $0 |
| Wage / Income Gap (%) | 1,640 | 25.38% |
| Wage / Income Gap ($) | 1,640 | 74.62¢ per $1 |
| Gini / Inequality Index | 1,640 | 0.43 |
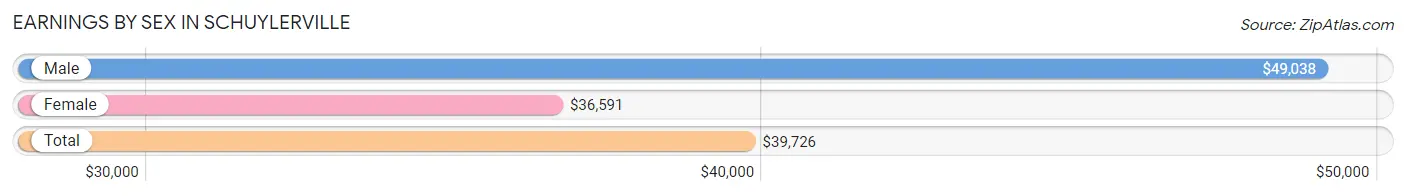
Earnings by Sex in Schuylerville
Average Earnings in Schuylerville are $39,726, $49,038 for men and $36,591 for women, a difference of 25.4%.
| Sex | Number | Average Earnings |
| Male | 562 (57.4%) | $49,038 |
| Female | 418 (42.6%) | $36,591 |
| Total | 980 (100.0%) | $39,726 |
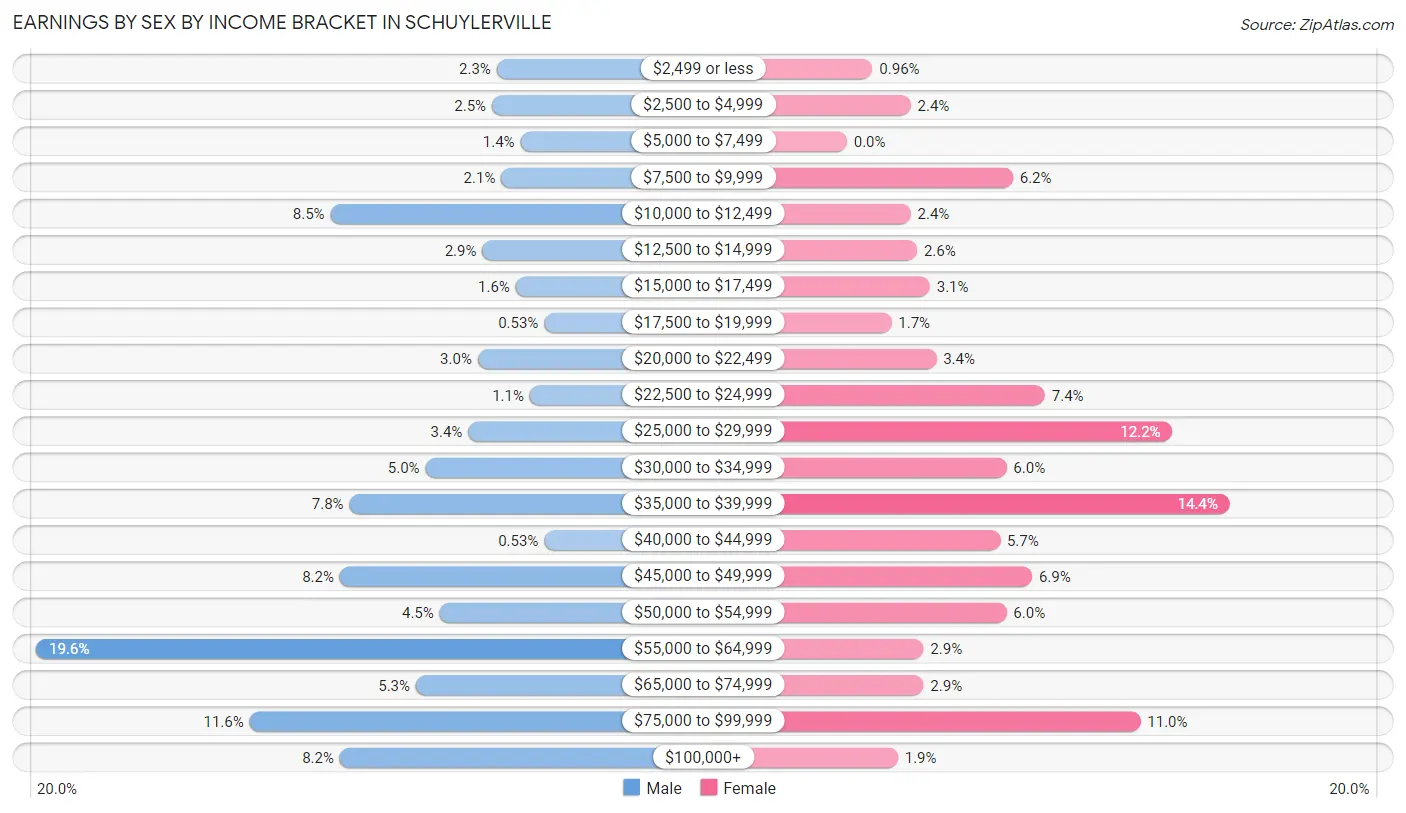
Earnings by Sex by Income Bracket in Schuylerville
The most common earnings brackets in Schuylerville are $55,000 to $64,999 for men (110 | 19.6%) and $35,000 to $39,999 for women (60 | 14.3%).
| Income | Male | Female |
| $2,499 or less | 13 (2.3%) | 4 (1.0%) |
| $2,500 to $4,999 | 14 (2.5%) | 10 (2.4%) |
| $5,000 to $7,499 | 8 (1.4%) | 0 (0.0%) |
| $7,500 to $9,999 | 12 (2.1%) | 26 (6.2%) |
| $10,000 to $12,499 | 48 (8.5%) | 10 (2.4%) |
| $12,500 to $14,999 | 16 (2.9%) | 11 (2.6%) |
| $15,000 to $17,499 | 9 (1.6%) | 13 (3.1%) |
| $17,500 to $19,999 | 3 (0.5%) | 7 (1.7%) |
| $20,000 to $22,499 | 17 (3.0%) | 14 (3.4%) |
| $22,500 to $24,999 | 6 (1.1%) | 31 (7.4%) |
| $25,000 to $29,999 | 19 (3.4%) | 51 (12.2%) |
| $30,000 to $34,999 | 28 (5.0%) | 25 (6.0%) |
| $35,000 to $39,999 | 44 (7.8%) | 60 (14.3%) |
| $40,000 to $44,999 | 3 (0.5%) | 24 (5.7%) |
| $45,000 to $49,999 | 46 (8.2%) | 29 (6.9%) |
| $50,000 to $54,999 | 25 (4.4%) | 25 (6.0%) |
| $55,000 to $64,999 | 110 (19.6%) | 12 (2.9%) |
| $65,000 to $74,999 | 30 (5.3%) | 12 (2.9%) |
| $75,000 to $99,999 | 65 (11.6%) | 46 (11.0%) |
| $100,000+ | 46 (8.2%) | 8 (1.9%) |
| Total | 562 (100.0%) | 418 (100.0%) |
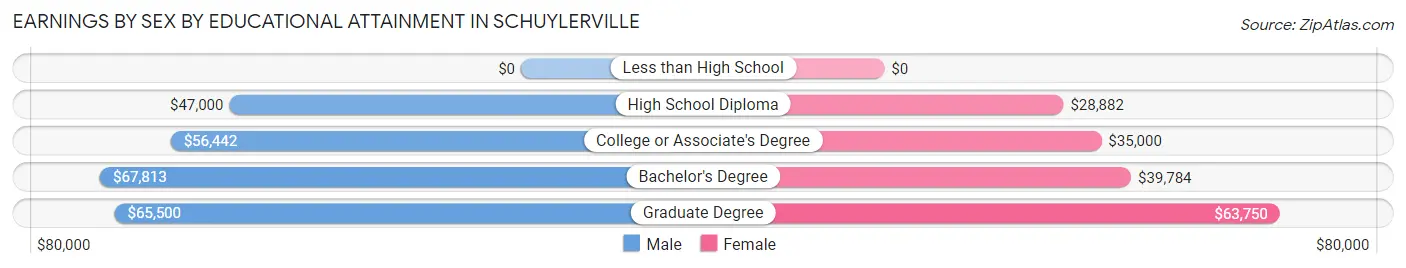
Earnings by Sex by Educational Attainment in Schuylerville
Average earnings in Schuylerville are $56,987 for men and $38,291 for women, a difference of 32.8%. Men with an educational attainment of bachelor's degree enjoy the highest average annual earnings of $67,813, while those with high school diploma education earn the least with $47,000. Women with an educational attainment of graduate degree earn the most with the average annual earnings of $63,750, while those with high school diploma education have the smallest earnings of $28,882.
| Educational Attainment | Male Income | Female Income |
| Less than High School | - | - |
| High School Diploma | $47,000 | $28,882 |
| College or Associate's Degree | $56,442 | $35,000 |
| Bachelor's Degree | $67,813 | $39,784 |
| Graduate Degree | $65,500 | $63,750 |
| Total | $56,987 | $38,291 |
Family Income in Schuylerville
Family Income Brackets in Schuylerville
According to the Schuylerville family income data, there are 133 families falling into the $100,000 to $149,999 income range, which is the most common income bracket and makes up 35.1% of all families.
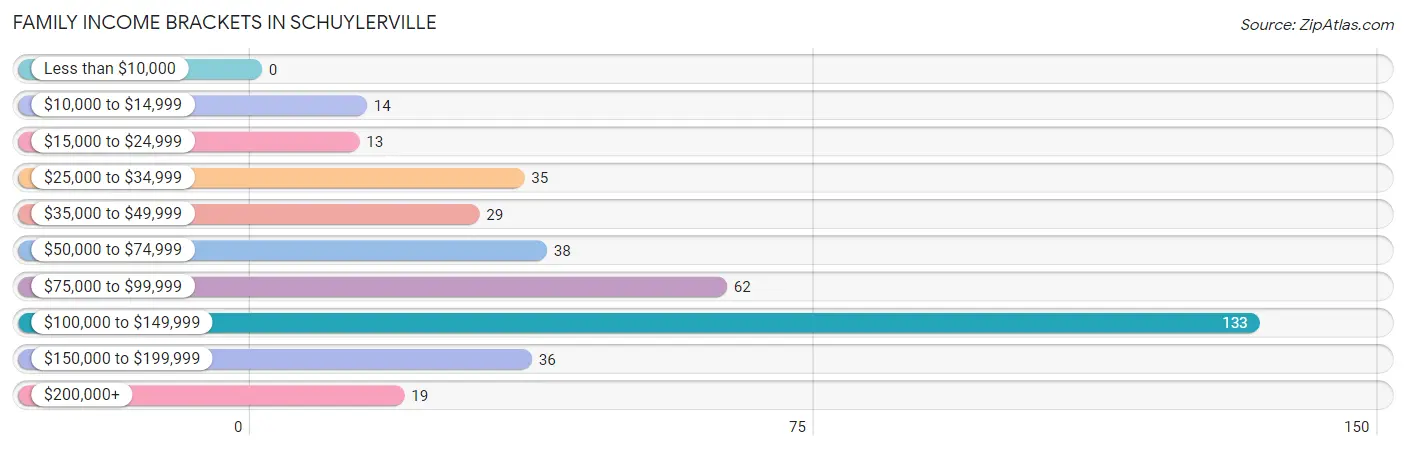
| Income Bracket | # Families | % Families |
| Less than $10,000 | 0 | 0.0% |
| $10,000 to $14,999 | 14 | 3.7% |
| $15,000 to $24,999 | 13 | 3.4% |
| $25,000 to $34,999 | 35 | 9.2% |
| $35,000 to $49,999 | 29 | 7.7% |
| $50,000 to $74,999 | 38 | 10.0% |
| $75,000 to $99,999 | 62 | 16.4% |
| $100,000 to $149,999 | 133 | 35.1% |
| $150,000 to $199,999 | 36 | 9.5% |
| $200,000+ | 19 | 5.0% |
Family Income by Famaliy Size in Schuylerville
5-person families (35 | 9.2%) account for the highest median family income in Schuylerville with $140,104 per family, while 2-person families (123 | 32.5%) have the highest median income of $42,708 per family member.
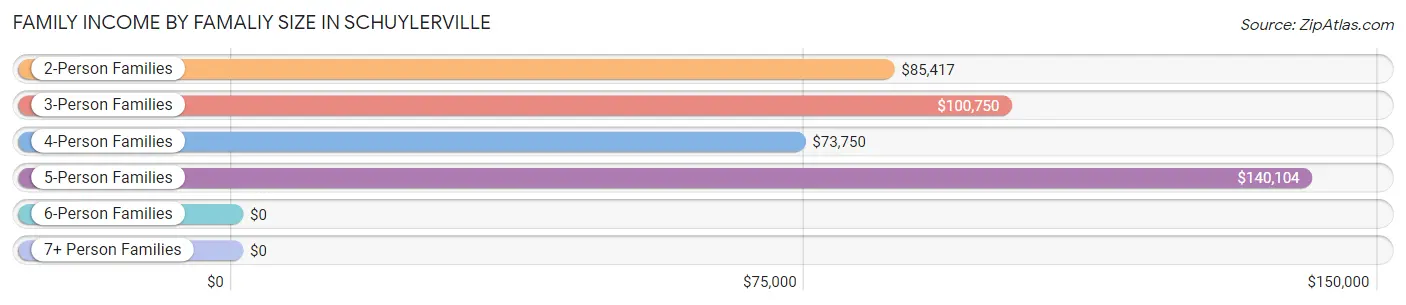
| Income Bracket | # Families | Median Income |
| 2-Person Families | 123 (32.5%) | $85,417 |
| 3-Person Families | 129 (34.0%) | $100,750 |
| 4-Person Families | 74 (19.5%) | $73,750 |
| 5-Person Families | 35 (9.2%) | $140,104 |
| 6-Person Families | 14 (3.7%) | $0 |
| 7+ Person Families | 4 (1.1%) | $0 |
| Total | 379 (100.0%) | $99,464 |
Family Income by Number of Earners in Schuylerville
The median family income in Schuylerville is $99,464, with families comprising 3+ earners (60) having the highest median family income of $141,833, while families with no earners (17) have the lowest median family income of $36,875, accounting for 15.8% and 4.5% of families, respectively.
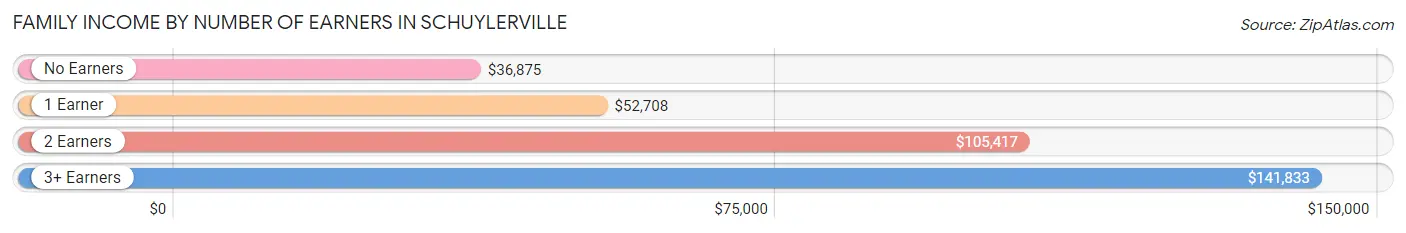
| Number of Earners | # Families | Median Income |
| No Earners | 17 (4.5%) | $36,875 |
| 1 Earner | 125 (33.0%) | $52,708 |
| 2 Earners | 177 (46.7%) | $105,417 |
| 3+ Earners | 60 (15.8%) | $141,833 |
| Total | 379 (100.0%) | $99,464 |
Household Income in Schuylerville
Household Income Brackets in Schuylerville
With 139 households falling in the category, the $100,000 to $149,999 income range is the most frequent in Schuylerville, accounting for 20.0% of all households. In contrast, only 21 households (3.0%) fall into the less than $10,000 income bracket, making it the least populous group.
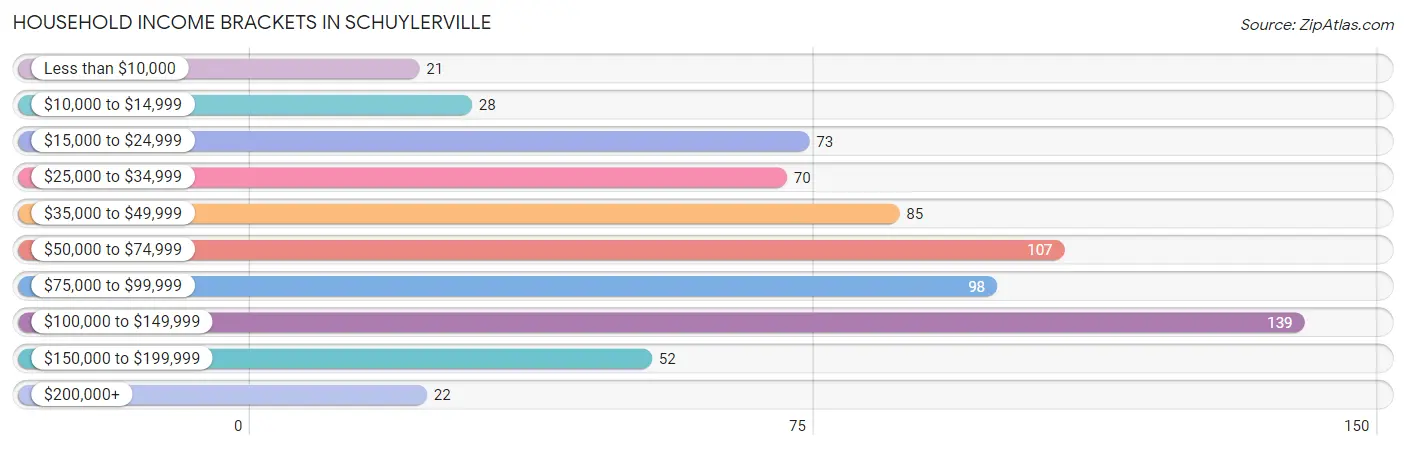
| Income Bracket | # Households | % Households |
| Less than $10,000 | 21 | 3.0% |
| $10,000 to $14,999 | 28 | 4.0% |
| $15,000 to $24,999 | 73 | 10.5% |
| $25,000 to $34,999 | 70 | 10.1% |
| $35,000 to $49,999 | 85 | 12.2% |
| $50,000 to $74,999 | 107 | 15.4% |
| $75,000 to $99,999 | 98 | 14.1% |
| $100,000 to $149,999 | 139 | 20.0% |
| $150,000 to $199,999 | 52 | 7.5% |
| $200,000+ | 22 | 3.2% |
Household Income by Householder Age in Schuylerville
The median household income in Schuylerville is $66,953, with the highest median household income of $81,458 found in the 25 to 44 years age bracket for the primary householder. A total of 265 households (38.1%) fall into this category. Meanwhile, the 65+ years age bracket for the primary householder has the lowest median household income of $37,875, with 161 households (23.2%) in this group.
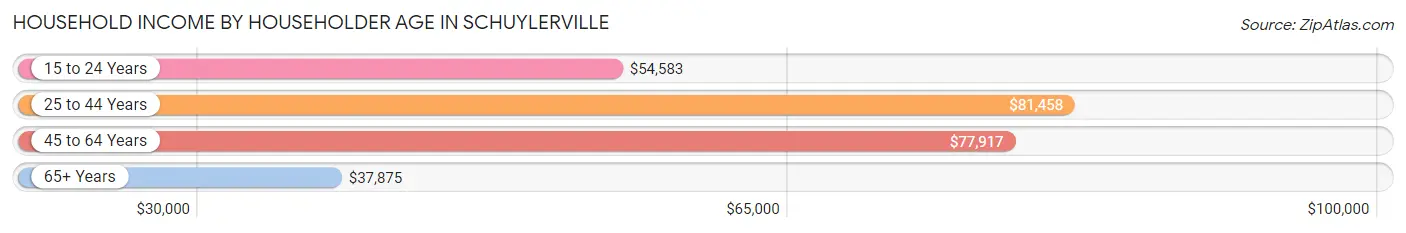
| Income Bracket | # Households | Median Income |
| 15 to 24 Years | 26 (3.7%) | $54,583 |
| 25 to 44 Years | 265 (38.1%) | $81,458 |
| 45 to 64 Years | 243 (35.0%) | $77,917 |
| 65+ Years | 161 (23.2%) | $37,875 |
| Total | 695 (100.0%) | $66,953 |
Poverty in Schuylerville
Income Below Poverty by Sex and Age in Schuylerville
With 9.5% poverty level for males and 8.8% for females among the residents of Schuylerville, under 5 year old males and 5 year old females are the most vulnerable to poverty, with 17 males (32.7%) and 4 females (100.0%) in their respective age groups living below the poverty level.
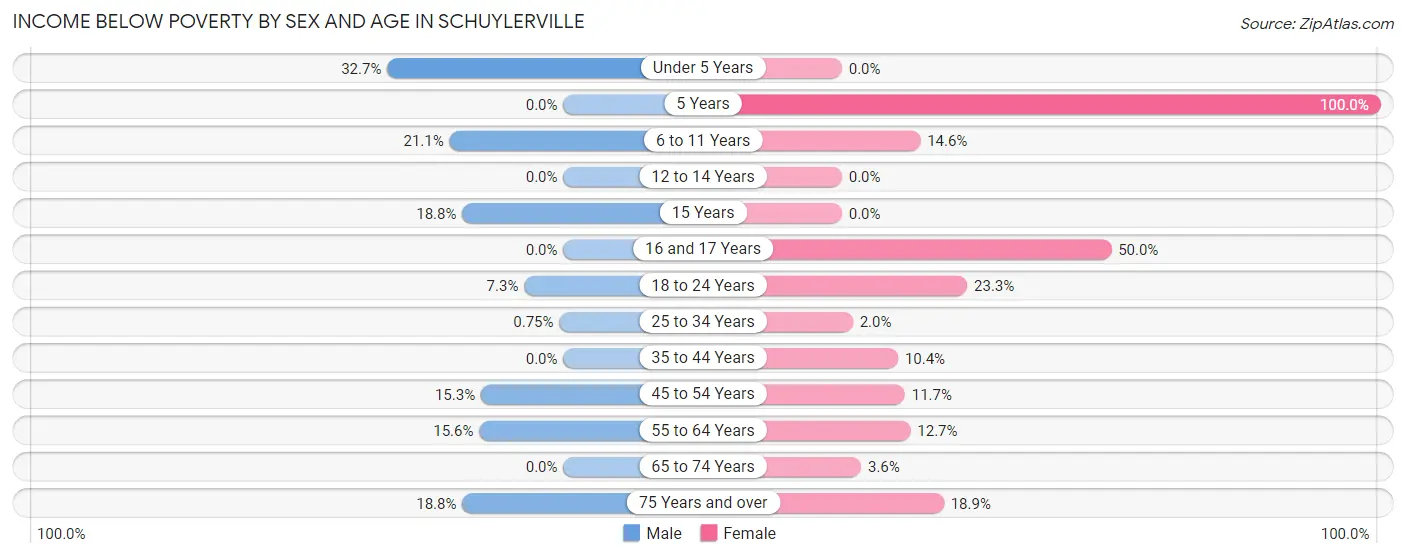
| Age Bracket | Male | Female |
| Under 5 Years | 17 (32.7%) | 0 (0.0%) |
| 5 Years | 0 (0.0%) | 4 (100.0%) |
| 6 to 11 Years | 15 (21.1%) | 8 (14.5%) |
| 12 to 14 Years | 0 (0.0%) | 0 (0.0%) |
| 15 Years | 3 (18.8%) | 0 (0.0%) |
| 16 and 17 Years | 0 (0.0%) | 4 (50.0%) |
| 18 to 24 Years | 9 (7.3%) | 10 (23.3%) |
| 25 to 34 Years | 1 (0.7%) | 3 (2.0%) |
| 35 to 44 Years | 0 (0.0%) | 10 (10.4%) |
| 45 to 54 Years | 13 (15.3%) | 11 (11.7%) |
| 55 to 64 Years | 22 (15.6%) | 7 (12.7%) |
| 65 to 74 Years | 0 (0.0%) | 4 (3.6%) |
| 75 Years and over | 3 (18.8%) | 7 (18.9%) |
| Total | 83 (9.5%) | 68 (8.8%) |
Income Above Poverty by Sex and Age in Schuylerville
According to the poverty statistics in Schuylerville, males aged 5 years and females aged under 5 years are the age groups that are most secure financially, with 100.0% of males and 100.0% of females in these age groups living above the poverty line.
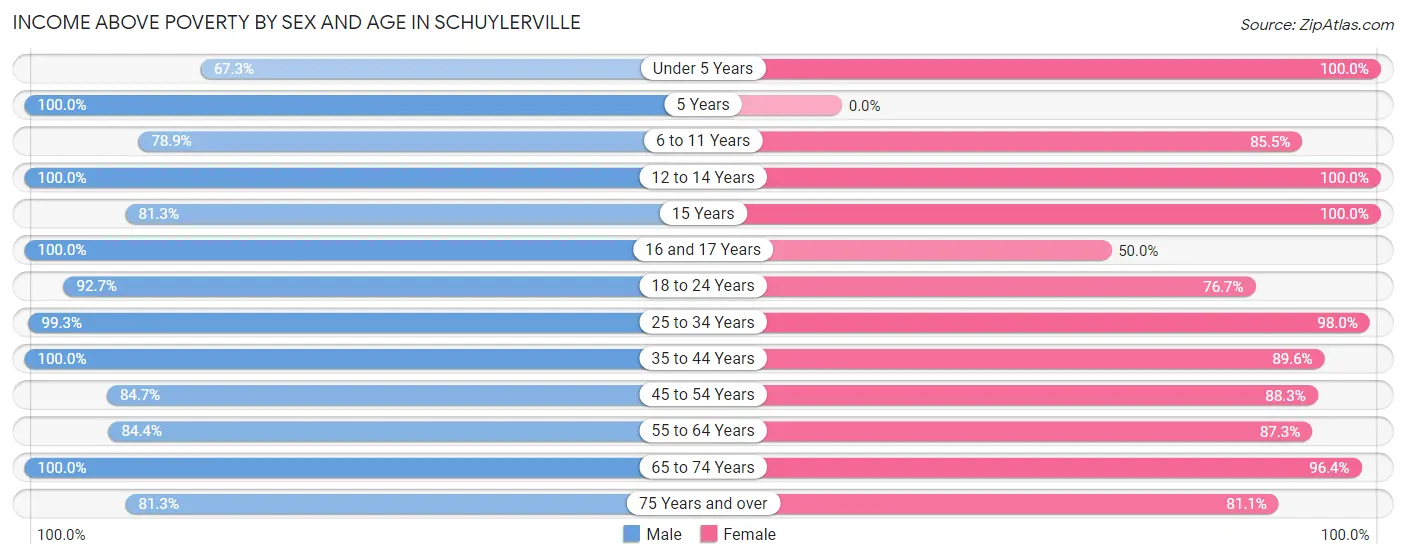
| Age Bracket | Male | Female |
| Under 5 Years | 35 (67.3%) | 54 (100.0%) |
| 5 Years | 4 (100.0%) | 0 (0.0%) |
| 6 to 11 Years | 56 (78.9%) | 47 (85.5%) |
| 12 to 14 Years | 30 (100.0%) | 54 (100.0%) |
| 15 Years | 13 (81.2%) | 10 (100.0%) |
| 16 and 17 Years | 22 (100.0%) | 4 (50.0%) |
| 18 to 24 Years | 115 (92.7%) | 33 (76.7%) |
| 25 to 34 Years | 133 (99.3%) | 145 (98.0%) |
| 35 to 44 Years | 131 (100.0%) | 86 (89.6%) |
| 45 to 54 Years | 72 (84.7%) | 83 (88.3%) |
| 55 to 64 Years | 119 (84.4%) | 48 (87.3%) |
| 65 to 74 Years | 44 (100.0%) | 108 (96.4%) |
| 75 Years and over | 13 (81.2%) | 30 (81.1%) |
| Total | 787 (90.5%) | 702 (91.2%) |
Income Below Poverty Among Married-Couple Families in Schuylerville
The poverty statistics for married-couple families in Schuylerville show that 4.6% or 11 of the total 238 families live below the poverty line. Families with 1 or 2 children have the highest poverty rate of 9.5%, comprising of 11 families. On the other hand, families with no children have the lowest poverty rate of 0.0%, which includes 0 families.
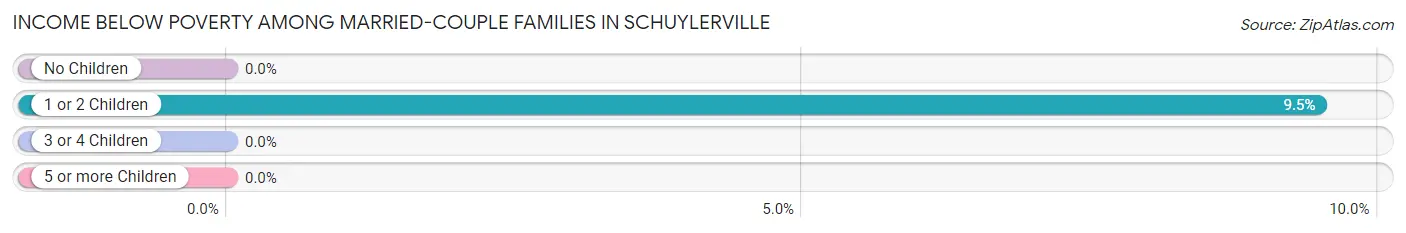
| Children | Above Poverty | Below Poverty |
| No Children | 97 (100.0%) | 0 (0.0%) |
| 1 or 2 Children | 105 (90.5%) | 11 (9.5%) |
| 3 or 4 Children | 21 (100.0%) | 0 (0.0%) |
| 5 or more Children | 4 (100.0%) | 0 (0.0%) |
| Total | 227 (95.4%) | 11 (4.6%) |
Income Below Poverty Among Single-Parent Households in Schuylerville
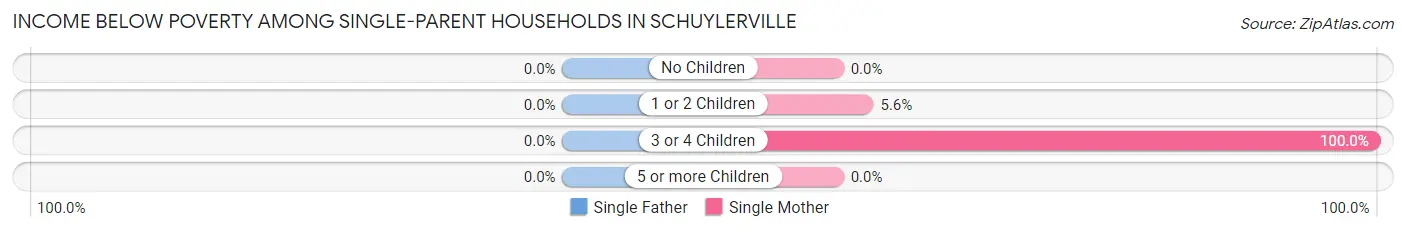
| Children | Single Father | Single Mother |
| No Children | 0 (0.0%) | 0 (0.0%) |
| 1 or 2 Children | 0 (0.0%) | 3 (5.6%) |
| 3 or 4 Children | 0 (0.0%) | 7 (100.0%) |
| 5 or more Children | 0 (0.0%) | 0 (0.0%) |
| Total | 0 (0.0%) | 10 (10.6%) |
Income Below Poverty Among Married-Couple vs Single-Parent Households in Schuylerville
The poverty data for Schuylerville shows that 11 of the married-couple family households (4.6%) and 10 of the single-parent households (7.1%) are living below the poverty level. Within the married-couple family households, those with 1 or 2 children have the highest poverty rate, with 11 households (9.5%) falling below the poverty line. Among the single-parent households, those with 3 or 4 children have the highest poverty rate, with 7 household (63.6%) living below poverty.
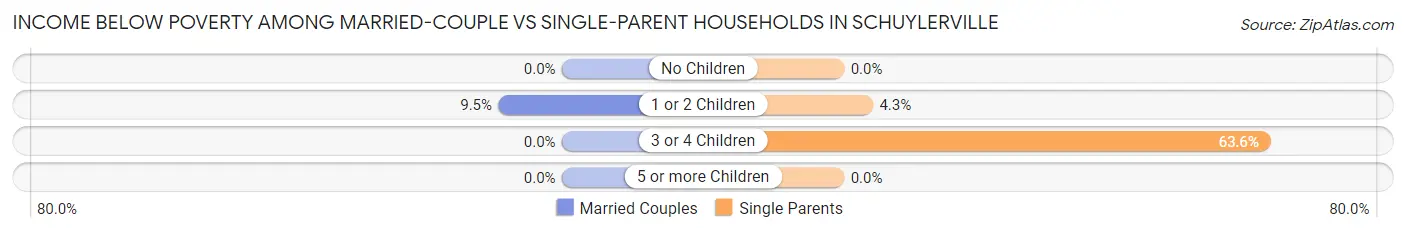
| Children | Married-Couple Families | Single-Parent Households |
| No Children | 0 (0.0%) | 0 (0.0%) |
| 1 or 2 Children | 11 (9.5%) | 3 (4.3%) |
| 3 or 4 Children | 0 (0.0%) | 7 (63.6%) |
| 5 or more Children | 0 (0.0%) | 0 (0.0%) |
| Total | 11 (4.6%) | 10 (7.1%) |
Race in Schuylerville
The most populous races in Schuylerville are White / Caucasian (1,618 | 98.7%), Hispanic or Latino (35 | 2.1%), and Two or more Races (8 | 0.5%).
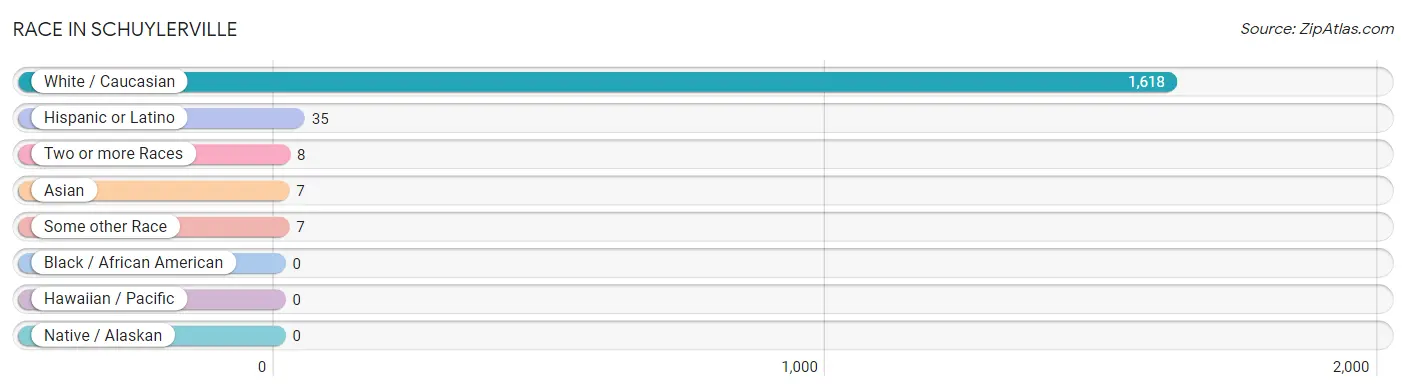
| Race | # Population | % Population |
| Asian | 7 | 0.4% |
| Black / African American | 0 | 0.0% |
| Hawaiian / Pacific | 0 | 0.0% |
| Hispanic or Latino | 35 | 2.1% |
| Native / Alaskan | 0 | 0.0% |
| White / Caucasian | 1,618 | 98.7% |
| Two or more Races | 8 | 0.5% |
| Some other Race | 7 | 0.4% |
| Total | 1,640 | 100.0% |
Ancestry in Schuylerville
The most populous ancestries reported in Schuylerville are Irish (445 | 27.1%), Italian (274 | 16.7%), German (250 | 15.2%), English (182 | 11.1%), and French (180 | 11.0%), together accounting for 81.2% of all Schuylerville residents.
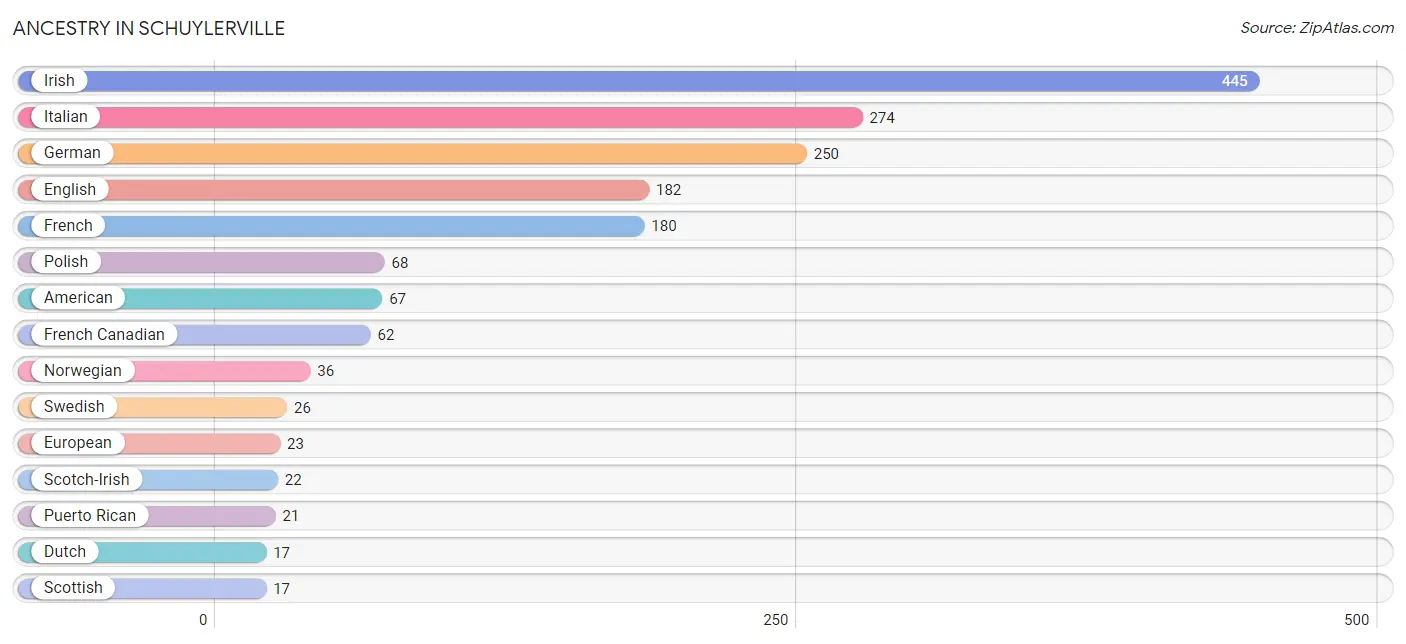
| Ancestry | # Population | % Population |
| American | 67 | 4.1% |
| Armenian | 3 | 0.2% |
| Austrian | 9 | 0.5% |
| British | 4 | 0.2% |
| Burmese | 4 | 0.2% |
| Czech | 16 | 1.0% |
| Danish | 9 | 0.5% |
| Dominican | 2 | 0.1% |
| Dutch | 17 | 1.0% |
| Eastern European | 8 | 0.5% |
| English | 182 | 11.1% |
| European | 23 | 1.4% |
| Finnish | 6 | 0.4% |
| French | 180 | 11.0% |
| French Canadian | 62 | 3.8% |
| German | 250 | 15.2% |
| Greek | 16 | 1.0% |
| Irish | 445 | 27.1% |
| Italian | 274 | 16.7% |
| Korean | 3 | 0.2% |
| Mexican | 9 | 0.5% |
| Norwegian | 36 | 2.2% |
| Polish | 68 | 4.2% |
| Puerto Rican | 21 | 1.3% |
| Russian | 7 | 0.4% |
| Scandinavian | 2 | 0.1% |
| Scotch-Irish | 22 | 1.3% |
| Scottish | 17 | 1.0% |
| Sioux | 3 | 0.2% |
| Slovene | 5 | 0.3% |
| Swedish | 26 | 1.6% |
| Swiss | 15 | 0.9% |
| Ukrainian | 4 | 0.2% |
| Welsh | 5 | 0.3% | View All 34 Rows |
Immigrants in Schuylerville
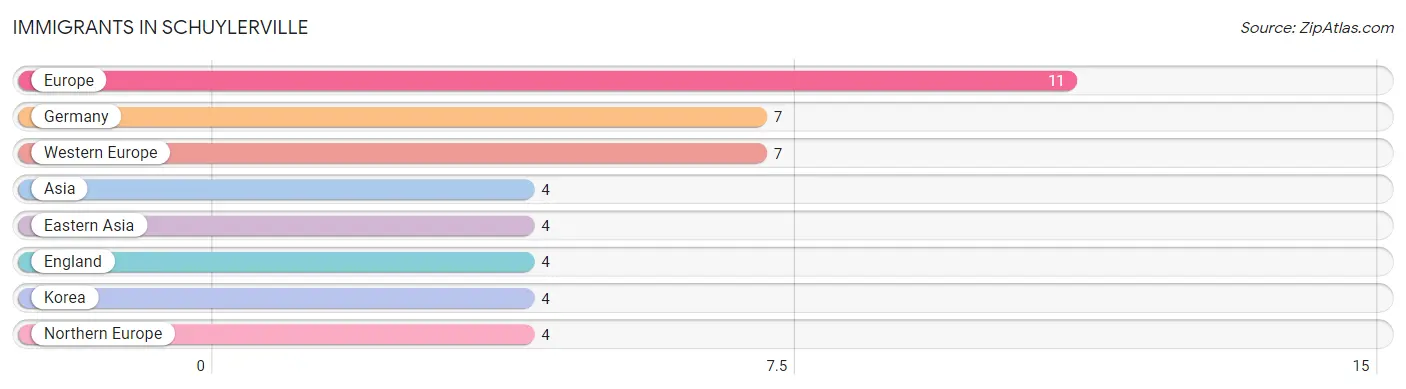
The most numerous immigrant groups reported in Schuylerville came from Europe (11 | 0.7%), Germany (7 | 0.4%), Western Europe (7 | 0.4%), Asia (4 | 0.2%), and Eastern Asia (4 | 0.2%), together accounting for 2.0% of all Schuylerville residents.
| Immigration Origin | # Population | % Population |
| Asia | 4 | 0.2% |
| Eastern Asia | 4 | 0.2% |
| England | 4 | 0.2% |
| Europe | 11 | 0.7% |
| Germany | 7 | 0.4% |
| Korea | 4 | 0.2% |
| Northern Europe | 4 | 0.2% |
| Western Europe | 7 | 0.4% | View All 8 Rows |
Sex and Age in Schuylerville
Sex and Age in Schuylerville
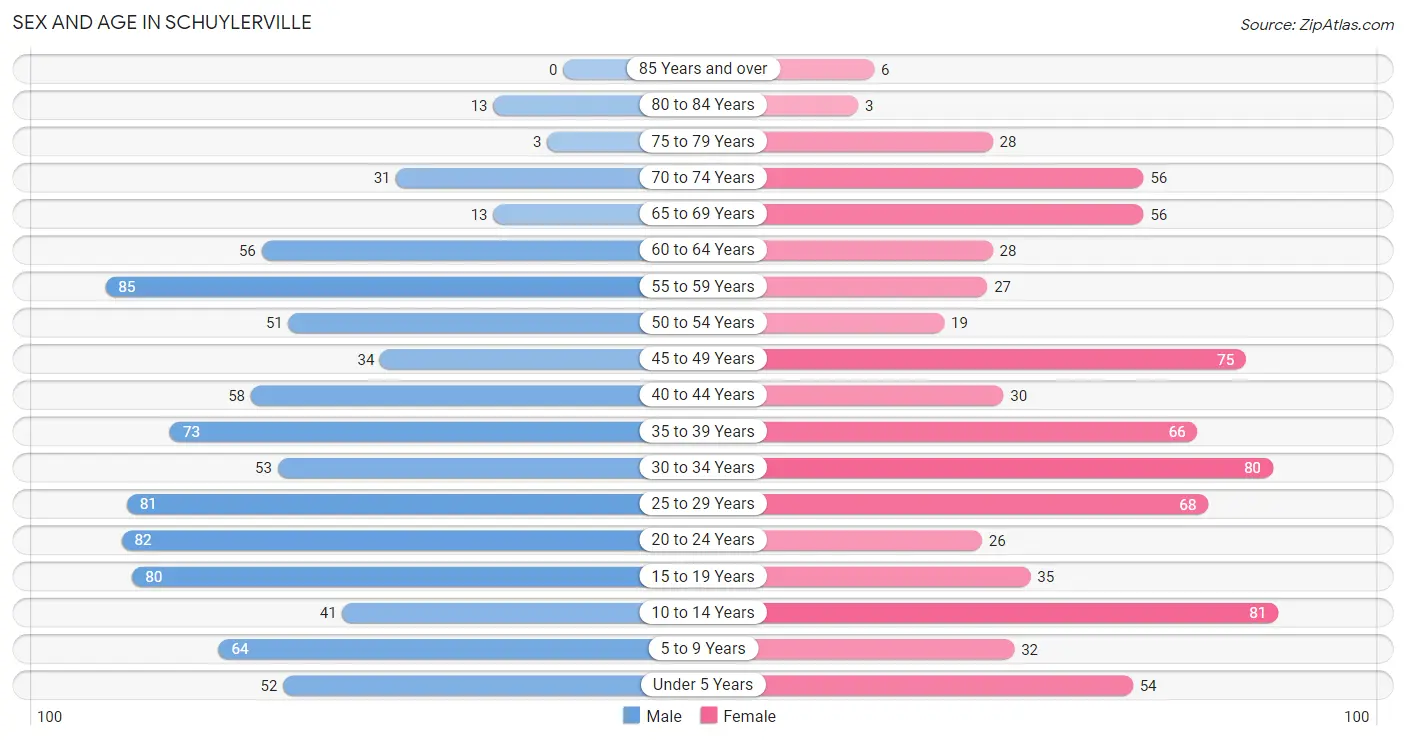
The most populous age groups in Schuylerville are 55 to 59 Years (85 | 9.8%) for men and 10 to 14 Years (81 | 10.5%) for women.
| Age Bracket | Male | Female |
| Under 5 Years | 52 (6.0%) | 54 (7.0%) |
| 5 to 9 Years | 64 (7.4%) | 32 (4.2%) |
| 10 to 14 Years | 41 (4.7%) | 81 (10.5%) |
| 15 to 19 Years | 80 (9.2%) | 35 (4.5%) |
| 20 to 24 Years | 82 (9.4%) | 26 (3.4%) |
| 25 to 29 Years | 81 (9.3%) | 68 (8.8%) |
| 30 to 34 Years | 53 (6.1%) | 80 (10.4%) |
| 35 to 39 Years | 73 (8.4%) | 66 (8.6%) |
| 40 to 44 Years | 58 (6.7%) | 30 (3.9%) |
| 45 to 49 Years | 34 (3.9%) | 75 (9.7%) |
| 50 to 54 Years | 51 (5.9%) | 19 (2.5%) |
| 55 to 59 Years | 85 (9.8%) | 27 (3.5%) |
| 60 to 64 Years | 56 (6.4%) | 28 (3.6%) |
| 65 to 69 Years | 13 (1.5%) | 56 (7.3%) |
| 70 to 74 Years | 31 (3.6%) | 56 (7.3%) |
| 75 to 79 Years | 3 (0.3%) | 28 (3.6%) |
| 80 to 84 Years | 13 (1.5%) | 3 (0.4%) |
| 85 Years and over | 0 (0.0%) | 6 (0.8%) |
| Total | 870 (100.0%) | 770 (100.0%) |
Families and Households in Schuylerville
Median Family Size in Schuylerville
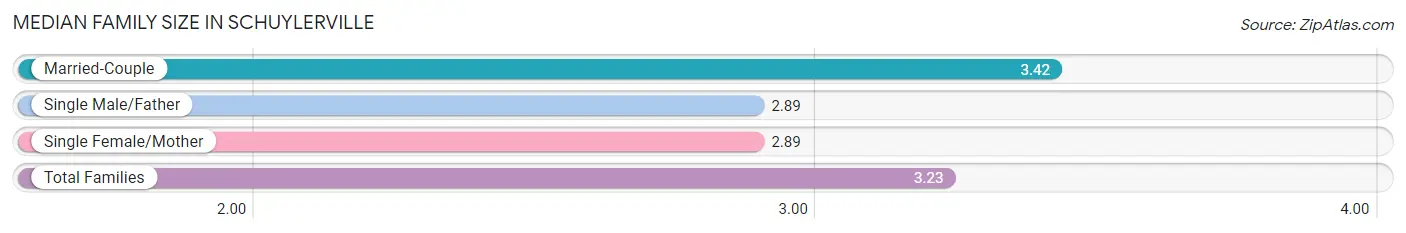
The median family size in Schuylerville is 3.23 persons per family, with married-couple families (238 | 62.8%) accounting for the largest median family size of 3.42 persons per family. On the other hand, single male/father families (47 | 12.4%) represent the smallest median family size with 2.89 persons per family.
| Family Type | # Families | Family Size |
| Married-Couple | 238 (62.8%) | 3.42 |
| Single Male/Father | 47 (12.4%) | 2.89 |
| Single Female/Mother | 94 (24.8%) | 2.89 |
| Total Families | 379 (100.0%) | 3.23 |
Median Household Size in Schuylerville
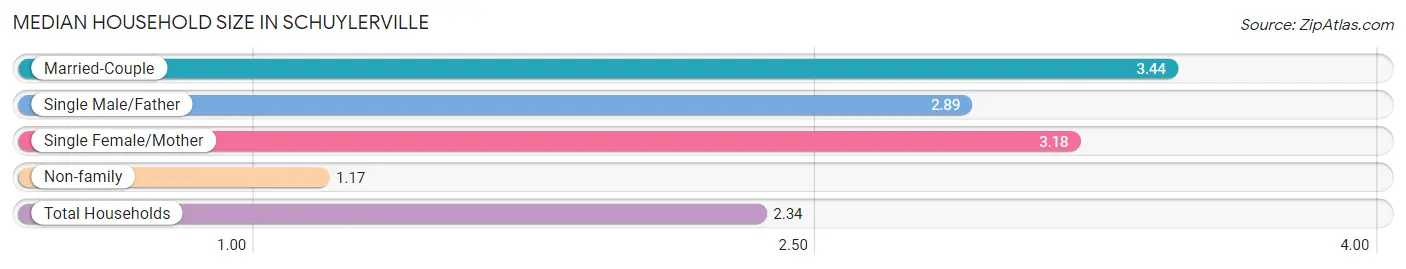
The median household size in Schuylerville is 2.34 persons per household, with married-couple households (238 | 34.2%) accounting for the largest median household size of 3.44 persons per household. non-family households (316 | 45.5%) represent the smallest median household size with 1.17 persons per household.
| Household Type | # Households | Household Size |
| Married-Couple | 238 (34.2%) | 3.44 |
| Single Male/Father | 47 (6.8%) | 2.89 |
| Single Female/Mother | 94 (13.5%) | 3.18 |
| Non-family | 316 (45.5%) | 1.17 |
| Total Households | 695 (100.0%) | 2.34 |
Household Size by Marriage Status in Schuylerville
Out of a total of 695 households in Schuylerville, 379 (54.5%) are family households, while 316 (45.5%) are nonfamily households. The most numerous type of family households are 2-person households, comprising 117, and the most common type of nonfamily households are 1-person households, comprising 271.
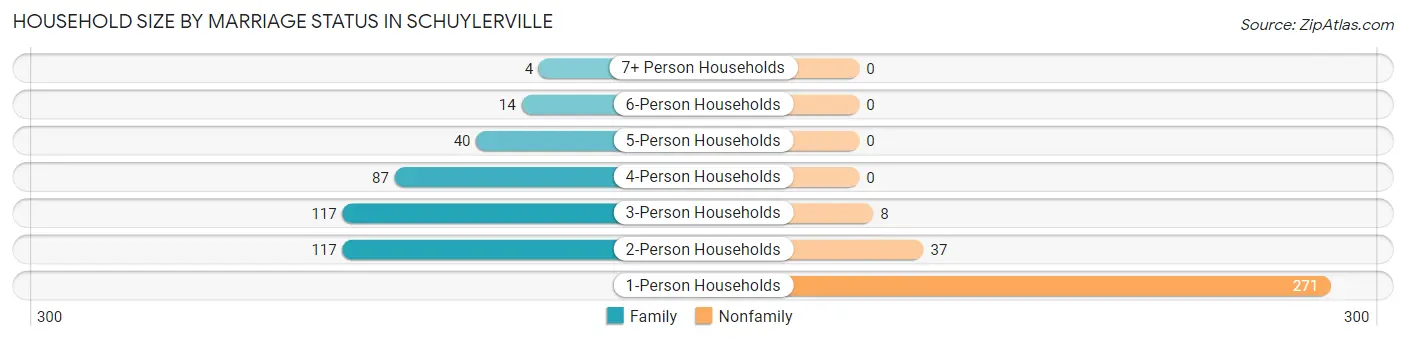
| Household Size | Family Households | Nonfamily Households |
| 1-Person Households | - | 271 (39.0%) |
| 2-Person Households | 117 (16.8%) | 37 (5.3%) |
| 3-Person Households | 117 (16.8%) | 8 (1.1%) |
| 4-Person Households | 87 (12.5%) | 0 (0.0%) |
| 5-Person Households | 40 (5.8%) | 0 (0.0%) |
| 6-Person Households | 14 (2.0%) | 0 (0.0%) |
| 7+ Person Households | 4 (0.6%) | 0 (0.0%) |
| Total | 379 (54.5%) | 316 (45.5%) |
Female Fertility in Schuylerville
Fertility by Age in Schuylerville
Average fertility rate in Schuylerville is 75.0 births per 1,000 women. Women in the age bracket of 20 to 34 years have the highest fertility rate with 144.0 births per 1,000 women. Women in the age bracket of 20 to 34 years acount for 86.2% of all women with births.
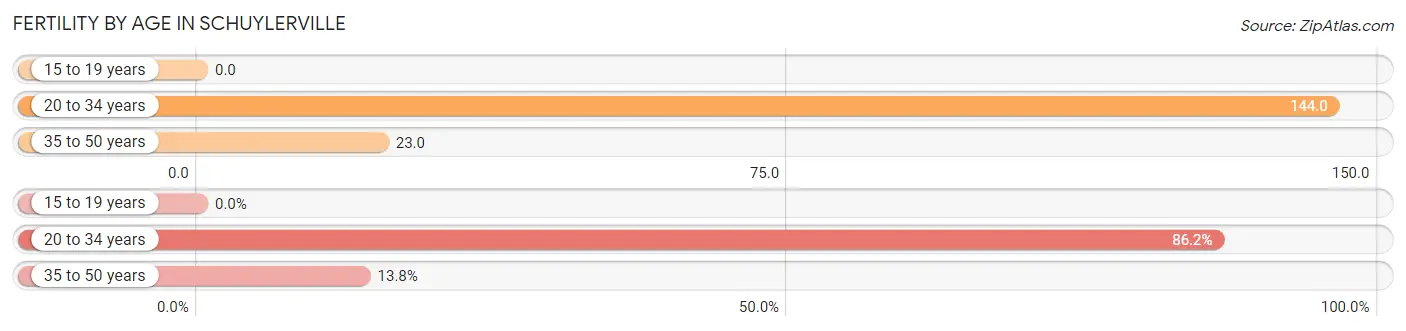
| Age Bracket | Women with Births | Births / 1,000 Women |
| 15 to 19 years | 0 (0.0%) | 0.0 |
| 20 to 34 years | 25 (86.2%) | 144.0 |
| 35 to 50 years | 4 (13.8%) | 23.0 |
| Total | 29 (100.0%) | 75.0 |
Fertility by Age by Marriage Status in Schuylerville
89.7% of women with births (29) in Schuylerville are married. The highest percentage of unmarried women with births falls into 20 to 34 years age bracket with 12.0% of them unmarried at the time of birth, while the lowest percentage of unmarried women with births belong to 35 to 50 years age bracket with 0.0% of them unmarried.
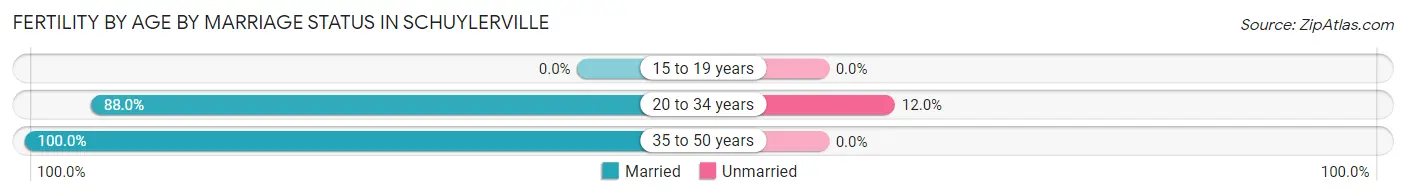
| Age Bracket | Married | Unmarried |
| 15 to 19 years | 0 (0.0%) | 0 (0.0%) |
| 20 to 34 years | 22 (88.0%) | 3 (12.0%) |
| 35 to 50 years | 4 (100.0%) | 0 (0.0%) |
| Total | 26 (89.7%) | 3 (10.3%) |
Fertility by Education in Schuylerville
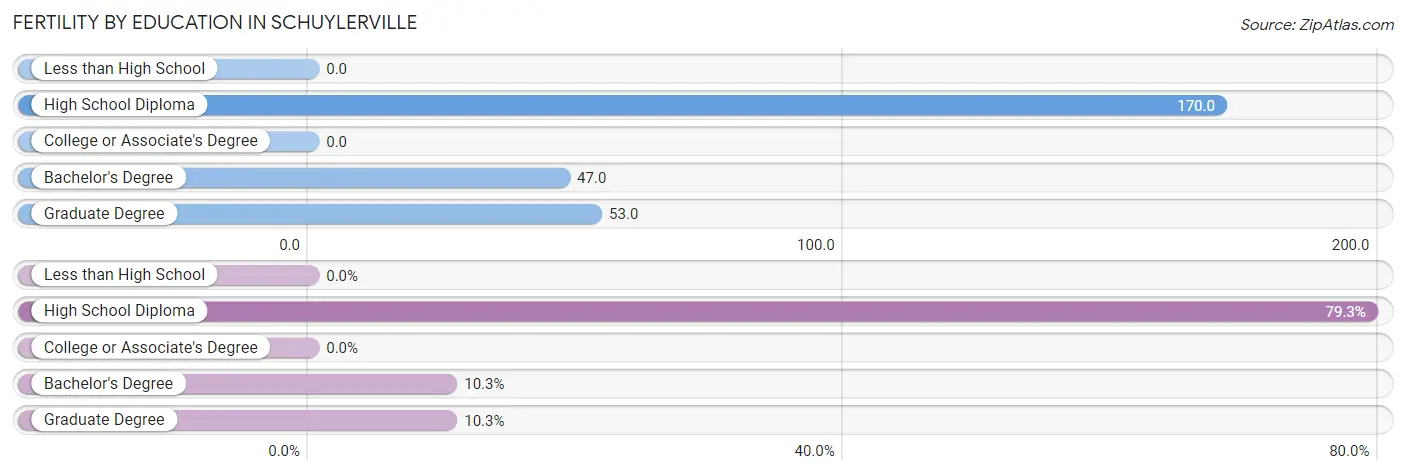
| Educational Attainment | Women with Births | Births / 1,000 Women |
| Less than High School | 0 (0.0%) | 0.0 |
| High School Diploma | 23 (79.3%) | 170.0 |
| College or Associate's Degree | 0 (0.0%) | 0.0 |
| Bachelor's Degree | 3 (10.3%) | 47.0 |
| Graduate Degree | 3 (10.3%) | 53.0 |
| Total | 29 (100.0%) | 75.0 |
Fertility by Education by Marriage Status in Schuylerville
10.3% of women with births in Schuylerville are unmarried. Women with the educational attainment of bachelor's degree are most likely to be married with 100.0% of them married at childbirth, while women with the educational attainment of high school diploma are least likely to be married with 13.0% of them unmarried at childbirth.
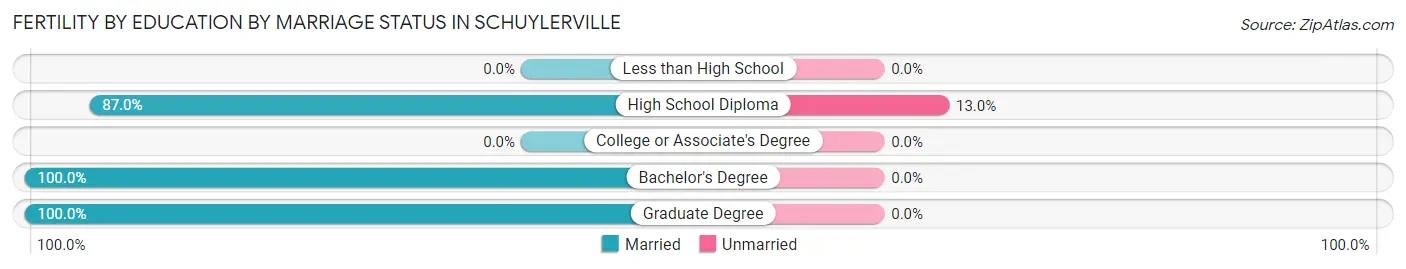
| Educational Attainment | Married | Unmarried |
| Less than High School | 0 (0.0%) | 0 (0.0%) |
| High School Diploma | 20 (87.0%) | 3 (13.0%) |
| College or Associate's Degree | 0 (0.0%) | 0 (0.0%) |
| Bachelor's Degree | 3 (100.0%) | 0 (0.0%) |
| Graduate Degree | 3 (100.0%) | 0 (0.0%) |
| Total | 26 (89.7%) | 3 (10.3%) |
Employment Characteristics in Schuylerville
Employment by Class of Employer in Schuylerville
Among the 852 employed individuals in Schuylerville, private company employees (561 | 65.8%), local government employees (109 | 12.8%), and not-for-profit organizations (62 | 7.3%) make up the most common classes of employment.
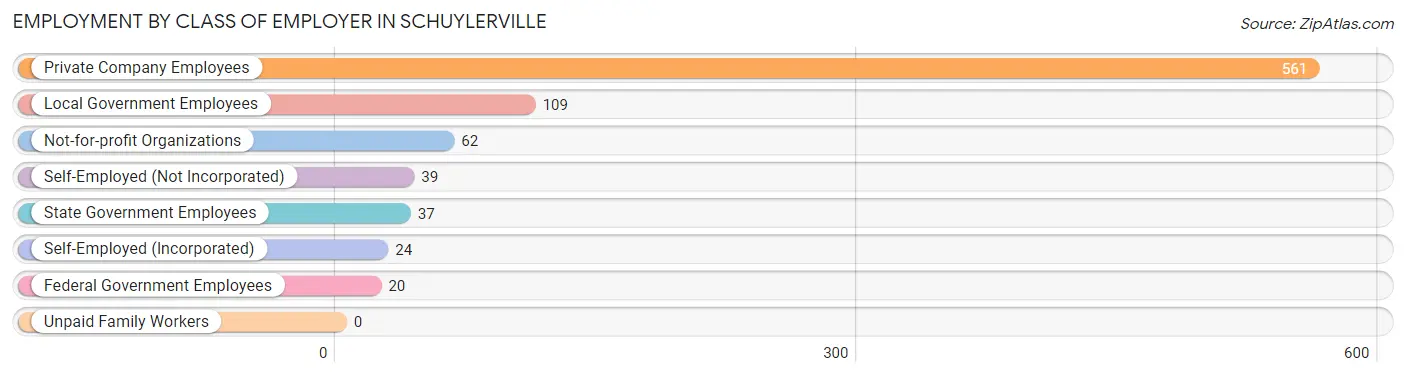
| Employer Class | # Employees | % Employees |
| Private Company Employees | 561 | 65.8% |
| Self-Employed (Incorporated) | 24 | 2.8% |
| Self-Employed (Not Incorporated) | 39 | 4.6% |
| Not-for-profit Organizations | 62 | 7.3% |
| Local Government Employees | 109 | 12.8% |
| State Government Employees | 37 | 4.3% |
| Federal Government Employees | 20 | 2.4% |
| Unpaid Family Workers | 0 | 0.0% |
| Total | 852 | 100.0% |
Employment Status by Age in Schuylerville
According to the labor force statistics for Schuylerville, out of the total population over 16 years of age (1,290), 70.4% or 908 individuals are in the labor force, with 3.0% or 27 of them unemployed. The age group with the highest labor force participation rate is 30 to 34 years, with 96.2% or 128 individuals in the labor force. Within the labor force, the 60 to 64 years age range has the highest percentage of unemployed individuals, with 9.3% or 4 of them being unemployed.
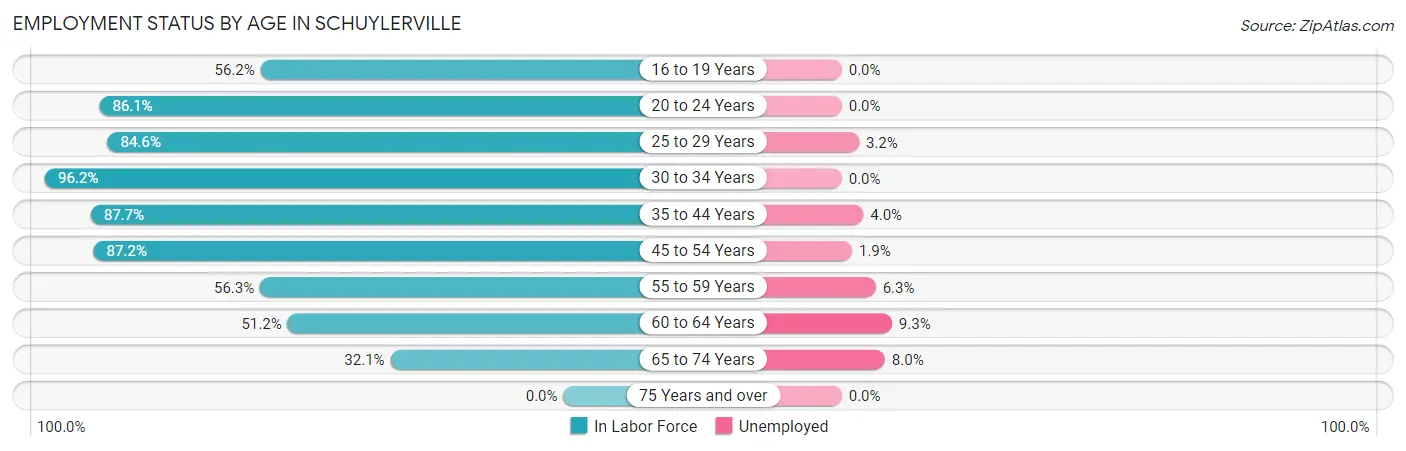
| Age Bracket | In Labor Force | Unemployed |
| 16 to 19 Years | 50 (56.2%) | 0 (0.0%) |
| 20 to 24 Years | 93 (86.1%) | 0 (0.0%) |
| 25 to 29 Years | 126 (84.6%) | 4 (3.2%) |
| 30 to 34 Years | 128 (96.2%) | 0 (0.0%) |
| 35 to 44 Years | 199 (87.7%) | 8 (4.0%) |
| 45 to 54 Years | 156 (87.2%) | 3 (1.9%) |
| 55 to 59 Years | 63 (56.3%) | 4 (6.3%) |
| 60 to 64 Years | 43 (51.2%) | 4 (9.3%) |
| 65 to 74 Years | 50 (32.1%) | 4 (8.0%) |
| 75 Years and over | 0 (0.0%) | 0 (0.0%) |
| Total | 908 (70.4%) | 27 (3.0%) |
Employment Status by Educational Attainment in Schuylerville
According to labor force statistics for Schuylerville, 80.9% of individuals (715) out of the total population between 25 and 64 years of age (884) are in the labor force, with 3.2% or 23 of them being unemployed. The group with the highest labor force participation rate are those with the educational attainment of bachelor's degree or higher, with 95.2% or 257 individuals in the labor force. Within the labor force, individuals with college / associate degree education have the highest percentage of unemployment, with 4.0% or 8 of them being unemployed.
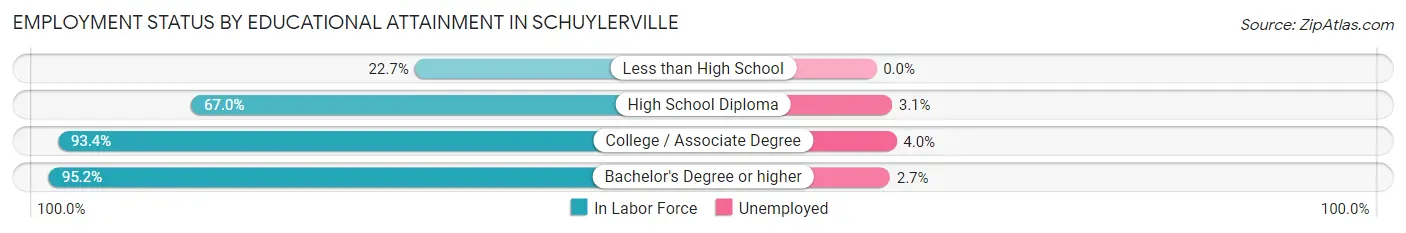
| Educational Attainment | In Labor Force | Unemployed |
| Less than High School | 5 (22.7%) | 0 (0.0%) |
| High School Diploma | 254 (67.0%) | 12 (3.1%) |
| College / Associate Degree | 199 (93.4%) | 9 (4.0%) |
| Bachelor's Degree or higher | 257 (95.2%) | 7 (2.7%) |
| Total | 715 (80.9%) | 28 (3.2%) |
Employment Occupations by Sex in Schuylerville
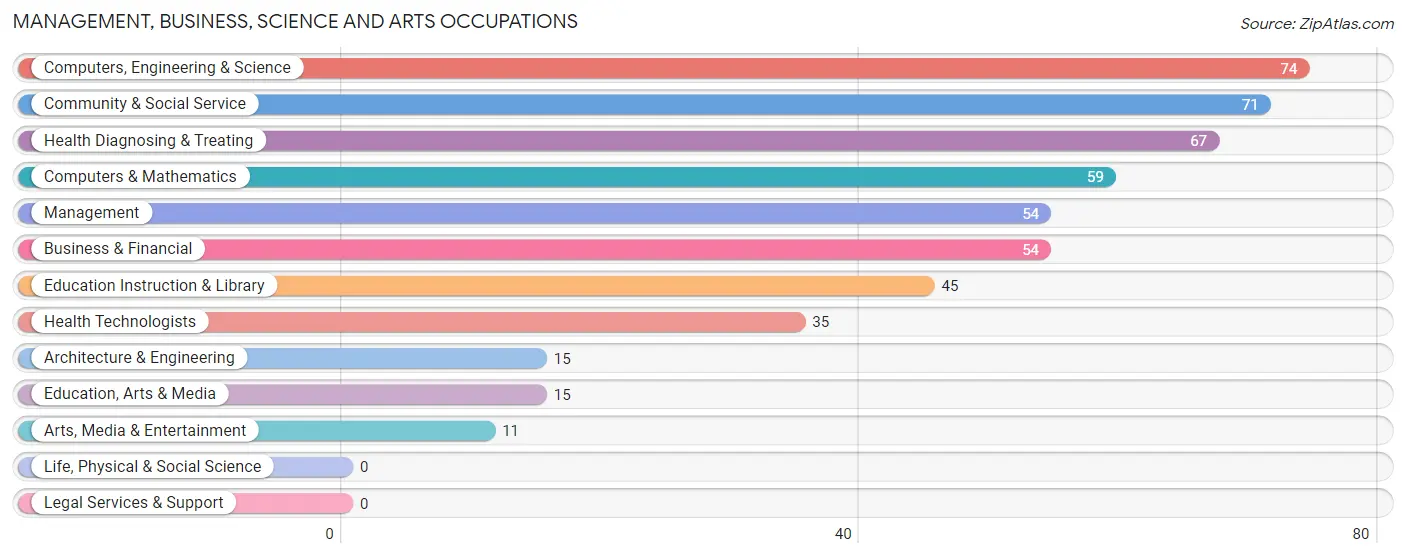
Management, Business, Science and Arts Occupations
The most common Management, Business, Science and Arts occupations in Schuylerville are Computers, Engineering & Science (74 | 8.4%), Community & Social Service (71 | 8.1%), Health Diagnosing & Treating (67 | 7.6%), Computers & Mathematics (59 | 6.7%), and Management (54 | 6.1%).
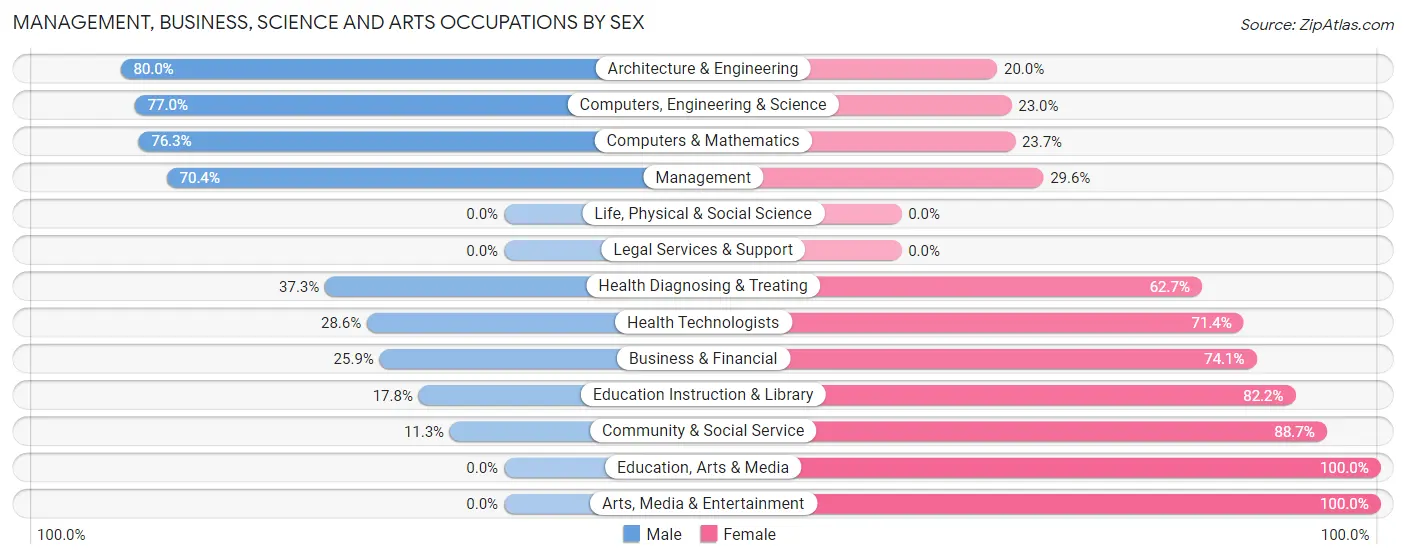
Management, Business, Science and Arts Occupations by Sex
Within the Management, Business, Science and Arts occupations in Schuylerville, the most male-oriented occupations are Architecture & Engineering (80.0%), Computers, Engineering & Science (77.0%), and Computers & Mathematics (76.3%), while the most female-oriented occupations are Education, Arts & Media (100.0%), Arts, Media & Entertainment (100.0%), and Community & Social Service (88.7%).
| Occupation | Male | Female |
| Management | 38 (70.4%) | 16 (29.6%) |
| Business & Financial | 14 (25.9%) | 40 (74.1%) |
| Computers, Engineering & Science | 57 (77.0%) | 17 (23.0%) |
| Computers & Mathematics | 45 (76.3%) | 14 (23.7%) |
| Architecture & Engineering | 12 (80.0%) | 3 (20.0%) |
| Life, Physical & Social Science | 0 (0.0%) | 0 (0.0%) |
| Community & Social Service | 8 (11.3%) | 63 (88.7%) |
| Education, Arts & Media | 0 (0.0%) | 15 (100.0%) |
| Legal Services & Support | 0 (0.0%) | 0 (0.0%) |
| Education Instruction & Library | 8 (17.8%) | 37 (82.2%) |
| Arts, Media & Entertainment | 0 (0.0%) | 11 (100.0%) |
| Health Diagnosing & Treating | 25 (37.3%) | 42 (62.7%) |
| Health Technologists | 10 (28.6%) | 25 (71.4%) |
| Total (Category) | 142 (44.4%) | 178 (55.6%) |
| Total (Overall) | 500 (56.8%) | 381 (43.2%) |
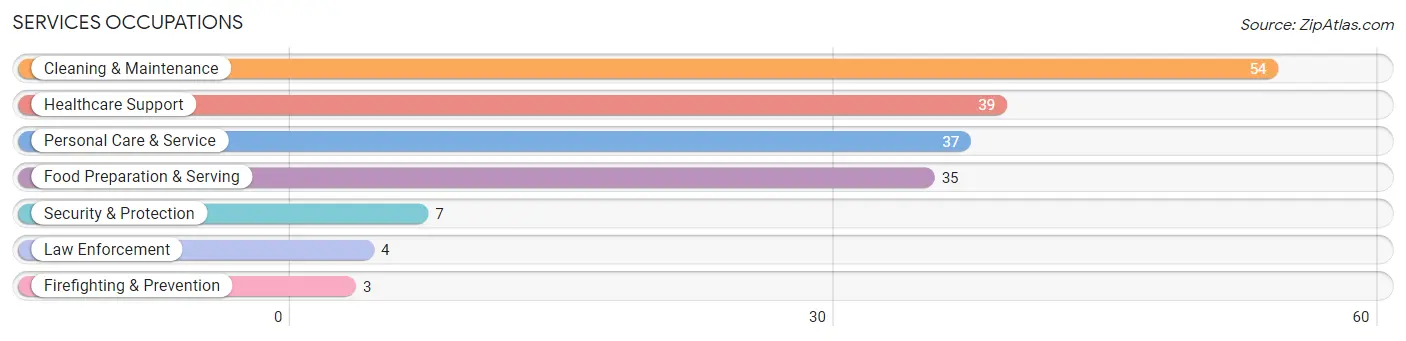
Services Occupations
The most common Services occupations in Schuylerville are Cleaning & Maintenance (54 | 6.1%), Healthcare Support (39 | 4.4%), Personal Care & Service (37 | 4.2%), Food Preparation & Serving (35 | 4.0%), and Security & Protection (7 | 0.8%).
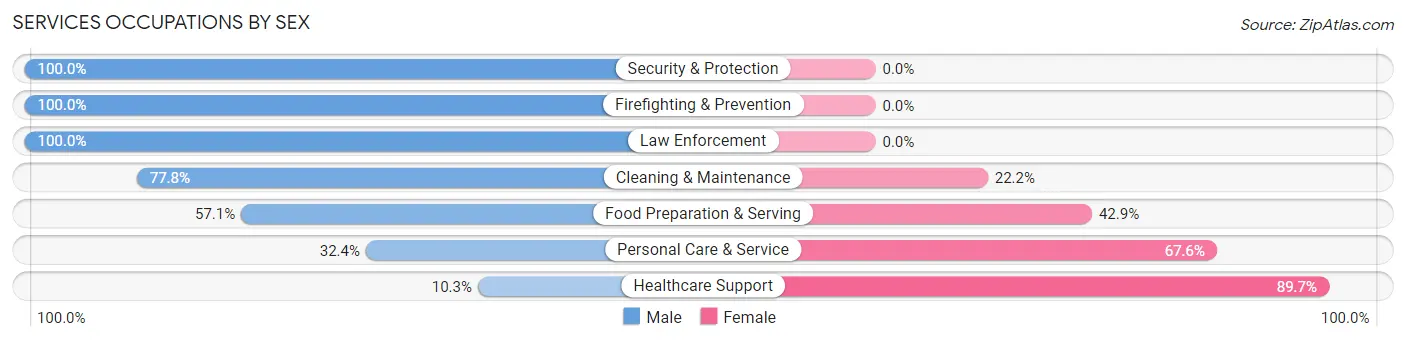
Services Occupations by Sex
Within the Services occupations in Schuylerville, the most male-oriented occupations are Security & Protection (100.0%), Firefighting & Prevention (100.0%), and Law Enforcement (100.0%), while the most female-oriented occupations are Healthcare Support (89.7%), Personal Care & Service (67.6%), and Food Preparation & Serving (42.9%).
| Occupation | Male | Female |
| Healthcare Support | 4 (10.3%) | 35 (89.7%) |
| Security & Protection | 7 (100.0%) | 0 (0.0%) |
| Firefighting & Prevention | 3 (100.0%) | 0 (0.0%) |
| Law Enforcement | 4 (100.0%) | 0 (0.0%) |
| Food Preparation & Serving | 20 (57.1%) | 15 (42.9%) |
| Cleaning & Maintenance | 42 (77.8%) | 12 (22.2%) |
| Personal Care & Service | 12 (32.4%) | 25 (67.6%) |
| Total (Category) | 85 (49.4%) | 87 (50.6%) |
| Total (Overall) | 500 (56.8%) | 381 (43.2%) |
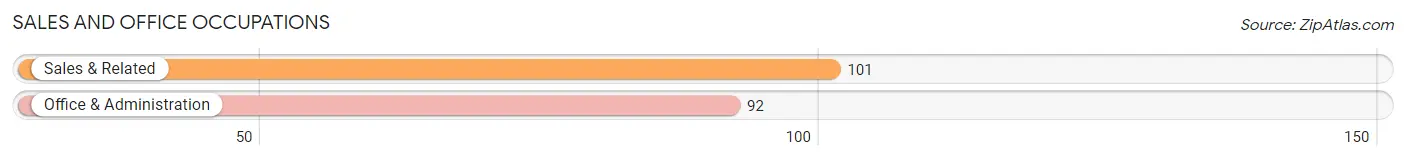
Sales and Office Occupations
The most common Sales and Office occupations in Schuylerville are Sales & Related (101 | 11.5%), and Office & Administration (92 | 10.4%).
Sales and Office Occupations by Sex
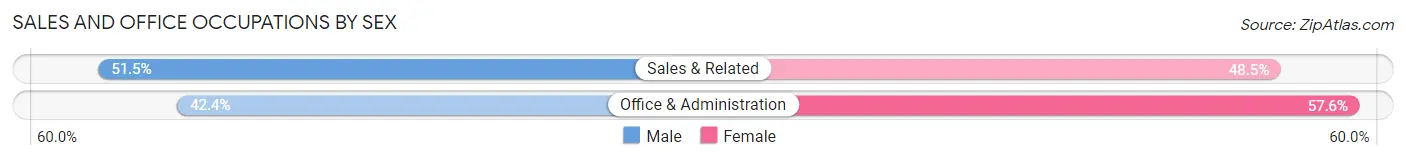
| Occupation | Male | Female |
| Sales & Related | 52 (51.5%) | 49 (48.5%) |
| Office & Administration | 39 (42.4%) | 53 (57.6%) |
| Total (Category) | 91 (47.1%) | 102 (52.8%) |
| Total (Overall) | 500 (56.8%) | 381 (43.2%) |
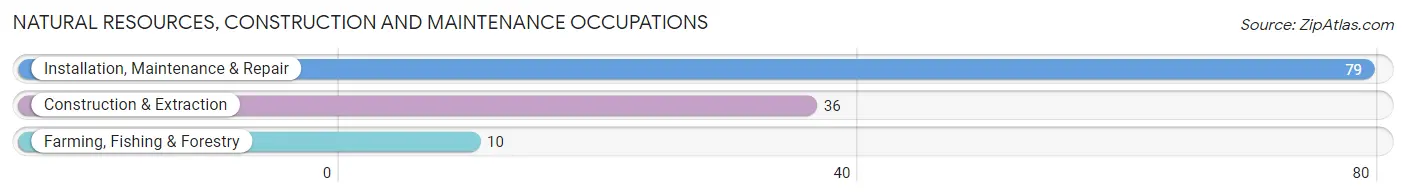
Natural Resources, Construction and Maintenance Occupations
The most common Natural Resources, Construction and Maintenance occupations in Schuylerville are Installation, Maintenance & Repair (79 | 9.0%), Construction & Extraction (36 | 4.1%), and Farming, Fishing & Forestry (10 | 1.1%).
Natural Resources, Construction and Maintenance Occupations by Sex
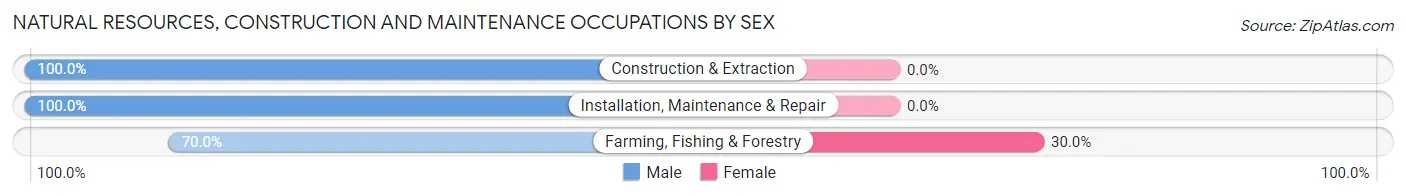
| Occupation | Male | Female |
| Farming, Fishing & Forestry | 7 (70.0%) | 3 (30.0%) |
| Construction & Extraction | 36 (100.0%) | 0 (0.0%) |
| Installation, Maintenance & Repair | 79 (100.0%) | 0 (0.0%) |
| Total (Category) | 122 (97.6%) | 3 (2.4%) |
| Total (Overall) | 500 (56.8%) | 381 (43.2%) |
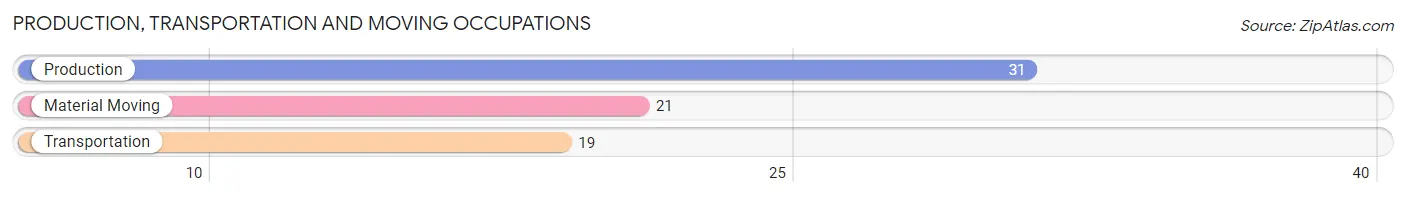
Production, Transportation and Moving Occupations
The most common Production, Transportation and Moving occupations in Schuylerville are Production (31 | 3.5%), Material Moving (21 | 2.4%), and Transportation (19 | 2.2%).
Production, Transportation and Moving Occupations by Sex
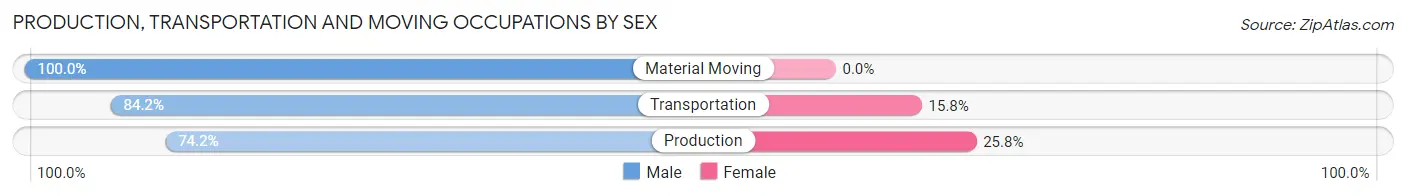
| Occupation | Male | Female |
| Production | 23 (74.2%) | 8 (25.8%) |
| Transportation | 16 (84.2%) | 3 (15.8%) |
| Material Moving | 21 (100.0%) | 0 (0.0%) |
| Total (Category) | 60 (84.5%) | 11 (15.5%) |
| Total (Overall) | 500 (56.8%) | 381 (43.2%) |
Employment Industries by Sex in Schuylerville
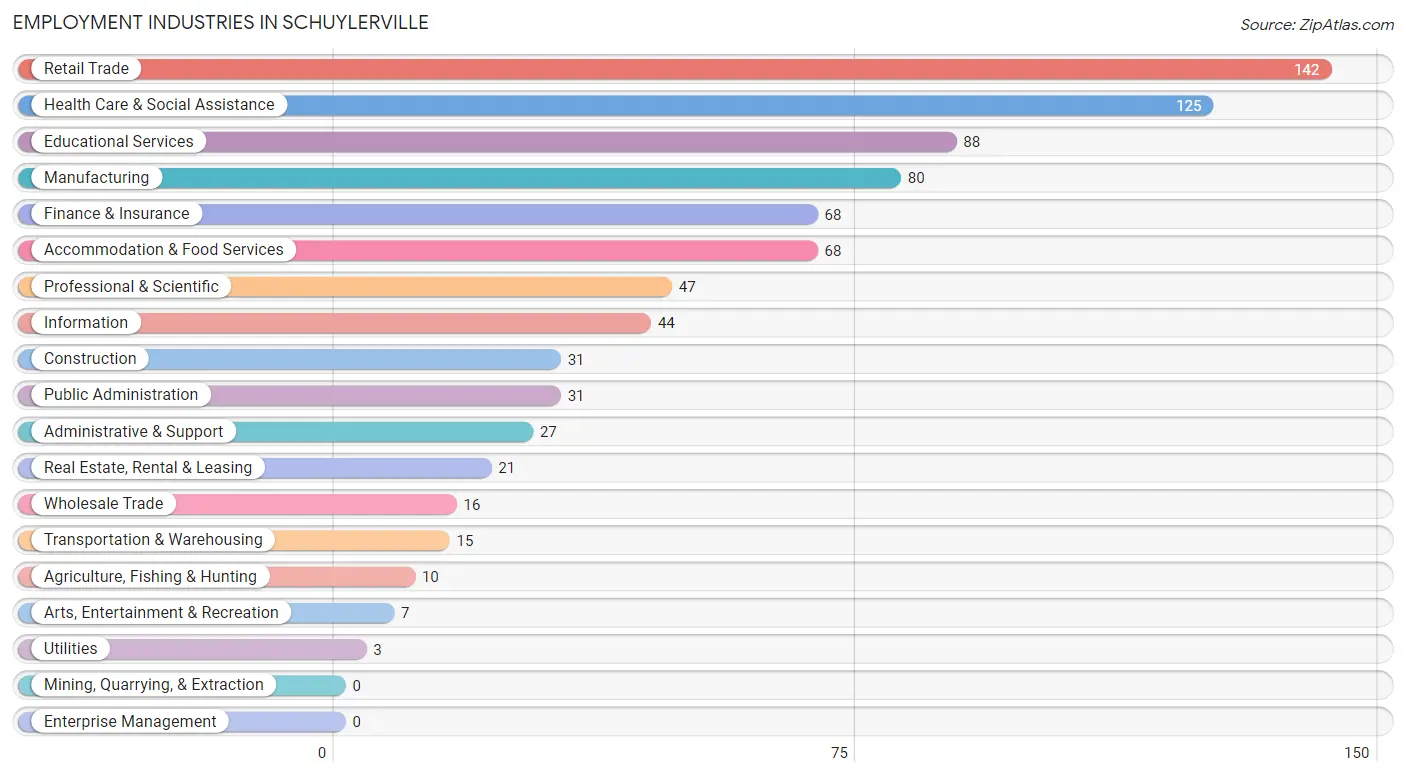
Employment Industries in Schuylerville
The major employment industries in Schuylerville include Retail Trade (142 | 16.1%), Health Care & Social Assistance (125 | 14.2%), Educational Services (88 | 10.0%), Manufacturing (80 | 9.1%), and Finance & Insurance (68 | 7.7%).
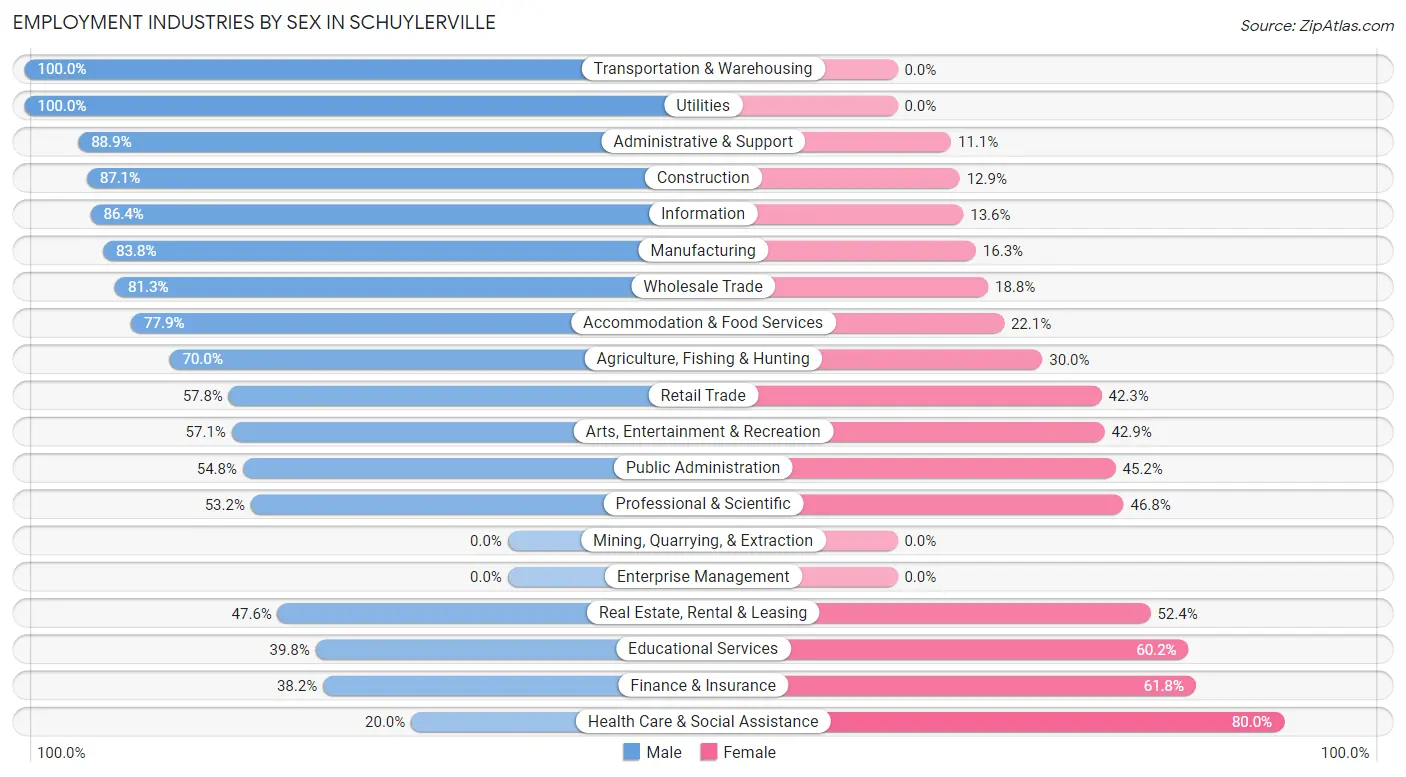
Employment Industries by Sex in Schuylerville
The Schuylerville industries that see more men than women are Transportation & Warehousing (100.0%), Utilities (100.0%), and Administrative & Support (88.9%), whereas the industries that tend to have a higher number of women are Health Care & Social Assistance (80.0%), Finance & Insurance (61.8%), and Educational Services (60.2%).
| Industry | Male | Female |
| Agriculture, Fishing & Hunting | 7 (70.0%) | 3 (30.0%) |
| Mining, Quarrying, & Extraction | 0 (0.0%) | 0 (0.0%) |
| Construction | 27 (87.1%) | 4 (12.9%) |
| Manufacturing | 67 (83.8%) | 13 (16.3%) |
| Wholesale Trade | 13 (81.2%) | 3 (18.8%) |
| Retail Trade | 82 (57.8%) | 60 (42.2%) |
| Transportation & Warehousing | 15 (100.0%) | 0 (0.0%) |
| Utilities | 3 (100.0%) | 0 (0.0%) |
| Information | 38 (86.4%) | 6 (13.6%) |
| Finance & Insurance | 26 (38.2%) | 42 (61.8%) |
| Real Estate, Rental & Leasing | 10 (47.6%) | 11 (52.4%) |
| Professional & Scientific | 25 (53.2%) | 22 (46.8%) |
| Enterprise Management | 0 (0.0%) | 0 (0.0%) |
| Administrative & Support | 24 (88.9%) | 3 (11.1%) |
| Educational Services | 35 (39.8%) | 53 (60.2%) |
| Health Care & Social Assistance | 25 (20.0%) | 100 (80.0%) |
| Arts, Entertainment & Recreation | 4 (57.1%) | 3 (42.9%) |
| Accommodation & Food Services | 53 (77.9%) | 15 (22.1%) |
| Public Administration | 17 (54.8%) | 14 (45.2%) |
| Total | 500 (56.8%) | 381 (43.2%) |
Education in Schuylerville
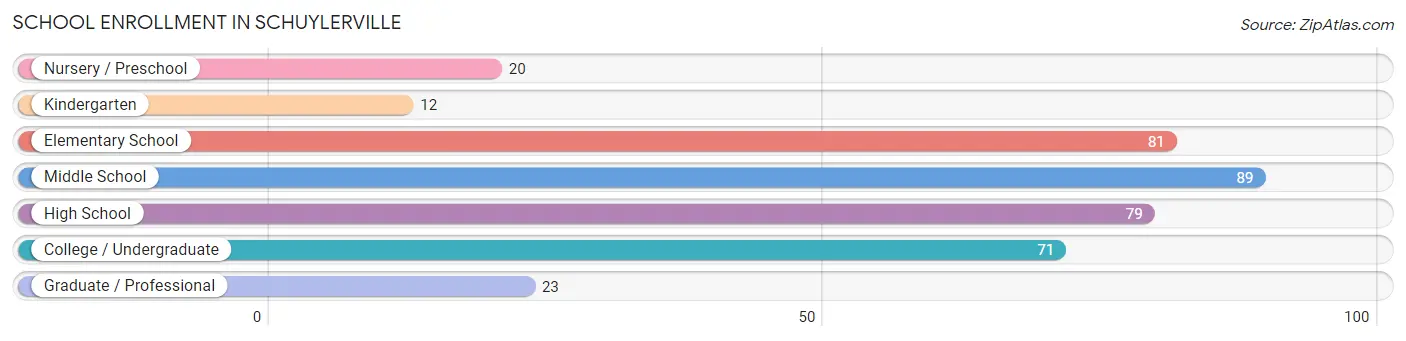
School Enrollment in Schuylerville
The most common levels of schooling among the 375 students in Schuylerville are middle school (89 | 23.7%), elementary school (81 | 21.6%), and high school (79 | 21.1%).
| School Level | # Students | % Students |
| Nursery / Preschool | 20 | 5.3% |
| Kindergarten | 12 | 3.2% |
| Elementary School | 81 | 21.6% |
| Middle School | 89 | 23.7% |
| High School | 79 | 21.1% |
| College / Undergraduate | 71 | 18.9% |
| Graduate / Professional | 23 | 6.1% |
| Total | 375 | 100.0% |
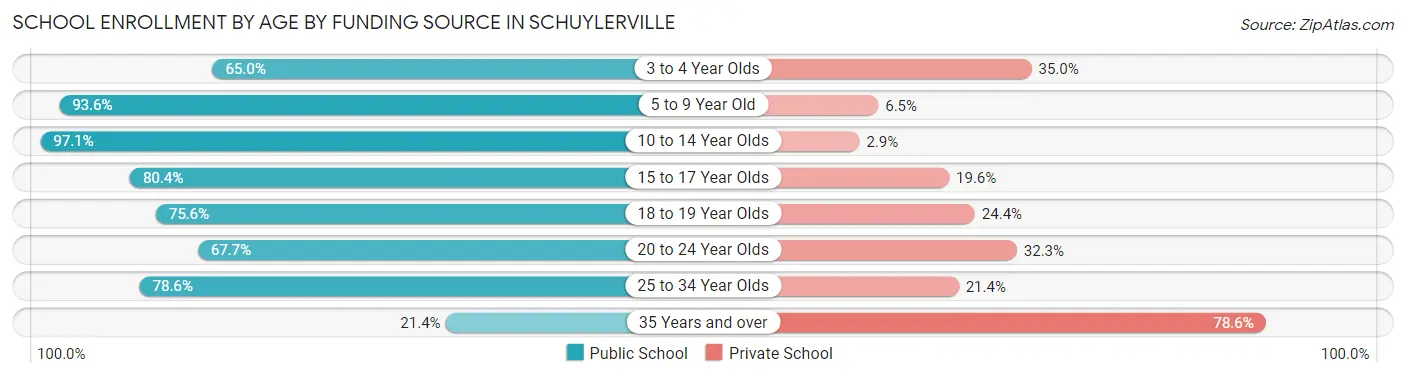
School Enrollment by Age by Funding Source in Schuylerville
Out of a total of 375 students who are enrolled in schools in Schuylerville, 62 (16.5%) attend a private institution, while the remaining 313 (83.5%) are enrolled in public schools. The age group of 35 years and over has the highest likelihood of being enrolled in private schools, with 11 (78.6% in the age bracket) enrolled. Conversely, the age group of 10 to 14 year olds has the lowest likelihood of being enrolled in a private school, with 99 (97.1% in the age bracket) attending a public institution.
| Age Bracket | Public School | Private School |
| 3 to 4 Year Olds | 13 (65.0%) | 7 (35.0%) |
| 5 to 9 Year Old | 87 (93.5%) | 6 (6.5%) |
| 10 to 14 Year Olds | 99 (97.1%) | 3 (2.9%) |
| 15 to 17 Year Olds | 45 (80.4%) | 11 (19.6%) |
| 18 to 19 Year Olds | 34 (75.6%) | 11 (24.4%) |
| 20 to 24 Year Olds | 21 (67.7%) | 10 (32.3%) |
| 25 to 34 Year Olds | 11 (78.6%) | 3 (21.4%) |
| 35 Years and over | 3 (21.4%) | 11 (78.6%) |
| Total | 313 (83.5%) | 62 (16.5%) |
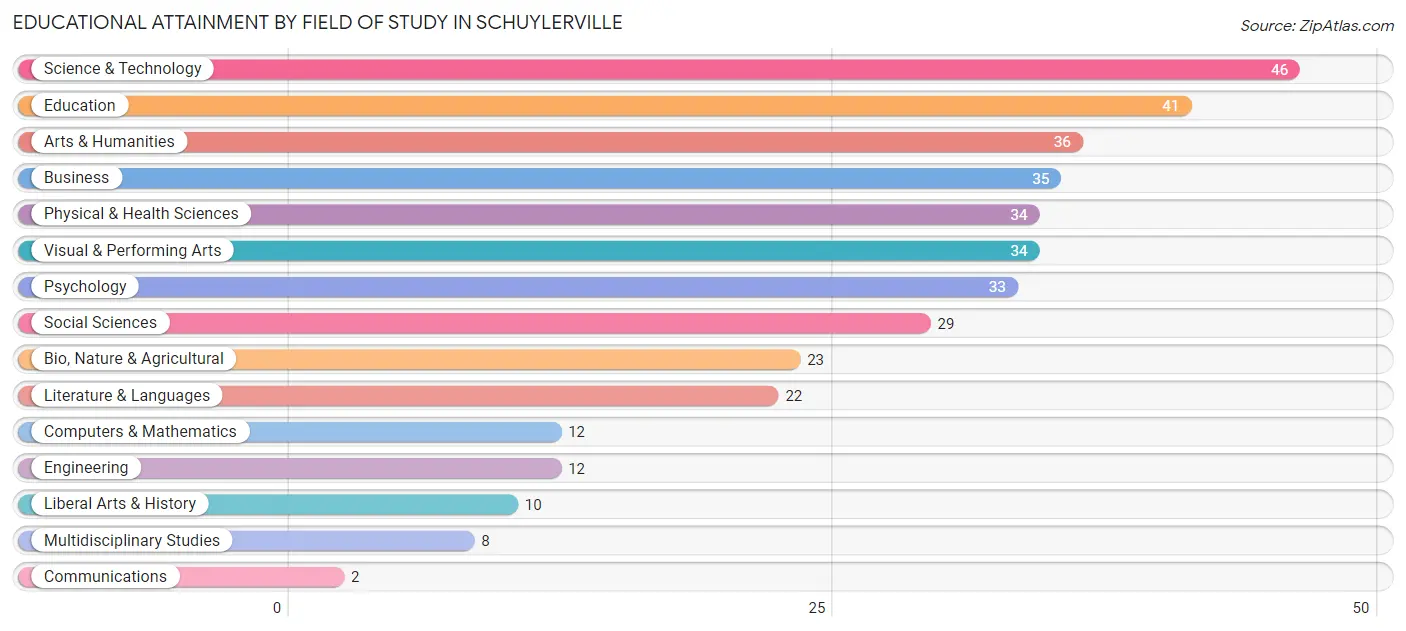
Educational Attainment by Field of Study in Schuylerville
Science & technology (46 | 12.2%), education (41 | 10.9%), arts & humanities (36 | 9.6%), business (35 | 9.3%), and physical & health sciences (34 | 9.0%) are the most common fields of study among 377 individuals in Schuylerville who have obtained a bachelor's degree or higher.
| Field of Study | # Graduates | % Graduates |
| Computers & Mathematics | 12 | 3.2% |
| Bio, Nature & Agricultural | 23 | 6.1% |
| Physical & Health Sciences | 34 | 9.0% |
| Psychology | 33 | 8.7% |
| Social Sciences | 29 | 7.7% |
| Engineering | 12 | 3.2% |
| Multidisciplinary Studies | 8 | 2.1% |
| Science & Technology | 46 | 12.2% |
| Business | 35 | 9.3% |
| Education | 41 | 10.9% |
| Literature & Languages | 22 | 5.8% |
| Liberal Arts & History | 10 | 2.6% |
| Visual & Performing Arts | 34 | 9.0% |
| Communications | 2 | 0.5% |
| Arts & Humanities | 36 | 9.6% |
| Total | 377 | 100.0% |
Transportation & Commute in Schuylerville
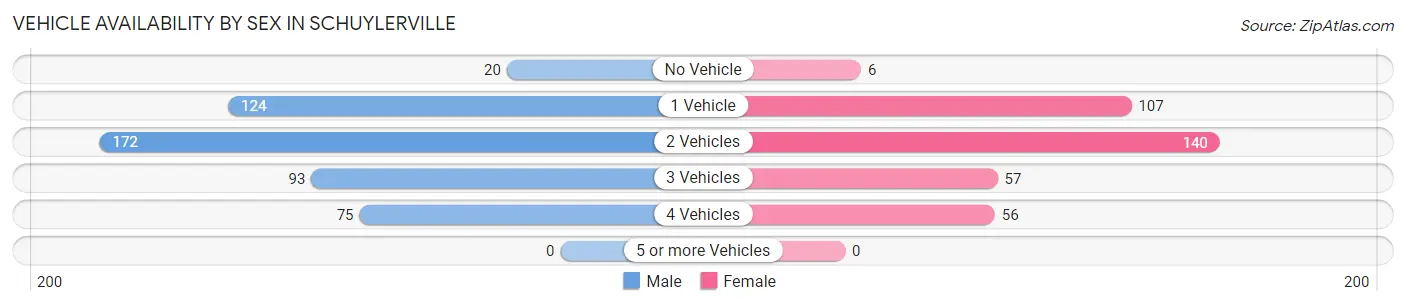
Vehicle Availability by Sex in Schuylerville
The most prevalent vehicle ownership categories in Schuylerville are males with 2 vehicles (172, accounting for 35.5%) and females with 2 vehicles (140, making up 47.0%).
| Vehicles Available | Male | Female |
| No Vehicle | 20 (4.1%) | 6 (1.6%) |
| 1 Vehicle | 124 (25.6%) | 107 (29.2%) |
| 2 Vehicles | 172 (35.5%) | 140 (38.3%) |
| 3 Vehicles | 93 (19.2%) | 57 (15.6%) |
| 4 Vehicles | 75 (15.5%) | 56 (15.3%) |
| 5 or more Vehicles | 0 (0.0%) | 0 (0.0%) |
| Total | 484 (100.0%) | 366 (100.0%) |
Commute Time in Schuylerville
The most frequently occuring commute durations in Schuylerville are 30 to 34 minutes (115 commuters, 15.4%), 20 to 24 minutes (102 commuters, 13.7%), and 15 to 19 minutes (88 commuters, 11.8%).
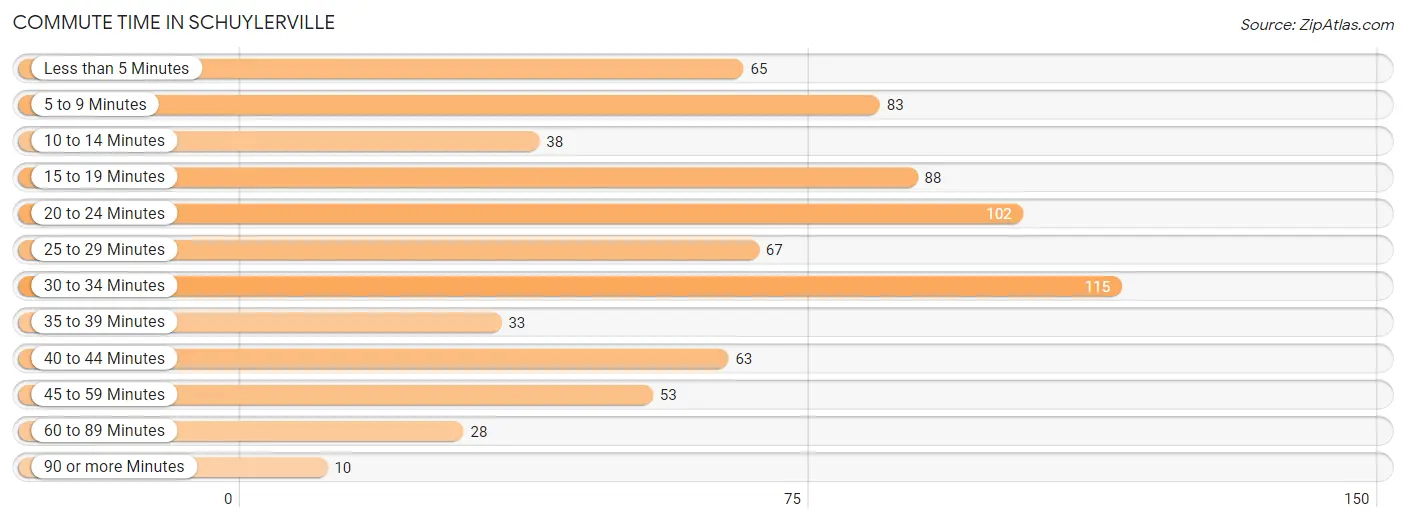
| Commute Time | # Commuters | % Commuters |
| Less than 5 Minutes | 65 | 8.7% |
| 5 to 9 Minutes | 83 | 11.1% |
| 10 to 14 Minutes | 38 | 5.1% |
| 15 to 19 Minutes | 88 | 11.8% |
| 20 to 24 Minutes | 102 | 13.7% |
| 25 to 29 Minutes | 67 | 9.0% |
| 30 to 34 Minutes | 115 | 15.4% |
| 35 to 39 Minutes | 33 | 4.4% |
| 40 to 44 Minutes | 63 | 8.5% |
| 45 to 59 Minutes | 53 | 7.1% |
| 60 to 89 Minutes | 28 | 3.8% |
| 90 or more Minutes | 10 | 1.3% |
Commute Time by Sex in Schuylerville
The most common commute times in Schuylerville are 30 to 34 minutes (56 commuters, 12.9%) for males and 30 to 34 minutes (59 commuters, 18.9%) for females.
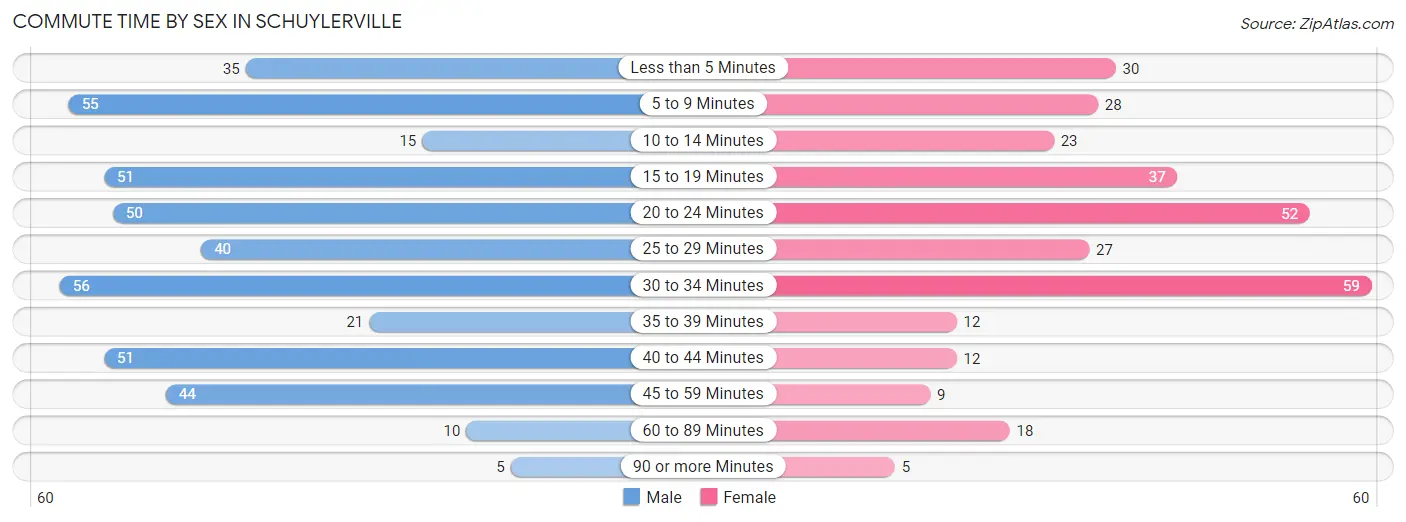
| Commute Time | Male | Female |
| Less than 5 Minutes | 35 (8.1%) | 30 (9.6%) |
| 5 to 9 Minutes | 55 (12.7%) | 28 (9.0%) |
| 10 to 14 Minutes | 15 (3.5%) | 23 (7.4%) |
| 15 to 19 Minutes | 51 (11.8%) | 37 (11.9%) |
| 20 to 24 Minutes | 50 (11.6%) | 52 (16.7%) |
| 25 to 29 Minutes | 40 (9.2%) | 27 (8.6%) |
| 30 to 34 Minutes | 56 (12.9%) | 59 (18.9%) |
| 35 to 39 Minutes | 21 (4.9%) | 12 (3.8%) |
| 40 to 44 Minutes | 51 (11.8%) | 12 (3.8%) |
| 45 to 59 Minutes | 44 (10.2%) | 9 (2.9%) |
| 60 to 89 Minutes | 10 (2.3%) | 18 (5.8%) |
| 90 or more Minutes | 5 (1.1%) | 5 (1.6%) |
Time of Departure to Work by Sex in Schuylerville
The most frequent times of departure to work in Schuylerville are 6:30 AM to 6:59 AM (101, 23.3%) for males and 7:30 AM to 7:59 AM (67, 21.5%) for females.
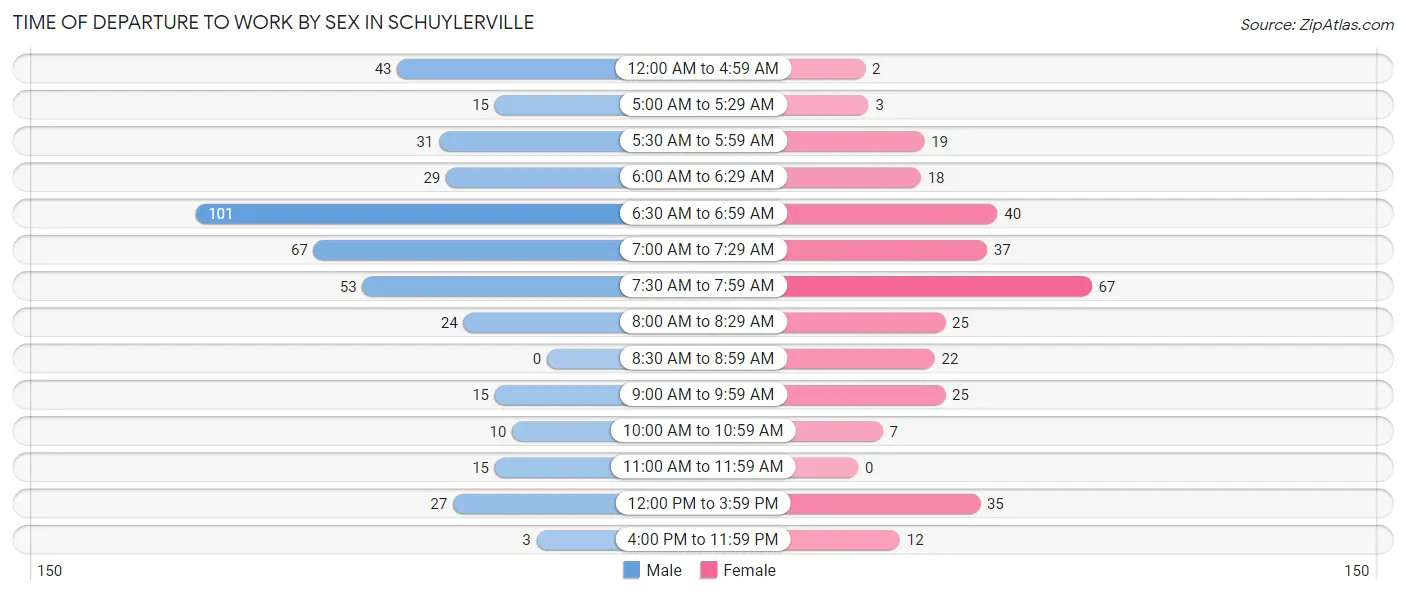
| Time of Departure | Male | Female |
| 12:00 AM to 4:59 AM | 43 (9.9%) | 2 (0.6%) |
| 5:00 AM to 5:29 AM | 15 (3.5%) | 3 (1.0%) |
| 5:30 AM to 5:59 AM | 31 (7.2%) | 19 (6.1%) |
| 6:00 AM to 6:29 AM | 29 (6.7%) | 18 (5.8%) |
| 6:30 AM to 6:59 AM | 101 (23.3%) | 40 (12.8%) |
| 7:00 AM to 7:29 AM | 67 (15.5%) | 37 (11.9%) |
| 7:30 AM to 7:59 AM | 53 (12.2%) | 67 (21.5%) |
| 8:00 AM to 8:29 AM | 24 (5.5%) | 25 (8.0%) |
| 8:30 AM to 8:59 AM | 0 (0.0%) | 22 (7.0%) |
| 9:00 AM to 9:59 AM | 15 (3.5%) | 25 (8.0%) |
| 10:00 AM to 10:59 AM | 10 (2.3%) | 7 (2.2%) |
| 11:00 AM to 11:59 AM | 15 (3.5%) | 0 (0.0%) |
| 12:00 PM to 3:59 PM | 27 (6.2%) | 35 (11.2%) |
| 4:00 PM to 11:59 PM | 3 (0.7%) | 12 (3.8%) |
| Total | 433 (100.0%) | 312 (100.0%) |
Housing Occupancy in Schuylerville
Occupancy by Ownership in Schuylerville
Of the total 695 dwellings in Schuylerville, owner-occupied units account for 422 (60.7%), while renter-occupied units make up 273 (39.3%).
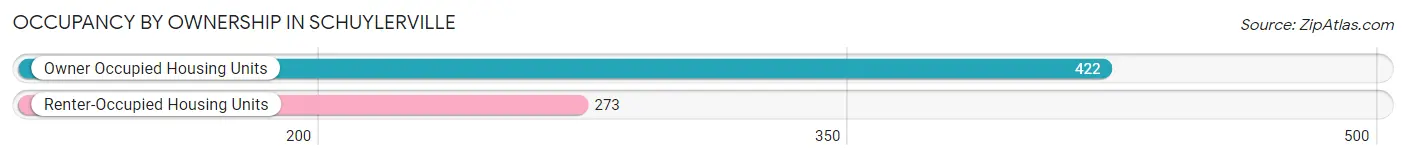
| Occupancy | # Housing Units | % Housing Units |
| Owner Occupied Housing Units | 422 | 60.7% |
| Renter-Occupied Housing Units | 273 | 39.3% |
| Total Occupied Housing Units | 695 | 100.0% |
Occupancy by Household Size in Schuylerville
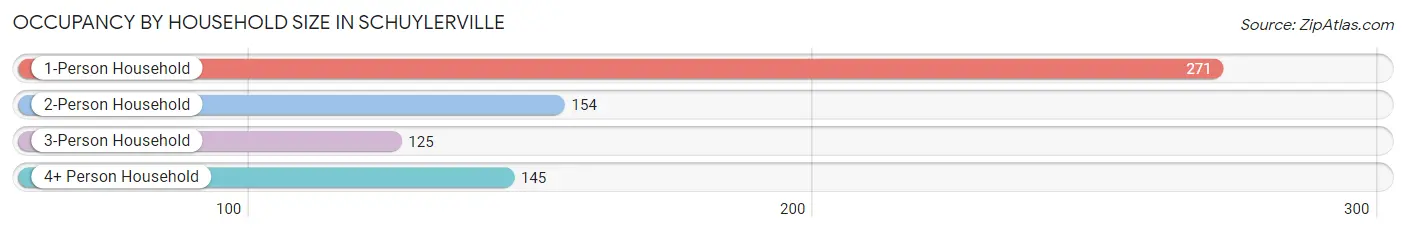
| Household Size | # Housing Units | % Housing Units |
| 1-Person Household | 271 | 39.0% |
| 2-Person Household | 154 | 22.2% |
| 3-Person Household | 125 | 18.0% |
| 4+ Person Household | 145 | 20.9% |
| Total Housing Units | 695 | 100.0% |
Occupancy by Ownership by Household Size in Schuylerville
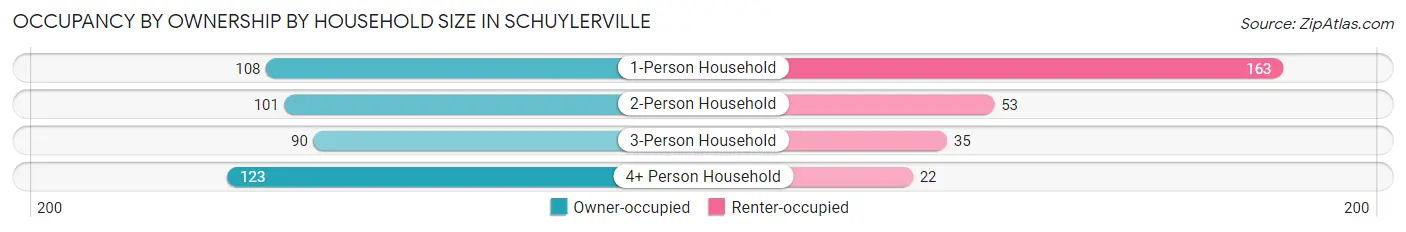
| Household Size | Owner-occupied | Renter-occupied |
| 1-Person Household | 108 (39.9%) | 163 (60.2%) |
| 2-Person Household | 101 (65.6%) | 53 (34.4%) |
| 3-Person Household | 90 (72.0%) | 35 (28.0%) |
| 4+ Person Household | 123 (84.8%) | 22 (15.2%) |
| Total Housing Units | 422 (60.7%) | 273 (39.3%) |
Occupancy by Educational Attainment in Schuylerville
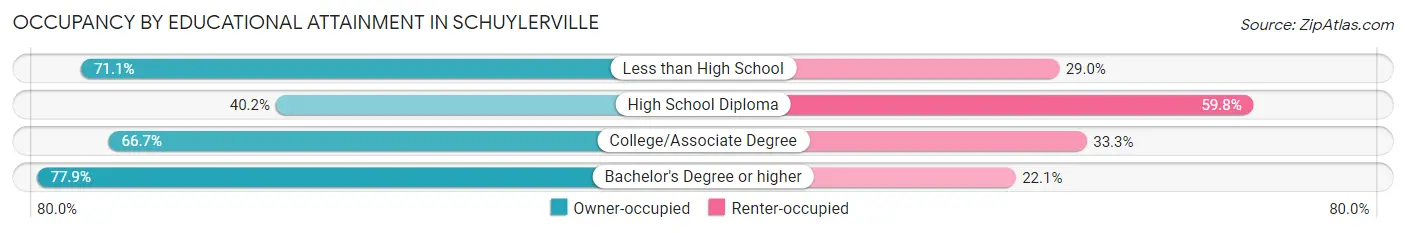
| Household Size | Owner-occupied | Renter-occupied |
| Less than High School | 27 (71.1%) | 11 (28.9%) |
| High School Diploma | 100 (40.2%) | 149 (59.8%) |
| College/Associate Degree | 136 (66.7%) | 68 (33.3%) |
| Bachelor's Degree or higher | 159 (77.9%) | 45 (22.1%) |
Occupancy by Age of Householder in Schuylerville
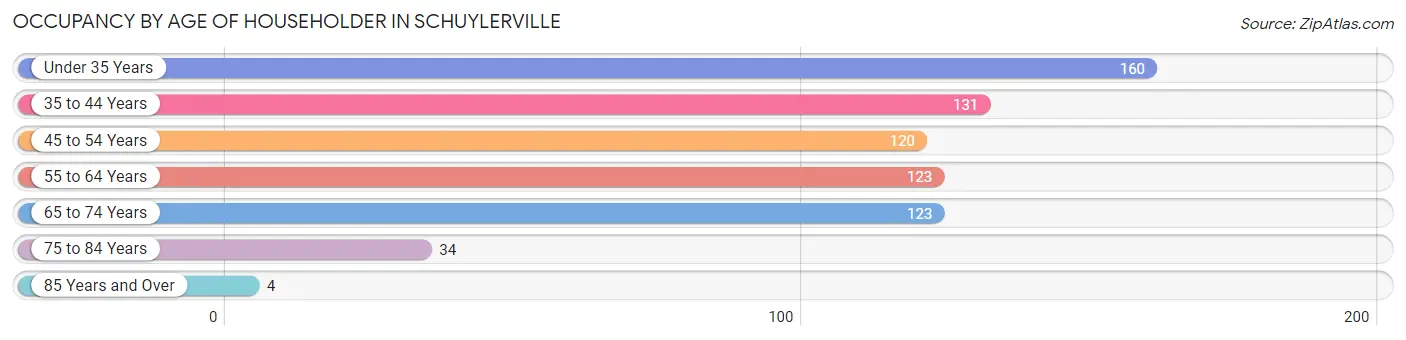
| Age Bracket | # Households | % Households |
| Under 35 Years | 160 | 23.0% |
| 35 to 44 Years | 131 | 18.9% |
| 45 to 54 Years | 120 | 17.3% |
| 55 to 64 Years | 123 | 17.7% |
| 65 to 74 Years | 123 | 17.7% |
| 75 to 84 Years | 34 | 4.9% |
| 85 Years and Over | 4 | 0.6% |
| Total | 695 | 100.0% |
Housing Finances in Schuylerville
Median Income by Occupancy in Schuylerville
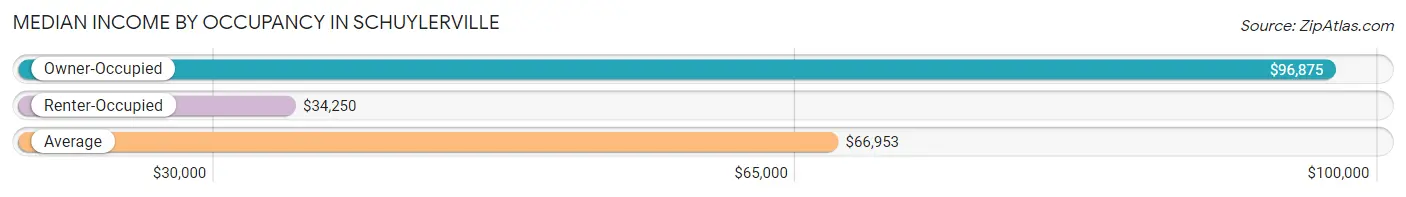
| Occupancy Type | # Households | Median Income |
| Owner-Occupied | 422 (60.7%) | $96,875 |
| Renter-Occupied | 273 (39.3%) | $34,250 |
| Average | 695 (100.0%) | $66,953 |
Occupancy by Householder Income Bracket in Schuylerville
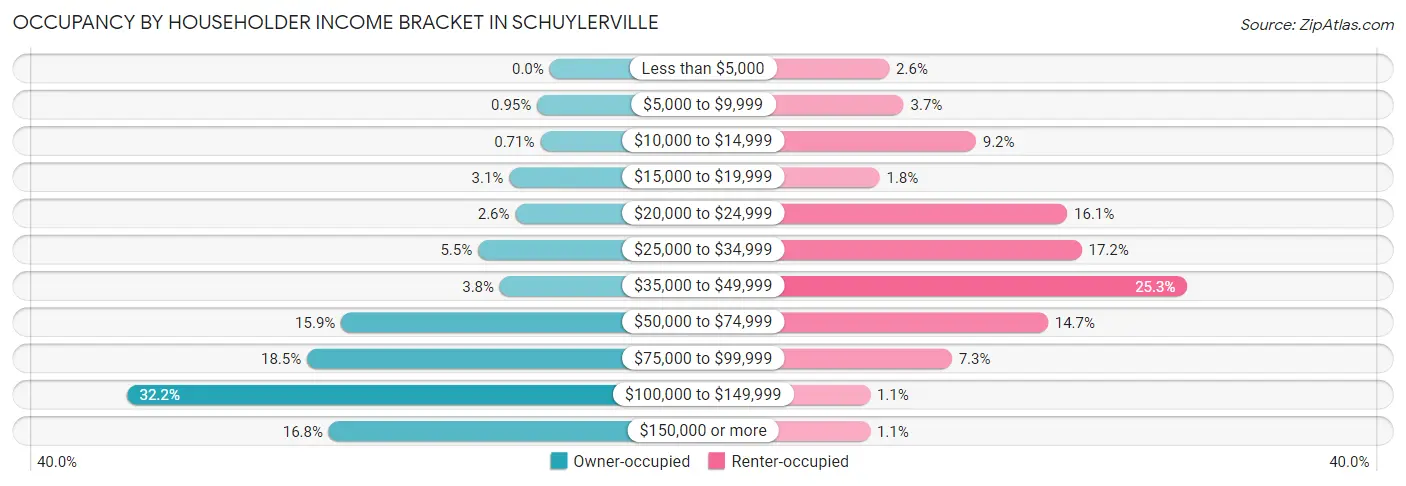
| Income Bracket | Owner-occupied | Renter-occupied |
| Less than $5,000 | 0 (0.0%) | 7 (2.6%) |
| $5,000 to $9,999 | 4 (0.9%) | 10 (3.7%) |
| $10,000 to $14,999 | 3 (0.7%) | 25 (9.2%) |
| $15,000 to $19,999 | 13 (3.1%) | 5 (1.8%) |
| $20,000 to $24,999 | 11 (2.6%) | 44 (16.1%) |
| $25,000 to $34,999 | 23 (5.4%) | 47 (17.2%) |
| $35,000 to $49,999 | 16 (3.8%) | 69 (25.3%) |
| $50,000 to $74,999 | 67 (15.9%) | 40 (14.6%) |
| $75,000 to $99,999 | 78 (18.5%) | 20 (7.3%) |
| $100,000 to $149,999 | 136 (32.2%) | 3 (1.1%) |
| $150,000 or more | 71 (16.8%) | 3 (1.1%) |
| Total | 422 (100.0%) | 273 (100.0%) |
Monthly Housing Cost Tiers in Schuylerville
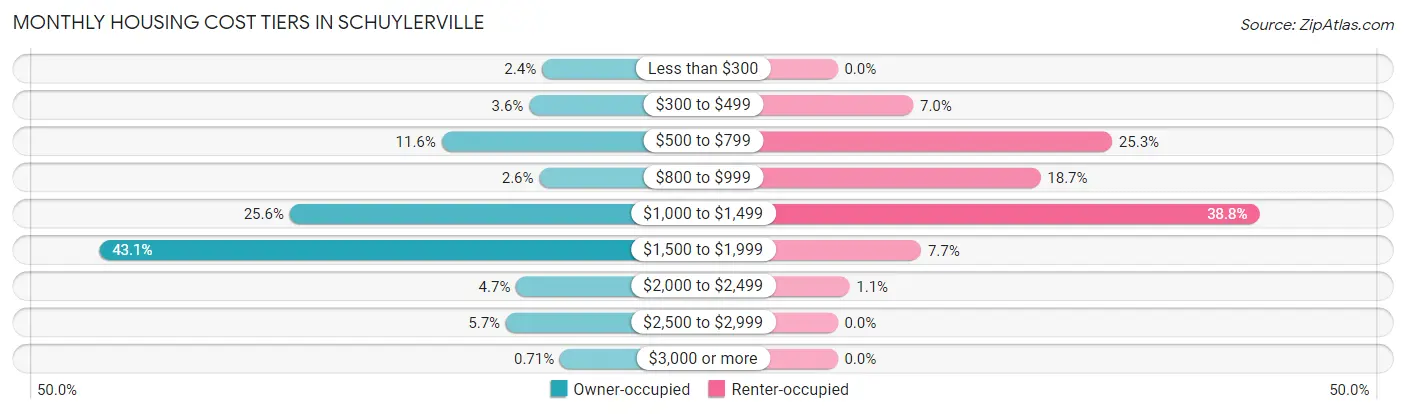
| Monthly Cost | Owner-occupied | Renter-occupied |
| Less than $300 | 10 (2.4%) | 0 (0.0%) |
| $300 to $499 | 15 (3.5%) | 19 (7.0%) |
| $500 to $799 | 49 (11.6%) | 69 (25.3%) |
| $800 to $999 | 11 (2.6%) | 51 (18.7%) |
| $1,000 to $1,499 | 108 (25.6%) | 106 (38.8%) |
| $1,500 to $1,999 | 182 (43.1%) | 21 (7.7%) |
| $2,000 to $2,499 | 20 (4.7%) | 3 (1.1%) |
| $2,500 to $2,999 | 24 (5.7%) | 0 (0.0%) |
| $3,000 or more | 3 (0.7%) | 0 (0.0%) |
| Total | 422 (100.0%) | 273 (100.0%) |
Physical Housing Characteristics in Schuylerville
Housing Structures in Schuylerville
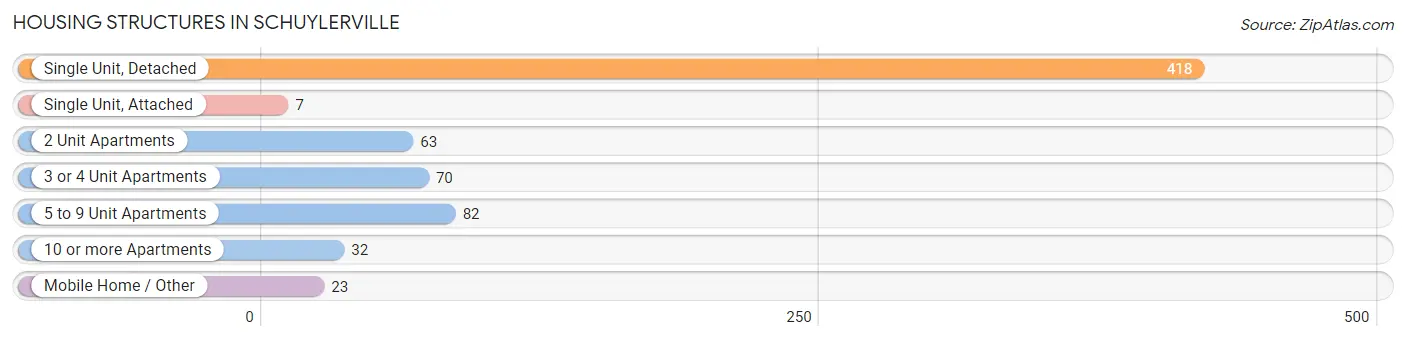
| Structure Type | # Housing Units | % Housing Units |
| Single Unit, Detached | 418 | 60.1% |
| Single Unit, Attached | 7 | 1.0% |
| 2 Unit Apartments | 63 | 9.1% |
| 3 or 4 Unit Apartments | 70 | 10.1% |
| 5 to 9 Unit Apartments | 82 | 11.8% |
| 10 or more Apartments | 32 | 4.6% |
| Mobile Home / Other | 23 | 3.3% |
| Total | 695 | 100.0% |
Housing Structures by Occupancy in Schuylerville
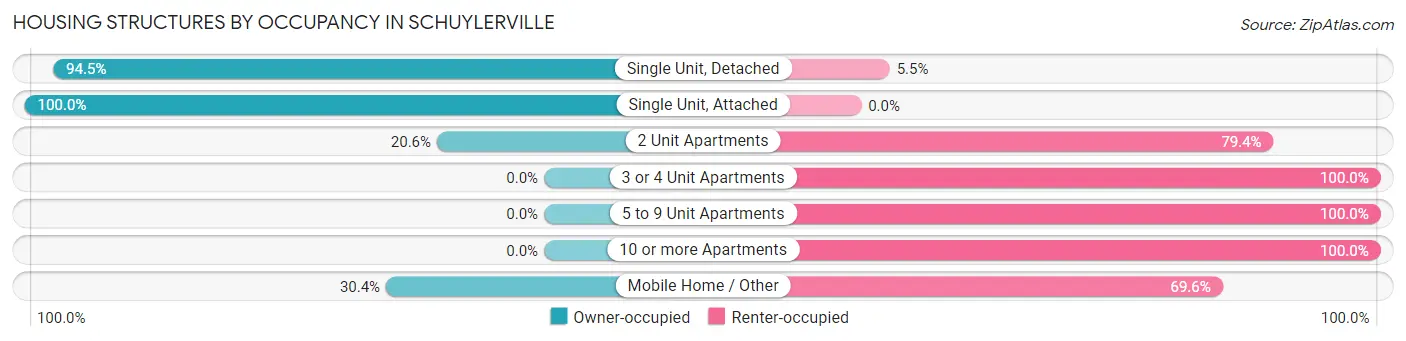
| Structure Type | Owner-occupied | Renter-occupied |
| Single Unit, Detached | 395 (94.5%) | 23 (5.5%) |
| Single Unit, Attached | 7 (100.0%) | 0 (0.0%) |
| 2 Unit Apartments | 13 (20.6%) | 50 (79.4%) |
| 3 or 4 Unit Apartments | 0 (0.0%) | 70 (100.0%) |
| 5 to 9 Unit Apartments | 0 (0.0%) | 82 (100.0%) |
| 10 or more Apartments | 0 (0.0%) | 32 (100.0%) |
| Mobile Home / Other | 7 (30.4%) | 16 (69.6%) |
| Total | 422 (60.7%) | 273 (39.3%) |
Housing Structures by Number of Rooms in Schuylerville
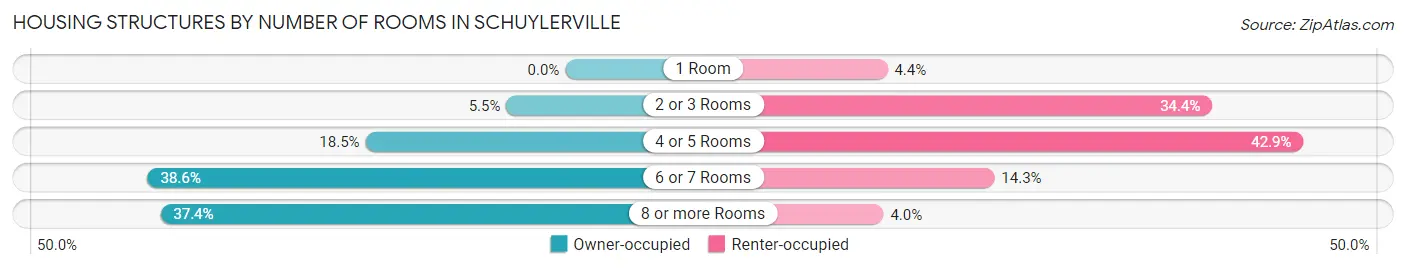
| Number of Rooms | Owner-occupied | Renter-occupied |
| 1 Room | 0 (0.0%) | 12 (4.4%) |
| 2 or 3 Rooms | 23 (5.4%) | 94 (34.4%) |
| 4 or 5 Rooms | 78 (18.5%) | 117 (42.9%) |
| 6 or 7 Rooms | 163 (38.6%) | 39 (14.3%) |
| 8 or more Rooms | 158 (37.4%) | 11 (4.0%) |
| Total | 422 (100.0%) | 273 (100.0%) |
Housing Structure by Heating Type in Schuylerville
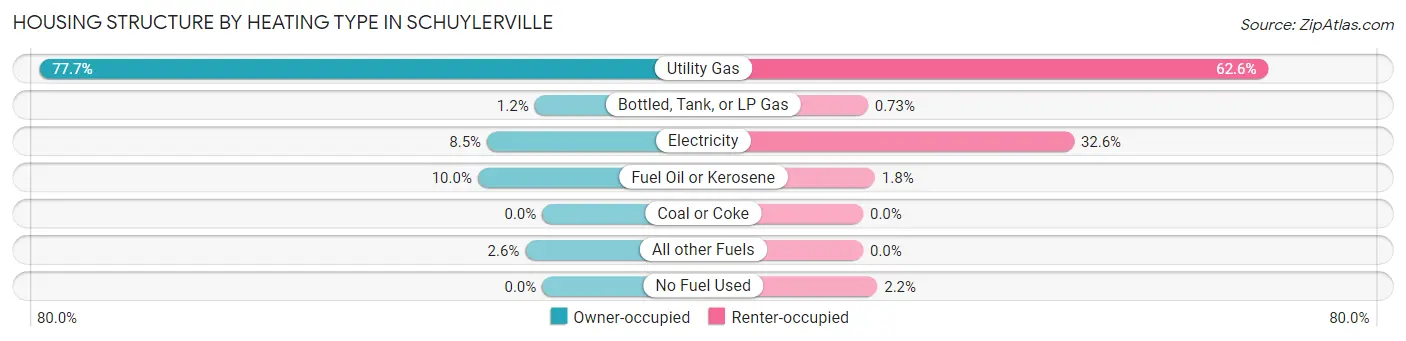
| Heating Type | Owner-occupied | Renter-occupied |
| Utility Gas | 328 (77.7%) | 171 (62.6%) |
| Bottled, Tank, or LP Gas | 5 (1.2%) | 2 (0.7%) |
| Electricity | 36 (8.5%) | 89 (32.6%) |
| Fuel Oil or Kerosene | 42 (10.0%) | 5 (1.8%) |
| Coal or Coke | 0 (0.0%) | 0 (0.0%) |
| All other Fuels | 11 (2.6%) | 0 (0.0%) |
| No Fuel Used | 0 (0.0%) | 6 (2.2%) |
| Total | 422 (100.0%) | 273 (100.0%) |
Household Vehicle Usage in Schuylerville
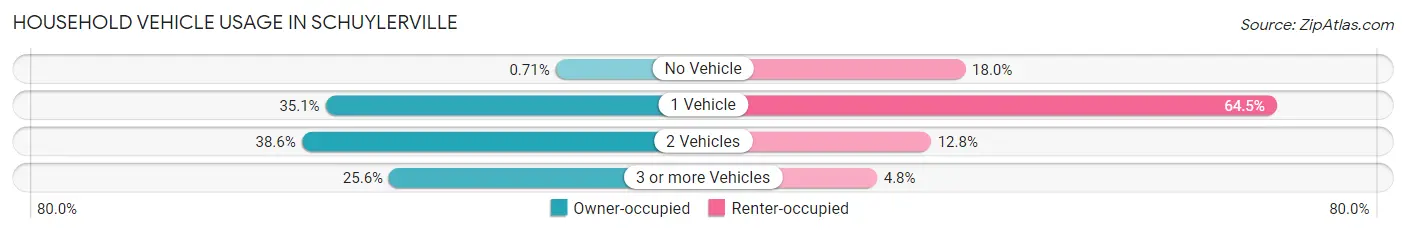
| Vehicles per Household | Owner-occupied | Renter-occupied |
| No Vehicle | 3 (0.7%) | 49 (17.9%) |
| 1 Vehicle | 148 (35.1%) | 176 (64.5%) |
| 2 Vehicles | 163 (38.6%) | 35 (12.8%) |
| 3 or more Vehicles | 108 (25.6%) | 13 (4.8%) |
| Total | 422 (100.0%) | 273 (100.0%) |
Real Estate & Mortgages in Schuylerville
Real Estate and Mortgage Overview in Schuylerville
| Characteristic | Without Mortgage | With Mortgage |
| Housing Units | 85 | 337 |
| Median Property Value | $124,300 | $186,200 |
| Median Household Income | $69,659 | $65 |
| Monthly Housing Costs | $630 | $3 |
| Real Estate Taxes | $3,426 | $9 |
Property Value by Mortgage Status in Schuylerville
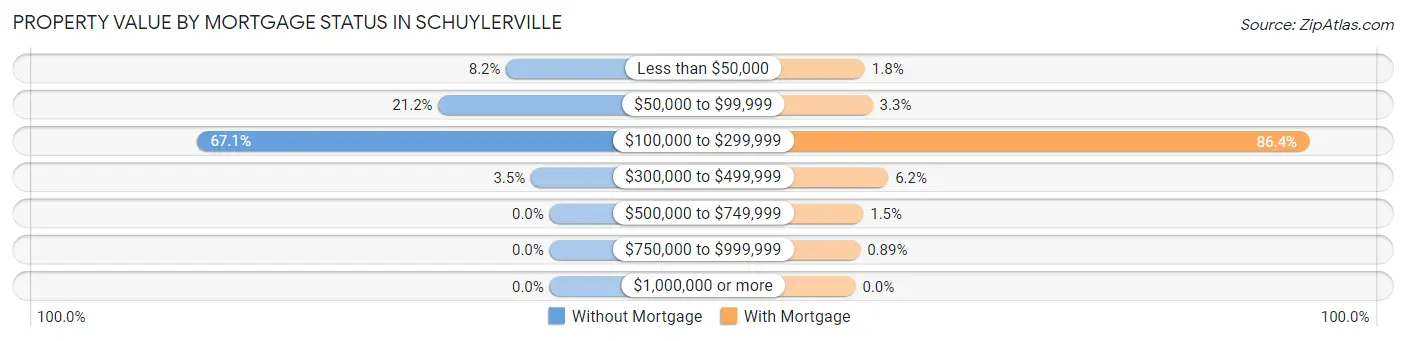
| Property Value | Without Mortgage | With Mortgage |
| Less than $50,000 | 7 (8.2%) | 6 (1.8%) |
| $50,000 to $99,999 | 18 (21.2%) | 11 (3.3%) |
| $100,000 to $299,999 | 57 (67.1%) | 291 (86.4%) |
| $300,000 to $499,999 | 3 (3.5%) | 21 (6.2%) |
| $500,000 to $749,999 | 0 (0.0%) | 5 (1.5%) |
| $750,000 to $999,999 | 0 (0.0%) | 3 (0.9%) |
| $1,000,000 or more | 0 (0.0%) | 0 (0.0%) |
| Total | 85 (100.0%) | 337 (100.0%) |
Household Income by Mortgage Status in Schuylerville
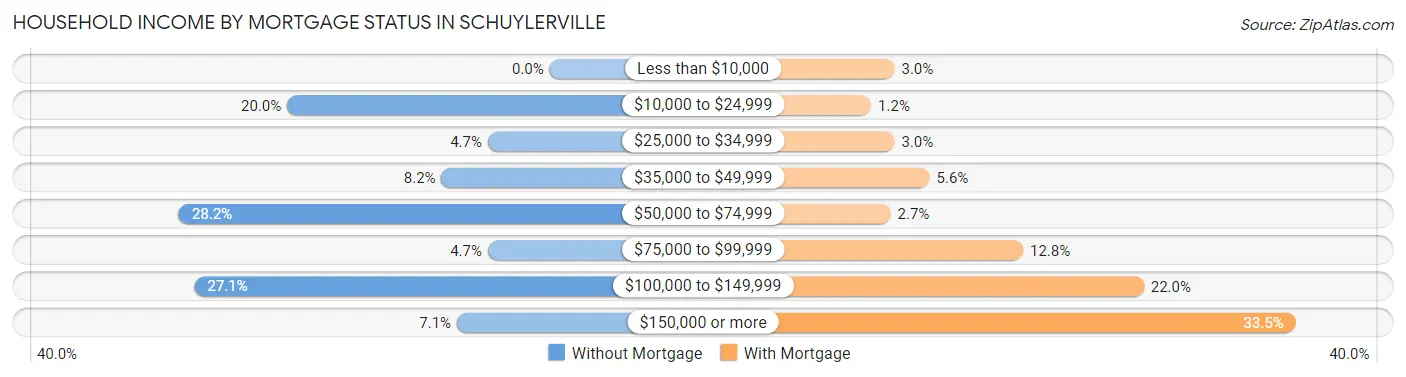
| Household Income | Without Mortgage | With Mortgage |
| Less than $10,000 | 0 (0.0%) | 10 (3.0%) |
| $10,000 to $24,999 | 17 (20.0%) | 4 (1.2%) |
| $25,000 to $34,999 | 4 (4.7%) | 10 (3.0%) |
| $35,000 to $49,999 | 7 (8.2%) | 19 (5.6%) |
| $50,000 to $74,999 | 24 (28.2%) | 9 (2.7%) |
| $75,000 to $99,999 | 4 (4.7%) | 43 (12.8%) |
| $100,000 to $149,999 | 23 (27.1%) | 74 (22.0%) |
| $150,000 or more | 6 (7.1%) | 113 (33.5%) |
| Total | 85 (100.0%) | 337 (100.0%) |
Property Value to Household Income Ratio in Schuylerville
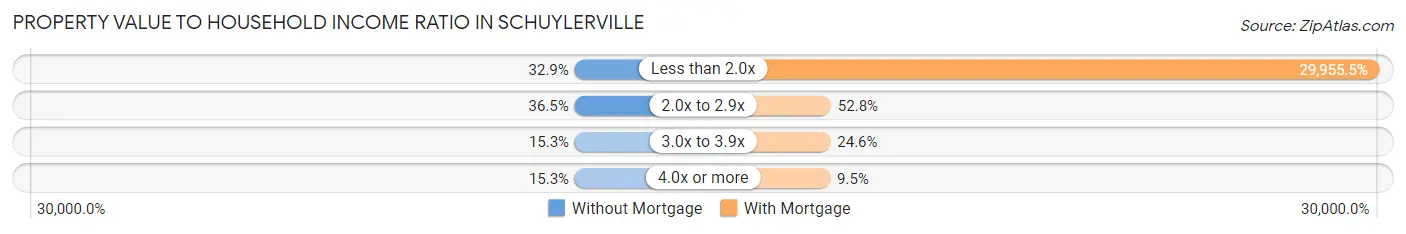
| Value-to-Income Ratio | Without Mortgage | With Mortgage |
| Less than 2.0x | 28 (32.9%) | 100,950 (29,955.5%) |
| 2.0x to 2.9x | 31 (36.5%) | 178 (52.8%) |
| 3.0x to 3.9x | 13 (15.3%) | 83 (24.6%) |
| 4.0x or more | 13 (15.3%) | 32 (9.5%) |
| Total | 85 (100.0%) | 337 (100.0%) |
Real Estate Taxes by Mortgage Status in Schuylerville

| Property Taxes | Without Mortgage | With Mortgage |
| Less than $800 | 0 (0.0%) | 0 (0.0%) |
| $800 to $1,499 | 19 (22.4%) | 4 (1.2%) |
| $800 to $1,499 | 52 (61.2%) | 14 (4.2%) |
| Total | 85 (100.0%) | 337 (100.0%) |
Health & Disability in Schuylerville
Health Insurance Coverage by Age in Schuylerville
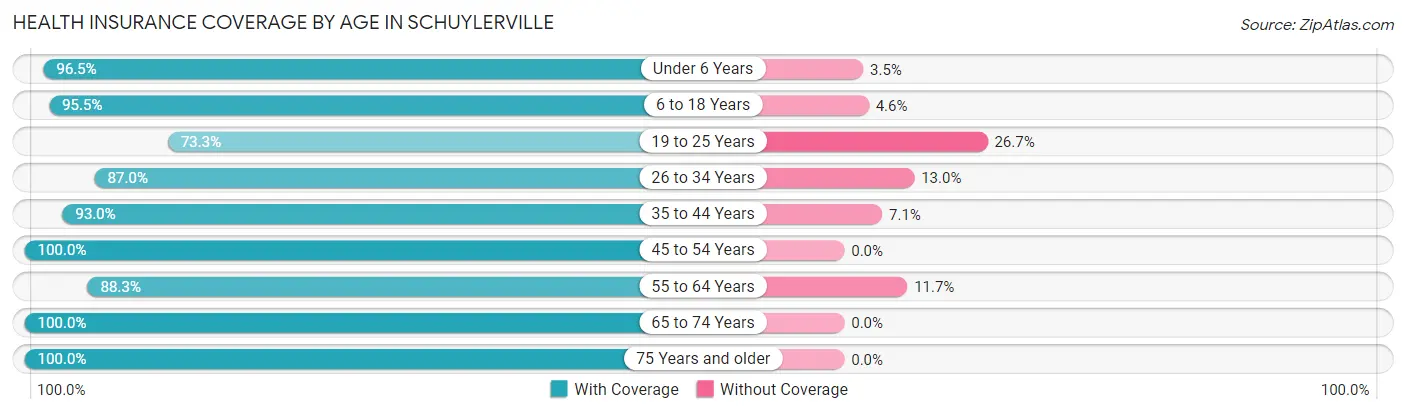
| Age Bracket | With Coverage | Without Coverage |
| Under 6 Years | 110 (96.5%) | 4 (3.5%) |
| 6 to 18 Years | 273 (95.5%) | 13 (4.5%) |
| 19 to 25 Years | 129 (73.3%) | 47 (26.7%) |
| 26 to 34 Years | 220 (87.0%) | 33 (13.0%) |
| 35 to 44 Years | 211 (92.9%) | 16 (7.0%) |
| 45 to 54 Years | 179 (100.0%) | 0 (0.0%) |
| 55 to 64 Years | 173 (88.3%) | 23 (11.7%) |
| 65 to 74 Years | 156 (100.0%) | 0 (0.0%) |
| 75 Years and older | 53 (100.0%) | 0 (0.0%) |
| Total | 1,504 (91.7%) | 136 (8.3%) |
Health Insurance Coverage by Citizenship Status in Schuylerville
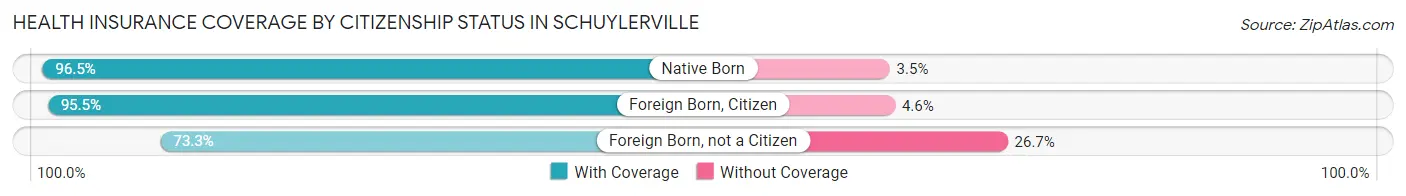
| Citizenship Status | With Coverage | Without Coverage |
| Native Born | 110 (96.5%) | 4 (3.5%) |
| Foreign Born, Citizen | 273 (95.5%) | 13 (4.5%) |
| Foreign Born, not a Citizen | 129 (73.3%) | 47 (26.7%) |
Health Insurance Coverage by Household Income in Schuylerville
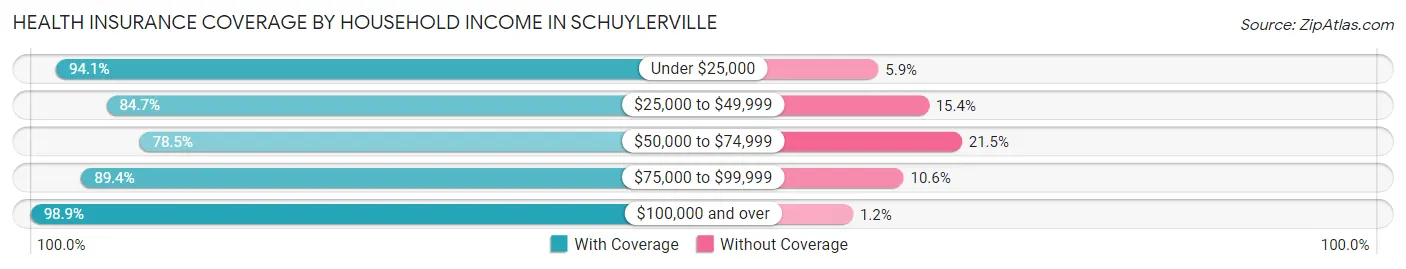
| Household Income | With Coverage | Without Coverage |
| Under $25,000 | 175 (94.1%) | 11 (5.9%) |
| $25,000 to $49,999 | 204 (84.7%) | 37 (15.3%) |
| $50,000 to $74,999 | 193 (78.5%) | 53 (21.5%) |
| $75,000 to $99,999 | 227 (89.4%) | 27 (10.6%) |
| $100,000 and over | 688 (98.9%) | 8 (1.1%) |
Public vs Private Health Insurance Coverage by Age in Schuylerville
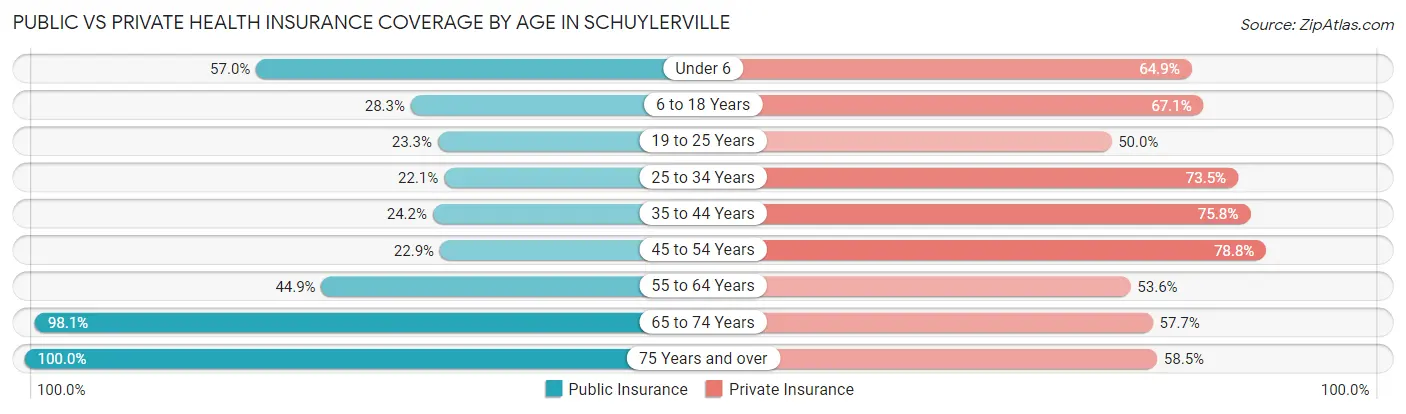
| Age Bracket | Public Insurance | Private Insurance |
| Under 6 | 65 (57.0%) | 74 (64.9%) |
| 6 to 18 Years | 81 (28.3%) | 192 (67.1%) |
| 19 to 25 Years | 41 (23.3%) | 88 (50.0%) |
| 25 to 34 Years | 56 (22.1%) | 186 (73.5%) |
| 35 to 44 Years | 55 (24.2%) | 172 (75.8%) |
| 45 to 54 Years | 41 (22.9%) | 141 (78.8%) |
| 55 to 64 Years | 88 (44.9%) | 105 (53.6%) |
| 65 to 74 Years | 153 (98.1%) | 90 (57.7%) |
| 75 Years and over | 53 (100.0%) | 31 (58.5%) |
| Total | 633 (38.6%) | 1,079 (65.8%) |
Disability Status by Sex by Age in Schuylerville
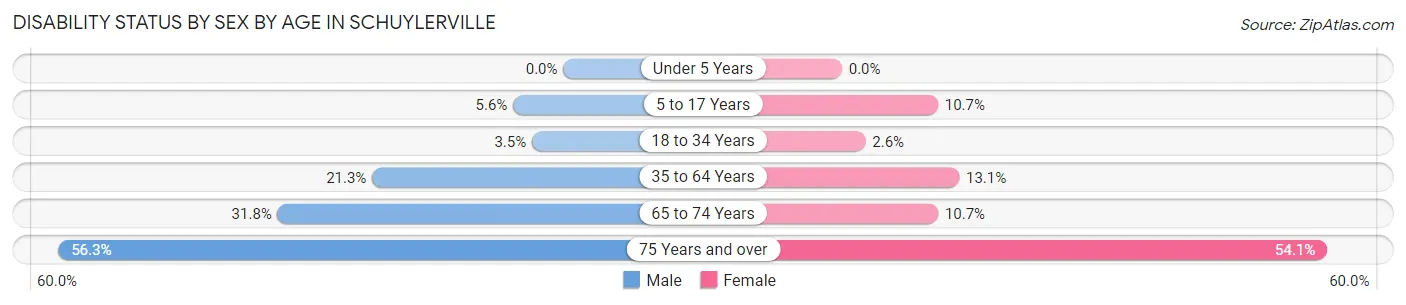
| Age Bracket | Male | Female |
| Under 5 Years | 0 (0.0%) | 0 (0.0%) |
| 5 to 17 Years | 8 (5.6%) | 14 (10.7%) |
| 18 to 34 Years | 9 (3.5%) | 5 (2.6%) |
| 35 to 64 Years | 76 (21.3%) | 32 (13.1%) |
| 65 to 74 Years | 14 (31.8%) | 12 (10.7%) |
| 75 Years and over | 9 (56.2%) | 20 (54.0%) |
Disability Class by Sex by Age in Schuylerville
Disability Class: Hearing Difficulty
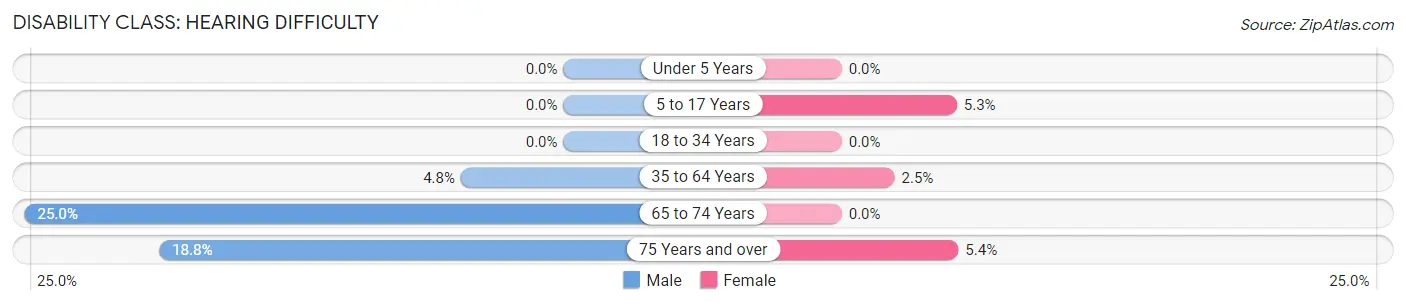
| Age Bracket | Male | Female |
| Under 5 Years | 0 (0.0%) | 0 (0.0%) |
| 5 to 17 Years | 0 (0.0%) | 7 (5.3%) |
| 18 to 34 Years | 0 (0.0%) | 0 (0.0%) |
| 35 to 64 Years | 17 (4.8%) | 6 (2.5%) |
| 65 to 74 Years | 11 (25.0%) | 0 (0.0%) |
| 75 Years and over | 3 (18.8%) | 2 (5.4%) |
Disability Class: Vision Difficulty
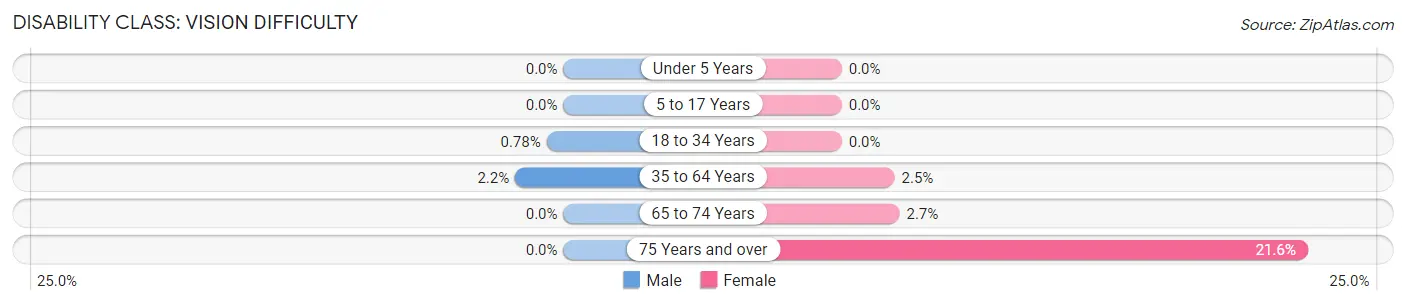
| Age Bracket | Male | Female |
| Under 5 Years | 0 (0.0%) | 0 (0.0%) |
| 5 to 17 Years | 0 (0.0%) | 0 (0.0%) |
| 18 to 34 Years | 2 (0.8%) | 0 (0.0%) |
| 35 to 64 Years | 8 (2.2%) | 6 (2.5%) |
| 65 to 74 Years | 0 (0.0%) | 3 (2.7%) |
| 75 Years and over | 0 (0.0%) | 8 (21.6%) |
Disability Class: Cognitive Difficulty
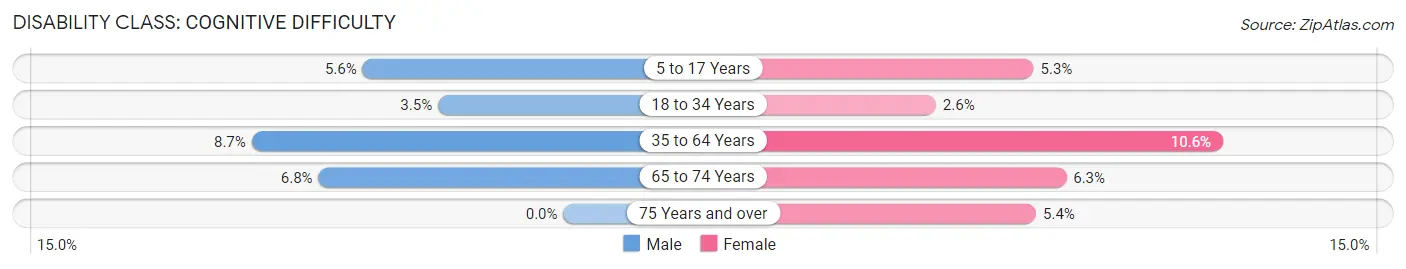
| Age Bracket | Male | Female |
| 5 to 17 Years | 8 (5.6%) | 7 (5.3%) |
| 18 to 34 Years | 9 (3.5%) | 5 (2.6%) |
| 35 to 64 Years | 31 (8.7%) | 26 (10.6%) |
| 65 to 74 Years | 3 (6.8%) | 7 (6.2%) |
| 75 Years and over | 0 (0.0%) | 2 (5.4%) |
Disability Class: Ambulatory Difficulty
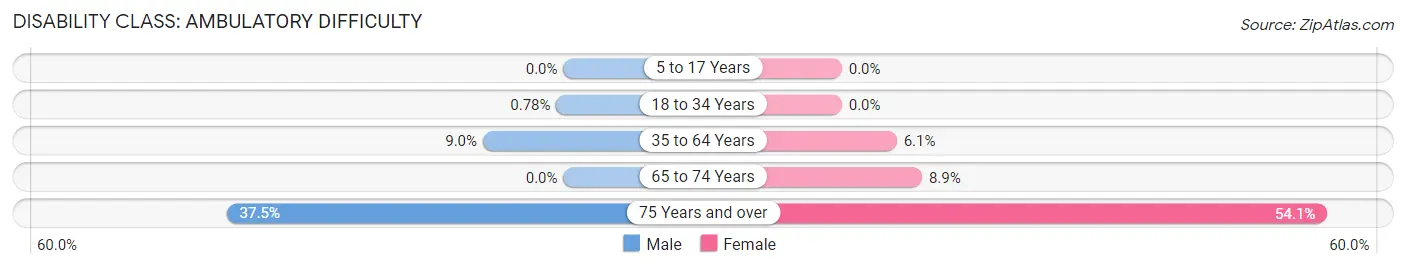
| Age Bracket | Male | Female |
| 5 to 17 Years | 0 (0.0%) | 0 (0.0%) |
| 18 to 34 Years | 2 (0.8%) | 0 (0.0%) |
| 35 to 64 Years | 32 (9.0%) | 15 (6.1%) |
| 65 to 74 Years | 0 (0.0%) | 10 (8.9%) |
| 75 Years and over | 6 (37.5%) | 20 (54.0%) |
Disability Class: Self-Care Difficulty
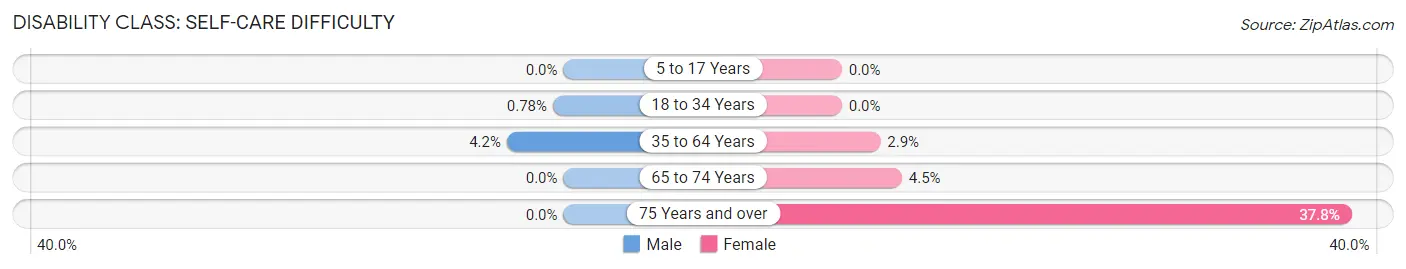
| Age Bracket | Male | Female |
| 5 to 17 Years | 0 (0.0%) | 0 (0.0%) |
| 18 to 34 Years | 2 (0.8%) | 0 (0.0%) |
| 35 to 64 Years | 15 (4.2%) | 7 (2.9%) |
| 65 to 74 Years | 0 (0.0%) | 5 (4.5%) |
| 75 Years and over | 0 (0.0%) | 14 (37.8%) |
Technology Access in Schuylerville
Computing Device Access in Schuylerville
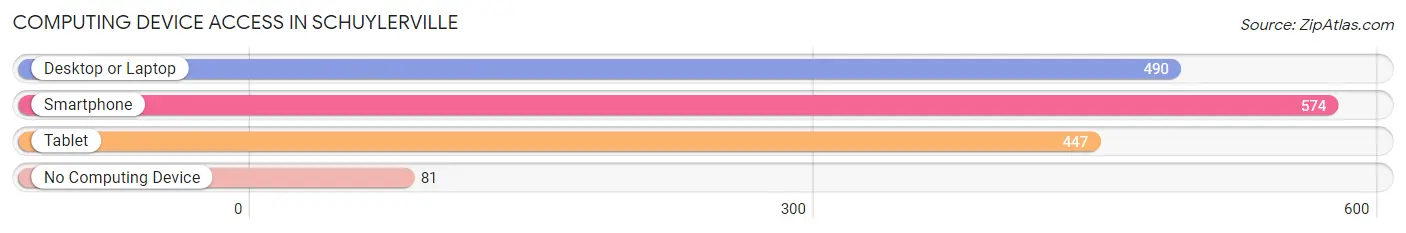
| Device Type | # Households | % Households |
| Desktop or Laptop | 490 | 70.5% |
| Smartphone | 574 | 82.6% |
| Tablet | 447 | 64.3% |
| No Computing Device | 81 | 11.7% |
| Total | 695 | 100.0% |
Internet Access in Schuylerville
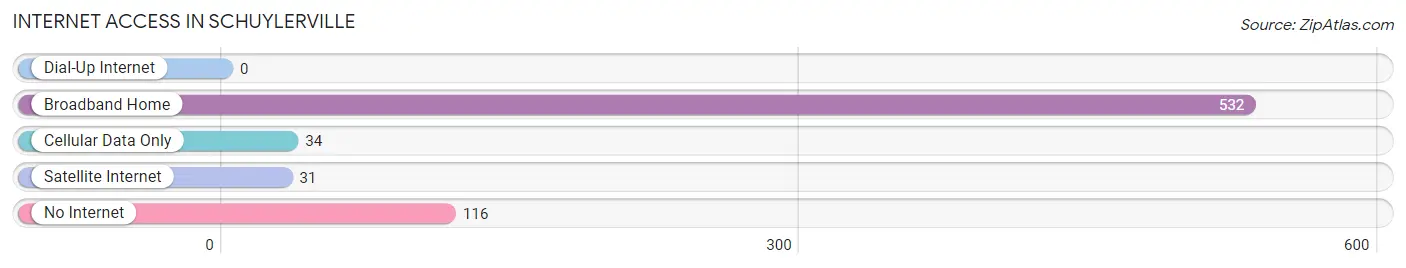
| Internet Type | # Households | % Households |
| Dial-Up Internet | 0 | 0.0% |
| Broadband Home | 532 | 76.5% |
| Cellular Data Only | 34 | 4.9% |
| Satellite Internet | 31 | 4.5% |
| No Internet | 116 | 16.7% |
| Total | 695 | 100.0% |
Schuylerville Summary
Schuylerville is a village located in Saratoga County, New York, United States. The population was 1,711 at the 2010 census. It is part of the Glens Falls Metropolitan Statistical Area. The village is named after the Schuyler family, prominent in the area since the 18th century.
History
Schuylerville was first settled in 1776 by Dutch and German immigrants. The village was originally known as Saratoga, but was renamed Schuylerville in 1831 in honor of the Schuyler family, who had been prominent in the area since the 18th century. The Schuylerville area was the site of several battles during the American Revolution, including the Battle of Saratoga in 1777.
The village was incorporated in 1831 and was the county seat of Saratoga County until 1848, when the county seat was moved to Ballston Spa. The village was the site of the first public library in the county, established in 1832.
Geography
Schuylerville is located at the confluence of the Hudson and Mohawk Rivers. The village is located in the eastern part of Saratoga County, about 10 miles south of Saratoga Springs. The village is bordered by the towns of Saratoga, Northumberland, and Stillwater.
The village has a total area of 1 2 square miles all of which is land
Economy
The economy of Schuylerville is largely based on tourism and agriculture. The village is home to several historic sites, including the Saratoga National Historical Park, the Saratoga Monument, and the Saratoga Battlefield. The village is also home to several wineries and breweries, as well as several small businesses.
Demographics
As of the 2010 census, there were 1,711 people, 717 households, and 441 families residing in the village. The population density was 1,420.8 people per square mile. The racial makeup of the village was 97.2% White, 0.9% African American, 0.2% Native American, 0.4% Asian, 0.1% Pacific Islander, 0.2% from other races, and 1.0% from two or more races. Hispanic or Latino of any race were 1.2% of the population.
There were 717 households, out of which 28.2% had children under the age of 18 living with them, 44.2% were married couples living together, 11.7% had a female householder with no husband present, and 38.7% were non-families. 32.2% of all households were made up of individuals, and 13.2% had someone living alone who was 65 years of age or older. The average household size was 2.37 and the average family size was 3.02.
In the village, the population was spread out, with 24.2% under the age of 18, 7.2% from 18 to 24, 28.2% from 25 to 44, 24.2% from 45 to 64, and 16.2% who were 65 years of age or older. The median age was 38 years. For every 100 females, there were 91.2 males. For every 100 females age 18 and over, there were 87.2 males.
The median income for a household in the village was $41,250, and the median income for a family was $50,000. Males had a median income of $36,250 versus $27,500 for females. The per capita income for the village was $20,945. About 6.2% of families and 8.2% of the population were below the poverty line, including 10.2% of those under age 18 and 5.2% of those age 65 or over.
Common Questions
What is Per Capita Income in Schuylerville?
Per Capita income in Schuylerville is $35,422.
What is the Median Family Income in Schuylerville?
Median Family Income in Schuylerville is $99,464.
What is the Median Household income in Schuylerville?
Median Household Income in Schuylerville is $66,953.
What is Income or Wage Gap in Schuylerville?
Income or Wage Gap in Schuylerville is 25.4%.
Women in Schuylerville earn 74.6 cents for every dollar earned by a man.
What is Inequality or Gini Index in Schuylerville?
Inequality or Gini Index in Schuylerville is 0.43.
What is the Total Population of Schuylerville?
Total Population of Schuylerville is 1,640.
What is the Total Male Population of Schuylerville?
Total Male Population of Schuylerville is 870.
What is the Total Female Population of Schuylerville?
Total Female Population of Schuylerville is 770.
What is the Ratio of Males per 100 Females in Schuylerville?
There are 112.99 Males per 100 Females in Schuylerville.
What is the Ratio of Females per 100 Males in Schuylerville?
There are 88.51 Females per 100 Males in Schuylerville.
What is the Median Population Age in Schuylerville?
Median Population Age in Schuylerville is 34.9 Years.
What is the Average Family Size in Schuylerville
Average Family Size in Schuylerville is 3.2 People.
What is the Average Household Size in Schuylerville
Average Household Size in Schuylerville is 2.3 People.
How Large is the Labor Force in Schuylerville?
There are 908 People in the Labor Forcein in Schuylerville.
What is the Percentage of People in the Labor Force in Schuylerville?
70.4% of People are in the Labor Force in Schuylerville.
What is the Unemployment Rate in Schuylerville?
Unemployment Rate in Schuylerville is 3.0%.