Central Square, NY Map & Demographics
Central Square Map

Central Square Overview
$48,114
PER CAPITA INCOME
$111,563
AVG FAMILY INCOME
$58,824
AVG HOUSEHOLD INCOME
45.2%
WAGE / INCOME GAP [ % ]
54.8¢/ $1
WAGE / INCOME GAP [ $ ]
0.58
INEQUALITY / GINI INDEX
2,079
TOTAL POPULATION
918
MALE POPULATION
1,161
FEMALE POPULATION
79.07
MALES / 100 FEMALES
126.47
FEMALES / 100 MALES
41.0
MEDIAN AGE
2.9
AVG FAMILY SIZE
2.2
AVG HOUSEHOLD SIZE
1,070
LABOR FORCE [ PEOPLE ]
64.9%
PERCENT IN LABOR FORCE
3.6%
UNEMPLOYMENT RATE
Central Square Zip Codes
Central Square Area Codes
Income in Central Square
Income Overview in Central Square
Per Capita Income in Central Square is $48,114, while median incomes of families and households are $111,563 and $58,824 respectively.
| Characteristic | Number | Measure |
| Per Capita Income | 2,079 | $48,114 |
| Median Family Income | 535 | $111,563 |
| Mean Family Income | 535 | $139,921 |
| Median Household Income | 948 | $58,824 |
| Mean Household Income | 948 | $104,497 |
| Income Deficit | 535 | $0 |
| Wage / Income Gap (%) | 2,079 | 45.24% |
| Wage / Income Gap ($) | 2,079 | 54.76¢ per $1 |
| Gini / Inequality Index | 2,079 | 0.58 |
Earnings by Sex in Central Square
Average Earnings in Central Square are $46,034, $58,988 for men and $32,303 for women, a difference of 45.2%.
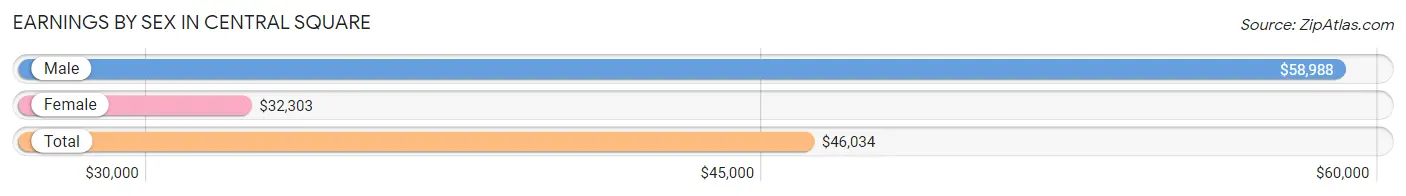
| Sex | Number | Average Earnings |
| Male | 509 (45.3%) | $58,988 |
| Female | 615 (54.7%) | $32,303 |
| Total | 1,124 (100.0%) | $46,034 |
Earnings by Sex by Income Bracket in Central Square
The most common earnings brackets in Central Square are $75,000 to $99,999 for men (98 | 19.3%) and $100,000+ for women (76 | 12.4%).
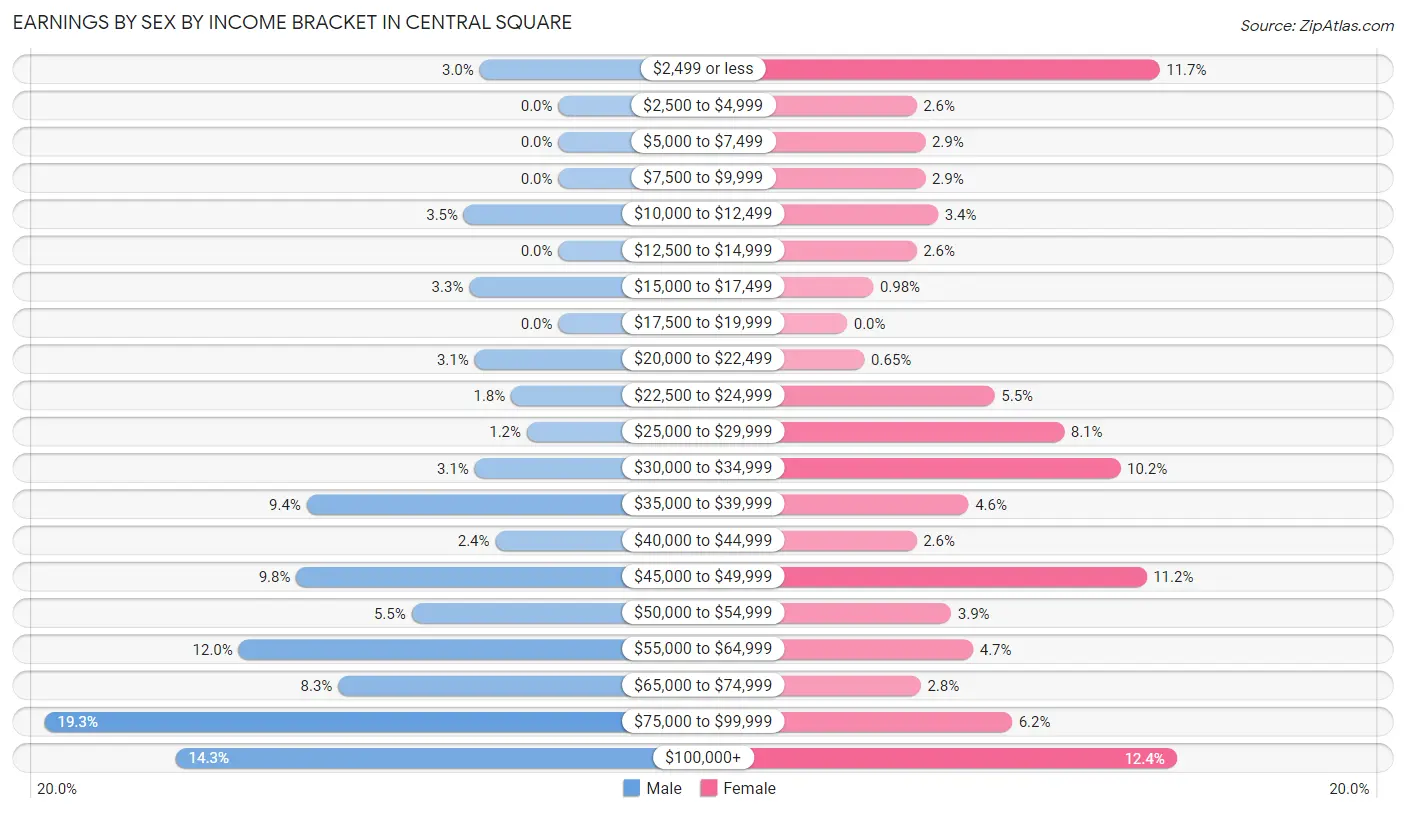
| Income | Male | Female |
| $2,499 or less | 15 (2.9%) | 72 (11.7%) |
| $2,500 to $4,999 | 0 (0.0%) | 16 (2.6%) |
| $5,000 to $7,499 | 0 (0.0%) | 18 (2.9%) |
| $7,500 to $9,999 | 0 (0.0%) | 18 (2.9%) |
| $10,000 to $12,499 | 18 (3.5%) | 21 (3.4%) |
| $12,500 to $14,999 | 0 (0.0%) | 16 (2.6%) |
| $15,000 to $17,499 | 17 (3.3%) | 6 (1.0%) |
| $17,500 to $19,999 | 0 (0.0%) | 0 (0.0%) |
| $20,000 to $22,499 | 16 (3.1%) | 4 (0.6%) |
| $22,500 to $24,999 | 9 (1.8%) | 34 (5.5%) |
| $25,000 to $29,999 | 6 (1.2%) | 50 (8.1%) |
| $30,000 to $34,999 | 16 (3.1%) | 63 (10.2%) |
| $35,000 to $39,999 | 48 (9.4%) | 28 (4.5%) |
| $40,000 to $44,999 | 12 (2.4%) | 16 (2.6%) |
| $45,000 to $49,999 | 50 (9.8%) | 69 (11.2%) |
| $50,000 to $54,999 | 28 (5.5%) | 24 (3.9%) |
| $55,000 to $64,999 | 61 (12.0%) | 29 (4.7%) |
| $65,000 to $74,999 | 42 (8.3%) | 17 (2.8%) |
| $75,000 to $99,999 | 98 (19.3%) | 38 (6.2%) |
| $100,000+ | 73 (14.3%) | 76 (12.4%) |
| Total | 509 (100.0%) | 615 (100.0%) |
Earnings by Sex by Educational Attainment in Central Square
Average earnings in Central Square are $60,985 for men and $35,100 for women, a difference of 42.4%. Men with an educational attainment of graduate degree enjoy the highest average annual earnings of $151,875, while those with high school diploma education earn the least with $53,393. Women with an educational attainment of graduate degree earn the most with the average annual earnings of $75,625, while those with college or associate's degree education have the smallest earnings of $31,750.
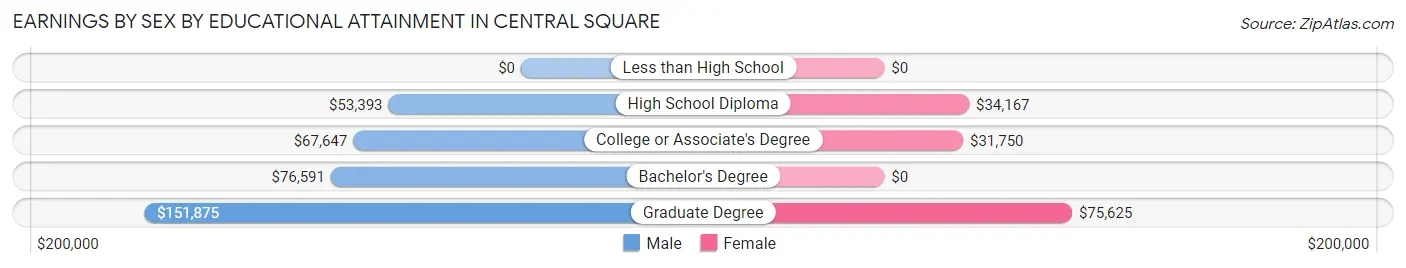
| Educational Attainment | Male Income | Female Income |
| Less than High School | - | - |
| High School Diploma | $53,393 | $34,167 |
| College or Associate's Degree | $67,647 | $31,750 |
| Bachelor's Degree | $76,591 | $0 |
| Graduate Degree | $151,875 | $75,625 |
| Total | $60,985 | $35,100 |
Family Income in Central Square
Family Income Brackets in Central Square
According to the Central Square family income data, there are 133 families falling into the $100,000 to $149,999 income range, which is the most common income bracket and makes up 24.9% of all families. Conversely, the $10,000 to $14,999 income bracket is the least frequent group with only 10 families (1.9%) belonging to this category.
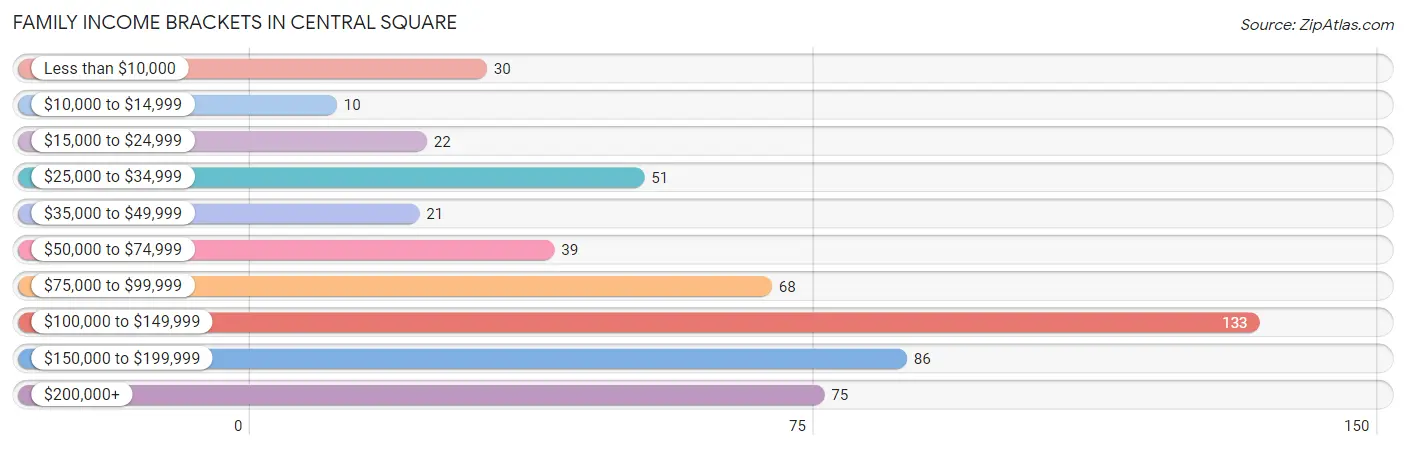
| Income Bracket | # Families | % Families |
| Less than $10,000 | 30 | 5.6% |
| $10,000 to $14,999 | 10 | 1.9% |
| $15,000 to $24,999 | 22 | 4.1% |
| $25,000 to $34,999 | 51 | 9.5% |
| $35,000 to $49,999 | 21 | 3.9% |
| $50,000 to $74,999 | 39 | 7.3% |
| $75,000 to $99,999 | 68 | 12.7% |
| $100,000 to $149,999 | 133 | 24.9% |
| $150,000 to $199,999 | 86 | 16.1% |
| $200,000+ | 75 | 14.0% |
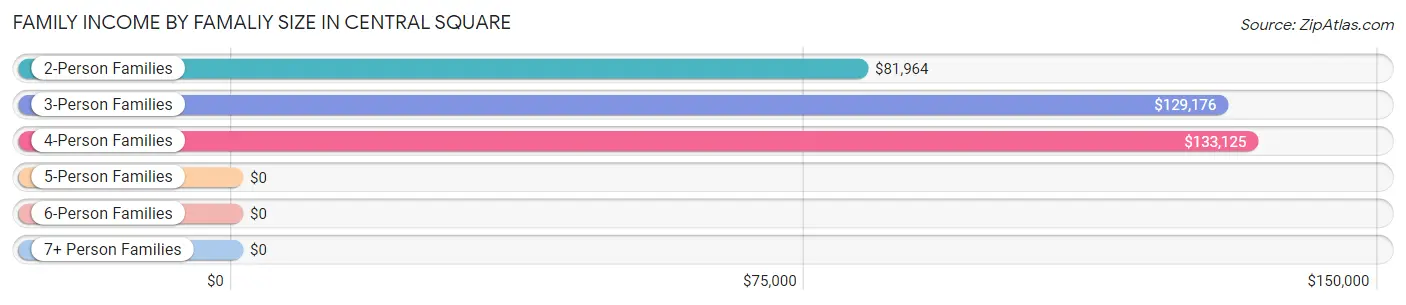
Family Income by Famaliy Size in Central Square
4-person families (106 | 19.8%) account for the highest median family income in Central Square with $133,125 per family, while 3-person families (127 | 23.7%) have the highest median income of $43,059 per family member.
| Income Bracket | # Families | Median Income |
| 2-Person Families | 247 (46.2%) | $81,964 |
| 3-Person Families | 127 (23.7%) | $129,176 |
| 4-Person Families | 106 (19.8%) | $133,125 |
| 5-Person Families | 30 (5.6%) | $0 |
| 6-Person Families | 0 (0.0%) | $0 |
| 7+ Person Families | 25 (4.7%) | $0 |
| Total | 535 (100.0%) | $111,563 |
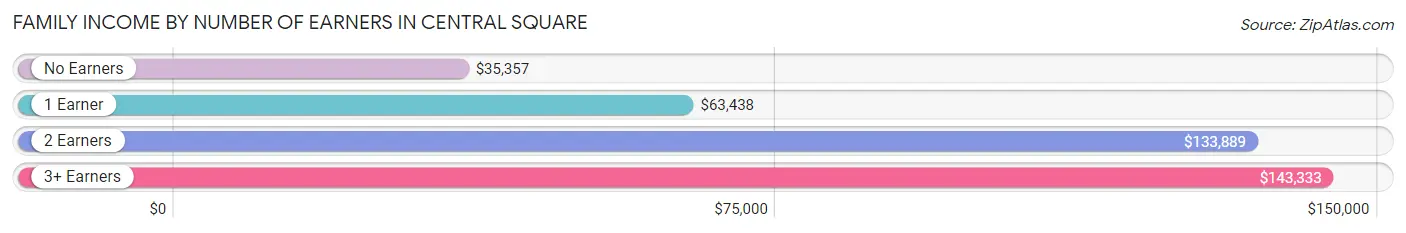
Family Income by Number of Earners in Central Square
The median family income in Central Square is $111,563, with families comprising 3+ earners (142) having the highest median family income of $143,333, while families with no earners (90) have the lowest median family income of $35,357, accounting for 26.5% and 16.8% of families, respectively.
| Number of Earners | # Families | Median Income |
| No Earners | 90 (16.8%) | $35,357 |
| 1 Earner | 121 (22.6%) | $63,438 |
| 2 Earners | 182 (34.0%) | $133,889 |
| 3+ Earners | 142 (26.5%) | $143,333 |
| Total | 535 (100.0%) | $111,563 |
Household Income in Central Square
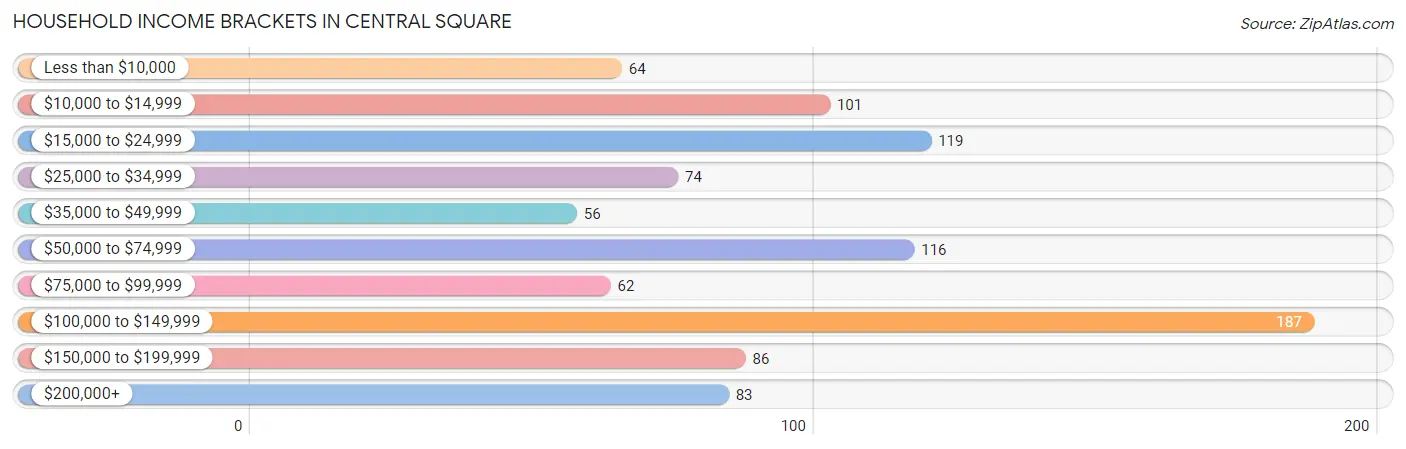
Household Income Brackets in Central Square
With 187 households falling in the category, the $100,000 to $149,999 income range is the most frequent in Central Square, accounting for 19.7% of all households. In contrast, only 56 households (5.9%) fall into the $35,000 to $49,999 income bracket, making it the least populous group.
| Income Bracket | # Households | % Households |
| Less than $10,000 | 64 | 6.8% |
| $10,000 to $14,999 | 101 | 10.7% |
| $15,000 to $24,999 | 119 | 12.6% |
| $25,000 to $34,999 | 74 | 7.8% |
| $35,000 to $49,999 | 56 | 5.9% |
| $50,000 to $74,999 | 116 | 12.2% |
| $75,000 to $99,999 | 62 | 6.5% |
| $100,000 to $149,999 | 187 | 19.7% |
| $150,000 to $199,999 | 86 | 9.1% |
| $200,000+ | 83 | 8.8% |
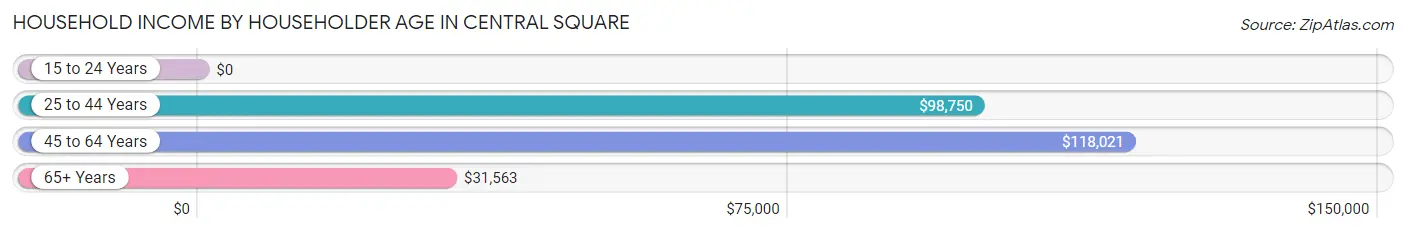
Household Income by Householder Age in Central Square
The median household income in Central Square is $58,824, with the highest median household income of $118,021 found in the 45 to 64 years age bracket for the primary householder. A total of 361 households (38.1%) fall into this category. Meanwhile, the 15 to 24 years age bracket for the primary householder has the lowest median household income of $0, with 7 households (0.7%) in this group.
| Income Bracket | # Households | Median Income |
| 15 to 24 Years | 7 (0.7%) | $0 |
| 25 to 44 Years | 278 (29.3%) | $98,750 |
| 45 to 64 Years | 361 (38.1%) | $118,021 |
| 65+ Years | 302 (31.9%) | $31,563 |
| Total | 948 (100.0%) | $58,824 |
Poverty in Central Square
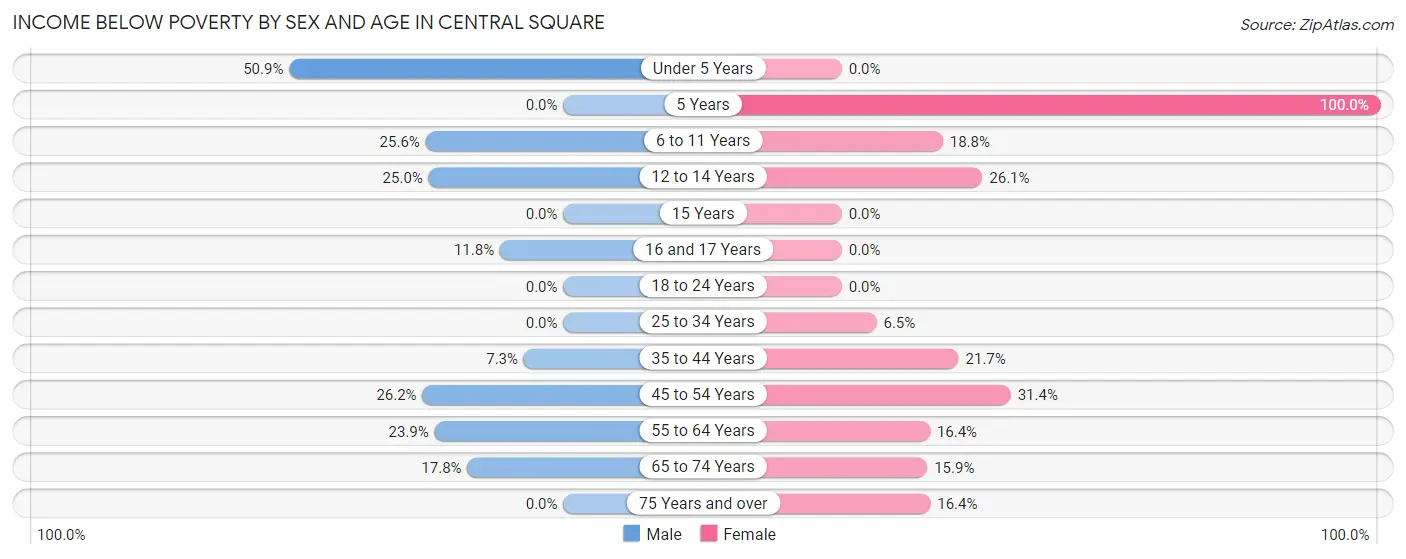
Income Below Poverty by Sex and Age in Central Square
With 18.2% poverty level for males and 15.0% for females among the residents of Central Square, under 5 year old males and 5 year old females are the most vulnerable to poverty, with 29 males (50.9%) and 10 females (100.0%) in their respective age groups living below the poverty level.
| Age Bracket | Male | Female |
| Under 5 Years | 29 (50.9%) | 0 (0.0%) |
| 5 Years | 0 (0.0%) | 10 (100.0%) |
| 6 to 11 Years | 23 (25.6%) | 12 (18.8%) |
| 12 to 14 Years | 11 (25.0%) | 6 (26.1%) |
| 15 Years | 0 (0.0%) | 0 (0.0%) |
| 16 and 17 Years | 2 (11.8%) | 0 (0.0%) |
| 18 to 24 Years | 0 (0.0%) | 0 (0.0%) |
| 25 to 34 Years | 0 (0.0%) | 6 (6.5%) |
| 35 to 44 Years | 11 (7.3%) | 31 (21.7%) |
| 45 to 54 Years | 34 (26.2%) | 37 (31.4%) |
| 55 to 64 Years | 44 (23.9%) | 27 (16.4%) |
| 65 to 74 Years | 13 (17.8%) | 23 (15.9%) |
| 75 Years and over | 0 (0.0%) | 22 (16.4%) |
| Total | 167 (18.2%) | 174 (15.0%) |
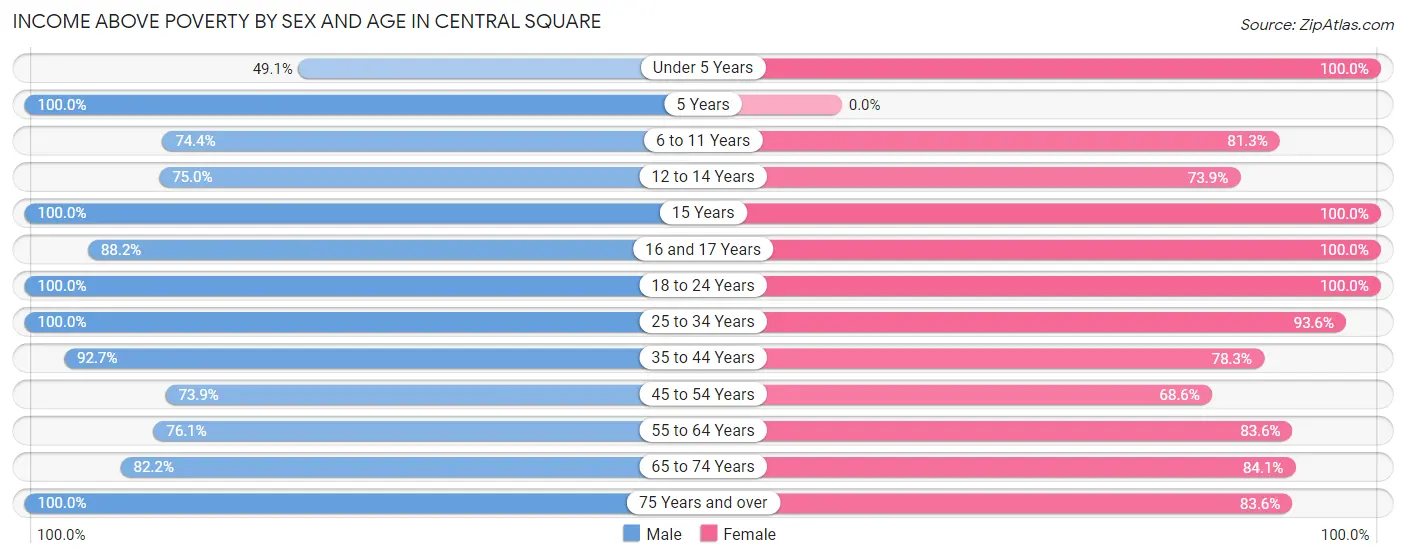
Income Above Poverty by Sex and Age in Central Square
According to the poverty statistics in Central Square, males aged 5 years and females aged under 5 years are the age groups that are most secure financially, with 100.0% of males and 100.0% of females in these age groups living above the poverty line.
| Age Bracket | Male | Female |
| Under 5 Years | 28 (49.1%) | 85 (100.0%) |
| 5 Years | 13 (100.0%) | 0 (0.0%) |
| 6 to 11 Years | 67 (74.4%) | 52 (81.2%) |
| 12 to 14 Years | 33 (75.0%) | 17 (73.9%) |
| 15 Years | 21 (100.0%) | 24 (100.0%) |
| 16 and 17 Years | 15 (88.2%) | 21 (100.0%) |
| 18 to 24 Years | 28 (100.0%) | 136 (100.0%) |
| 25 to 34 Years | 90 (100.0%) | 87 (93.5%) |
| 35 to 44 Years | 139 (92.7%) | 112 (78.3%) |
| 45 to 54 Years | 96 (73.9%) | 81 (68.6%) |
| 55 to 64 Years | 140 (76.1%) | 138 (83.6%) |
| 65 to 74 Years | 60 (82.2%) | 122 (84.1%) |
| 75 Years and over | 21 (100.0%) | 112 (83.6%) |
| Total | 751 (81.8%) | 987 (85.0%) |
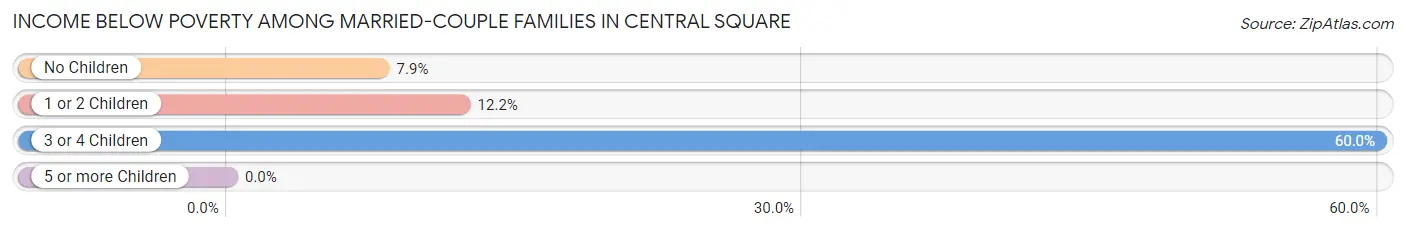
Income Below Poverty Among Married-Couple Families in Central Square
The poverty statistics for married-couple families in Central Square show that 11.0% or 46 of the total 417 families live below the poverty line. Families with 3 or 4 children have the highest poverty rate of 60.0%, comprising of 12 families. On the other hand, families with 5 or more children have the lowest poverty rate of 0.0%, which includes 0 families.
| Children | Above Poverty | Below Poverty |
| No Children | 244 (92.1%) | 21 (7.9%) |
| 1 or 2 Children | 94 (87.8%) | 13 (12.1%) |
| 3 or 4 Children | 8 (40.0%) | 12 (60.0%) |
| 5 or more Children | 25 (100.0%) | 0 (0.0%) |
| Total | 371 (89.0%) | 46 (11.0%) |
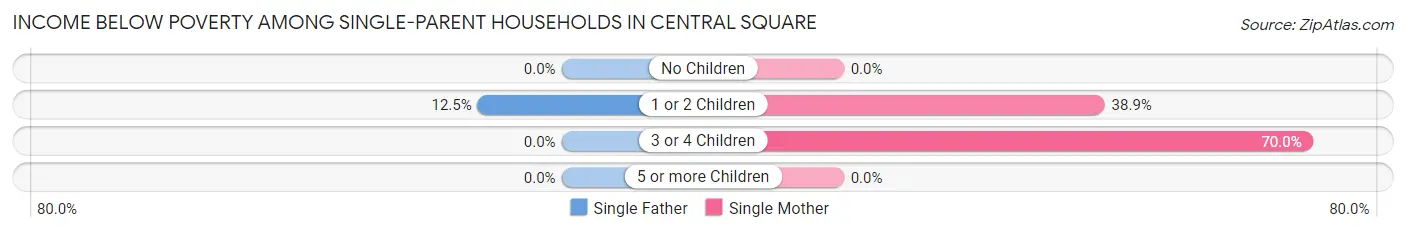
Income Below Poverty Among Single-Parent Households in Central Square
According to the poverty data in Central Square, 12.5% or 6 single-father households and 30.0% or 21 single-mother households are living below the poverty line. Among single-father households, those with 1 or 2 children have the highest poverty rate, with 6 households (12.5%) experiencing poverty. Likewise, among single-mother households, those with 3 or 4 children have the highest poverty rate, with 7 households (70.0%) falling below the poverty line.
| Children | Single Father | Single Mother |
| No Children | 0 (0.0%) | 0 (0.0%) |
| 1 or 2 Children | 6 (12.5%) | 14 (38.9%) |
| 3 or 4 Children | 0 (0.0%) | 7 (70.0%) |
| 5 or more Children | 0 (0.0%) | 0 (0.0%) |
| Total | 6 (12.5%) | 21 (30.0%) |
Income Below Poverty Among Married-Couple vs Single-Parent Households in Central Square
The poverty data for Central Square shows that 46 of the married-couple family households (11.0%) and 27 of the single-parent households (22.9%) are living below the poverty level. Within the married-couple family households, those with 3 or 4 children have the highest poverty rate, with 12 households (60.0%) falling below the poverty line. Among the single-parent households, those with 3 or 4 children have the highest poverty rate, with 7 household (70.0%) living below poverty.
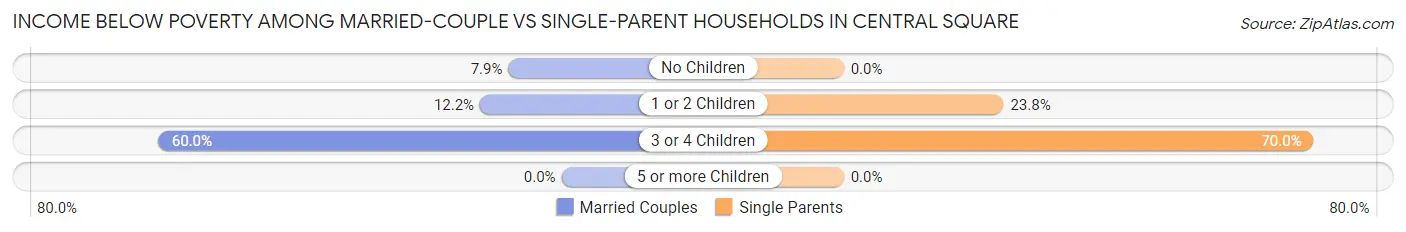
| Children | Married-Couple Families | Single-Parent Households |
| No Children | 21 (7.9%) | 0 (0.0%) |
| 1 or 2 Children | 13 (12.1%) | 20 (23.8%) |
| 3 or 4 Children | 12 (60.0%) | 7 (70.0%) |
| 5 or more Children | 0 (0.0%) | 0 (0.0%) |
| Total | 46 (11.0%) | 27 (22.9%) |
Race in Central Square
The most populous races in Central Square are White / Caucasian (2,036 | 97.9%), Two or more Races (28 | 1.3%), and Black / African American (11 | 0.5%).
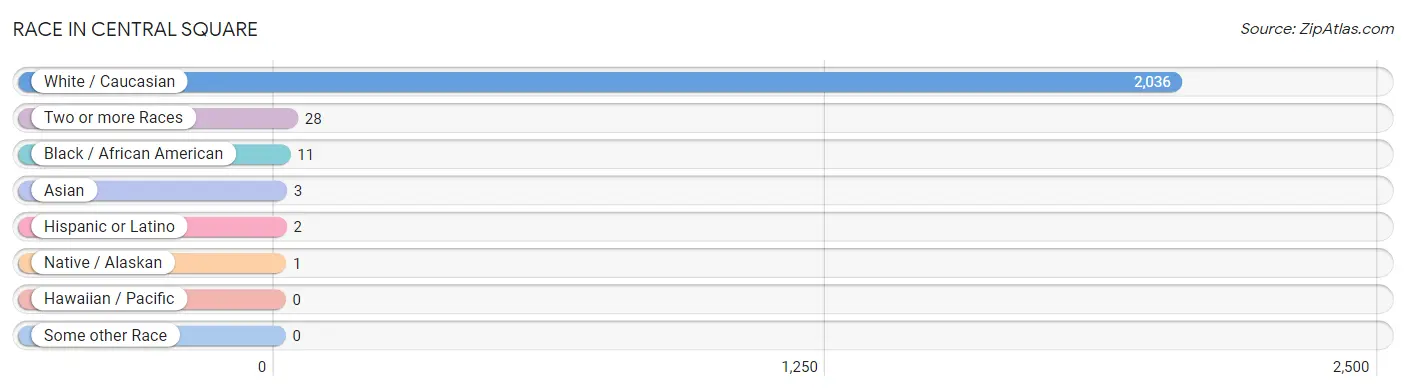
| Race | # Population | % Population |
| Asian | 3 | 0.1% |
| Black / African American | 11 | 0.5% |
| Hawaiian / Pacific | 0 | 0.0% |
| Hispanic or Latino | 2 | 0.1% |
| Native / Alaskan | 1 | 0.1% |
| White / Caucasian | 2,036 | 97.9% |
| Two or more Races | 28 | 1.3% |
| Some other Race | 0 | 0.0% |
| Total | 2,079 | 100.0% |
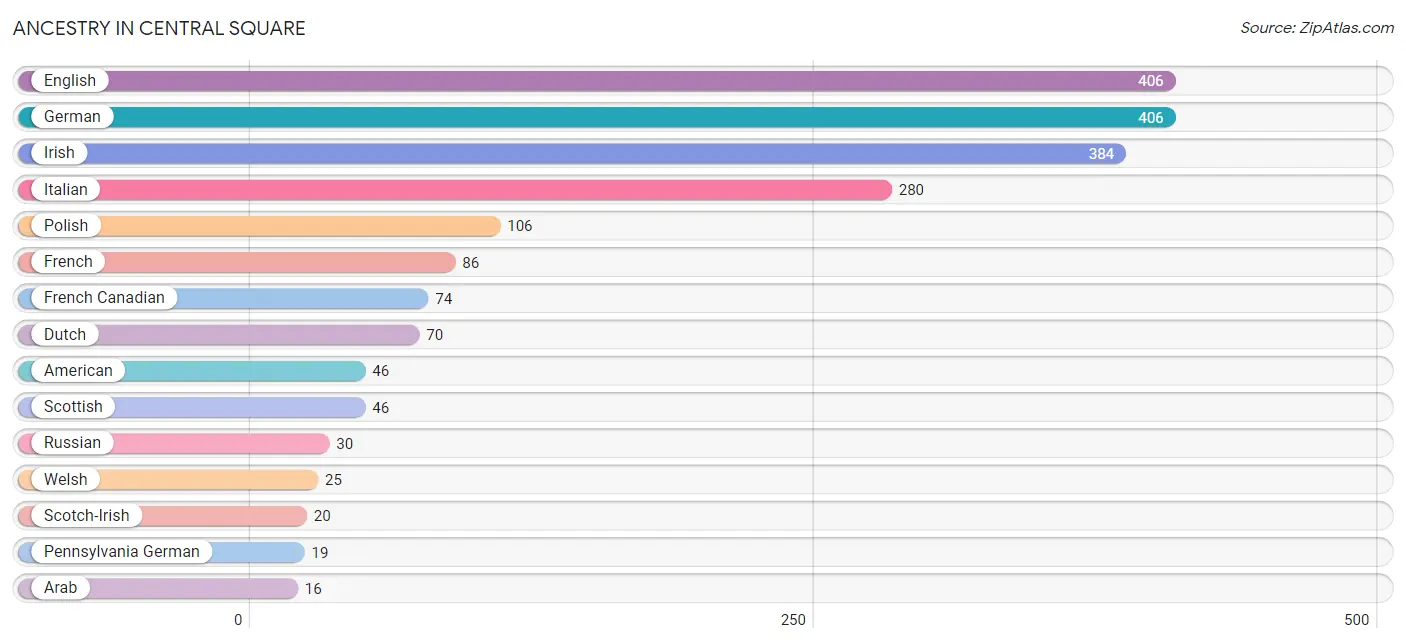
Ancestry in Central Square
The most populous ancestries reported in Central Square are English (406 | 19.5%), German (406 | 19.5%), Irish (384 | 18.5%), Italian (280 | 13.5%), and Polish (106 | 5.1%), together accounting for 76.1% of all Central Square residents.
| Ancestry | # Population | % Population |
| American | 46 | 2.2% |
| Arab | 16 | 0.8% |
| Belgian | 11 | 0.5% |
| Dutch | 70 | 3.4% |
| Eastern European | 3 | 0.1% |
| English | 406 | 19.5% |
| European | 10 | 0.5% |
| French | 86 | 4.1% |
| French Canadian | 74 | 3.6% |
| German | 406 | 19.5% |
| Hungarian | 5 | 0.2% |
| Irish | 384 | 18.5% |
| Iroquois | 1 | 0.1% |
| Italian | 280 | 13.5% |
| Jamaican | 3 | 0.1% |
| Korean | 9 | 0.4% |
| Latvian | 5 | 0.2% |
| Lebanese | 16 | 0.8% |
| Pennsylvania German | 19 | 0.9% |
| Polish | 106 | 5.1% |
| Portuguese | 14 | 0.7% |
| Puerto Rican | 2 | 0.1% |
| Russian | 30 | 1.4% |
| Scotch-Irish | 20 | 1.0% |
| Scottish | 46 | 2.2% |
| Slovak | 7 | 0.3% |
| Slovene | 5 | 0.2% |
| Swedish | 4 | 0.2% |
| Swiss | 13 | 0.6% |
| Turkish | 16 | 0.8% |
| Welsh | 25 | 1.2% | View All 31 Rows |
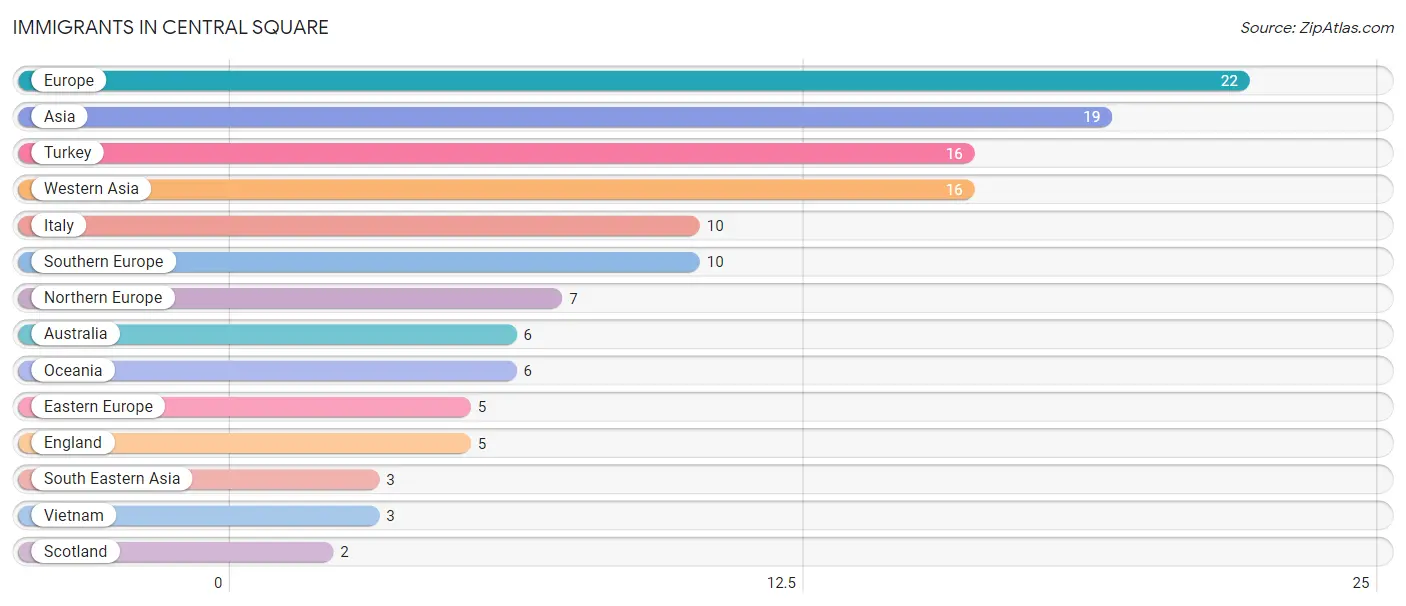
Immigrants in Central Square
The most numerous immigrant groups reported in Central Square came from Europe (22 | 1.1%), Asia (19 | 0.9%), Turkey (16 | 0.8%), Western Asia (16 | 0.8%), and Italy (10 | 0.5%), together accounting for 4.0% of all Central Square residents.
| Immigration Origin | # Population | % Population |
| Asia | 19 | 0.9% |
| Australia | 6 | 0.3% |
| Eastern Europe | 5 | 0.2% |
| England | 5 | 0.2% |
| Europe | 22 | 1.1% |
| Italy | 10 | 0.5% |
| Northern Europe | 7 | 0.3% |
| Oceania | 6 | 0.3% |
| Scotland | 2 | 0.1% |
| South Eastern Asia | 3 | 0.1% |
| Southern Europe | 10 | 0.5% |
| Turkey | 16 | 0.8% |
| Vietnam | 3 | 0.1% |
| Western Asia | 16 | 0.8% | View All 14 Rows |
Sex and Age in Central Square
Sex and Age in Central Square
The most populous age groups in Central Square are 55 to 59 Years (119 | 13.0%) for men and 55 to 59 Years (121 | 10.4%) for women.
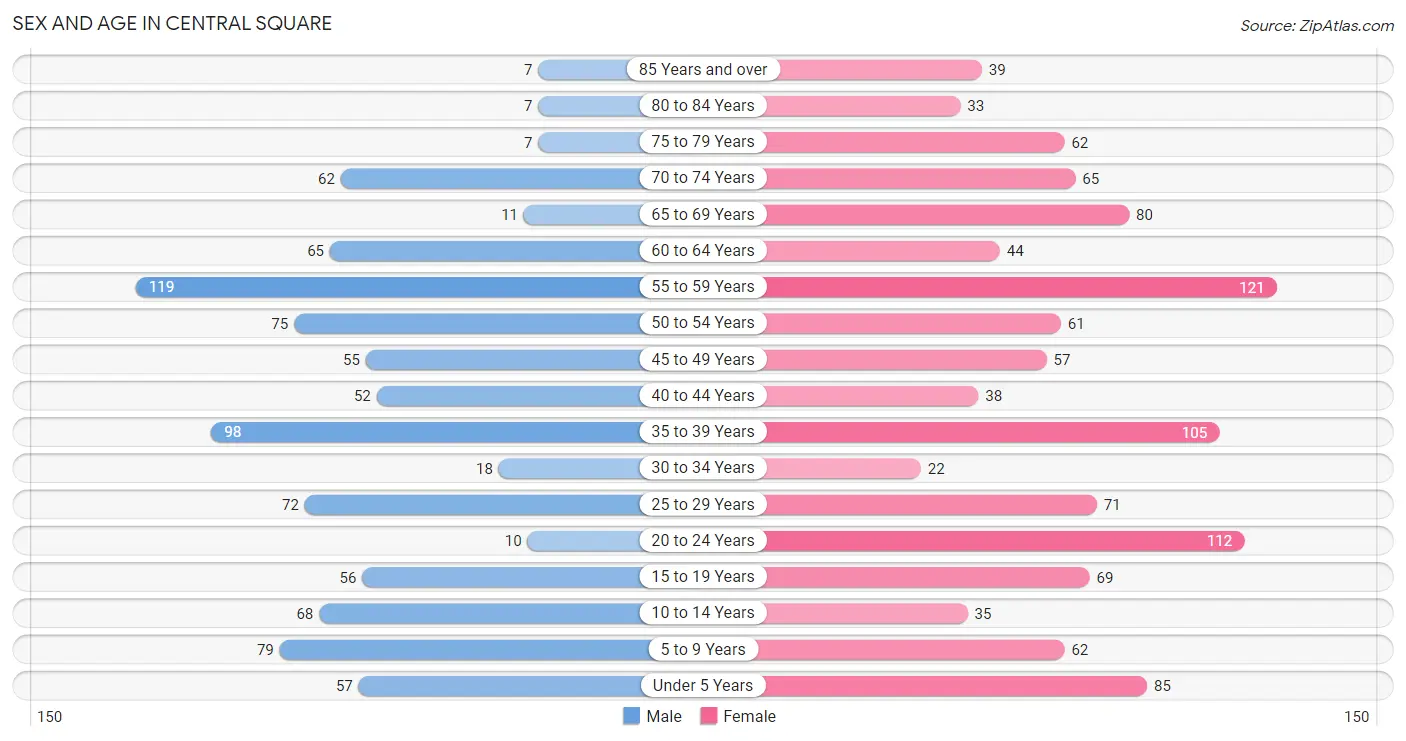
| Age Bracket | Male | Female |
| Under 5 Years | 57 (6.2%) | 85 (7.3%) |
| 5 to 9 Years | 79 (8.6%) | 62 (5.3%) |
| 10 to 14 Years | 68 (7.4%) | 35 (3.0%) |
| 15 to 19 Years | 56 (6.1%) | 69 (5.9%) |
| 20 to 24 Years | 10 (1.1%) | 112 (9.7%) |
| 25 to 29 Years | 72 (7.8%) | 71 (6.1%) |
| 30 to 34 Years | 18 (2.0%) | 22 (1.9%) |
| 35 to 39 Years | 98 (10.7%) | 105 (9.0%) |
| 40 to 44 Years | 52 (5.7%) | 38 (3.3%) |
| 45 to 49 Years | 55 (6.0%) | 57 (4.9%) |
| 50 to 54 Years | 75 (8.2%) | 61 (5.2%) |
| 55 to 59 Years | 119 (13.0%) | 121 (10.4%) |
| 60 to 64 Years | 65 (7.1%) | 44 (3.8%) |
| 65 to 69 Years | 11 (1.2%) | 80 (6.9%) |
| 70 to 74 Years | 62 (6.8%) | 65 (5.6%) |
| 75 to 79 Years | 7 (0.8%) | 62 (5.3%) |
| 80 to 84 Years | 7 (0.8%) | 33 (2.8%) |
| 85 Years and over | 7 (0.8%) | 39 (3.4%) |
| Total | 918 (100.0%) | 1,161 (100.0%) |
Families and Households in Central Square
Median Family Size in Central Square
The median family size in Central Square is 2.94 persons per family, with married-couple families (417 | 77.9%) accounting for the largest median family size of 3.12 persons per family. On the other hand, single male/father families (48 | 9.0%) represent the smallest median family size with 1.83 persons per family.
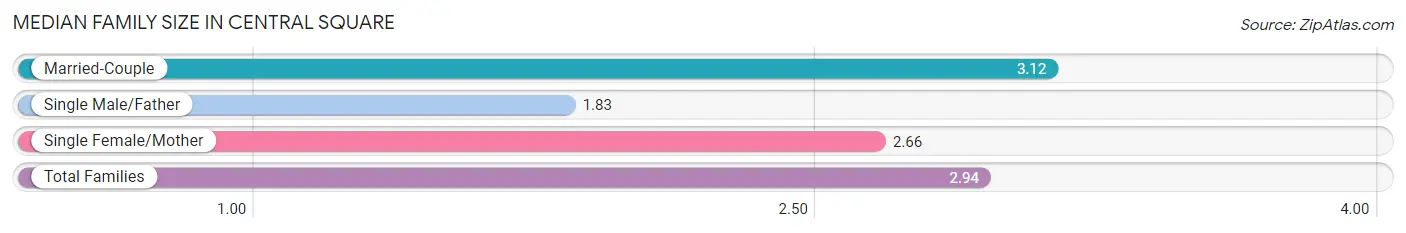
| Family Type | # Families | Family Size |
| Married-Couple | 417 (77.9%) | 3.12 |
| Single Male/Father | 48 (9.0%) | 1.83 |
| Single Female/Mother | 70 (13.1%) | 2.66 |
| Total Families | 535 (100.0%) | 2.94 |
Median Household Size in Central Square
The median household size in Central Square is 2.18 persons per household, with married-couple households (417 | 44.0%) accounting for the largest median household size of 3.12 persons per household. non-family households (413 | 43.6%) represent the smallest median household size with 1.03 persons per household.
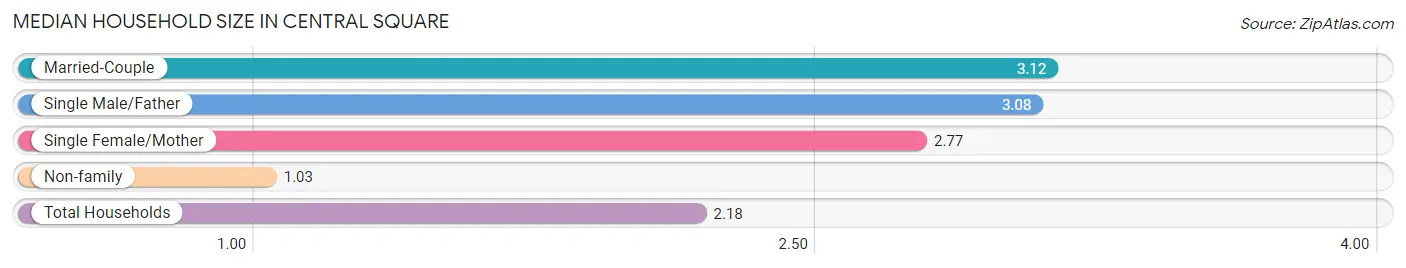
| Household Type | # Households | Household Size |
| Married-Couple | 417 (44.0%) | 3.12 |
| Single Male/Father | 48 (5.1%) | 3.08 |
| Single Female/Mother | 70 (7.4%) | 2.77 |
| Non-family | 413 (43.6%) | 1.03 |
| Total Households | 948 (100.0%) | 2.18 |
Household Size by Marriage Status in Central Square
Out of a total of 948 households in Central Square, 535 (56.4%) are family households, while 413 (43.6%) are nonfamily households. The most numerous type of family households are 2-person households, comprising 209, and the most common type of nonfamily households are 1-person households, comprising 401.
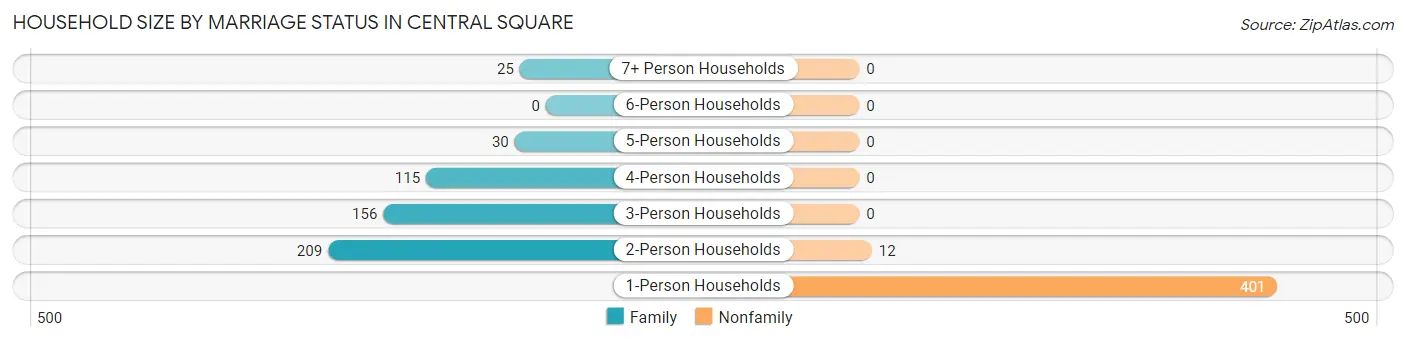
| Household Size | Family Households | Nonfamily Households |
| 1-Person Households | - | 401 (42.3%) |
| 2-Person Households | 209 (22.1%) | 12 (1.3%) |
| 3-Person Households | 156 (16.5%) | 0 (0.0%) |
| 4-Person Households | 115 (12.1%) | 0 (0.0%) |
| 5-Person Households | 30 (3.2%) | 0 (0.0%) |
| 6-Person Households | 0 (0.0%) | 0 (0.0%) |
| 7+ Person Households | 25 (2.6%) | 0 (0.0%) |
| Total | 535 (56.4%) | 413 (43.6%) |
Female Fertility in Central Square
Fertility by Age in Central Square
Average fertility rate in Central Square is 102.0 births per 1,000 women. Women in the age bracket of 35 to 50 years have the highest fertility rate with 168.0 births per 1,000 women. Women in the age bracket of 35 to 50 years acount for 71.4% of all women with births.
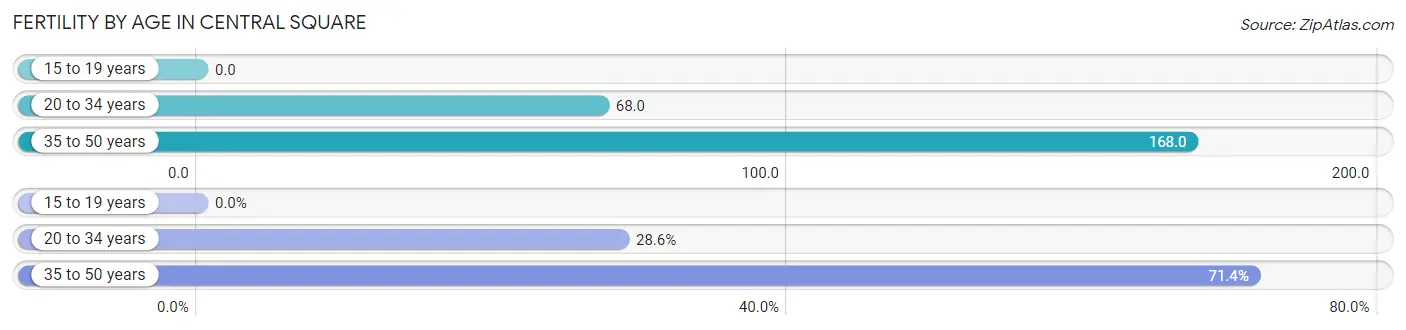
| Age Bracket | Women with Births | Births / 1,000 Women |
| 15 to 19 years | 0 (0.0%) | 0.0 |
| 20 to 34 years | 14 (28.6%) | 68.0 |
| 35 to 50 years | 35 (71.4%) | 168.0 |
| Total | 49 (100.0%) | 102.0 |
Fertility by Age by Marriage Status in Central Square
91.8% of women with births (49) in Central Square are married. The highest percentage of unmarried women with births falls into 20 to 34 years age bracket with 28.6% of them unmarried at the time of birth, while the lowest percentage of unmarried women with births belong to 35 to 50 years age bracket with 0.0% of them unmarried.
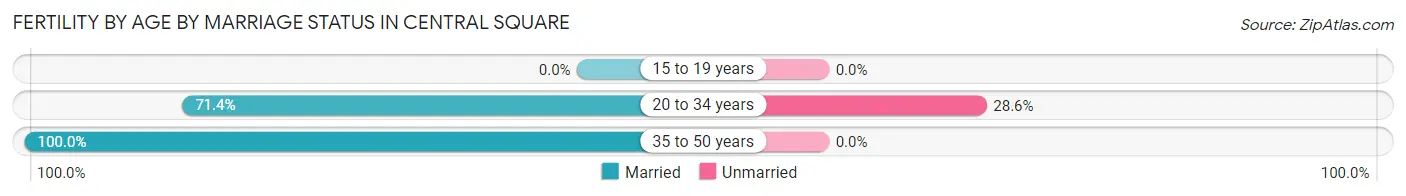
| Age Bracket | Married | Unmarried |
| 15 to 19 years | 0 (0.0%) | 0 (0.0%) |
| 20 to 34 years | 10 (71.4%) | 4 (28.6%) |
| 35 to 50 years | 35 (100.0%) | 0 (0.0%) |
| Total | 45 (91.8%) | 4 (8.2%) |
Fertility by Education in Central Square
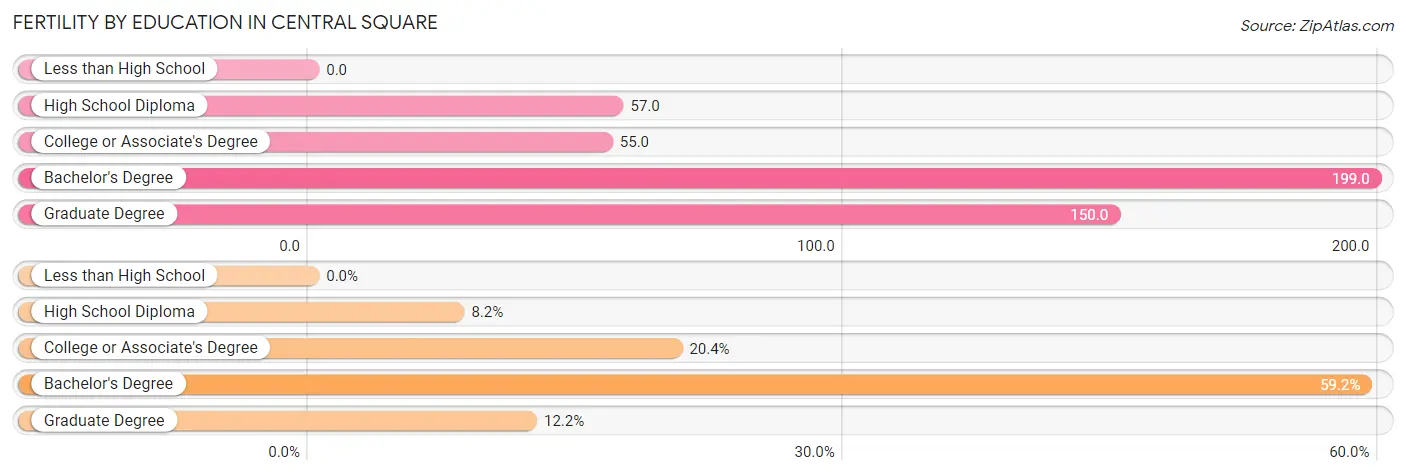
| Educational Attainment | Women with Births | Births / 1,000 Women |
| Less than High School | 0 (0.0%) | 0.0 |
| High School Diploma | 4 (8.2%) | 57.0 |
| College or Associate's Degree | 10 (20.4%) | 55.0 |
| Bachelor's Degree | 29 (59.2%) | 199.0 |
| Graduate Degree | 6 (12.2%) | 150.0 |
| Total | 49 (100.0%) | 102.0 |
Fertility by Education by Marriage Status in Central Square
8.2% of women with births in Central Square are unmarried. Women with the educational attainment of college or associate's degree are most likely to be married with 100.0% of them married at childbirth, while women with the educational attainment of high school diploma are least likely to be married with 100.0% of them unmarried at childbirth.
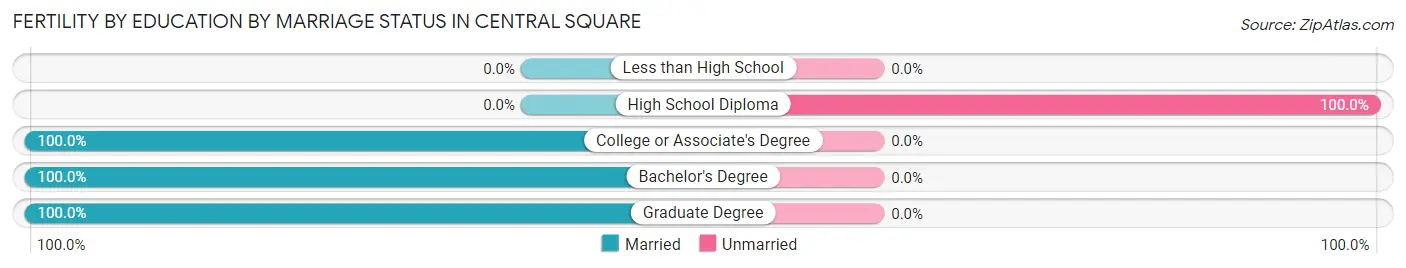
| Educational Attainment | Married | Unmarried |
| Less than High School | 0 (0.0%) | 0 (0.0%) |
| High School Diploma | 0 (0.0%) | 4 (100.0%) |
| College or Associate's Degree | 10 (100.0%) | 0 (0.0%) |
| Bachelor's Degree | 29 (100.0%) | 0 (0.0%) |
| Graduate Degree | 6 (100.0%) | 0 (0.0%) |
| Total | 45 (91.8%) | 4 (8.2%) |
Employment Characteristics in Central Square
Employment by Class of Employer in Central Square
Among the 1,022 employed individuals in Central Square, private company employees (742 | 72.6%), local government employees (120 | 11.7%), and not-for-profit organizations (79 | 7.7%) make up the most common classes of employment.
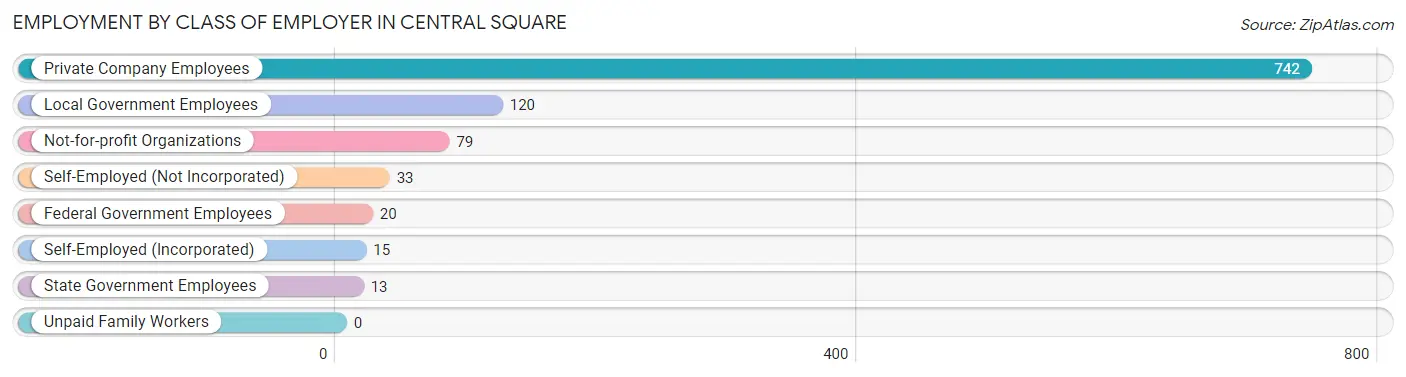
| Employer Class | # Employees | % Employees |
| Private Company Employees | 742 | 72.6% |
| Self-Employed (Incorporated) | 15 | 1.5% |
| Self-Employed (Not Incorporated) | 33 | 3.2% |
| Not-for-profit Organizations | 79 | 7.7% |
| Local Government Employees | 120 | 11.7% |
| State Government Employees | 13 | 1.3% |
| Federal Government Employees | 20 | 2.0% |
| Unpaid Family Workers | 0 | 0.0% |
| Total | 1,022 | 100.0% |
Employment Status by Age in Central Square
According to the labor force statistics for Central Square, out of the total population over 16 years of age (1,648), 64.9% or 1,070 individuals are in the labor force, with 3.6% or 39 of them unemployed. The age group with the highest labor force participation rate is 20 to 24 years, with 100.0% or 122 individuals in the labor force. Within the labor force, the 16 to 19 years age range has the highest percentage of unemployed individuals, with 11.3% or 6 of them being unemployed.
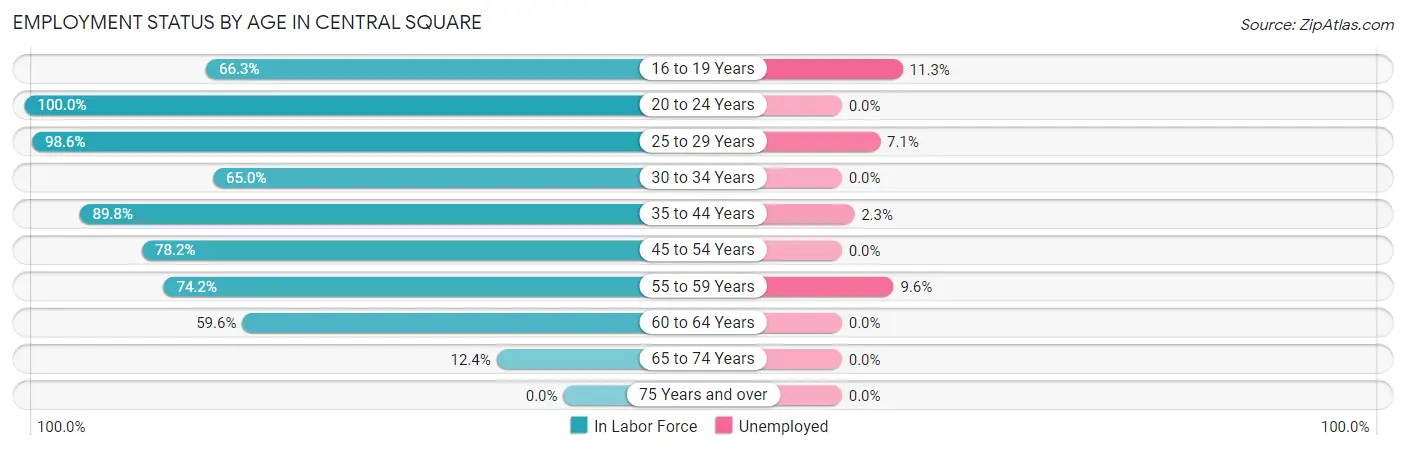
| Age Bracket | In Labor Force | Unemployed |
| 16 to 19 Years | 53 (66.3%) | 6 (11.3%) |
| 20 to 24 Years | 122 (100.0%) | 0 (0.0%) |
| 25 to 29 Years | 141 (98.6%) | 10 (7.1%) |
| 30 to 34 Years | 26 (65.0%) | 0 (0.0%) |
| 35 to 44 Years | 263 (89.8%) | 6 (2.3%) |
| 45 to 54 Years | 194 (78.2%) | 0 (0.0%) |
| 55 to 59 Years | 178 (74.2%) | 17 (9.6%) |
| 60 to 64 Years | 65 (59.6%) | 0 (0.0%) |
| 65 to 74 Years | 27 (12.4%) | 0 (0.0%) |
| 75 Years and over | 0 (0.0%) | 0 (0.0%) |
| Total | 1,070 (64.9%) | 39 (3.6%) |
Employment Status by Educational Attainment in Central Square
According to labor force statistics for Central Square, 80.8% of individuals (867) out of the total population between 25 and 64 years of age (1,073) are in the labor force, with 3.8% or 33 of them being unemployed. The group with the highest labor force participation rate are those with the educational attainment of bachelor's degree or higher, with 87.3% or 288 individuals in the labor force. Within the labor force, individuals with college / associate degree education have the highest percentage of unemployment, with 8.5% or 33 of them being unemployed.
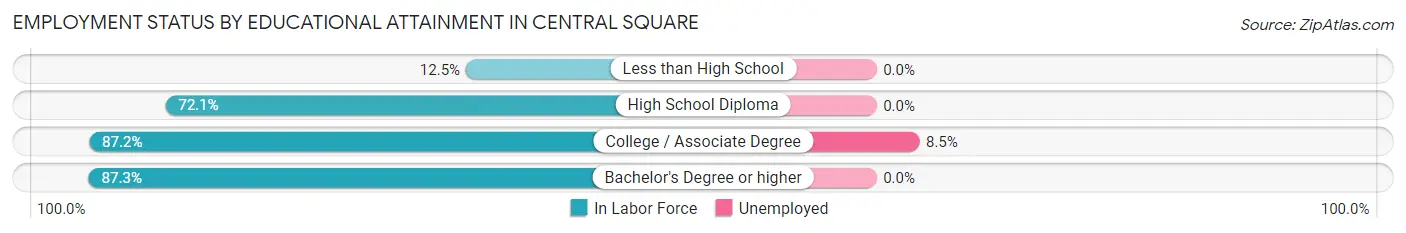
| Educational Attainment | In Labor Force | Unemployed |
| Less than High School | 5 (12.5%) | 0 (0.0%) |
| High School Diploma | 186 (72.1%) | 0 (0.0%) |
| College / Associate Degree | 388 (87.2%) | 38 (8.5%) |
| Bachelor's Degree or higher | 288 (87.3%) | 0 (0.0%) |
| Total | 867 (80.8%) | 41 (3.8%) |
Employment Occupations by Sex in Central Square
Management, Business, Science and Arts Occupations
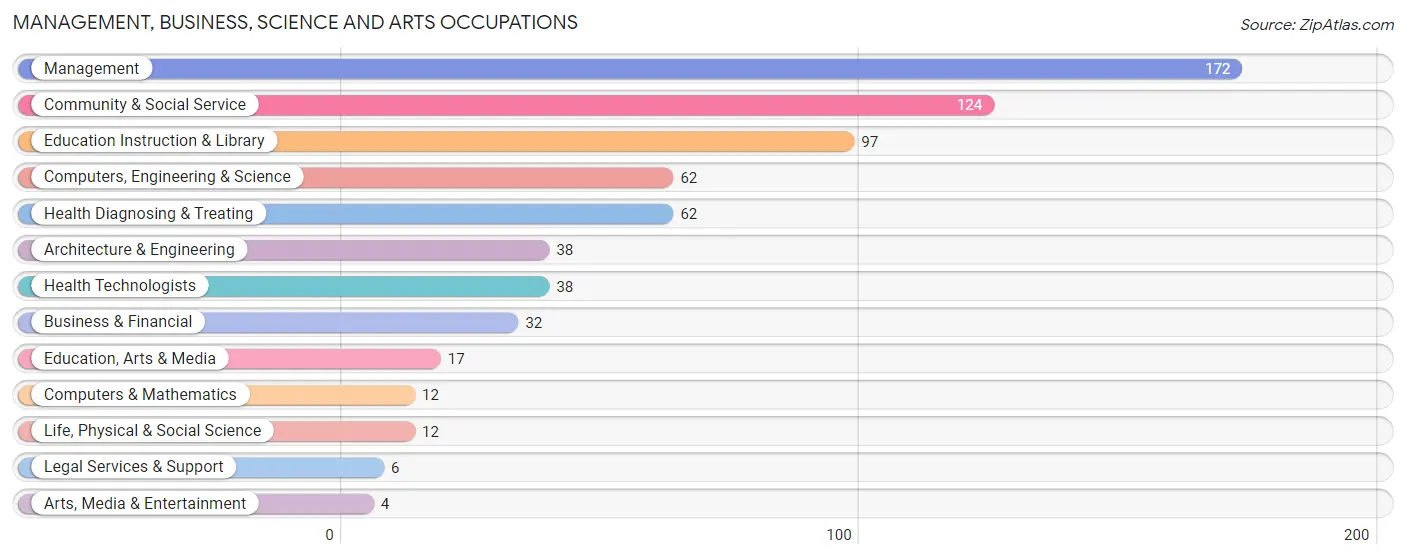
The most common Management, Business, Science and Arts occupations in Central Square are Management (172 | 16.7%), Community & Social Service (124 | 12.0%), Education Instruction & Library (97 | 9.4%), Computers, Engineering & Science (62 | 6.0%), and Health Diagnosing & Treating (62 | 6.0%).
Management, Business, Science and Arts Occupations by Sex
Within the Management, Business, Science and Arts occupations in Central Square, the most male-oriented occupations are Legal Services & Support (100.0%), Education, Arts & Media (76.5%), and Architecture & Engineering (76.3%), while the most female-oriented occupations are Education Instruction & Library (100.0%), Arts, Media & Entertainment (100.0%), and Community & Social Service (84.7%).
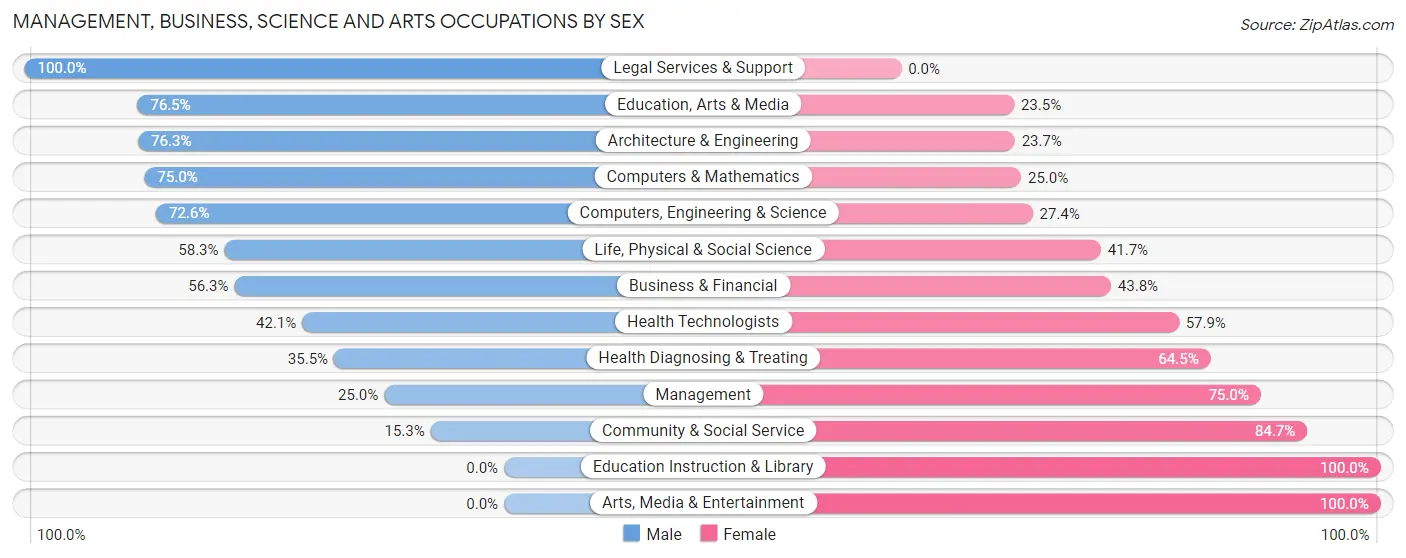
| Occupation | Male | Female |
| Management | 43 (25.0%) | 129 (75.0%) |
| Business & Financial | 18 (56.2%) | 14 (43.8%) |
| Computers, Engineering & Science | 45 (72.6%) | 17 (27.4%) |
| Computers & Mathematics | 9 (75.0%) | 3 (25.0%) |
| Architecture & Engineering | 29 (76.3%) | 9 (23.7%) |
| Life, Physical & Social Science | 7 (58.3%) | 5 (41.7%) |
| Community & Social Service | 19 (15.3%) | 105 (84.7%) |
| Education, Arts & Media | 13 (76.5%) | 4 (23.5%) |
| Legal Services & Support | 6 (100.0%) | 0 (0.0%) |
| Education Instruction & Library | 0 (0.0%) | 97 (100.0%) |
| Arts, Media & Entertainment | 0 (0.0%) | 4 (100.0%) |
| Health Diagnosing & Treating | 22 (35.5%) | 40 (64.5%) |
| Health Technologists | 16 (42.1%) | 22 (57.9%) |
| Total (Category) | 147 (32.5%) | 305 (67.5%) |
| Total (Overall) | 473 (45.9%) | 557 (54.1%) |
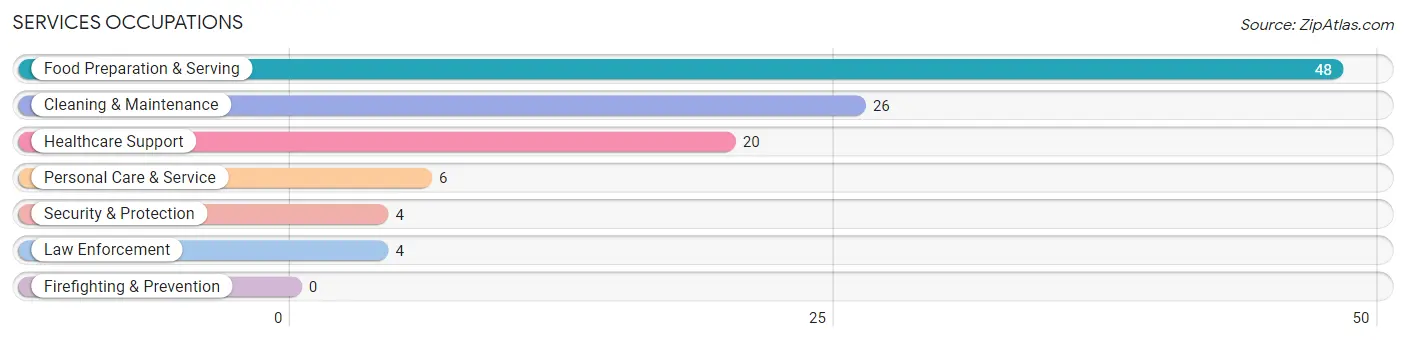
Services Occupations
The most common Services occupations in Central Square are Food Preparation & Serving (48 | 4.7%), Cleaning & Maintenance (26 | 2.5%), Healthcare Support (20 | 1.9%), Personal Care & Service (6 | 0.6%), and Security & Protection (4 | 0.4%).
Services Occupations by Sex
Within the Services occupations in Central Square, the most male-oriented occupations are Security & Protection (100.0%), Law Enforcement (100.0%), and Cleaning & Maintenance (57.7%), while the most female-oriented occupations are Healthcare Support (100.0%), Personal Care & Service (100.0%), and Food Preparation & Serving (79.2%).
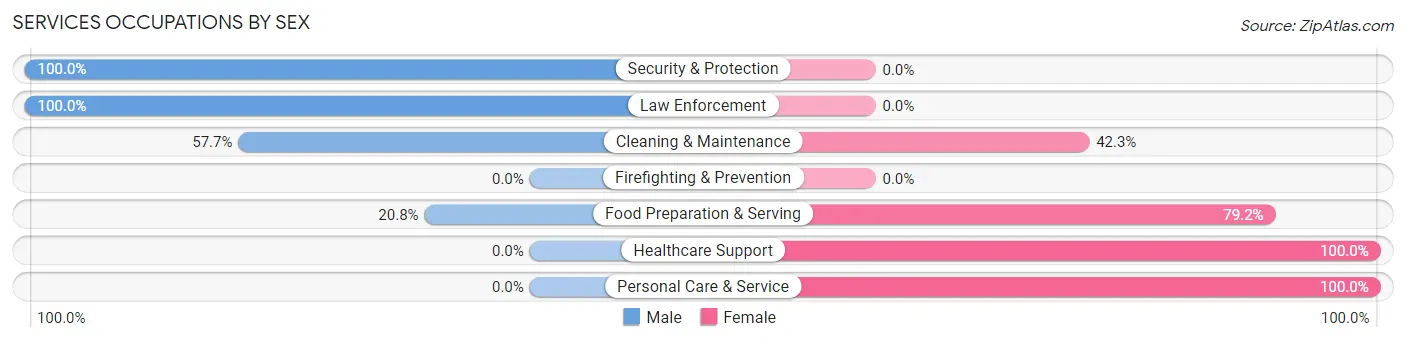
| Occupation | Male | Female |
| Healthcare Support | 0 (0.0%) | 20 (100.0%) |
| Security & Protection | 4 (100.0%) | 0 (0.0%) |
| Firefighting & Prevention | 0 (0.0%) | 0 (0.0%) |
| Law Enforcement | 4 (100.0%) | 0 (0.0%) |
| Food Preparation & Serving | 10 (20.8%) | 38 (79.2%) |
| Cleaning & Maintenance | 15 (57.7%) | 11 (42.3%) |
| Personal Care & Service | 0 (0.0%) | 6 (100.0%) |
| Total (Category) | 29 (27.9%) | 75 (72.1%) |
| Total (Overall) | 473 (45.9%) | 557 (54.1%) |
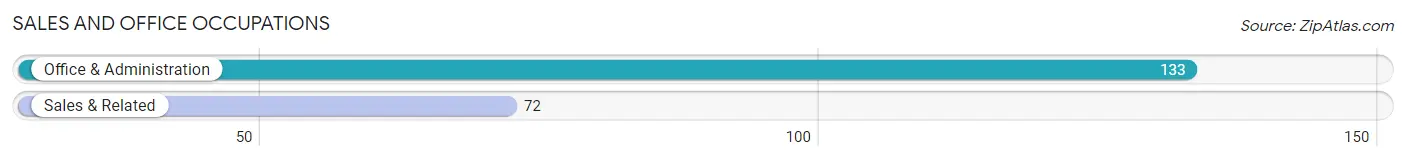
Sales and Office Occupations
The most common Sales and Office occupations in Central Square are Office & Administration (133 | 12.9%), and Sales & Related (72 | 7.0%).
Sales and Office Occupations by Sex

| Occupation | Male | Female |
| Sales & Related | 25 (34.7%) | 47 (65.3%) |
| Office & Administration | 25 (18.8%) | 108 (81.2%) |
| Total (Category) | 50 (24.4%) | 155 (75.6%) |
| Total (Overall) | 473 (45.9%) | 557 (54.1%) |
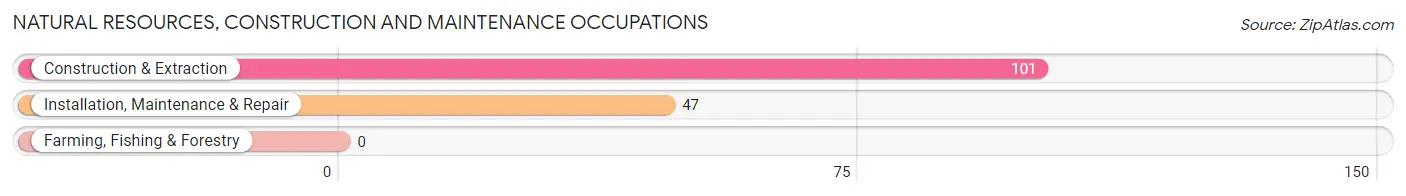
Natural Resources, Construction and Maintenance Occupations
The most common Natural Resources, Construction and Maintenance occupations in Central Square are Construction & Extraction (101 | 9.8%), and Installation, Maintenance & Repair (47 | 4.6%).
Natural Resources, Construction and Maintenance Occupations by Sex
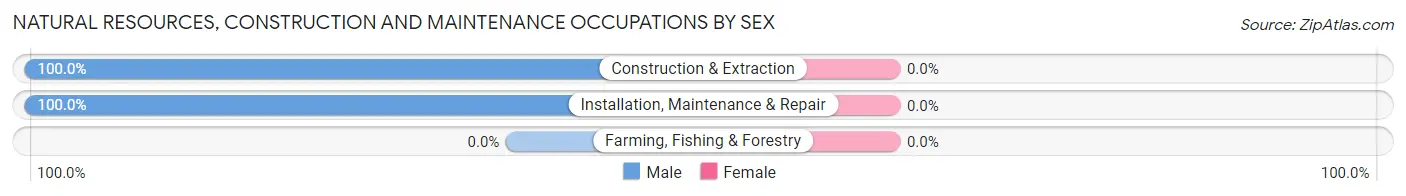
| Occupation | Male | Female |
| Farming, Fishing & Forestry | 0 (0.0%) | 0 (0.0%) |
| Construction & Extraction | 101 (100.0%) | 0 (0.0%) |
| Installation, Maintenance & Repair | 47 (100.0%) | 0 (0.0%) |
| Total (Category) | 148 (100.0%) | 0 (0.0%) |
| Total (Overall) | 473 (45.9%) | 557 (54.1%) |
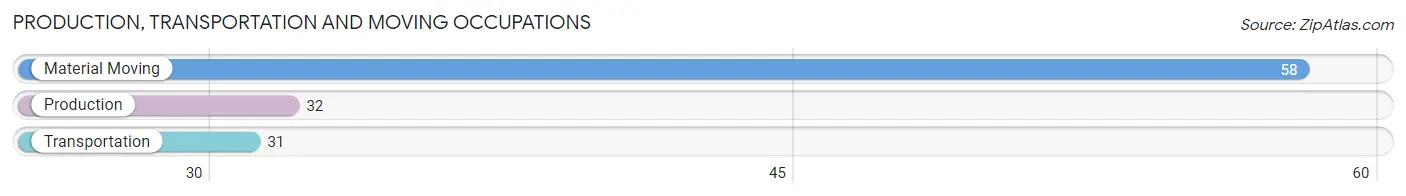
Production, Transportation and Moving Occupations
The most common Production, Transportation and Moving occupations in Central Square are Material Moving (58 | 5.6%), Production (32 | 3.1%), and Transportation (31 | 3.0%).
Production, Transportation and Moving Occupations by Sex
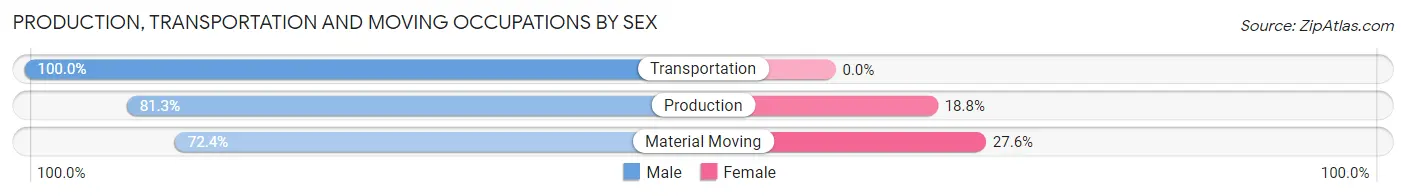
| Occupation | Male | Female |
| Production | 26 (81.2%) | 6 (18.8%) |
| Transportation | 31 (100.0%) | 0 (0.0%) |
| Material Moving | 42 (72.4%) | 16 (27.6%) |
| Total (Category) | 99 (81.8%) | 22 (18.2%) |
| Total (Overall) | 473 (45.9%) | 557 (54.1%) |
Employment Industries by Sex in Central Square
Employment Industries in Central Square
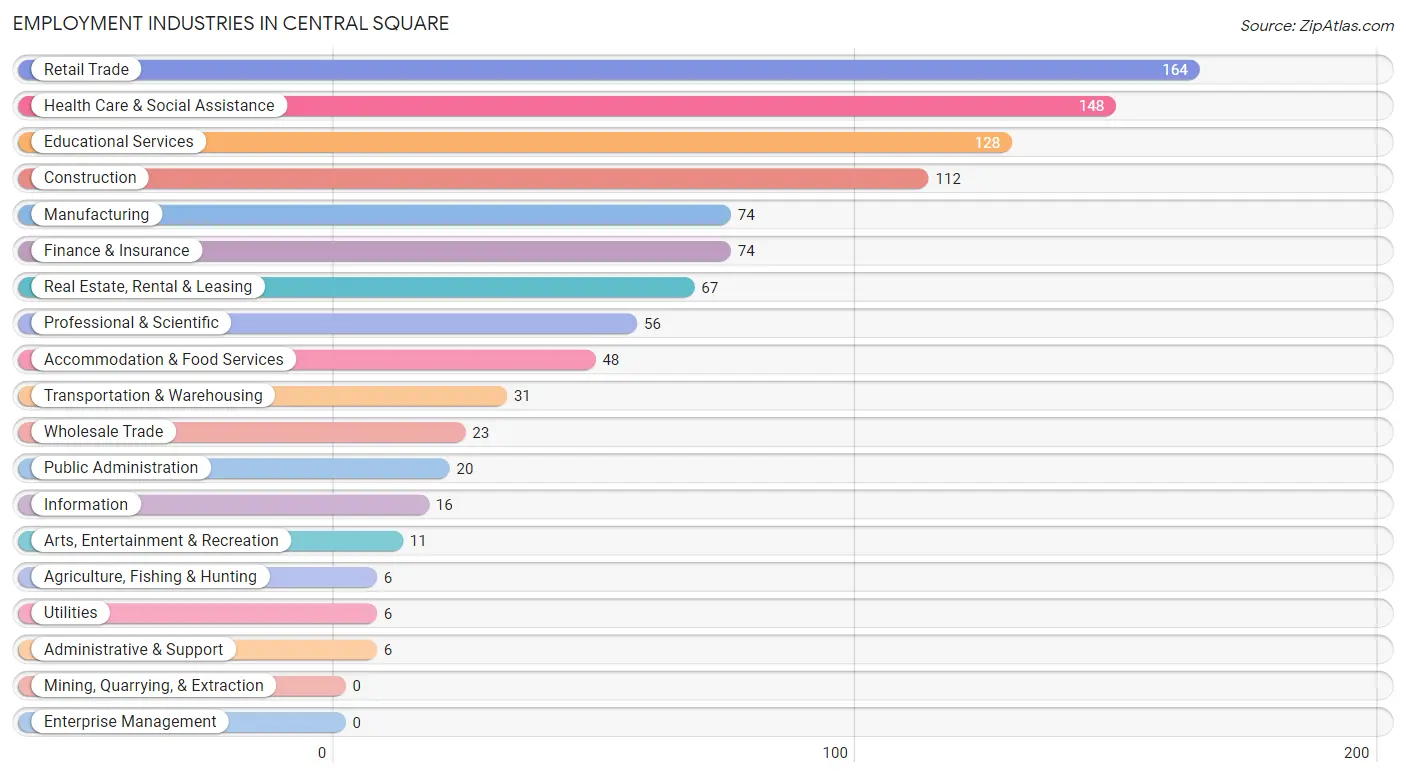
The major employment industries in Central Square include Retail Trade (164 | 15.9%), Health Care & Social Assistance (148 | 14.4%), Educational Services (128 | 12.4%), Construction (112 | 10.9%), and Manufacturing (74 | 7.2%).
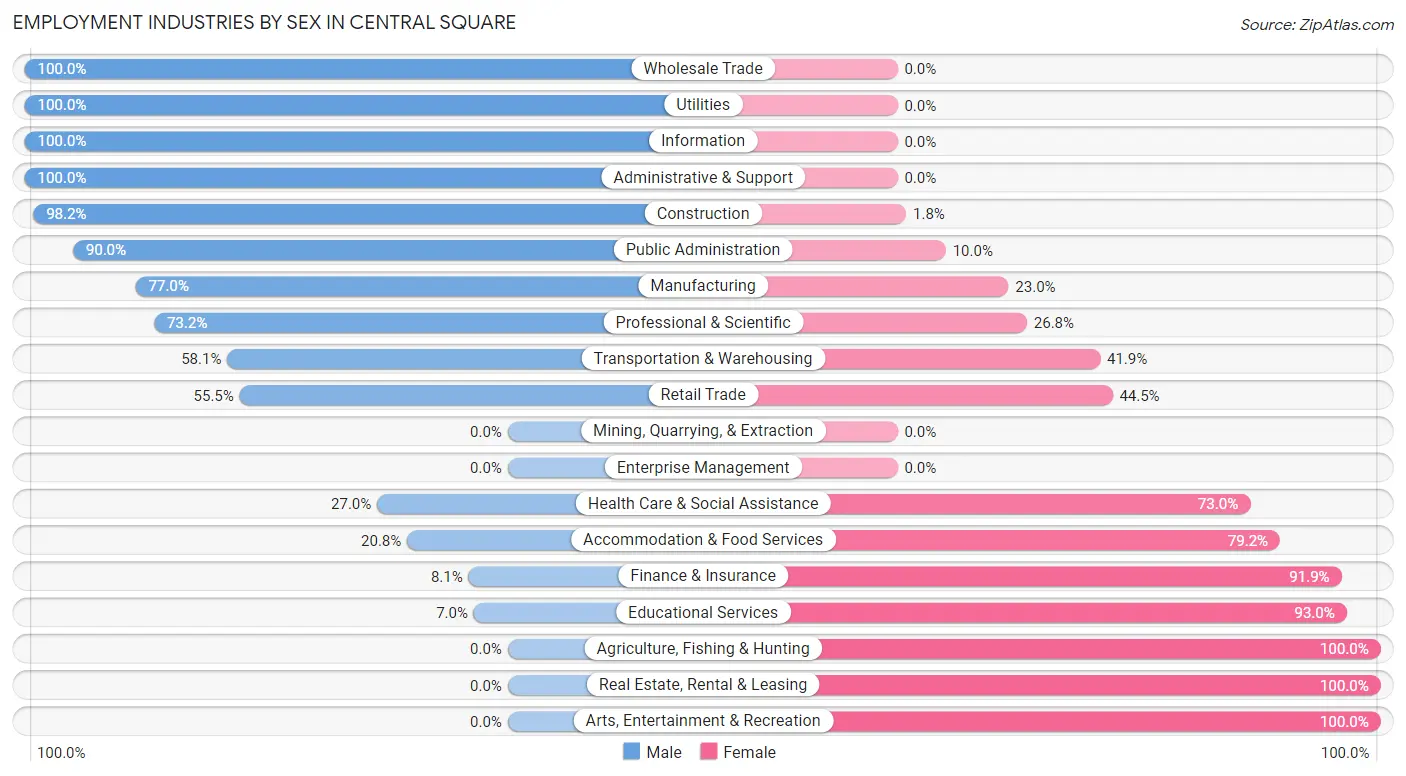
Employment Industries by Sex in Central Square
The Central Square industries that see more men than women are Wholesale Trade (100.0%), Utilities (100.0%), and Information (100.0%), whereas the industries that tend to have a higher number of women are Agriculture, Fishing & Hunting (100.0%), Real Estate, Rental & Leasing (100.0%), and Arts, Entertainment & Recreation (100.0%).
| Industry | Male | Female |
| Agriculture, Fishing & Hunting | 0 (0.0%) | 6 (100.0%) |
| Mining, Quarrying, & Extraction | 0 (0.0%) | 0 (0.0%) |
| Construction | 110 (98.2%) | 2 (1.8%) |
| Manufacturing | 57 (77.0%) | 17 (23.0%) |
| Wholesale Trade | 23 (100.0%) | 0 (0.0%) |
| Retail Trade | 91 (55.5%) | 73 (44.5%) |
| Transportation & Warehousing | 18 (58.1%) | 13 (41.9%) |
| Utilities | 6 (100.0%) | 0 (0.0%) |
| Information | 16 (100.0%) | 0 (0.0%) |
| Finance & Insurance | 6 (8.1%) | 68 (91.9%) |
| Real Estate, Rental & Leasing | 0 (0.0%) | 67 (100.0%) |
| Professional & Scientific | 41 (73.2%) | 15 (26.8%) |
| Enterprise Management | 0 (0.0%) | 0 (0.0%) |
| Administrative & Support | 6 (100.0%) | 0 (0.0%) |
| Educational Services | 9 (7.0%) | 119 (93.0%) |
| Health Care & Social Assistance | 40 (27.0%) | 108 (73.0%) |
| Arts, Entertainment & Recreation | 0 (0.0%) | 11 (100.0%) |
| Accommodation & Food Services | 10 (20.8%) | 38 (79.2%) |
| Public Administration | 18 (90.0%) | 2 (10.0%) |
| Total | 473 (45.9%) | 557 (54.1%) |
Education in Central Square
School Enrollment in Central Square
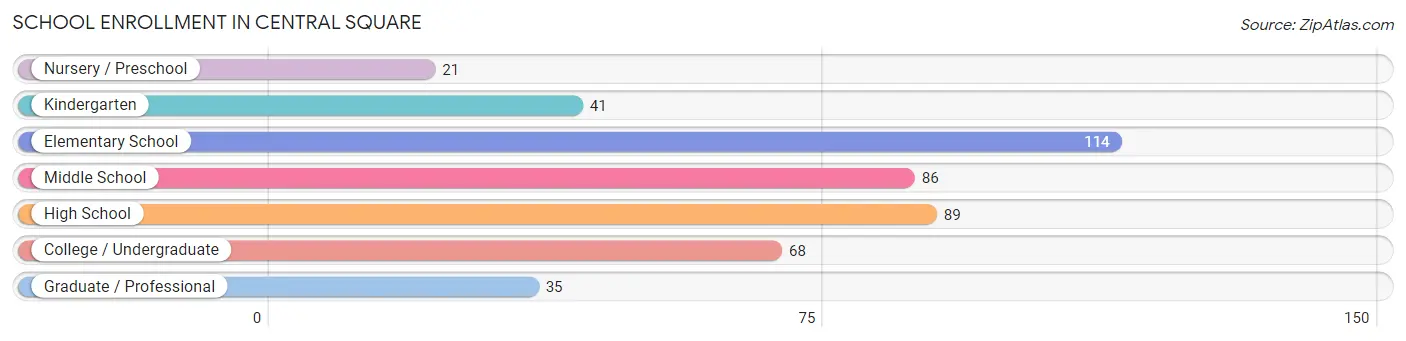
The most common levels of schooling among the 454 students in Central Square are elementary school (114 | 25.1%), high school (89 | 19.6%), and middle school (86 | 18.9%).
| School Level | # Students | % Students |
| Nursery / Preschool | 21 | 4.6% |
| Kindergarten | 41 | 9.0% |
| Elementary School | 114 | 25.1% |
| Middle School | 86 | 18.9% |
| High School | 89 | 19.6% |
| College / Undergraduate | 68 | 15.0% |
| Graduate / Professional | 35 | 7.7% |
| Total | 454 | 100.0% |
School Enrollment by Age by Funding Source in Central Square
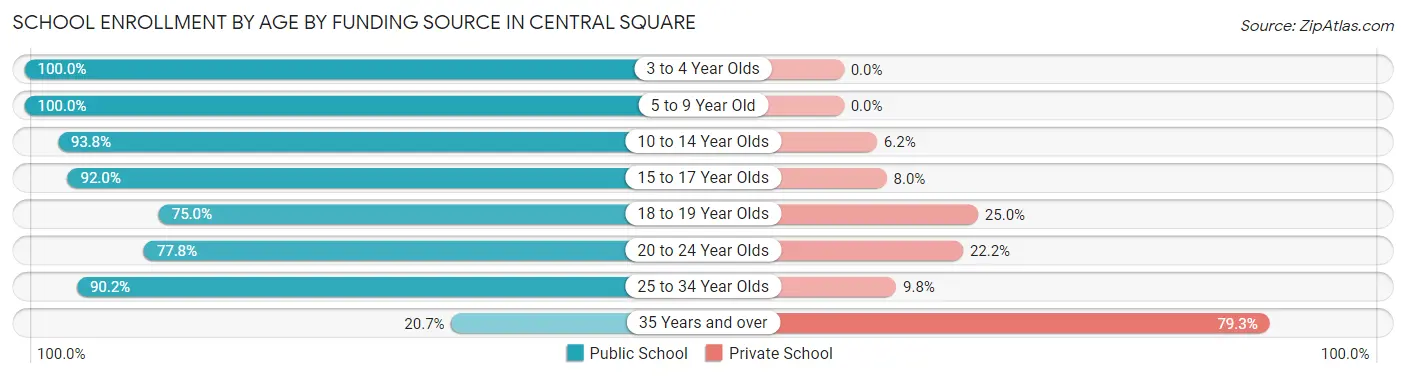
Out of a total of 454 students who are enrolled in schools in Central Square, 48 (10.6%) attend a private institution, while the remaining 406 (89.4%) are enrolled in public schools. The age group of 35 years and over has the highest likelihood of being enrolled in private schools, with 23 (79.3% in the age bracket) enrolled. Conversely, the age group of 3 to 4 year olds has the lowest likelihood of being enrolled in a private school, with 32 (100.0% in the age bracket) attending a public institution.
| Age Bracket | Public School | Private School |
| 3 to 4 Year Olds | 32 (100.0%) | 0 (0.0%) |
| 5 to 9 Year Old | 141 (100.0%) | 0 (0.0%) |
| 10 to 14 Year Olds | 91 (93.8%) | 6 (6.2%) |
| 15 to 17 Year Olds | 69 (92.0%) | 6 (8.0%) |
| 18 to 19 Year Olds | 9 (75.0%) | 3 (25.0%) |
| 20 to 24 Year Olds | 21 (77.8%) | 6 (22.2%) |
| 25 to 34 Year Olds | 37 (90.2%) | 4 (9.8%) |
| 35 Years and over | 6 (20.7%) | 23 (79.3%) |
| Total | 406 (89.4%) | 48 (10.6%) |
Educational Attainment by Field of Study in Central Square
Psychology (68 | 18.1%), education (60 | 16.0%), science & technology (58 | 15.4%), bio, nature & agricultural (33 | 8.8%), and business (33 | 8.8%) are the most common fields of study among 376 individuals in Central Square who have obtained a bachelor's degree or higher.
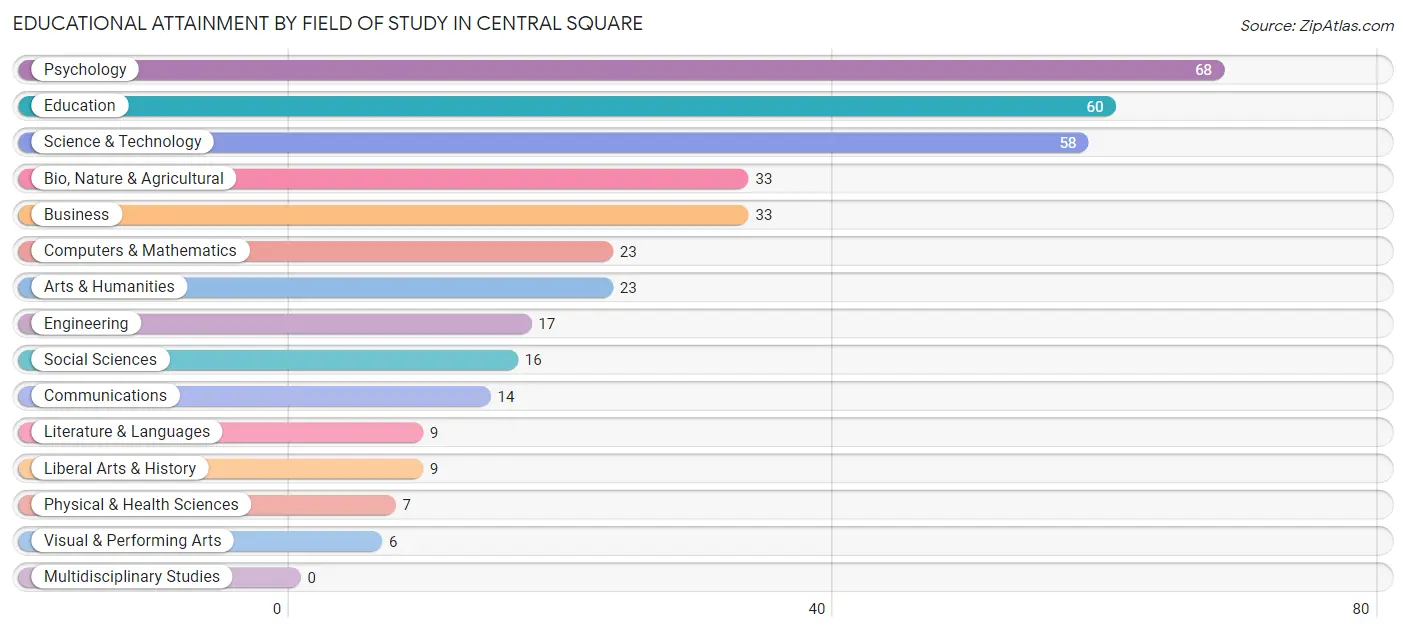
| Field of Study | # Graduates | % Graduates |
| Computers & Mathematics | 23 | 6.1% |
| Bio, Nature & Agricultural | 33 | 8.8% |
| Physical & Health Sciences | 7 | 1.9% |
| Psychology | 68 | 18.1% |
| Social Sciences | 16 | 4.3% |
| Engineering | 17 | 4.5% |
| Multidisciplinary Studies | 0 | 0.0% |
| Science & Technology | 58 | 15.4% |
| Business | 33 | 8.8% |
| Education | 60 | 16.0% |
| Literature & Languages | 9 | 2.4% |
| Liberal Arts & History | 9 | 2.4% |
| Visual & Performing Arts | 6 | 1.6% |
| Communications | 14 | 3.7% |
| Arts & Humanities | 23 | 6.1% |
| Total | 376 | 100.0% |
Transportation & Commute in Central Square
Vehicle Availability by Sex in Central Square
The most prevalent vehicle ownership categories in Central Square are males with 2 vehicles (206, accounting for 43.8%) and females with 2 vehicles (248, making up 37.3%).
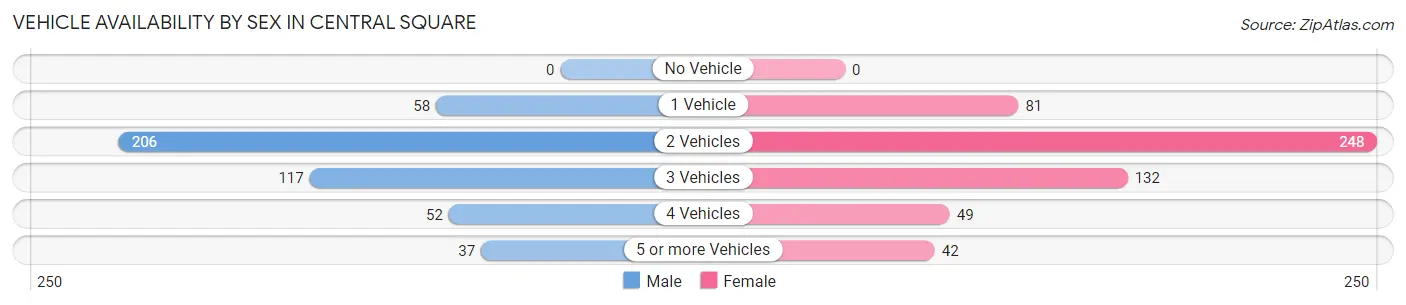
| Vehicles Available | Male | Female |
| No Vehicle | 0 (0.0%) | 0 (0.0%) |
| 1 Vehicle | 58 (12.3%) | 81 (14.7%) |
| 2 Vehicles | 206 (43.8%) | 248 (44.9%) |
| 3 Vehicles | 117 (24.9%) | 132 (23.9%) |
| 4 Vehicles | 52 (11.1%) | 49 (8.9%) |
| 5 or more Vehicles | 37 (7.9%) | 42 (7.6%) |
| Total | 470 (100.0%) | 552 (100.0%) |
Commute Time in Central Square
The most frequently occuring commute durations in Central Square are 20 to 24 minutes (183 commuters, 19.6%), 30 to 34 minutes (183 commuters, 19.6%), and 25 to 29 minutes (138 commuters, 14.8%).
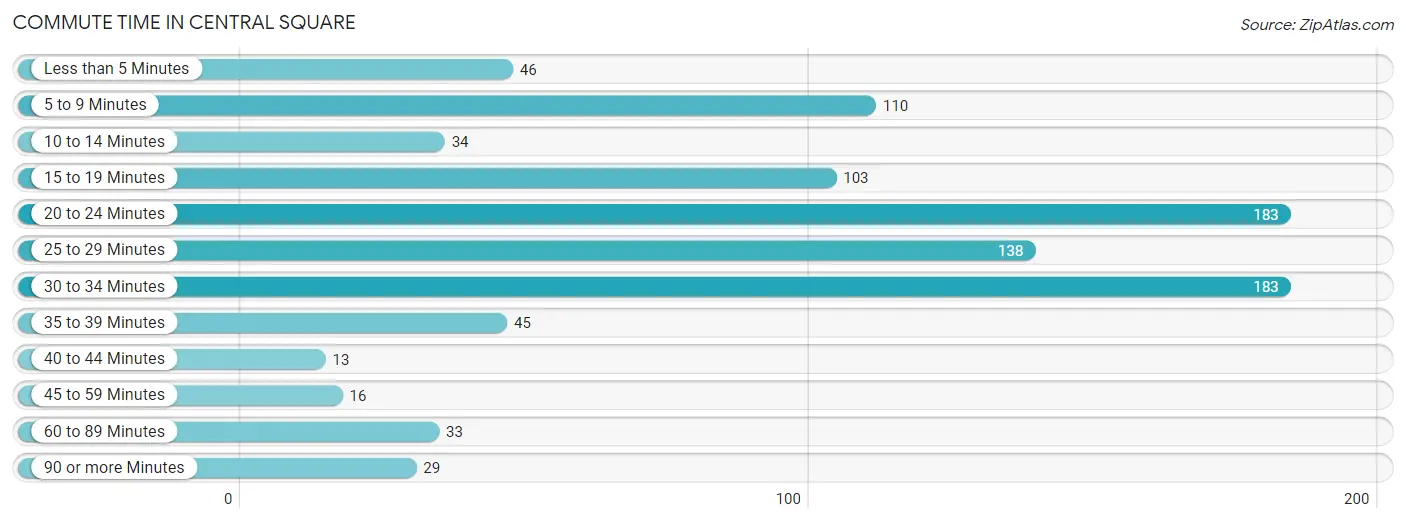
| Commute Time | # Commuters | % Commuters |
| Less than 5 Minutes | 46 | 4.9% |
| 5 to 9 Minutes | 110 | 11.8% |
| 10 to 14 Minutes | 34 | 3.6% |
| 15 to 19 Minutes | 103 | 11.0% |
| 20 to 24 Minutes | 183 | 19.6% |
| 25 to 29 Minutes | 138 | 14.8% |
| 30 to 34 Minutes | 183 | 19.6% |
| 35 to 39 Minutes | 45 | 4.8% |
| 40 to 44 Minutes | 13 | 1.4% |
| 45 to 59 Minutes | 16 | 1.7% |
| 60 to 89 Minutes | 33 | 3.5% |
| 90 or more Minutes | 29 | 3.1% |
Commute Time by Sex in Central Square
The most common commute times in Central Square are 30 to 34 minutes (100 commuters, 21.7%) for males and 20 to 24 minutes (125 commuters, 26.5%) for females.
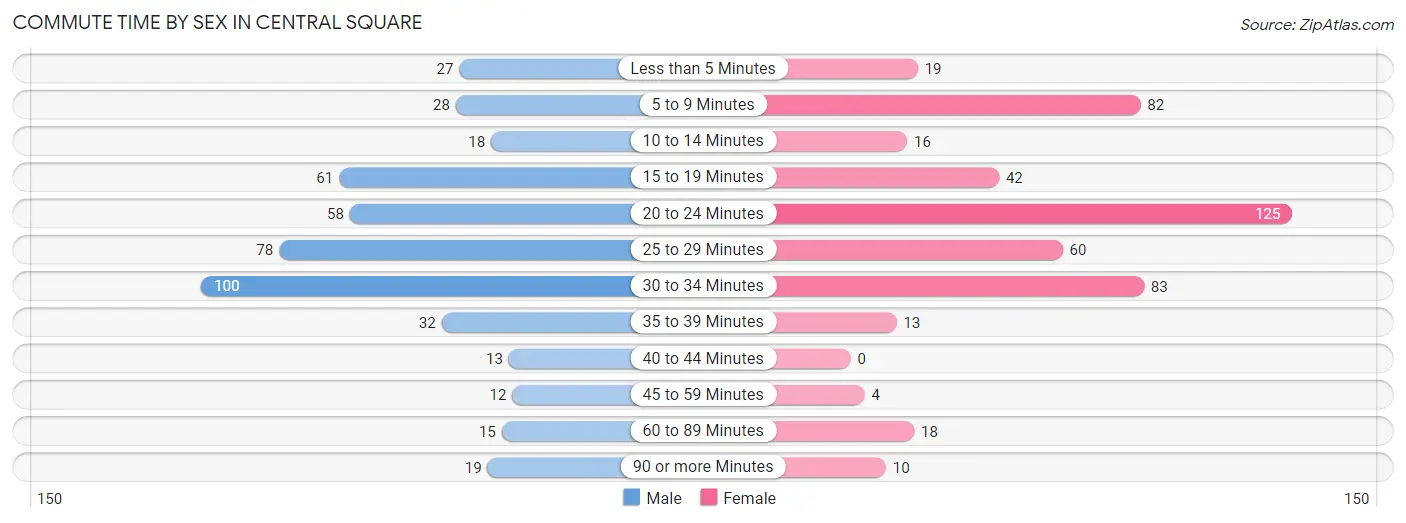
| Commute Time | Male | Female |
| Less than 5 Minutes | 27 (5.9%) | 19 (4.0%) |
| 5 to 9 Minutes | 28 (6.1%) | 82 (17.4%) |
| 10 to 14 Minutes | 18 (3.9%) | 16 (3.4%) |
| 15 to 19 Minutes | 61 (13.2%) | 42 (8.9%) |
| 20 to 24 Minutes | 58 (12.6%) | 125 (26.5%) |
| 25 to 29 Minutes | 78 (16.9%) | 60 (12.7%) |
| 30 to 34 Minutes | 100 (21.7%) | 83 (17.6%) |
| 35 to 39 Minutes | 32 (6.9%) | 13 (2.8%) |
| 40 to 44 Minutes | 13 (2.8%) | 0 (0.0%) |
| 45 to 59 Minutes | 12 (2.6%) | 4 (0.9%) |
| 60 to 89 Minutes | 15 (3.3%) | 18 (3.8%) |
| 90 or more Minutes | 19 (4.1%) | 10 (2.1%) |
Time of Departure to Work by Sex in Central Square
The most frequent times of departure to work in Central Square are 6:00 AM to 6:29 AM (81, 17.6%) for males and 7:00 AM to 7:29 AM (103, 21.8%) for females.
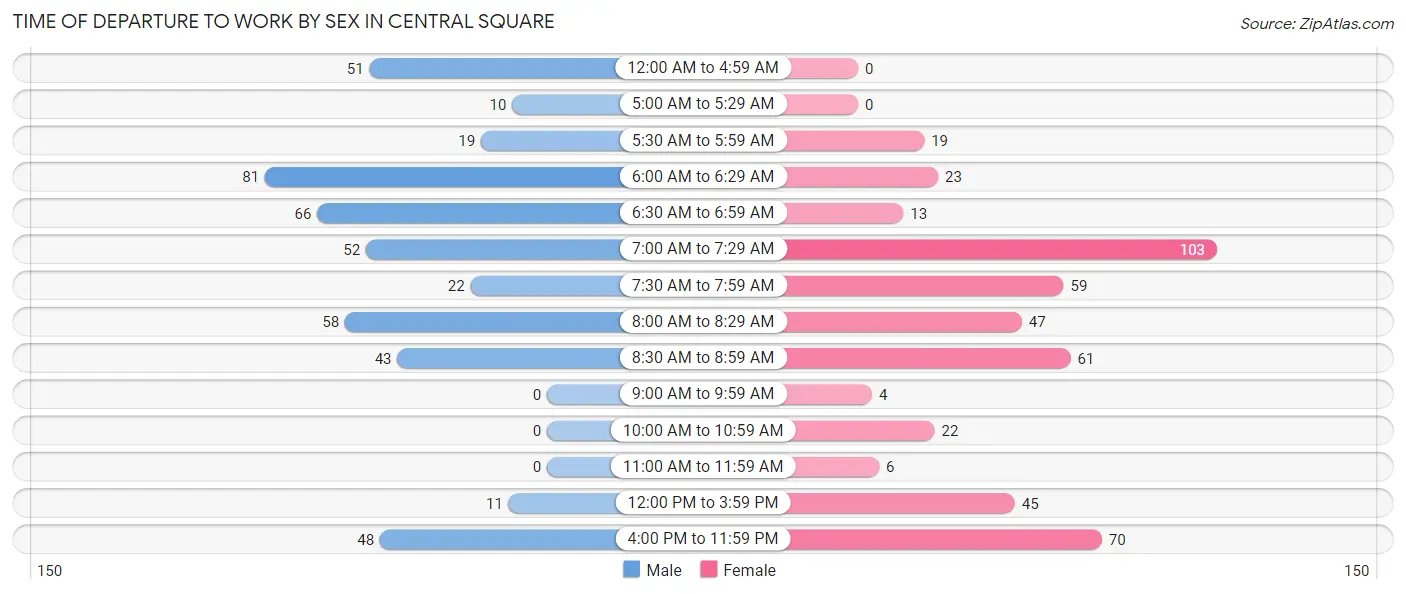
| Time of Departure | Male | Female |
| 12:00 AM to 4:59 AM | 51 (11.1%) | 0 (0.0%) |
| 5:00 AM to 5:29 AM | 10 (2.2%) | 0 (0.0%) |
| 5:30 AM to 5:59 AM | 19 (4.1%) | 19 (4.0%) |
| 6:00 AM to 6:29 AM | 81 (17.6%) | 23 (4.9%) |
| 6:30 AM to 6:59 AM | 66 (14.3%) | 13 (2.8%) |
| 7:00 AM to 7:29 AM | 52 (11.3%) | 103 (21.8%) |
| 7:30 AM to 7:59 AM | 22 (4.8%) | 59 (12.5%) |
| 8:00 AM to 8:29 AM | 58 (12.6%) | 47 (10.0%) |
| 8:30 AM to 8:59 AM | 43 (9.3%) | 61 (12.9%) |
| 9:00 AM to 9:59 AM | 0 (0.0%) | 4 (0.9%) |
| 10:00 AM to 10:59 AM | 0 (0.0%) | 22 (4.7%) |
| 11:00 AM to 11:59 AM | 0 (0.0%) | 6 (1.3%) |
| 12:00 PM to 3:59 PM | 11 (2.4%) | 45 (9.5%) |
| 4:00 PM to 11:59 PM | 48 (10.4%) | 70 (14.8%) |
| Total | 461 (100.0%) | 472 (100.0%) |
Housing Occupancy in Central Square
Occupancy by Ownership in Central Square
Of the total 948 dwellings in Central Square, owner-occupied units account for 493 (52.0%), while renter-occupied units make up 455 (48.0%).
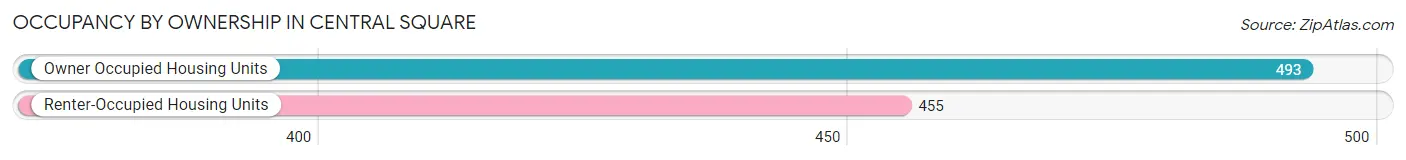
| Occupancy | # Housing Units | % Housing Units |
| Owner Occupied Housing Units | 493 | 52.0% |
| Renter-Occupied Housing Units | 455 | 48.0% |
| Total Occupied Housing Units | 948 | 100.0% |
Occupancy by Household Size in Central Square
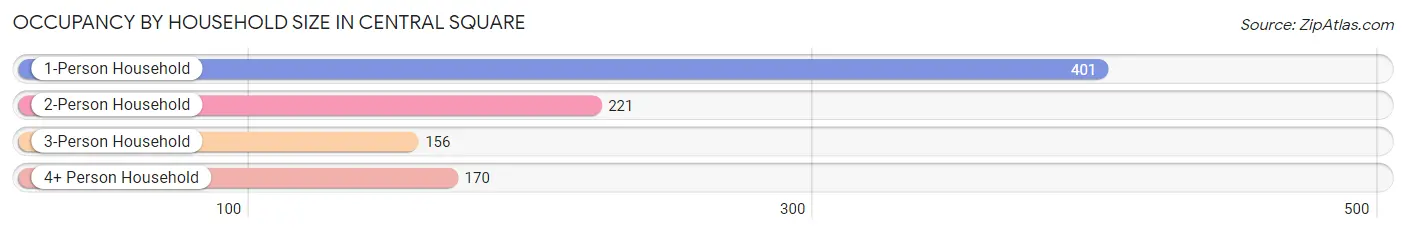
| Household Size | # Housing Units | % Housing Units |
| 1-Person Household | 401 | 42.3% |
| 2-Person Household | 221 | 23.3% |
| 3-Person Household | 156 | 16.5% |
| 4+ Person Household | 170 | 17.9% |
| Total Housing Units | 948 | 100.0% |
Occupancy by Ownership by Household Size in Central Square
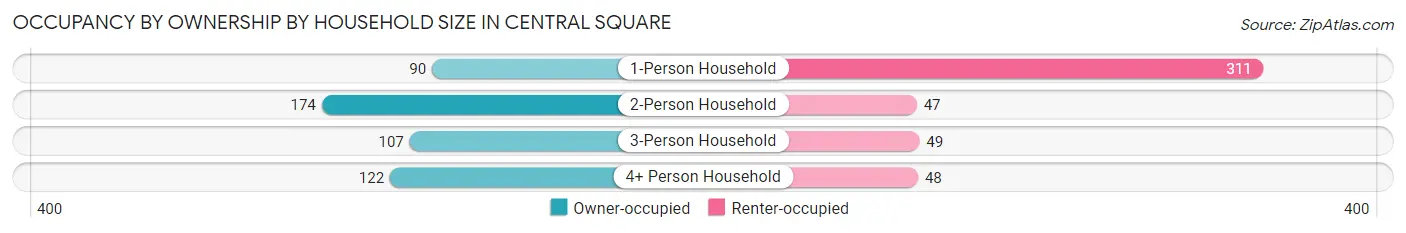
| Household Size | Owner-occupied | Renter-occupied |
| 1-Person Household | 90 (22.4%) | 311 (77.6%) |
| 2-Person Household | 174 (78.7%) | 47 (21.3%) |
| 3-Person Household | 107 (68.6%) | 49 (31.4%) |
| 4+ Person Household | 122 (71.8%) | 48 (28.2%) |
| Total Housing Units | 493 (52.0%) | 455 (48.0%) |
Occupancy by Educational Attainment in Central Square
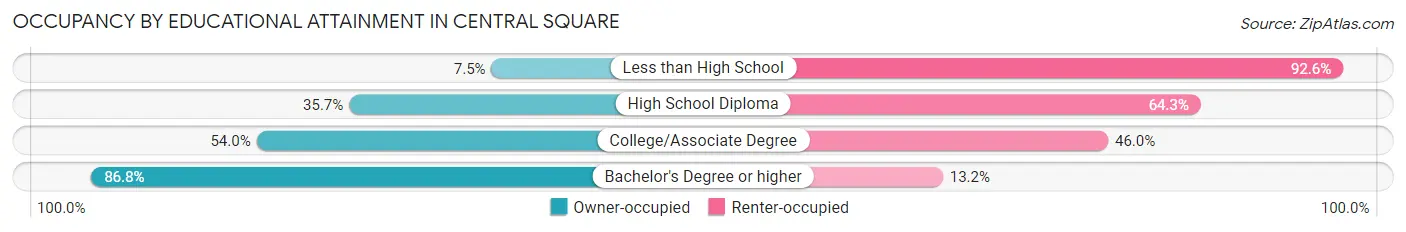
| Household Size | Owner-occupied | Renter-occupied |
| Less than High School | 7 (7.4%) | 87 (92.5%) |
| High School Diploma | 87 (35.7%) | 157 (64.3%) |
| College/Associate Degree | 215 (54.0%) | 183 (46.0%) |
| Bachelor's Degree or higher | 184 (86.8%) | 28 (13.2%) |
Occupancy by Age of Householder in Central Square
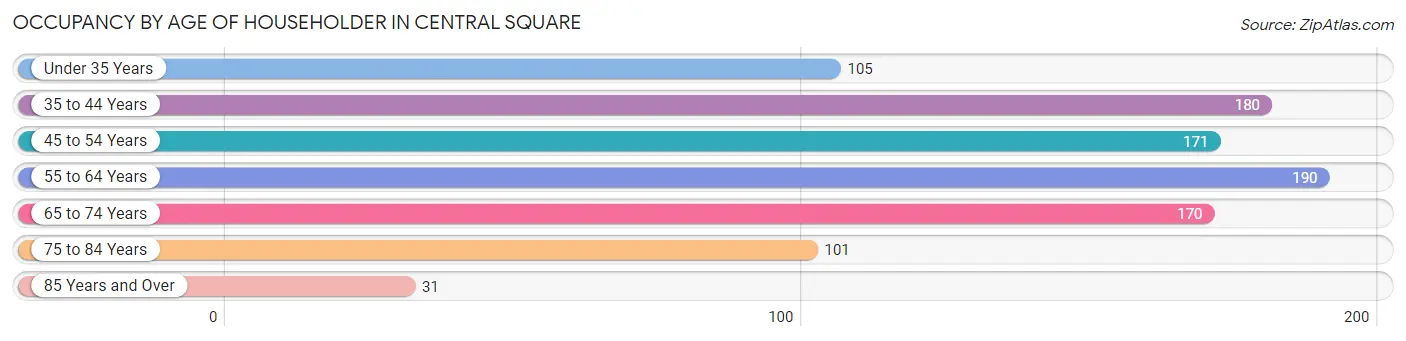
| Age Bracket | # Households | % Households |
| Under 35 Years | 105 | 11.1% |
| 35 to 44 Years | 180 | 19.0% |
| 45 to 54 Years | 171 | 18.0% |
| 55 to 64 Years | 190 | 20.0% |
| 65 to 74 Years | 170 | 17.9% |
| 75 to 84 Years | 101 | 10.6% |
| 85 Years and Over | 31 | 3.3% |
| Total | 948 | 100.0% |
Housing Finances in Central Square
Median Income by Occupancy in Central Square
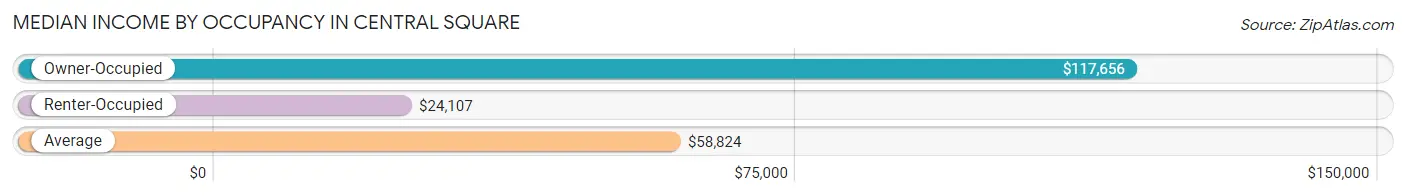
| Occupancy Type | # Households | Median Income |
| Owner-Occupied | 493 (52.0%) | $117,656 |
| Renter-Occupied | 455 (48.0%) | $24,107 |
| Average | 948 (100.0%) | $58,824 |
Occupancy by Householder Income Bracket in Central Square
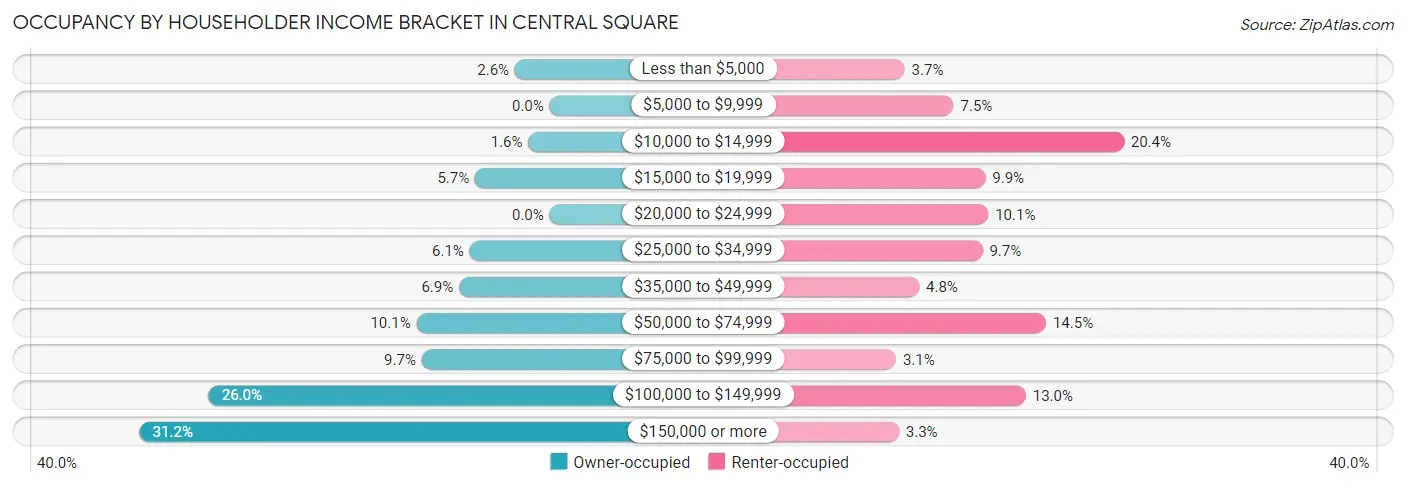
| Income Bracket | Owner-occupied | Renter-occupied |
| Less than $5,000 | 13 (2.6%) | 17 (3.7%) |
| $5,000 to $9,999 | 0 (0.0%) | 34 (7.5%) |
| $10,000 to $14,999 | 8 (1.6%) | 93 (20.4%) |
| $15,000 to $19,999 | 28 (5.7%) | 45 (9.9%) |
| $20,000 to $24,999 | 0 (0.0%) | 46 (10.1%) |
| $25,000 to $34,999 | 30 (6.1%) | 44 (9.7%) |
| $35,000 to $49,999 | 34 (6.9%) | 22 (4.8%) |
| $50,000 to $74,999 | 50 (10.1%) | 66 (14.5%) |
| $75,000 to $99,999 | 48 (9.7%) | 14 (3.1%) |
| $100,000 to $149,999 | 128 (26.0%) | 59 (13.0%) |
| $150,000 or more | 154 (31.2%) | 15 (3.3%) |
| Total | 493 (100.0%) | 455 (100.0%) |
Monthly Housing Cost Tiers in Central Square
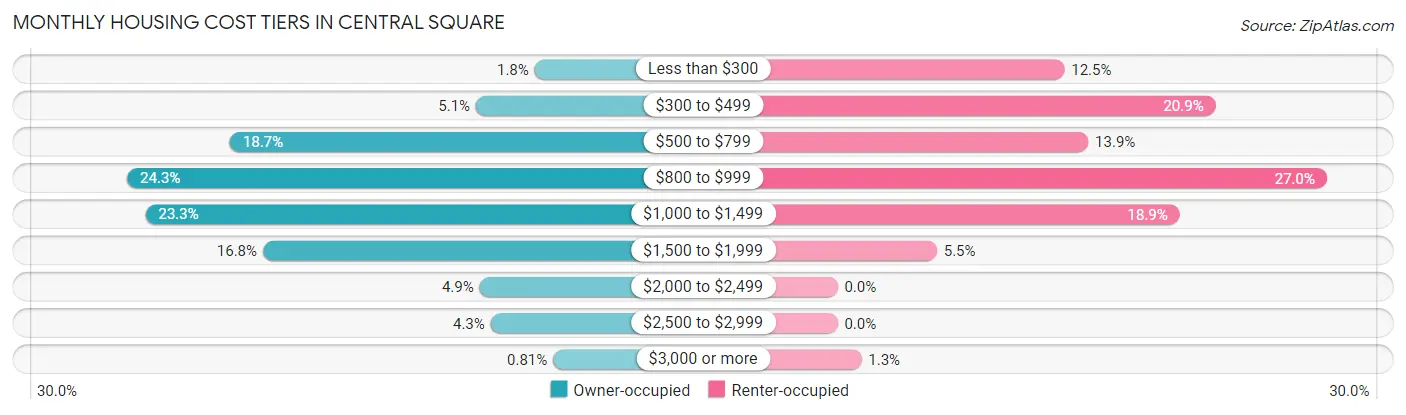
| Monthly Cost | Owner-occupied | Renter-occupied |
| Less than $300 | 9 (1.8%) | 57 (12.5%) |
| $300 to $499 | 25 (5.1%) | 95 (20.9%) |
| $500 to $799 | 92 (18.7%) | 63 (13.9%) |
| $800 to $999 | 120 (24.3%) | 123 (27.0%) |
| $1,000 to $1,499 | 115 (23.3%) | 86 (18.9%) |
| $1,500 to $1,999 | 83 (16.8%) | 25 (5.5%) |
| $2,000 to $2,499 | 24 (4.9%) | 0 (0.0%) |
| $2,500 to $2,999 | 21 (4.3%) | 0 (0.0%) |
| $3,000 or more | 4 (0.8%) | 6 (1.3%) |
| Total | 493 (100.0%) | 455 (100.0%) |
Physical Housing Characteristics in Central Square
Housing Structures in Central Square
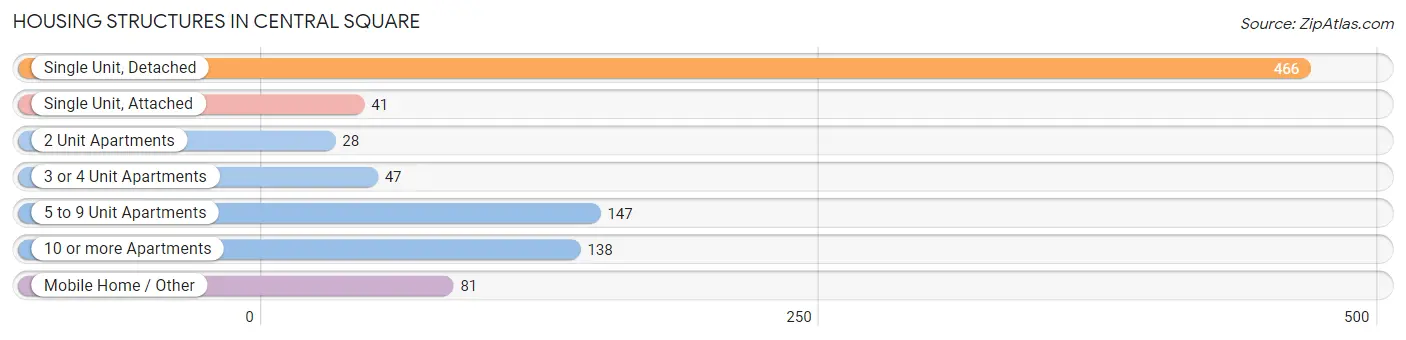
| Structure Type | # Housing Units | % Housing Units |
| Single Unit, Detached | 466 | 49.2% |
| Single Unit, Attached | 41 | 4.3% |
| 2 Unit Apartments | 28 | 2.9% |
| 3 or 4 Unit Apartments | 47 | 5.0% |
| 5 to 9 Unit Apartments | 147 | 15.5% |
| 10 or more Apartments | 138 | 14.6% |
| Mobile Home / Other | 81 | 8.5% |
| Total | 948 | 100.0% |
Housing Structures by Occupancy in Central Square
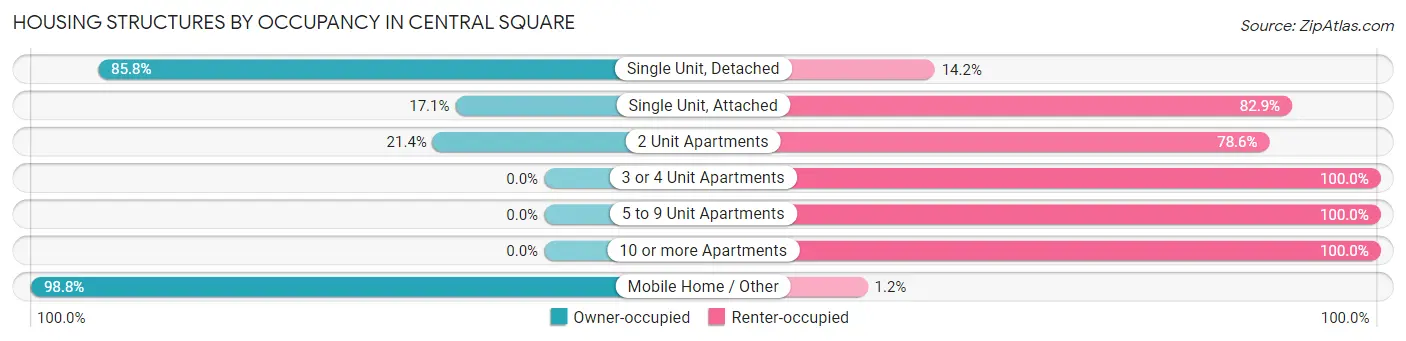
| Structure Type | Owner-occupied | Renter-occupied |
| Single Unit, Detached | 400 (85.8%) | 66 (14.2%) |
| Single Unit, Attached | 7 (17.1%) | 34 (82.9%) |
| 2 Unit Apartments | 6 (21.4%) | 22 (78.6%) |
| 3 or 4 Unit Apartments | 0 (0.0%) | 47 (100.0%) |
| 5 to 9 Unit Apartments | 0 (0.0%) | 147 (100.0%) |
| 10 or more Apartments | 0 (0.0%) | 138 (100.0%) |
| Mobile Home / Other | 80 (98.8%) | 1 (1.2%) |
| Total | 493 (52.0%) | 455 (48.0%) |
Housing Structures by Number of Rooms in Central Square
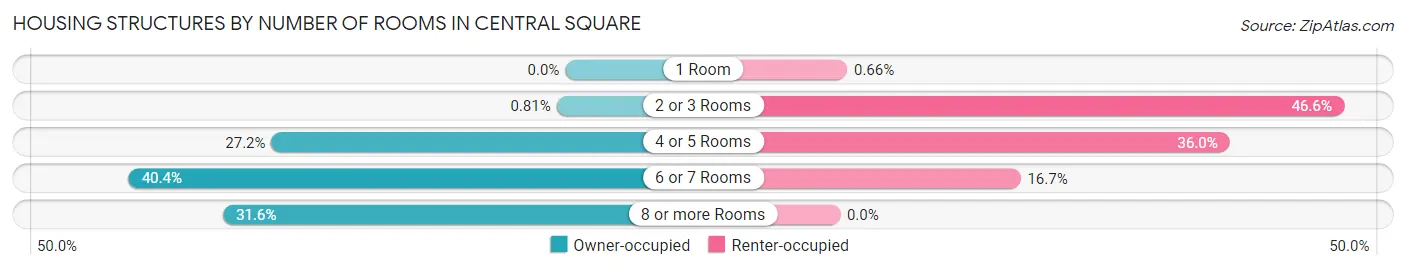
| Number of Rooms | Owner-occupied | Renter-occupied |
| 1 Room | 0 (0.0%) | 3 (0.7%) |
| 2 or 3 Rooms | 4 (0.8%) | 212 (46.6%) |
| 4 or 5 Rooms | 134 (27.2%) | 164 (36.0%) |
| 6 or 7 Rooms | 199 (40.4%) | 76 (16.7%) |
| 8 or more Rooms | 156 (31.6%) | 0 (0.0%) |
| Total | 493 (100.0%) | 455 (100.0%) |
Housing Structure by Heating Type in Central Square
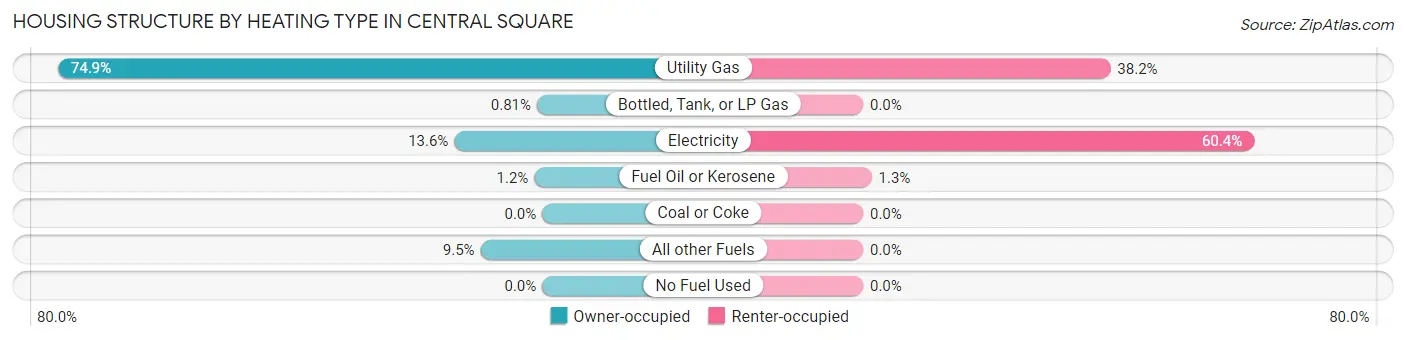
| Heating Type | Owner-occupied | Renter-occupied |
| Utility Gas | 369 (74.9%) | 174 (38.2%) |
| Bottled, Tank, or LP Gas | 4 (0.8%) | 0 (0.0%) |
| Electricity | 67 (13.6%) | 275 (60.4%) |
| Fuel Oil or Kerosene | 6 (1.2%) | 6 (1.3%) |
| Coal or Coke | 0 (0.0%) | 0 (0.0%) |
| All other Fuels | 47 (9.5%) | 0 (0.0%) |
| No Fuel Used | 0 (0.0%) | 0 (0.0%) |
| Total | 493 (100.0%) | 455 (100.0%) |
Household Vehicle Usage in Central Square
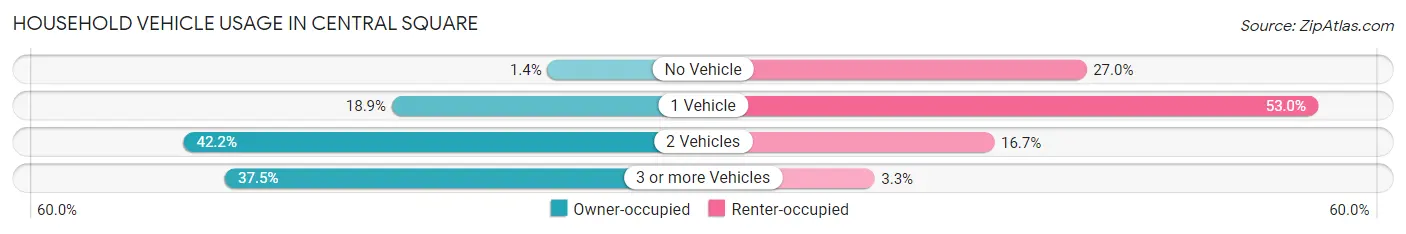
| Vehicles per Household | Owner-occupied | Renter-occupied |
| No Vehicle | 7 (1.4%) | 123 (27.0%) |
| 1 Vehicle | 93 (18.9%) | 241 (53.0%) |
| 2 Vehicles | 208 (42.2%) | 76 (16.7%) |
| 3 or more Vehicles | 185 (37.5%) | 15 (3.3%) |
| Total | 493 (100.0%) | 455 (100.0%) |
Real Estate & Mortgages in Central Square
Real Estate and Mortgage Overview in Central Square
| Characteristic | Without Mortgage | With Mortgage |
| Housing Units | 244 | 249 |
| Median Property Value | $178,500 | $165,400 |
| Median Household Income | $81,786 | $111 |
| Monthly Housing Costs | $809 | $4 |
| Real Estate Taxes | $5,488 | $12 |
Property Value by Mortgage Status in Central Square
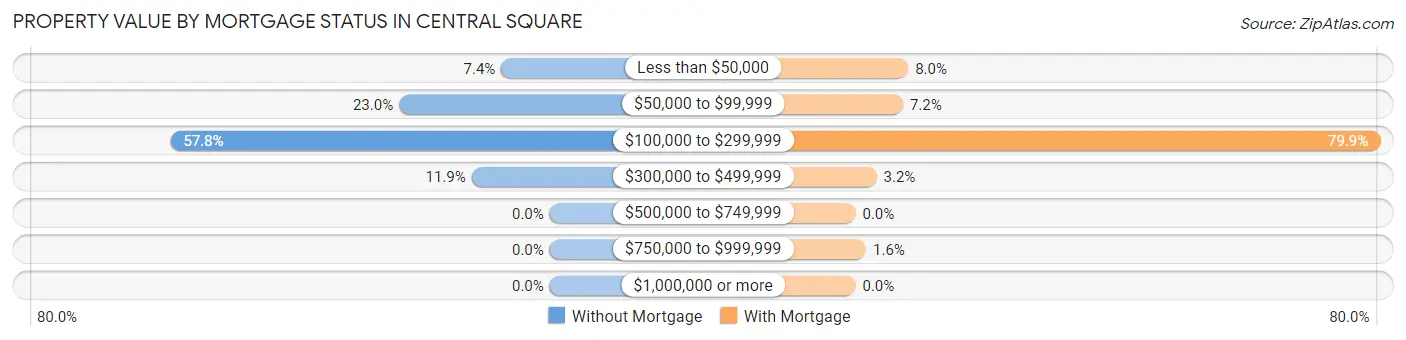
| Property Value | Without Mortgage | With Mortgage |
| Less than $50,000 | 18 (7.4%) | 20 (8.0%) |
| $50,000 to $99,999 | 56 (23.0%) | 18 (7.2%) |
| $100,000 to $299,999 | 141 (57.8%) | 199 (79.9%) |
| $300,000 to $499,999 | 29 (11.9%) | 8 (3.2%) |
| $500,000 to $749,999 | 0 (0.0%) | 0 (0.0%) |
| $750,000 to $999,999 | 0 (0.0%) | 4 (1.6%) |
| $1,000,000 or more | 0 (0.0%) | 0 (0.0%) |
| Total | 244 (100.0%) | 249 (100.0%) |
Household Income by Mortgage Status in Central Square
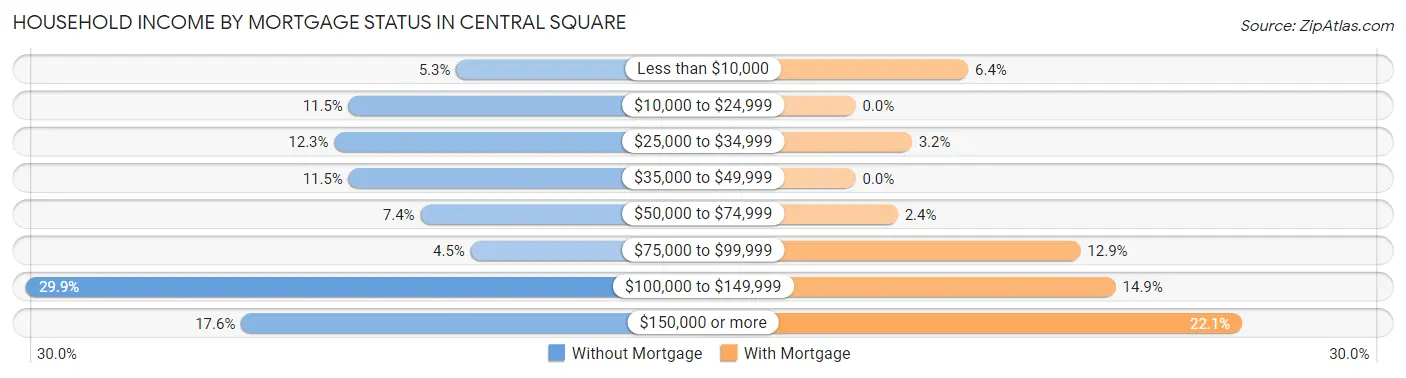
| Household Income | Without Mortgage | With Mortgage |
| Less than $10,000 | 13 (5.3%) | 16 (6.4%) |
| $10,000 to $24,999 | 28 (11.5%) | 0 (0.0%) |
| $25,000 to $34,999 | 30 (12.3%) | 8 (3.2%) |
| $35,000 to $49,999 | 28 (11.5%) | 0 (0.0%) |
| $50,000 to $74,999 | 18 (7.4%) | 6 (2.4%) |
| $75,000 to $99,999 | 11 (4.5%) | 32 (12.9%) |
| $100,000 to $149,999 | 73 (29.9%) | 37 (14.9%) |
| $150,000 or more | 43 (17.6%) | 55 (22.1%) |
| Total | 244 (100.0%) | 249 (100.0%) |
Property Value to Household Income Ratio in Central Square
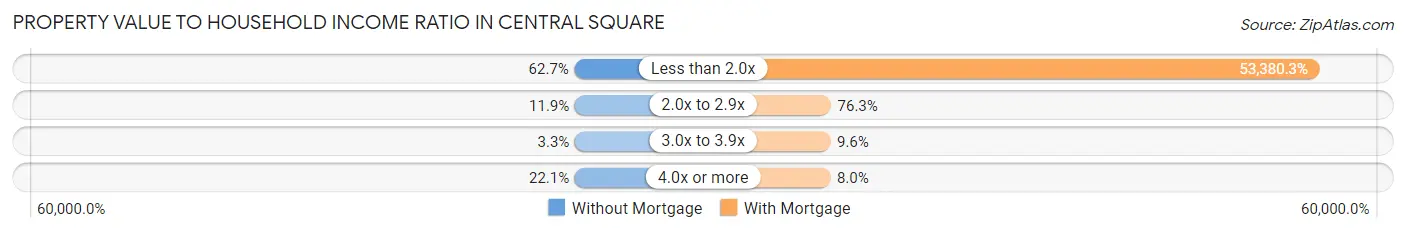
| Value-to-Income Ratio | Without Mortgage | With Mortgage |
| Less than 2.0x | 153 (62.7%) | 132,917 (53,380.3%) |
| 2.0x to 2.9x | 29 (11.9%) | 190 (76.3%) |
| 3.0x to 3.9x | 8 (3.3%) | 24 (9.6%) |
| 4.0x or more | 54 (22.1%) | 20 (8.0%) |
| Total | 244 (100.0%) | 249 (100.0%) |
Real Estate Taxes by Mortgage Status in Central Square
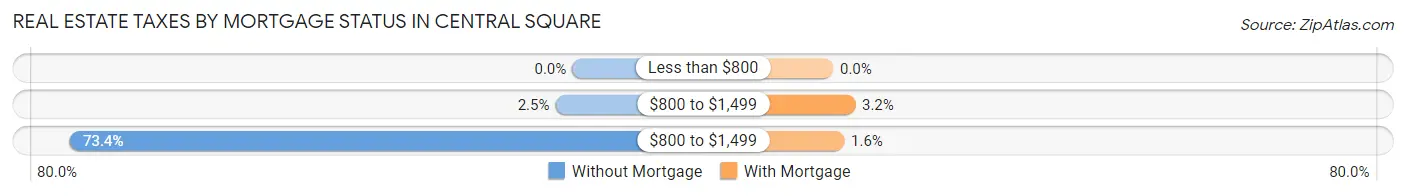
| Property Taxes | Without Mortgage | With Mortgage |
| Less than $800 | 0 (0.0%) | 0 (0.0%) |
| $800 to $1,499 | 6 (2.5%) | 8 (3.2%) |
| $800 to $1,499 | 179 (73.4%) | 4 (1.6%) |
| Total | 244 (100.0%) | 249 (100.0%) |
Health & Disability in Central Square
Health Insurance Coverage by Age in Central Square
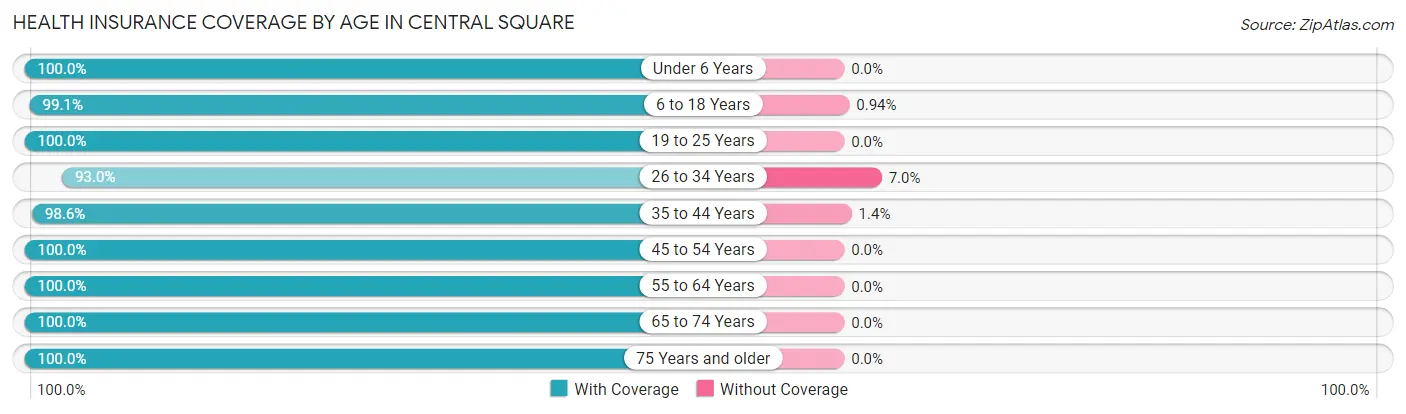
| Age Bracket | With Coverage | Without Coverage |
| Under 6 Years | 165 (100.0%) | 0 (0.0%) |
| 6 to 18 Years | 316 (99.1%) | 3 (0.9%) |
| 19 to 25 Years | 203 (100.0%) | 0 (0.0%) |
| 26 to 34 Years | 120 (93.0%) | 9 (7.0%) |
| 35 to 44 Years | 289 (98.6%) | 4 (1.4%) |
| 45 to 54 Years | 248 (100.0%) | 0 (0.0%) |
| 55 to 64 Years | 349 (100.0%) | 0 (0.0%) |
| 65 to 74 Years | 218 (100.0%) | 0 (0.0%) |
| 75 Years and older | 155 (100.0%) | 0 (0.0%) |
| Total | 2,063 (99.2%) | 16 (0.8%) |
Health Insurance Coverage by Citizenship Status in Central Square
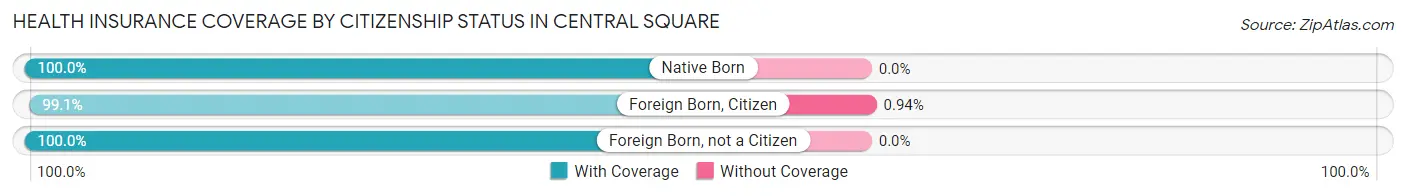
| Citizenship Status | With Coverage | Without Coverage |
| Native Born | 165 (100.0%) | 0 (0.0%) |
| Foreign Born, Citizen | 316 (99.1%) | 3 (0.9%) |
| Foreign Born, not a Citizen | 203 (100.0%) | 0 (0.0%) |
Health Insurance Coverage by Household Income in Central Square
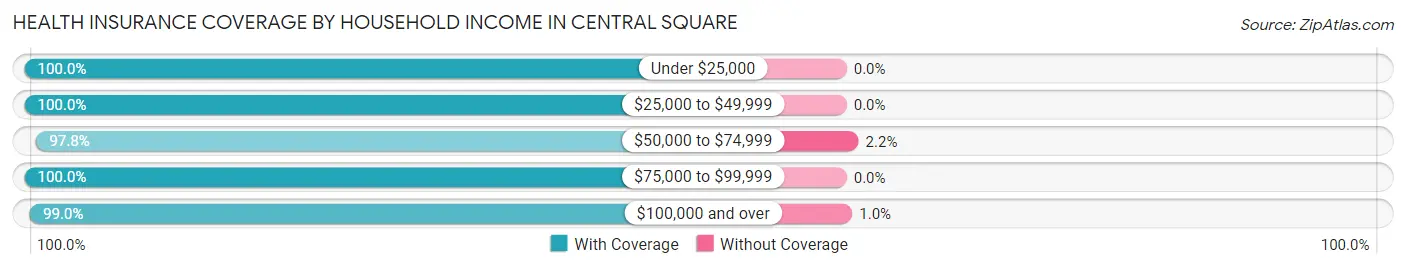
| Household Income | With Coverage | Without Coverage |
| Under $25,000 | 377 (100.0%) | 0 (0.0%) |
| $25,000 to $49,999 | 251 (100.0%) | 0 (0.0%) |
| $50,000 to $74,999 | 176 (97.8%) | 4 (2.2%) |
| $75,000 to $99,999 | 111 (100.0%) | 0 (0.0%) |
| $100,000 and over | 1,140 (99.0%) | 12 (1.0%) |
Public vs Private Health Insurance Coverage by Age in Central Square
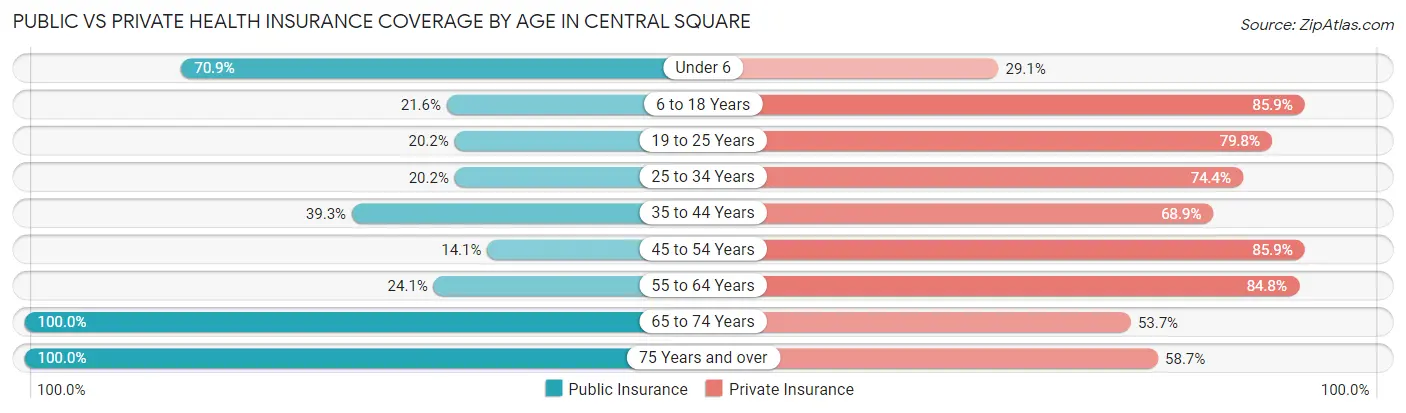
| Age Bracket | Public Insurance | Private Insurance |
| Under 6 | 117 (70.9%) | 48 (29.1%) |
| 6 to 18 Years | 69 (21.6%) | 274 (85.9%) |
| 19 to 25 Years | 41 (20.2%) | 162 (79.8%) |
| 25 to 34 Years | 26 (20.2%) | 96 (74.4%) |
| 35 to 44 Years | 115 (39.3%) | 202 (68.9%) |
| 45 to 54 Years | 35 (14.1%) | 213 (85.9%) |
| 55 to 64 Years | 84 (24.1%) | 296 (84.8%) |
| 65 to 74 Years | 218 (100.0%) | 117 (53.7%) |
| 75 Years and over | 155 (100.0%) | 91 (58.7%) |
| Total | 860 (41.4%) | 1,499 (72.1%) |
Disability Status by Sex by Age in Central Square
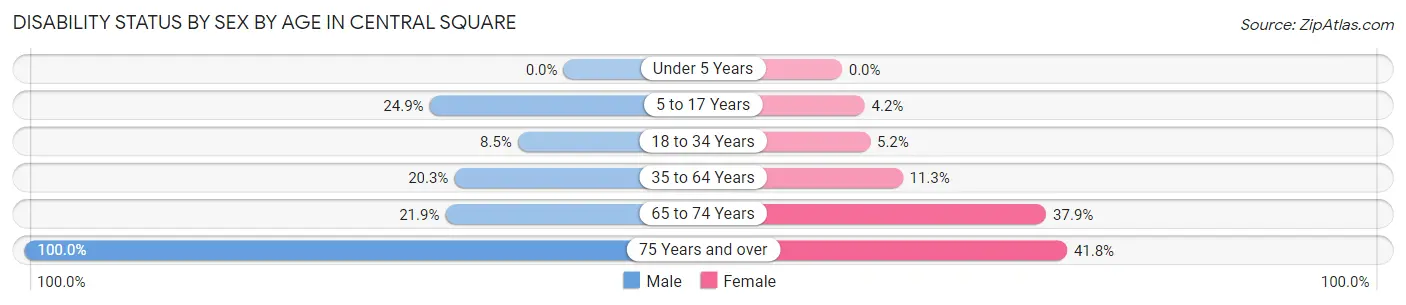
| Age Bracket | Male | Female |
| Under 5 Years | 0 (0.0%) | 0 (0.0%) |
| 5 to 17 Years | 46 (24.9%) | 6 (4.2%) |
| 18 to 34 Years | 10 (8.5%) | 12 (5.2%) |
| 35 to 64 Years | 94 (20.3%) | 48 (11.3%) |
| 65 to 74 Years | 16 (21.9%) | 55 (37.9%) |
| 75 Years and over | 21 (100.0%) | 56 (41.8%) |
Disability Class by Sex by Age in Central Square
Disability Class: Hearing Difficulty
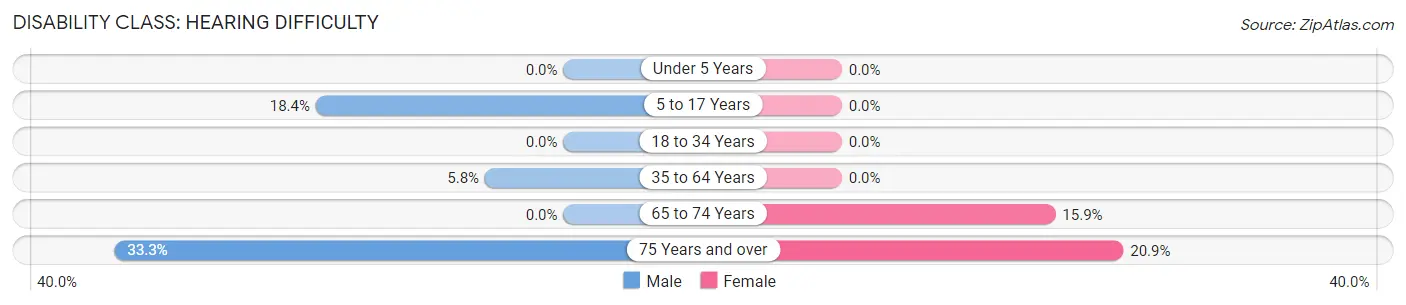
| Age Bracket | Male | Female |
| Under 5 Years | 0 (0.0%) | 0 (0.0%) |
| 5 to 17 Years | 34 (18.4%) | 0 (0.0%) |
| 18 to 34 Years | 0 (0.0%) | 0 (0.0%) |
| 35 to 64 Years | 27 (5.8%) | 0 (0.0%) |
| 65 to 74 Years | 0 (0.0%) | 23 (15.9%) |
| 75 Years and over | 7 (33.3%) | 28 (20.9%) |
Disability Class: Vision Difficulty
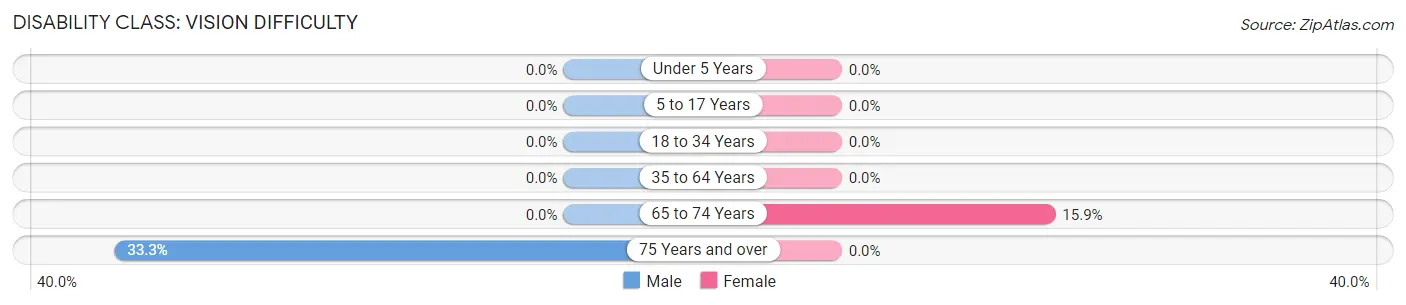
| Age Bracket | Male | Female |
| Under 5 Years | 0 (0.0%) | 0 (0.0%) |
| 5 to 17 Years | 0 (0.0%) | 0 (0.0%) |
| 18 to 34 Years | 0 (0.0%) | 0 (0.0%) |
| 35 to 64 Years | 0 (0.0%) | 0 (0.0%) |
| 65 to 74 Years | 0 (0.0%) | 23 (15.9%) |
| 75 Years and over | 7 (33.3%) | 0 (0.0%) |
Disability Class: Cognitive Difficulty
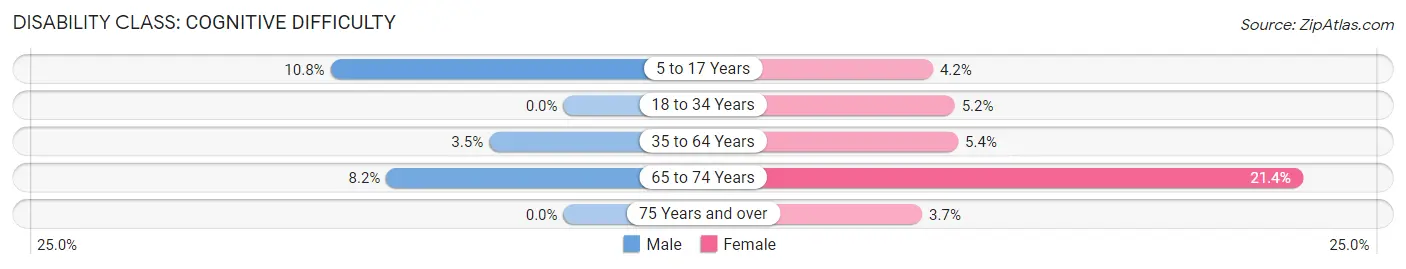
| Age Bracket | Male | Female |
| 5 to 17 Years | 20 (10.8%) | 6 (4.2%) |
| 18 to 34 Years | 0 (0.0%) | 12 (5.2%) |
| 35 to 64 Years | 16 (3.5%) | 23 (5.4%) |
| 65 to 74 Years | 6 (8.2%) | 31 (21.4%) |
| 75 Years and over | 0 (0.0%) | 5 (3.7%) |
Disability Class: Ambulatory Difficulty
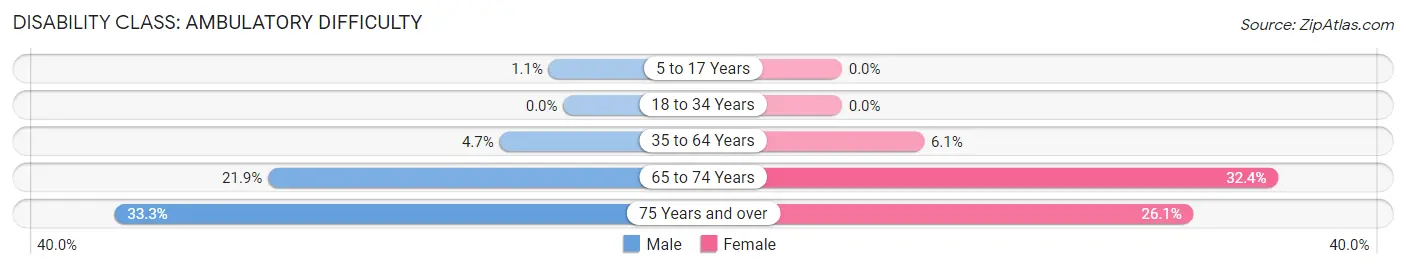
| Age Bracket | Male | Female |
| 5 to 17 Years | 2 (1.1%) | 0 (0.0%) |
| 18 to 34 Years | 0 (0.0%) | 0 (0.0%) |
| 35 to 64 Years | 22 (4.7%) | 26 (6.1%) |
| 65 to 74 Years | 16 (21.9%) | 47 (32.4%) |
| 75 Years and over | 7 (33.3%) | 35 (26.1%) |
Disability Class: Self-Care Difficulty
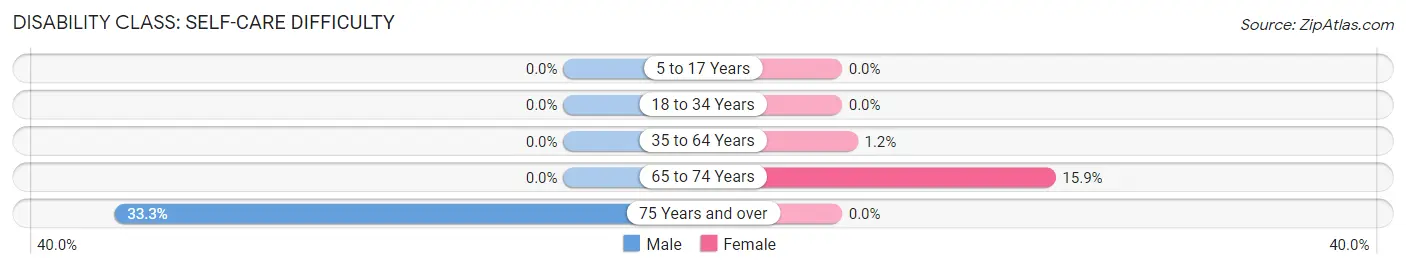
| Age Bracket | Male | Female |
| 5 to 17 Years | 0 (0.0%) | 0 (0.0%) |
| 18 to 34 Years | 0 (0.0%) | 0 (0.0%) |
| 35 to 64 Years | 0 (0.0%) | 5 (1.2%) |
| 65 to 74 Years | 0 (0.0%) | 23 (15.9%) |
| 75 Years and over | 7 (33.3%) | 0 (0.0%) |
Technology Access in Central Square
Computing Device Access in Central Square
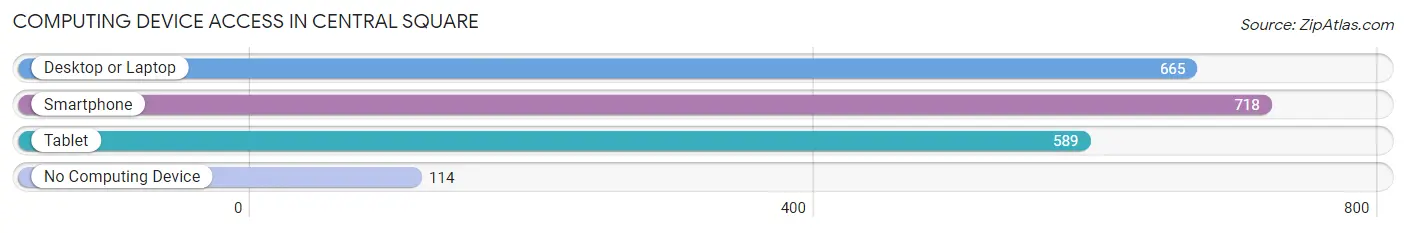
| Device Type | # Households | % Households |
| Desktop or Laptop | 665 | 70.2% |
| Smartphone | 718 | 75.7% |
| Tablet | 589 | 62.1% |
| No Computing Device | 114 | 12.0% |
| Total | 948 | 100.0% |
Internet Access in Central Square
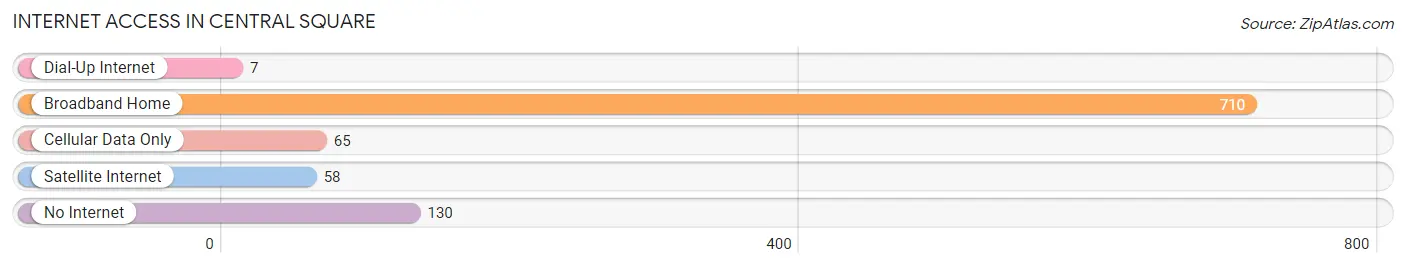
| Internet Type | # Households | % Households |
| Dial-Up Internet | 7 | 0.7% |
| Broadband Home | 710 | 74.9% |
| Cellular Data Only | 65 | 6.9% |
| Satellite Internet | 58 | 6.1% |
| No Internet | 130 | 13.7% |
| Total | 948 | 100.0% |
Central Square Summary
Central Square is a small hamlet located in Oswego County, New York. It is situated in the town of Hastings, approximately 20 miles north of Syracuse. The hamlet is home to a population of approximately 1,500 people, and is a popular destination for tourists and outdoor enthusiasts.
History
Central Square was first settled in the early 1800s by a group of settlers from Connecticut. The settlers were attracted to the area due to its fertile soil and abundant natural resources. The hamlet was originally known as “Hastings Corners”, and was later renamed “Central Square” in 1825. The name was chosen to reflect the central location of the hamlet within the town of Hastings.
In the late 1800s, Central Square experienced a period of rapid growth and development. The hamlet was home to several businesses, including a sawmill, a gristmill, a blacksmith shop, and a general store. The hamlet also had a post office, a school, and several churches.
Geography
Central Square is located in the northern part of Oswego County, approximately 20 miles north of Syracuse. The hamlet is situated in the town of Hastings, and is bordered by the towns of Constantia, West Monroe, and Orwell. The hamlet is located on the eastern shore of Oneida Lake, and is surrounded by rolling hills and forests.
The climate in Central Square is typical of the Northeastern United States. Summers are warm and humid, while winters are cold and snowy. The average annual temperature is approximately 50 degrees Fahrenheit, and the average annual precipitation is approximately 40 inches.
Economy
The economy of Central Square is largely based on tourism and outdoor recreation. The hamlet is home to several popular tourist attractions, including the Oneida Lake State Park, the Central Square Historical Society, and the Central Square Museum. The hamlet is also home to several outdoor recreation areas, including the Oswego County Park, the Constantia State Forest, and the West Monroe State Forest.
In addition to tourism and outdoor recreation, Central Square is home to several small businesses. The hamlet is home to several restaurants, retail stores, and service providers. The hamlet is also home to several manufacturing companies, including a furniture manufacturer and a metal fabrication company.
Demographics
As of the 2010 census, the population of Central Square was 1,521. The racial makeup of the hamlet was 97.3% White, 0.7% African American, 0.3% Native American, 0.3% Asian, and 1.4% from other races. The median household income was $45,938, and the median family income was $51,938. The per capita income was $20,938.
Central Square is a small, rural hamlet with a rich history and a vibrant economy. The hamlet is home to a diverse population, and is a popular destination for tourists and outdoor enthusiasts. The hamlet is home to several businesses, and is a great place to live, work, and play.
Common Questions
What is Per Capita Income in Central Square?
Per Capita income in Central Square is $48,114.
What is the Median Family Income in Central Square?
Median Family Income in Central Square is $111,563.
What is the Median Household income in Central Square?
Median Household Income in Central Square is $58,824.
What is Income or Wage Gap in Central Square?
Income or Wage Gap in Central Square is 45.2%.
Women in Central Square earn 54.8 cents for every dollar earned by a man.
What is Inequality or Gini Index in Central Square?
Inequality or Gini Index in Central Square is 0.58.
What is the Total Population of Central Square?
Total Population of Central Square is 2,079.
What is the Total Male Population of Central Square?
Total Male Population of Central Square is 918.
What is the Total Female Population of Central Square?
Total Female Population of Central Square is 1,161.
What is the Ratio of Males per 100 Females in Central Square?
There are 79.07 Males per 100 Females in Central Square.
What is the Ratio of Females per 100 Males in Central Square?
There are 126.47 Females per 100 Males in Central Square.
What is the Median Population Age in Central Square?
Median Population Age in Central Square is 41.0 Years.
What is the Average Family Size in Central Square
Average Family Size in Central Square is 2.9 People.
What is the Average Household Size in Central Square
Average Household Size in Central Square is 2.2 People.
How Large is the Labor Force in Central Square?
There are 1,070 People in the Labor Forcein in Central Square.
What is the Percentage of People in the Labor Force in Central Square?
64.9% of People are in the Labor Force in Central Square.
What is the Unemployment Rate in Central Square?
Unemployment Rate in Central Square is 3.6%.