Gilbertsville, NY Map & Demographics
Gilbertsville Map
Gilbertsville Overview
$47,858
PER CAPITA INCOME
$98,125
AVG FAMILY INCOME
$90,313
AVG HOUSEHOLD INCOME
54.0%
WAGE / INCOME GAP [ % ]
46.0¢/ $1
WAGE / INCOME GAP [ $ ]
0.39
INEQUALITY / GINI INDEX
337
TOTAL POPULATION
145
MALE POPULATION
192
FEMALE POPULATION
75.52
MALES / 100 FEMALES
132.41
FEMALES / 100 MALES
45.5
MEDIAN AGE
3.0
AVG FAMILY SIZE
2.4
AVG HOUSEHOLD SIZE
182
LABOR FORCE [ PEOPLE ]
61.7%
PERCENT IN LABOR FORCE
7.1%
UNEMPLOYMENT RATE
Gilbertsville Zip Codes
Gilbertsville Area Codes
Income in Gilbertsville
Income Overview in Gilbertsville
Per Capita Income in Gilbertsville is $47,858, while median incomes of families and households are $98,125 and $90,313 respectively.
| Characteristic | Number | Measure |
| Per Capita Income | 337 | $47,858 |
| Median Family Income | 83 | $98,125 |
| Mean Family Income | 83 | $111,337 |
| Median Household Income | 143 | $90,313 |
| Mean Household Income | 143 | $99,191 |
| Income Deficit | 83 | $0 |
| Wage / Income Gap (%) | 337 | 54.01% |
| Wage / Income Gap ($) | 337 | 45.99¢ per $1 |
| Gini / Inequality Index | 337 | 0.39 |
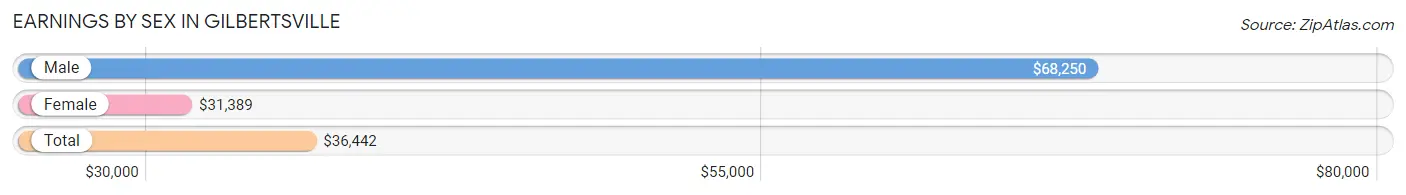
Earnings by Sex in Gilbertsville
Average Earnings in Gilbertsville are $36,442, $68,250 for men and $31,389 for women, a difference of 54.0%.
| Sex | Number | Average Earnings |
| Male | 77 (38.3%) | $68,250 |
| Female | 124 (61.7%) | $31,389 |
| Total | 201 (100.0%) | $36,442 |
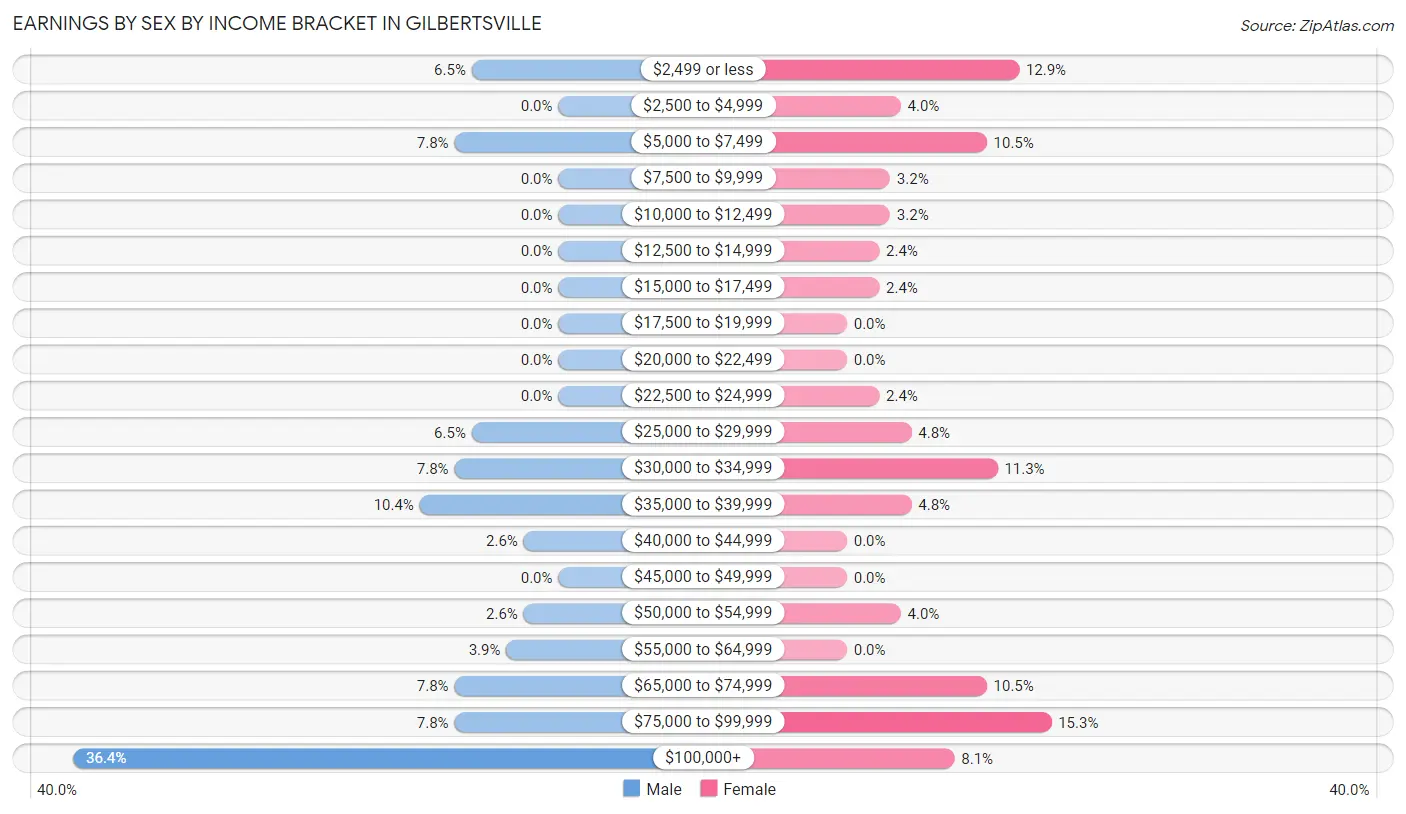
Earnings by Sex by Income Bracket in Gilbertsville
The most common earnings brackets in Gilbertsville are $100,000+ for men (28 | 36.4%) and $75,000 to $99,999 for women (19 | 15.3%).
| Income | Male | Female |
| $2,499 or less | 5 (6.5%) | 16 (12.9%) |
| $2,500 to $4,999 | 0 (0.0%) | 5 (4.0%) |
| $5,000 to $7,499 | 6 (7.8%) | 13 (10.5%) |
| $7,500 to $9,999 | 0 (0.0%) | 4 (3.2%) |
| $10,000 to $12,499 | 0 (0.0%) | 4 (3.2%) |
| $12,500 to $14,999 | 0 (0.0%) | 3 (2.4%) |
| $15,000 to $17,499 | 0 (0.0%) | 3 (2.4%) |
| $17,500 to $19,999 | 0 (0.0%) | 0 (0.0%) |
| $20,000 to $22,499 | 0 (0.0%) | 0 (0.0%) |
| $22,500 to $24,999 | 0 (0.0%) | 3 (2.4%) |
| $25,000 to $29,999 | 5 (6.5%) | 6 (4.8%) |
| $30,000 to $34,999 | 6 (7.8%) | 14 (11.3%) |
| $35,000 to $39,999 | 8 (10.4%) | 6 (4.8%) |
| $40,000 to $44,999 | 2 (2.6%) | 0 (0.0%) |
| $45,000 to $49,999 | 0 (0.0%) | 0 (0.0%) |
| $50,000 to $54,999 | 2 (2.6%) | 5 (4.0%) |
| $55,000 to $64,999 | 3 (3.9%) | 0 (0.0%) |
| $65,000 to $74,999 | 6 (7.8%) | 13 (10.5%) |
| $75,000 to $99,999 | 6 (7.8%) | 19 (15.3%) |
| $100,000+ | 28 (36.4%) | 10 (8.1%) |
| Total | 77 (100.0%) | 124 (100.0%) |
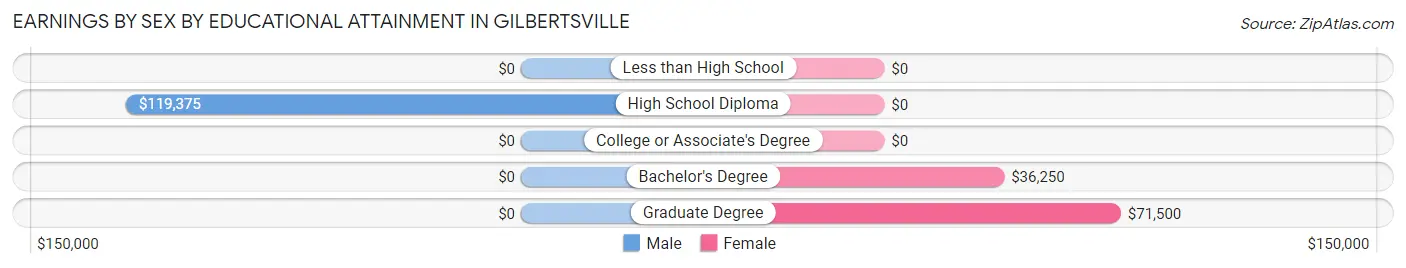
Earnings by Sex by Educational Attainment in Gilbertsville
| Educational Attainment | Male Income | Female Income |
| Less than High School | - | - |
| High School Diploma | $119,375 | $0 |
| College or Associate's Degree | - | - |
| Bachelor's Degree | - | - |
| Graduate Degree | - | - |
| Total | - | - |
Family Income in Gilbertsville
Family Income Brackets in Gilbertsville
According to the Gilbertsville family income data, there are 25 families falling into the $75,000 to $99,999 income range, which is the most common income bracket and makes up 30.1% of all families.
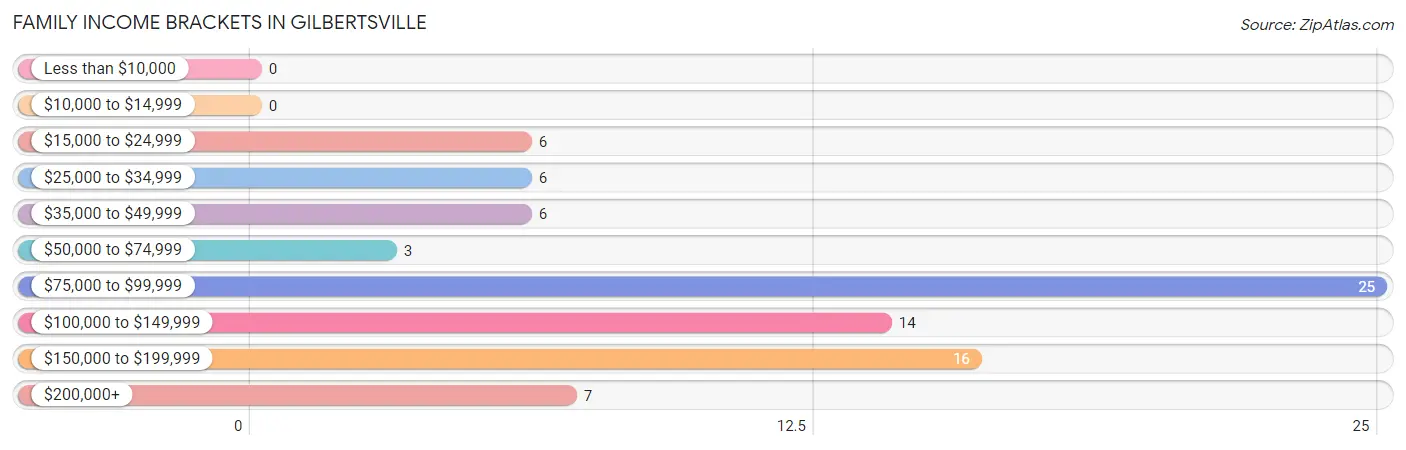
| Income Bracket | # Families | % Families |
| Less than $10,000 | 0 | 0.0% |
| $10,000 to $14,999 | 0 | 0.0% |
| $15,000 to $24,999 | 6 | 7.2% |
| $25,000 to $34,999 | 6 | 7.2% |
| $35,000 to $49,999 | 6 | 7.2% |
| $50,000 to $74,999 | 3 | 3.6% |
| $75,000 to $99,999 | 25 | 30.1% |
| $100,000 to $149,999 | 14 | 16.9% |
| $150,000 to $199,999 | 16 | 19.3% |
| $200,000+ | 7 | 8.4% |
Family Income by Famaliy Size in Gilbertsville
2-person families (56 | 67.5%) account for the highest median family income in Gilbertsville with $111,250 per family, while 2-person families (56 | 67.5%) have the highest median income of $55,625 per family member.
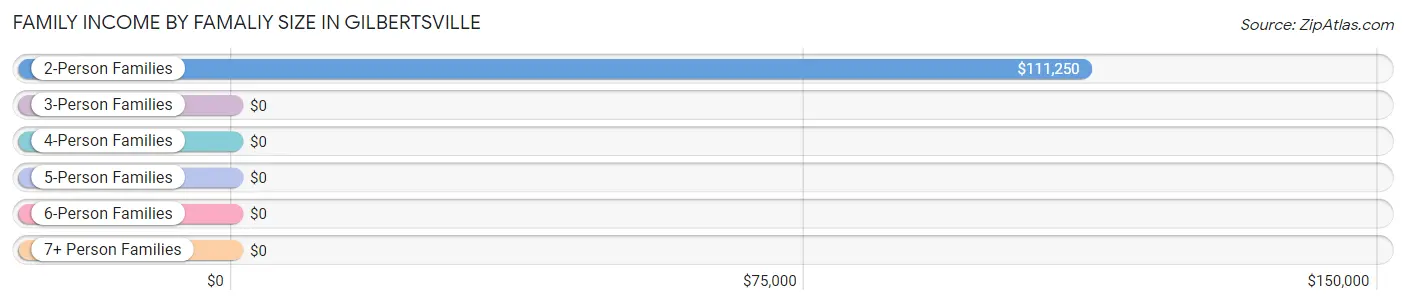
| Income Bracket | # Families | Median Income |
| 2-Person Families | 56 (67.5%) | $111,250 |
| 3-Person Families | 15 (18.1%) | $0 |
| 4-Person Families | 8 (9.6%) | $0 |
| 5-Person Families | 2 (2.4%) | $0 |
| 6-Person Families | 0 (0.0%) | $0 |
| 7+ Person Families | 2 (2.4%) | $0 |
| Total | 83 (100.0%) | $98,125 |
Family Income by Number of Earners in Gilbertsville
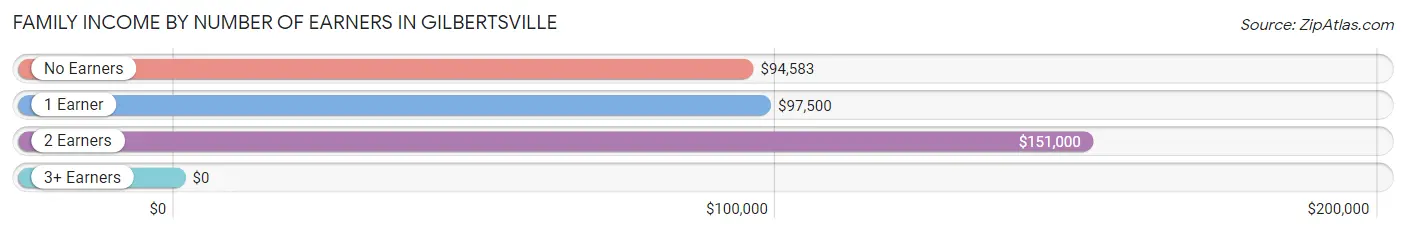
| Number of Earners | # Families | Median Income |
| No Earners | 11 (13.3%) | $94,583 |
| 1 Earner | 34 (41.0%) | $97,500 |
| 2 Earners | 28 (33.7%) | $151,000 |
| 3+ Earners | 10 (12.0%) | $0 |
| Total | 83 (100.0%) | $98,125 |
Household Income in Gilbertsville
Household Income Brackets in Gilbertsville
With 33 households falling in the category, the $75,000 to $99,999 income range is the most frequent in Gilbertsville, accounting for 23.1% of all households.
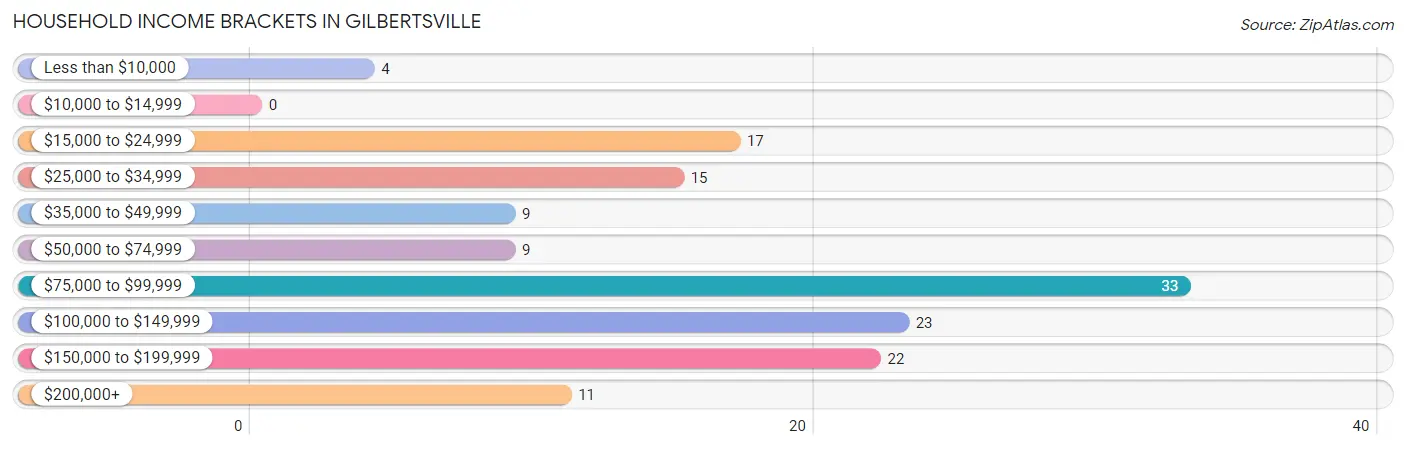
| Income Bracket | # Households | % Households |
| Less than $10,000 | 4 | 2.8% |
| $10,000 to $14,999 | 0 | 0.0% |
| $15,000 to $24,999 | 17 | 11.9% |
| $25,000 to $34,999 | 15 | 10.5% |
| $35,000 to $49,999 | 9 | 6.3% |
| $50,000 to $74,999 | 9 | 6.3% |
| $75,000 to $99,999 | 33 | 23.1% |
| $100,000 to $149,999 | 23 | 16.1% |
| $150,000 to $199,999 | 22 | 15.4% |
| $200,000+ | 11 | 7.7% |
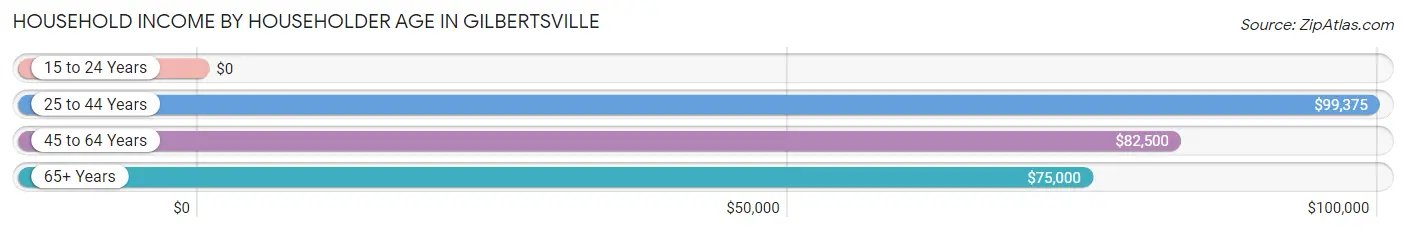
Household Income by Householder Age in Gilbertsville
The median household income in Gilbertsville is $90,313, with the highest median household income of $99,375 found in the 25 to 44 years age bracket for the primary householder. A total of 31 households (21.7%) fall into this category.
| Income Bracket | # Households | Median Income |
| 15 to 24 Years | 0 (0.0%) | $0 |
| 25 to 44 Years | 31 (21.7%) | $99,375 |
| 45 to 64 Years | 58 (40.6%) | $82,500 |
| 65+ Years | 54 (37.8%) | $75,000 |
| Total | 143 (100.0%) | $90,313 |
Poverty in Gilbertsville
Income Below Poverty by Sex and Age in Gilbertsville
With 4.1% poverty level for males and 4.2% for females among the residents of Gilbertsville, 75 year old and over males and 5 year old females are the most vulnerable to poverty, with 4 males (20.0%) and 1 females (100.0%) in their respective age groups living below the poverty level.
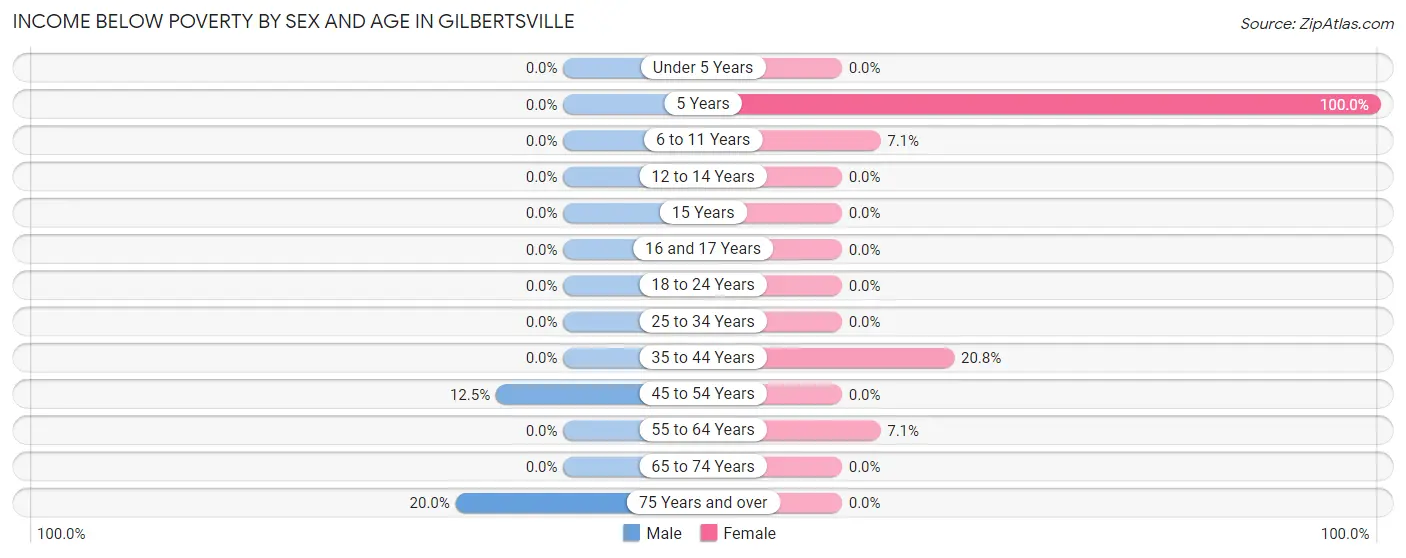
| Age Bracket | Male | Female |
| Under 5 Years | 0 (0.0%) | 0 (0.0%) |
| 5 Years | 0 (0.0%) | 1 (100.0%) |
| 6 to 11 Years | 0 (0.0%) | 1 (7.1%) |
| 12 to 14 Years | 0 (0.0%) | 0 (0.0%) |
| 15 Years | 0 (0.0%) | 0 (0.0%) |
| 16 and 17 Years | 0 (0.0%) | 0 (0.0%) |
| 18 to 24 Years | 0 (0.0%) | 0 (0.0%) |
| 25 to 34 Years | 0 (0.0%) | 0 (0.0%) |
| 35 to 44 Years | 0 (0.0%) | 5 (20.8%) |
| 45 to 54 Years | 2 (12.5%) | 0 (0.0%) |
| 55 to 64 Years | 0 (0.0%) | 1 (7.1%) |
| 65 to 74 Years | 0 (0.0%) | 0 (0.0%) |
| 75 Years and over | 4 (20.0%) | 0 (0.0%) |
| Total | 6 (4.1%) | 8 (4.2%) |
Income Above Poverty by Sex and Age in Gilbertsville
According to the poverty statistics in Gilbertsville, males aged 6 to 11 years and females aged 12 to 14 years are the age groups that are most secure financially, with 100.0% of males and 100.0% of females in these age groups living above the poverty line.
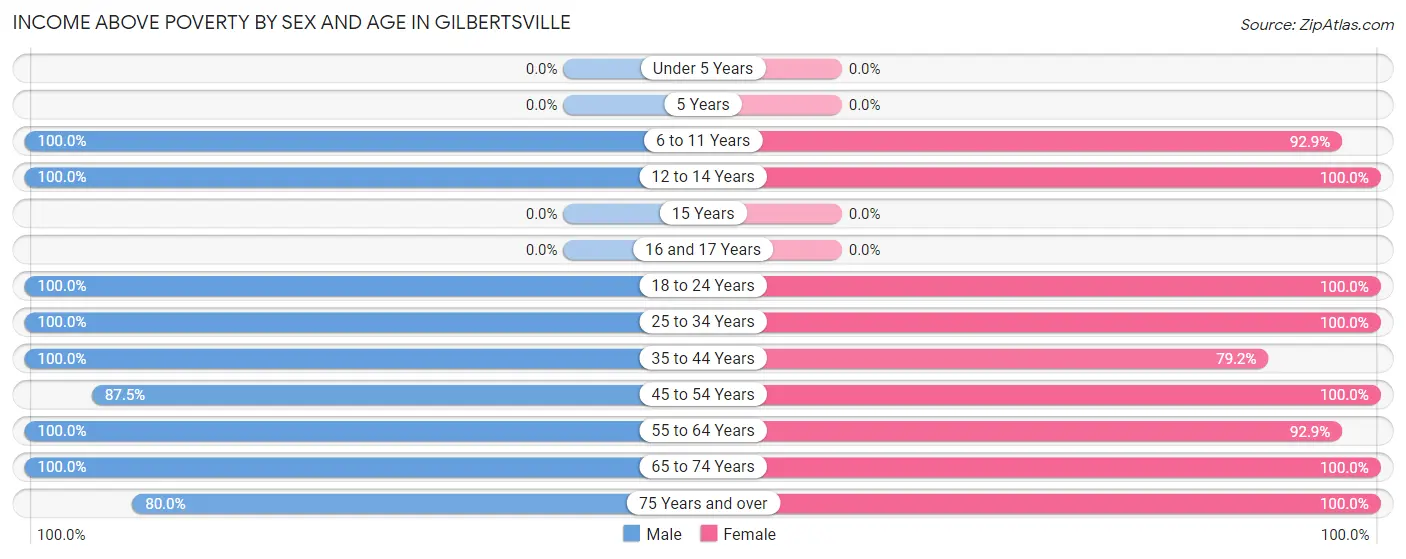
| Age Bracket | Male | Female |
| Under 5 Years | 0 (0.0%) | 0 (0.0%) |
| 5 Years | 0 (0.0%) | 0 (0.0%) |
| 6 to 11 Years | 19 (100.0%) | 13 (92.9%) |
| 12 to 14 Years | 7 (100.0%) | 1 (100.0%) |
| 15 Years | 0 (0.0%) | 0 (0.0%) |
| 16 and 17 Years | 0 (0.0%) | 0 (0.0%) |
| 18 to 24 Years | 21 (100.0%) | 43 (100.0%) |
| 25 to 34 Years | 2 (100.0%) | 12 (100.0%) |
| 35 to 44 Years | 23 (100.0%) | 19 (79.2%) |
| 45 to 54 Years | 14 (87.5%) | 37 (100.0%) |
| 55 to 64 Years | 24 (100.0%) | 13 (92.9%) |
| 65 to 74 Years | 13 (100.0%) | 17 (100.0%) |
| 75 Years and over | 16 (80.0%) | 29 (100.0%) |
| Total | 139 (95.9%) | 184 (95.8%) |
Income Below Poverty Among Married-Couple Families in Gilbertsville
The poverty statistics for married-couple families in Gilbertsville show that 3.5% or 2 of the total 58 families live below the poverty line. Families with 1 or 2 children have the highest poverty rate of 25.0%, comprising of 2 families. On the other hand, families with no children have the lowest poverty rate of 0.0%, which includes 0 families.
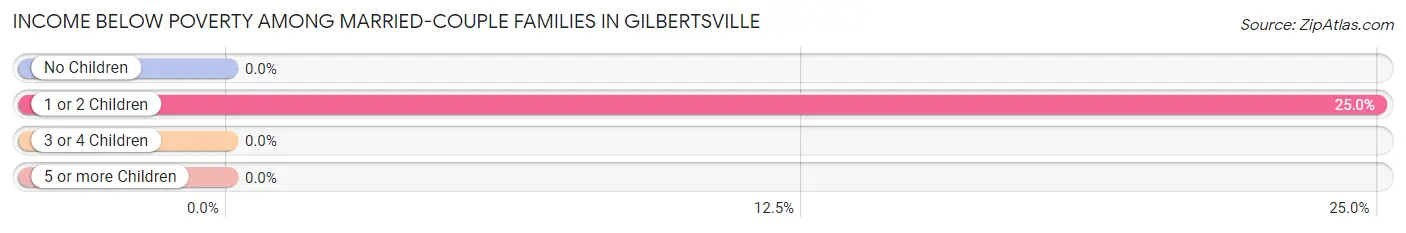
| Children | Above Poverty | Below Poverty |
| No Children | 48 (100.0%) | 0 (0.0%) |
| 1 or 2 Children | 6 (75.0%) | 2 (25.0%) |
| 3 or 4 Children | 0 (0.0%) | 0 (0.0%) |
| 5 or more Children | 2 (100.0%) | 0 (0.0%) |
| Total | 56 (96.6%) | 2 (3.5%) |
Income Below Poverty Among Single-Parent Households in Gilbertsville
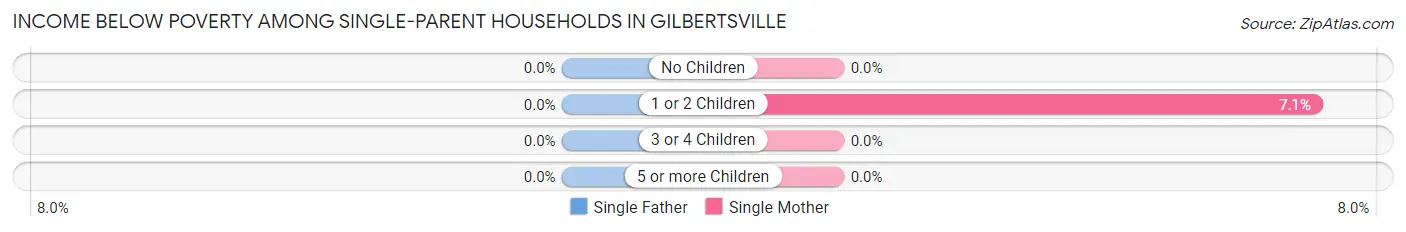
| Children | Single Father | Single Mother |
| No Children | 0 (0.0%) | 0 (0.0%) |
| 1 or 2 Children | 0 (0.0%) | 1 (7.1%) |
| 3 or 4 Children | 0 (0.0%) | 0 (0.0%) |
| 5 or more Children | 0 (0.0%) | 0 (0.0%) |
| Total | 0 (0.0%) | 1 (4.8%) |
Income Below Poverty Among Married-Couple vs Single-Parent Households in Gilbertsville
The poverty data for Gilbertsville shows that 2 of the married-couple family households (3.5%) and 1 of the single-parent households (4.0%) are living below the poverty level. Within the married-couple family households, those with 1 or 2 children have the highest poverty rate, with 2 households (25.0%) falling below the poverty line. Among the single-parent households, those with 1 or 2 children have the highest poverty rate, with 1 household (5.6%) living below poverty.
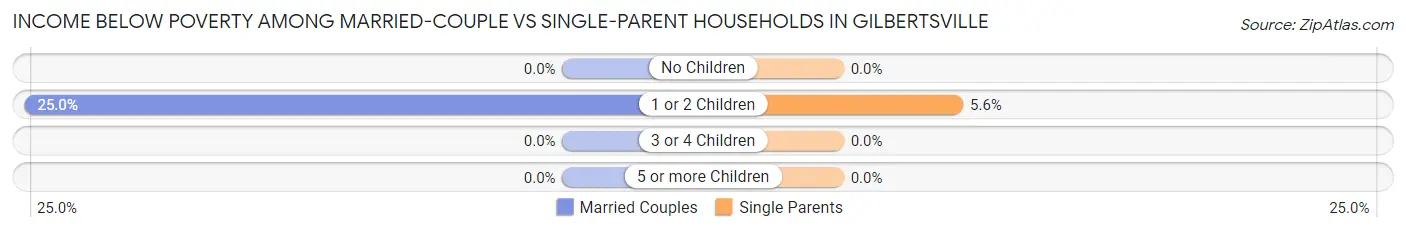
| Children | Married-Couple Families | Single-Parent Households |
| No Children | 0 (0.0%) | 0 (0.0%) |
| 1 or 2 Children | 2 (25.0%) | 1 (5.6%) |
| 3 or 4 Children | 0 (0.0%) | 0 (0.0%) |
| 5 or more Children | 0 (0.0%) | 0 (0.0%) |
| Total | 2 (3.5%) | 1 (4.0%) |
Race in Gilbertsville
The most populous races in Gilbertsville are White / Caucasian (318 | 94.4%), Two or more Races (14 | 4.2%), and Asian (5 | 1.5%).
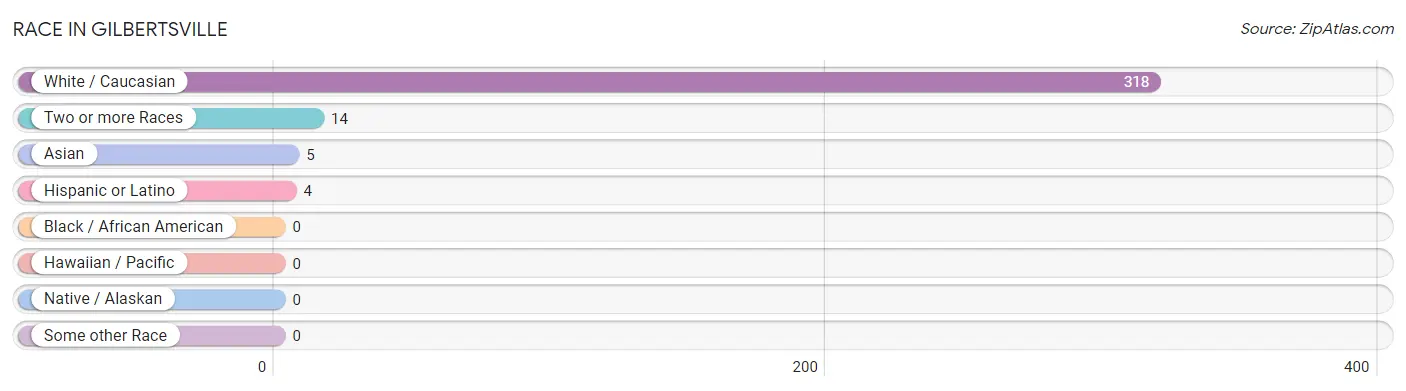
| Race | # Population | % Population |
| Asian | 5 | 1.5% |
| Black / African American | 0 | 0.0% |
| Hawaiian / Pacific | 0 | 0.0% |
| Hispanic or Latino | 4 | 1.2% |
| Native / Alaskan | 0 | 0.0% |
| White / Caucasian | 318 | 94.4% |
| Two or more Races | 14 | 4.2% |
| Some other Race | 0 | 0.0% |
| Total | 337 | 100.0% |
Ancestry in Gilbertsville
The most populous ancestries reported in Gilbertsville are Irish (98 | 29.1%), English (68 | 20.2%), German (61 | 18.1%), Italian (43 | 12.8%), and British (18 | 5.3%), together accounting for 85.5% of all Gilbertsville residents.
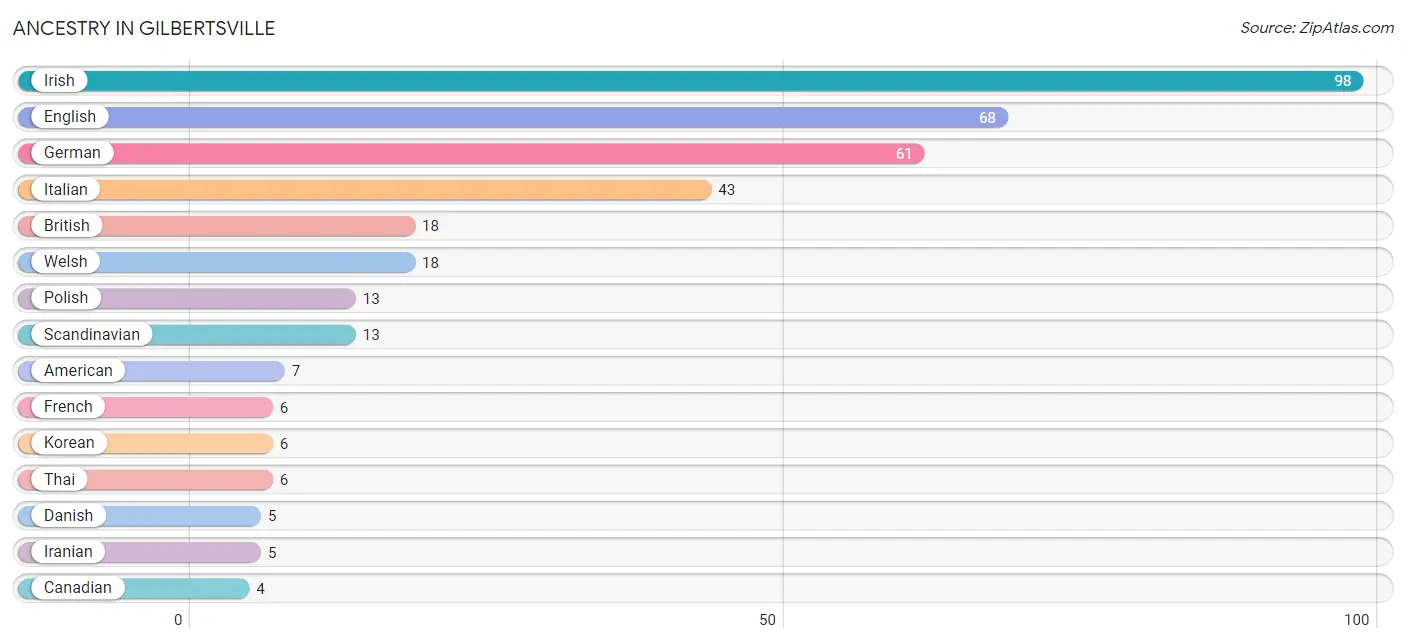
| Ancestry | # Population | % Population |
| American | 7 | 2.1% |
| British | 18 | 5.3% |
| Canadian | 4 | 1.2% |
| Danish | 5 | 1.5% |
| Dutch | 4 | 1.2% |
| English | 68 | 20.2% |
| French | 6 | 1.8% |
| French Canadian | 2 | 0.6% |
| German | 61 | 18.1% |
| Greek | 2 | 0.6% |
| Iranian | 5 | 1.5% |
| Irish | 98 | 29.1% |
| Italian | 43 | 12.8% |
| Korean | 6 | 1.8% |
| Norwegian | 2 | 0.6% |
| Polish | 13 | 3.9% |
| Puerto Rican | 4 | 1.2% |
| Scandinavian | 13 | 3.9% |
| Scotch-Irish | 4 | 1.2% |
| Scottish | 4 | 1.2% |
| Slavic | 2 | 0.6% |
| Slovene | 1 | 0.3% |
| Swedish | 3 | 0.9% |
| Thai | 6 | 1.8% |
| Ukrainian | 1 | 0.3% |
| Welsh | 18 | 5.3% | View All 26 Rows |
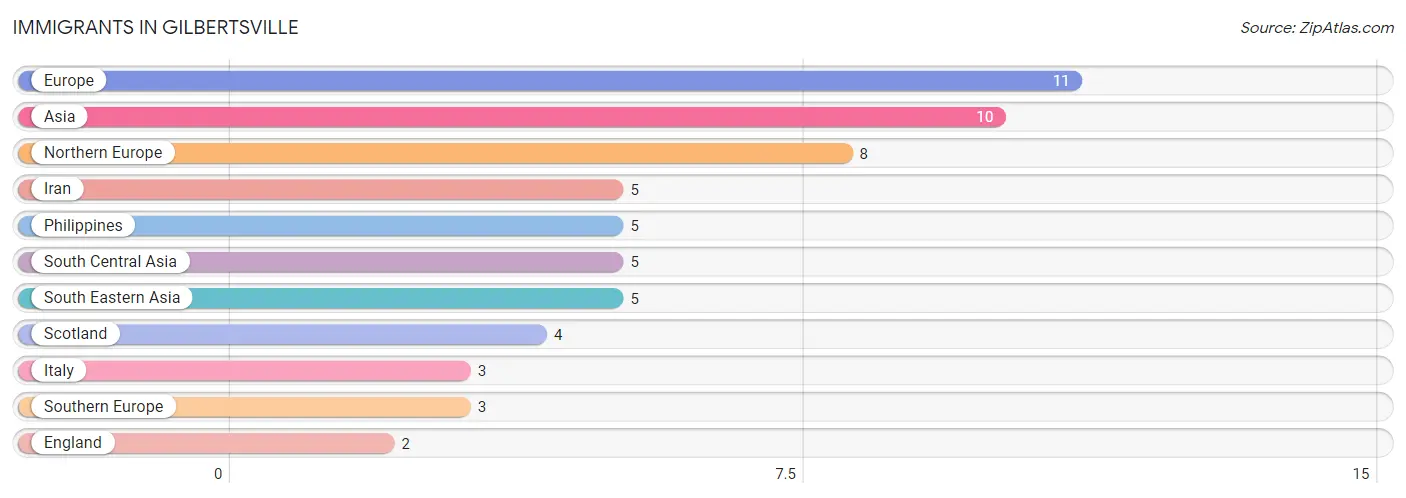
Immigrants in Gilbertsville
The most numerous immigrant groups reported in Gilbertsville came from Europe (11 | 3.3%), Asia (10 | 3.0%), Northern Europe (8 | 2.4%), Iran (5 | 1.5%), and Philippines (5 | 1.5%), together accounting for 11.6% of all Gilbertsville residents.
| Immigration Origin | # Population | % Population |
| Asia | 10 | 3.0% |
| England | 2 | 0.6% |
| Europe | 11 | 3.3% |
| Iran | 5 | 1.5% |
| Italy | 3 | 0.9% |
| Northern Europe | 8 | 2.4% |
| Philippines | 5 | 1.5% |
| Scotland | 4 | 1.2% |
| South Central Asia | 5 | 1.5% |
| South Eastern Asia | 5 | 1.5% |
| Southern Europe | 3 | 0.9% | View All 11 Rows |
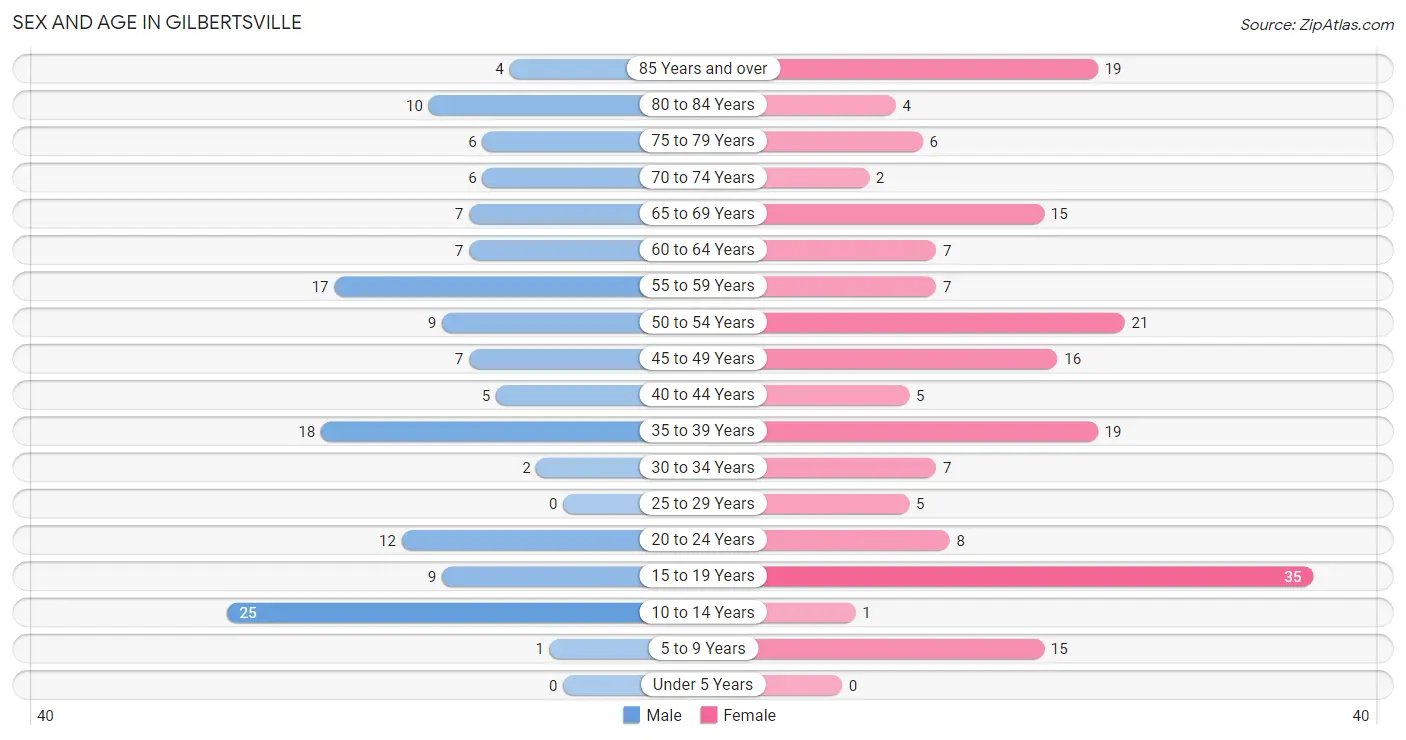
Sex and Age in Gilbertsville
Sex and Age in Gilbertsville
The most populous age groups in Gilbertsville are 10 to 14 Years (25 | 17.2%) for men and 15 to 19 Years (35 | 18.2%) for women.
| Age Bracket | Male | Female |
| Under 5 Years | 0 (0.0%) | 0 (0.0%) |
| 5 to 9 Years | 1 (0.7%) | 15 (7.8%) |
| 10 to 14 Years | 25 (17.2%) | 1 (0.5%) |
| 15 to 19 Years | 9 (6.2%) | 35 (18.2%) |
| 20 to 24 Years | 12 (8.3%) | 8 (4.2%) |
| 25 to 29 Years | 0 (0.0%) | 5 (2.6%) |
| 30 to 34 Years | 2 (1.4%) | 7 (3.6%) |
| 35 to 39 Years | 18 (12.4%) | 19 (9.9%) |
| 40 to 44 Years | 5 (3.5%) | 5 (2.6%) |
| 45 to 49 Years | 7 (4.8%) | 16 (8.3%) |
| 50 to 54 Years | 9 (6.2%) | 21 (10.9%) |
| 55 to 59 Years | 17 (11.7%) | 7 (3.6%) |
| 60 to 64 Years | 7 (4.8%) | 7 (3.6%) |
| 65 to 69 Years | 7 (4.8%) | 15 (7.8%) |
| 70 to 74 Years | 6 (4.1%) | 2 (1.0%) |
| 75 to 79 Years | 6 (4.1%) | 6 (3.1%) |
| 80 to 84 Years | 10 (6.9%) | 4 (2.1%) |
| 85 Years and over | 4 (2.8%) | 19 (9.9%) |
| Total | 145 (100.0%) | 192 (100.0%) |
Families and Households in Gilbertsville
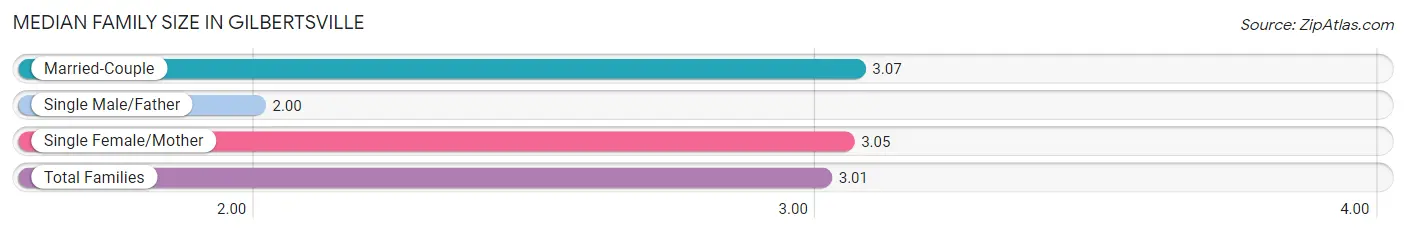
Median Family Size in Gilbertsville
The median family size in Gilbertsville is 3.01 persons per family, with married-couple families (58 | 69.9%) accounting for the largest median family size of 3.07 persons per family. On the other hand, single male/father families (4 | 4.8%) represent the smallest median family size with 2.00 persons per family.
| Family Type | # Families | Family Size |
| Married-Couple | 58 (69.9%) | 3.07 |
| Single Male/Father | 4 (4.8%) | 2.00 |
| Single Female/Mother | 21 (25.3%) | 3.05 |
| Total Families | 83 (100.0%) | 3.01 |
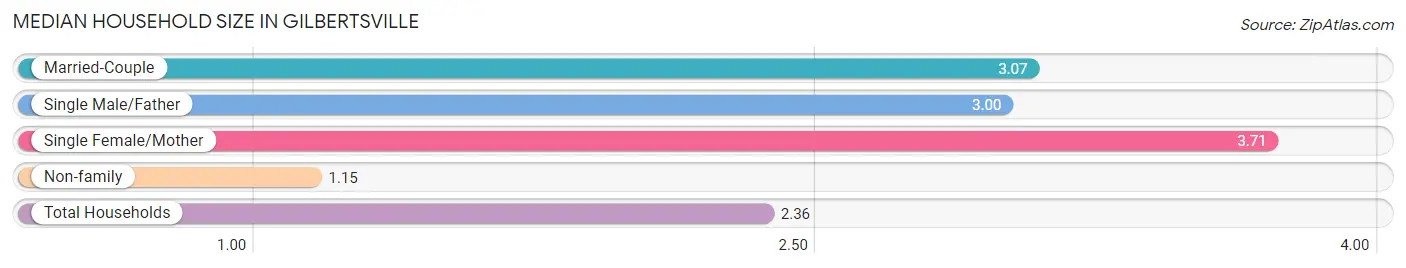
Median Household Size in Gilbertsville
The median household size in Gilbertsville is 2.36 persons per household, with single female/mother households (21 | 14.7%) accounting for the largest median household size of 3.71 persons per household. non-family households (60 | 42.0%) represent the smallest median household size with 1.15 persons per household.
| Household Type | # Households | Household Size |
| Married-Couple | 58 (40.6%) | 3.07 |
| Single Male/Father | 4 (2.8%) | 3.00 |
| Single Female/Mother | 21 (14.7%) | 3.71 |
| Non-family | 60 (42.0%) | 1.15 |
| Total Households | 143 (100.0%) | 2.36 |
Household Size by Marriage Status in Gilbertsville
Out of a total of 143 households in Gilbertsville, 83 (58.0%) are family households, while 60 (42.0%) are nonfamily households. The most numerous type of family households are 2-person households, comprising 46, and the most common type of nonfamily households are 1-person households, comprising 51.
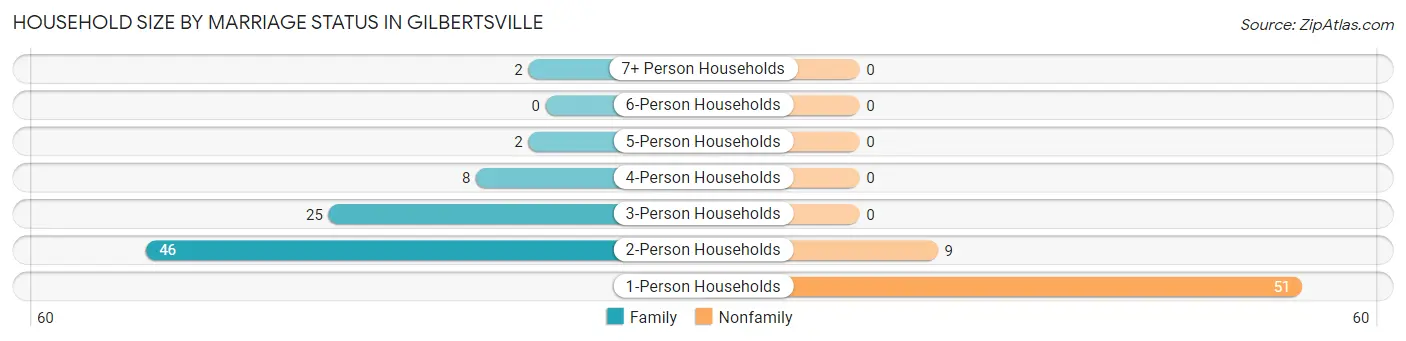
| Household Size | Family Households | Nonfamily Households |
| 1-Person Households | - | 51 (35.7%) |
| 2-Person Households | 46 (32.2%) | 9 (6.3%) |
| 3-Person Households | 25 (17.5%) | 0 (0.0%) |
| 4-Person Households | 8 (5.6%) | 0 (0.0%) |
| 5-Person Households | 2 (1.4%) | 0 (0.0%) |
| 6-Person Households | 0 (0.0%) | 0 (0.0%) |
| 7+ Person Households | 2 (1.4%) | 0 (0.0%) |
| Total | 83 (58.0%) | 60 (42.0%) |
Female Fertility in Gilbertsville
Fertility by Age in Gilbertsville
| Age Bracket | Women with Births | Births / 1,000 Women |
| 15 to 19 years | 0 (0.0%) | 0.0 |
| 20 to 34 years | 0 (0.0%) | 0.0 |
| 35 to 50 years | 0 (0.0%) | 0.0 |
| Total | 0 (0.0%) | 0.0 |
Fertility by Age by Marriage Status in Gilbertsville
| Age Bracket | Married | Unmarried |
| 15 to 19 years | 0 (0.0%) | 0 (0.0%) |
| 20 to 34 years | 0 (0.0%) | 0 (0.0%) |
| 35 to 50 years | 0 (0.0%) | 0 (0.0%) |
| Total | 0 (0.0%) | 0 (0.0%) |
Fertility by Education in Gilbertsville
| Educational Attainment | Women with Births | Births / 1,000 Women |
| Less than High School | 0 (0.0%) | 0.0 |
| High School Diploma | 0 (0.0%) | 0.0 |
| College or Associate's Degree | 0 (0.0%) | 0.0 |
| Bachelor's Degree | 0 (0.0%) | 0.0 |
| Graduate Degree | 0 (0.0%) | 0.0 |
| Total | 0 (0.0%) | 0.0 |
Fertility by Education by Marriage Status in Gilbertsville
| Educational Attainment | Married | Unmarried |
| Less than High School | 0 (0.0%) | 0 (0.0%) |
| High School Diploma | 0 (0.0%) | 0 (0.0%) |
| College or Associate's Degree | 0 (0.0%) | 0 (0.0%) |
| Bachelor's Degree | 0 (0.0%) | 0 (0.0%) |
| Graduate Degree | 0 (0.0%) | 0 (0.0%) |
| Total | 0 (0.0%) | 0 (0.0%) |
Employment Characteristics in Gilbertsville
Employment by Class of Employer in Gilbertsville
Among the 160 employed individuals in Gilbertsville, private company employees (82 | 51.2%), not-for-profit organizations (30 | 18.8%), and state government employees (16 | 10.0%) make up the most common classes of employment.
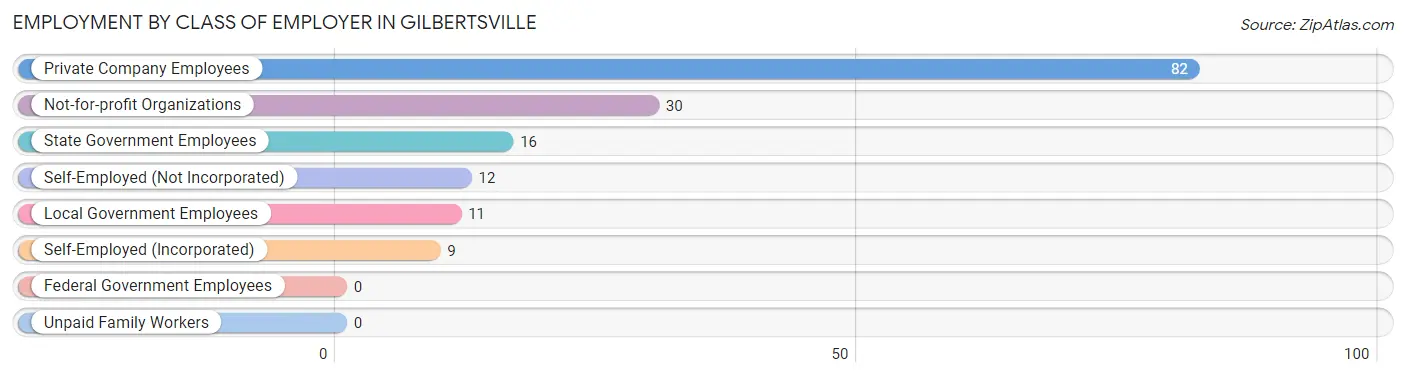
| Employer Class | # Employees | % Employees |
| Private Company Employees | 82 | 51.2% |
| Self-Employed (Incorporated) | 9 | 5.6% |
| Self-Employed (Not Incorporated) | 12 | 7.5% |
| Not-for-profit Organizations | 30 | 18.8% |
| Local Government Employees | 11 | 6.9% |
| State Government Employees | 16 | 10.0% |
| Federal Government Employees | 0 | 0.0% |
| Unpaid Family Workers | 0 | 0.0% |
| Total | 160 | 100.0% |
Employment Status by Age in Gilbertsville
According to the labor force statistics for Gilbertsville, out of the total population over 16 years of age (295), 61.7% or 182 individuals are in the labor force, with 7.1% or 13 of them unemployed. The age group with the highest labor force participation rate is 25 to 29 years, with 100.0% or 5 individuals in the labor force. Within the labor force, the 16 to 19 years age range has the highest percentage of unemployed individuals, with 42.9% or 6 of them being unemployed.
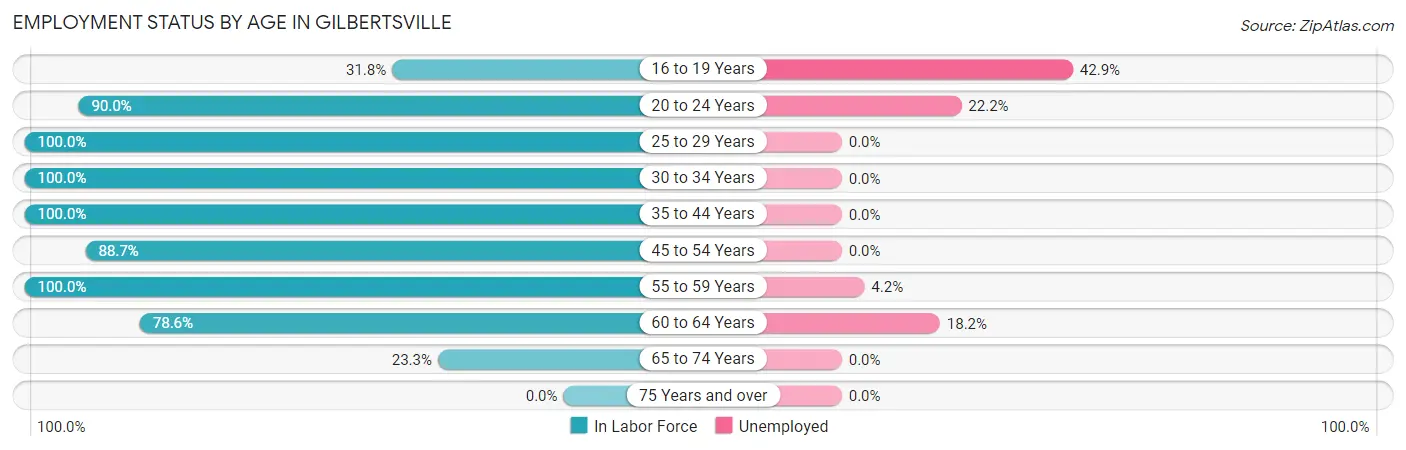
| Age Bracket | In Labor Force | Unemployed |
| 16 to 19 Years | 14 (31.8%) | 6 (42.9%) |
| 20 to 24 Years | 18 (90.0%) | 4 (22.2%) |
| 25 to 29 Years | 5 (100.0%) | 0 (0.0%) |
| 30 to 34 Years | 9 (100.0%) | 0 (0.0%) |
| 35 to 44 Years | 47 (100.0%) | 0 (0.0%) |
| 45 to 54 Years | 47 (88.7%) | 0 (0.0%) |
| 55 to 59 Years | 24 (100.0%) | 1 (4.2%) |
| 60 to 64 Years | 11 (78.6%) | 2 (18.2%) |
| 65 to 74 Years | 7 (23.3%) | 0 (0.0%) |
| 75 Years and over | 0 (0.0%) | 0 (0.0%) |
| Total | 182 (61.7%) | 13 (7.1%) |
Employment Status by Educational Attainment in Gilbertsville
According to labor force statistics for Gilbertsville, 94.1% of individuals (143) out of the total population between 25 and 64 years of age (152) are in the labor force, with 2.1% or 3 of them being unemployed. The group with the highest labor force participation rate are those with the educational attainment of bachelor's degree or higher, with 96.8% or 61 individuals in the labor force. Within the labor force, individuals with college / associate degree education have the highest percentage of unemployment, with 6.3% or 2 of them being unemployed.
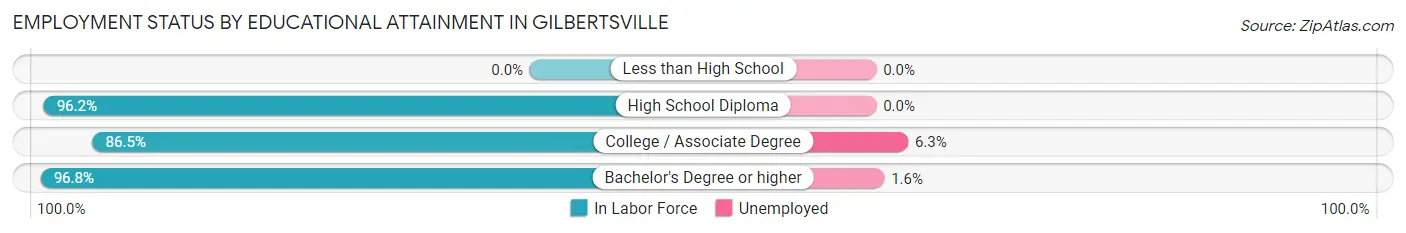
| Educational Attainment | In Labor Force | Unemployed |
| Less than High School | 0 (0.0%) | 0 (0.0%) |
| High School Diploma | 50 (96.2%) | 0 (0.0%) |
| College / Associate Degree | 32 (86.5%) | 2 (6.3%) |
| Bachelor's Degree or higher | 61 (96.8%) | 1 (1.6%) |
| Total | 143 (94.1%) | 3 (2.1%) |
Employment Occupations by Sex in Gilbertsville
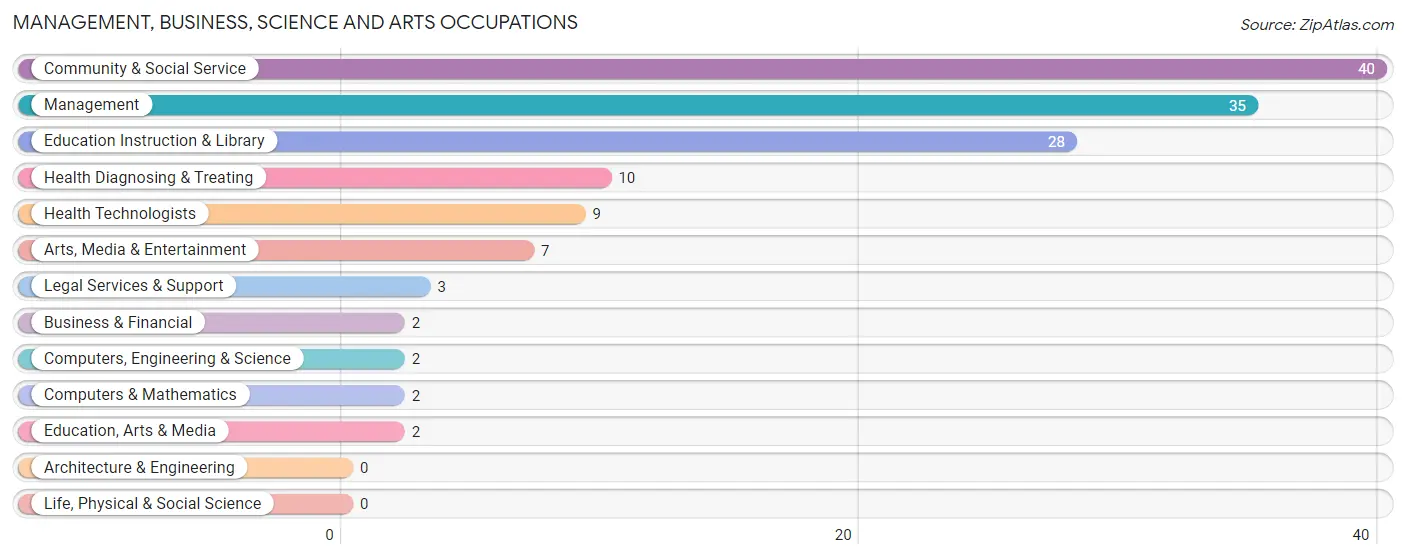
Management, Business, Science and Arts Occupations
The most common Management, Business, Science and Arts occupations in Gilbertsville are Community & Social Service (40 | 23.7%), Management (35 | 20.7%), Education Instruction & Library (28 | 16.6%), Health Diagnosing & Treating (10 | 5.9%), and Health Technologists (9 | 5.3%).
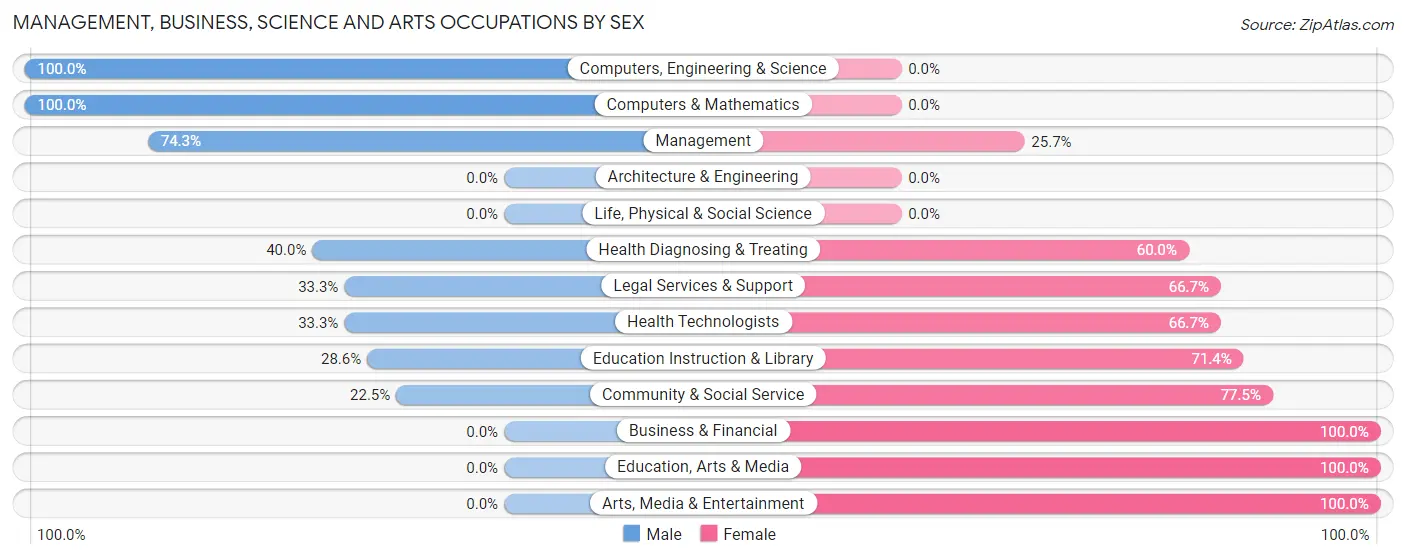
Management, Business, Science and Arts Occupations by Sex
Within the Management, Business, Science and Arts occupations in Gilbertsville, the most male-oriented occupations are Computers, Engineering & Science (100.0%), Computers & Mathematics (100.0%), and Management (74.3%), while the most female-oriented occupations are Business & Financial (100.0%), Education, Arts & Media (100.0%), and Arts, Media & Entertainment (100.0%).
| Occupation | Male | Female |
| Management | 26 (74.3%) | 9 (25.7%) |
| Business & Financial | 0 (0.0%) | 2 (100.0%) |
| Computers, Engineering & Science | 2 (100.0%) | 0 (0.0%) |
| Computers & Mathematics | 2 (100.0%) | 0 (0.0%) |
| Architecture & Engineering | 0 (0.0%) | 0 (0.0%) |
| Life, Physical & Social Science | 0 (0.0%) | 0 (0.0%) |
| Community & Social Service | 9 (22.5%) | 31 (77.5%) |
| Education, Arts & Media | 0 (0.0%) | 2 (100.0%) |
| Legal Services & Support | 1 (33.3%) | 2 (66.7%) |
| Education Instruction & Library | 8 (28.6%) | 20 (71.4%) |
| Arts, Media & Entertainment | 0 (0.0%) | 7 (100.0%) |
| Health Diagnosing & Treating | 4 (40.0%) | 6 (60.0%) |
| Health Technologists | 3 (33.3%) | 6 (66.7%) |
| Total (Category) | 41 (46.1%) | 48 (53.9%) |
| Total (Overall) | 69 (40.8%) | 100 (59.2%) |
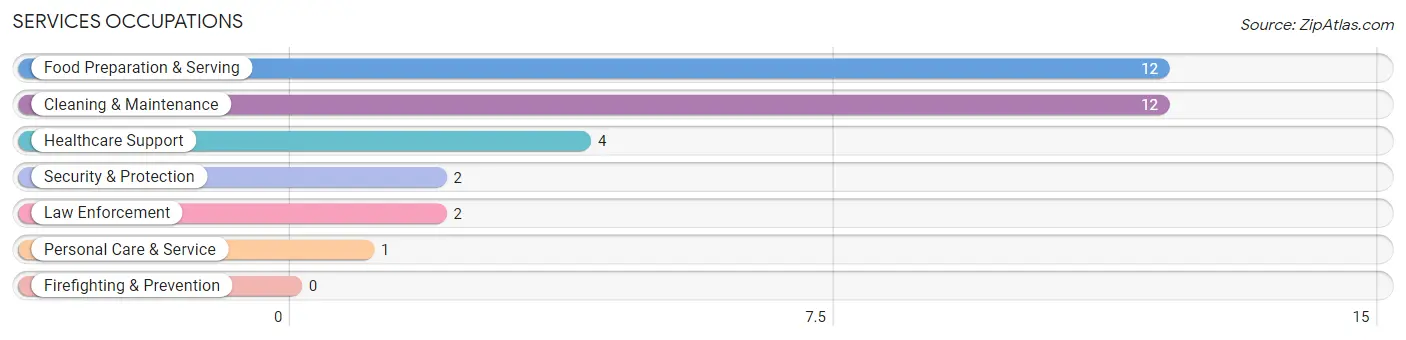
Services Occupations
The most common Services occupations in Gilbertsville are Food Preparation & Serving (12 | 7.1%), Cleaning & Maintenance (12 | 7.1%), Healthcare Support (4 | 2.4%), Security & Protection (2 | 1.2%), and Law Enforcement (2 | 1.2%).
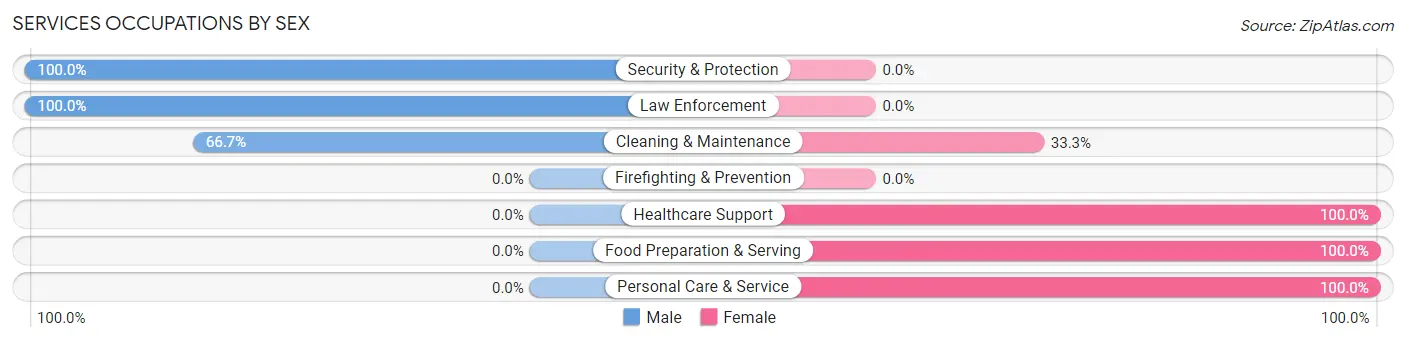
Services Occupations by Sex
Within the Services occupations in Gilbertsville, the most male-oriented occupations are Security & Protection (100.0%), Law Enforcement (100.0%), and Cleaning & Maintenance (66.7%), while the most female-oriented occupations are Healthcare Support (100.0%), Food Preparation & Serving (100.0%), and Personal Care & Service (100.0%).
| Occupation | Male | Female |
| Healthcare Support | 0 (0.0%) | 4 (100.0%) |
| Security & Protection | 2 (100.0%) | 0 (0.0%) |
| Firefighting & Prevention | 0 (0.0%) | 0 (0.0%) |
| Law Enforcement | 2 (100.0%) | 0 (0.0%) |
| Food Preparation & Serving | 0 (0.0%) | 12 (100.0%) |
| Cleaning & Maintenance | 8 (66.7%) | 4 (33.3%) |
| Personal Care & Service | 0 (0.0%) | 1 (100.0%) |
| Total (Category) | 10 (32.3%) | 21 (67.7%) |
| Total (Overall) | 69 (40.8%) | 100 (59.2%) |
Sales and Office Occupations
The most common Sales and Office occupations in Gilbertsville are Sales & Related (15 | 8.9%), and Office & Administration (8 | 4.7%).
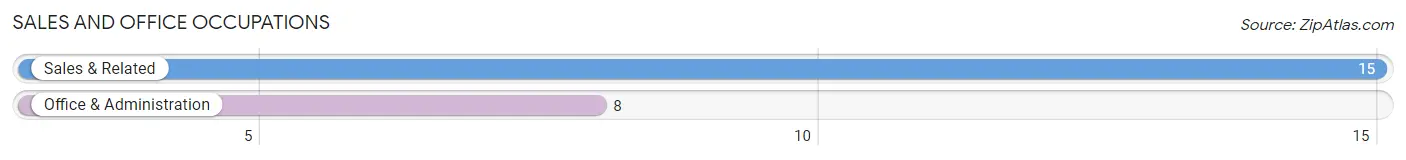
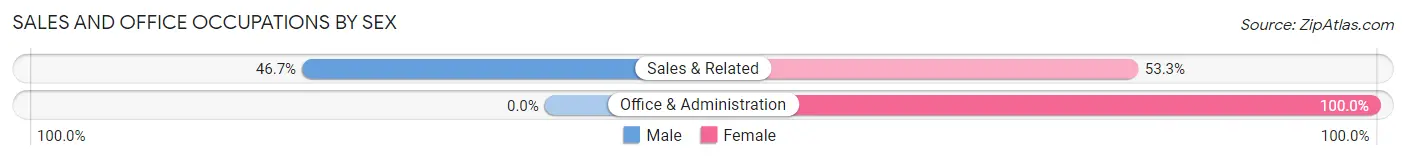
Sales and Office Occupations by Sex
| Occupation | Male | Female |
| Sales & Related | 7 (46.7%) | 8 (53.3%) |
| Office & Administration | 0 (0.0%) | 8 (100.0%) |
| Total (Category) | 7 (30.4%) | 16 (69.6%) |
| Total (Overall) | 69 (40.8%) | 100 (59.2%) |
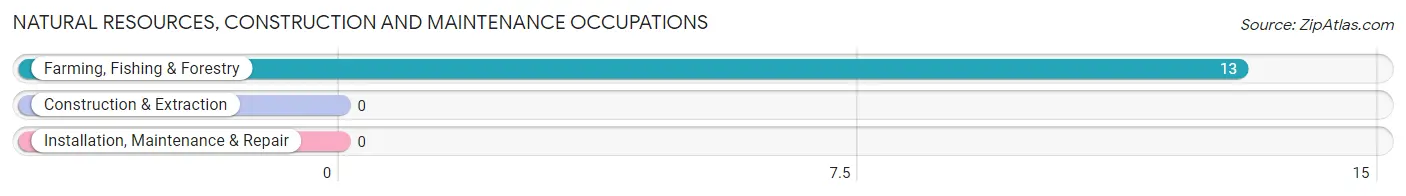
Natural Resources, Construction and Maintenance Occupations
The most common Natural Resources, Construction and Maintenance occupations in Gilbertsville are , and Farming, Fishing & Forestry (13 | 7.7%).
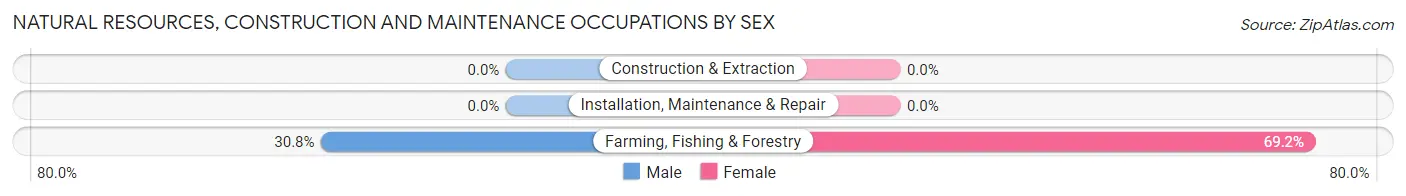
Natural Resources, Construction and Maintenance Occupations by Sex
| Occupation | Male | Female |
| Farming, Fishing & Forestry | 4 (30.8%) | 9 (69.2%) |
| Construction & Extraction | 0 (0.0%) | 0 (0.0%) |
| Installation, Maintenance & Repair | 0 (0.0%) | 0 (0.0%) |
| Total (Category) | 4 (30.8%) | 9 (69.2%) |
| Total (Overall) | 69 (40.8%) | 100 (59.2%) |
Production, Transportation and Moving Occupations
The most common Production, Transportation and Moving occupations in Gilbertsville are Production (8 | 4.7%), and Material Moving (5 | 3.0%).
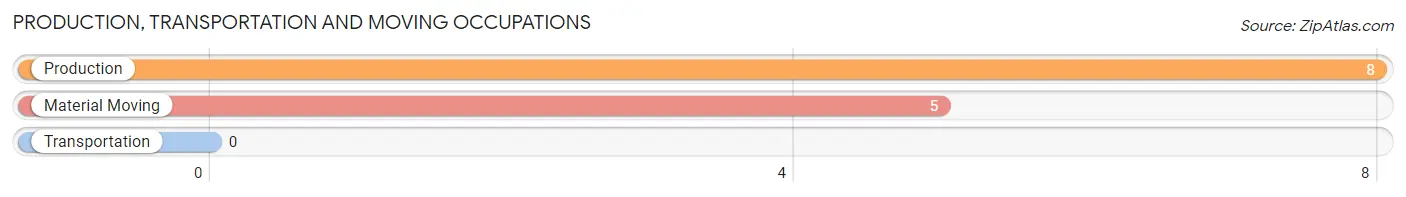
Production, Transportation and Moving Occupations by Sex
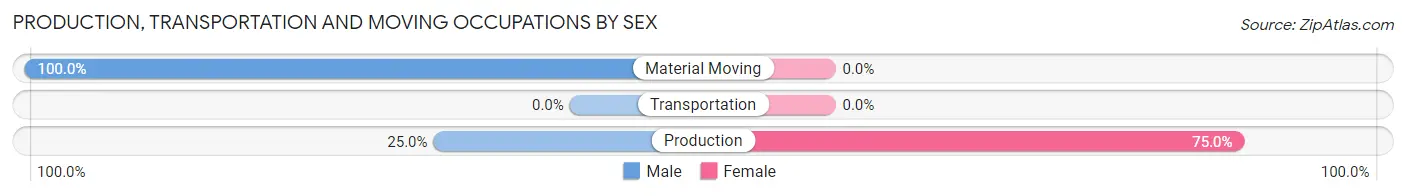
| Occupation | Male | Female |
| Production | 2 (25.0%) | 6 (75.0%) |
| Transportation | 0 (0.0%) | 0 (0.0%) |
| Material Moving | 5 (100.0%) | 0 (0.0%) |
| Total (Category) | 7 (53.8%) | 6 (46.2%) |
| Total (Overall) | 69 (40.8%) | 100 (59.2%) |
Employment Industries by Sex in Gilbertsville
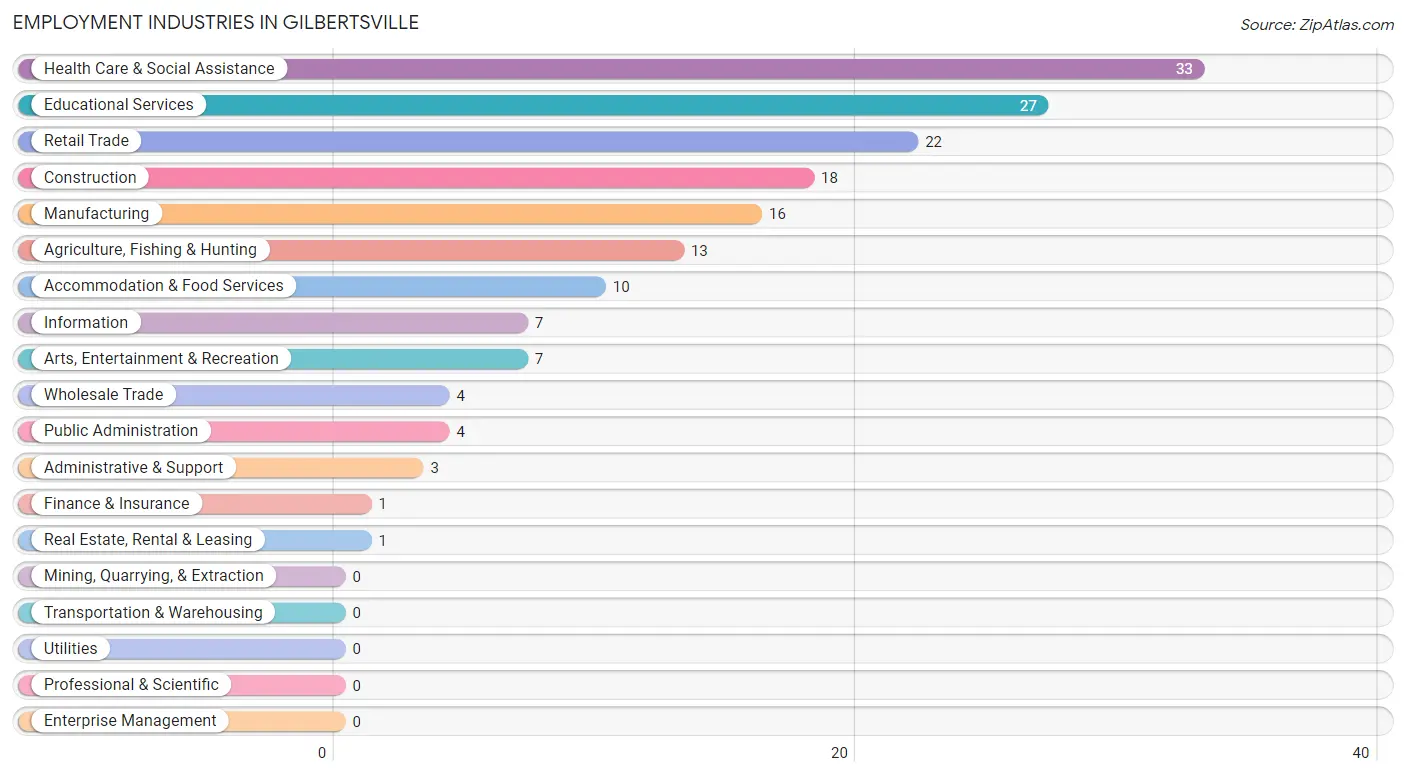
Employment Industries in Gilbertsville
The major employment industries in Gilbertsville include Health Care & Social Assistance (33 | 19.5%), Educational Services (27 | 16.0%), Retail Trade (22 | 13.0%), Construction (18 | 10.6%), and Manufacturing (16 | 9.5%).
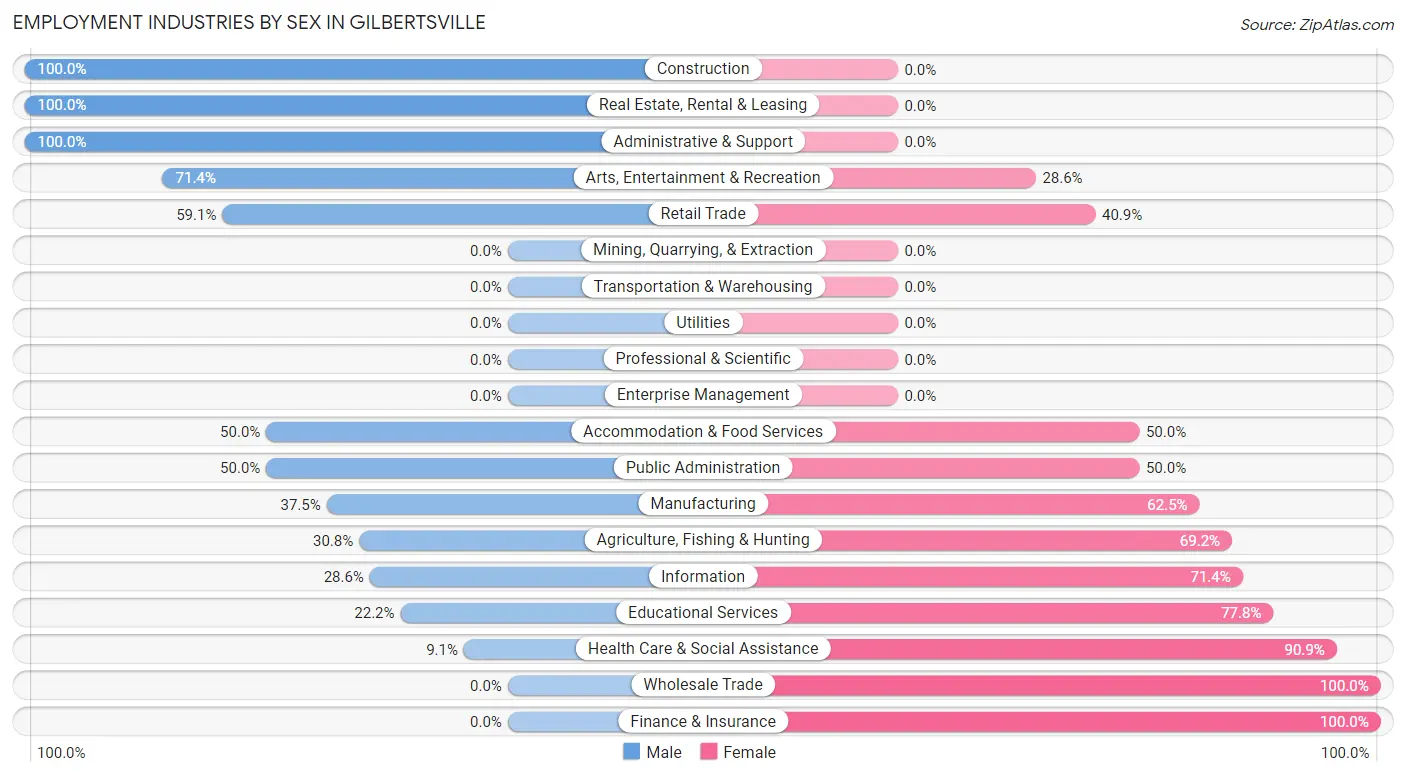
Employment Industries by Sex in Gilbertsville
The Gilbertsville industries that see more men than women are Construction (100.0%), Real Estate, Rental & Leasing (100.0%), and Administrative & Support (100.0%), whereas the industries that tend to have a higher number of women are Wholesale Trade (100.0%), Finance & Insurance (100.0%), and Health Care & Social Assistance (90.9%).
| Industry | Male | Female |
| Agriculture, Fishing & Hunting | 4 (30.8%) | 9 (69.2%) |
| Mining, Quarrying, & Extraction | 0 (0.0%) | 0 (0.0%) |
| Construction | 18 (100.0%) | 0 (0.0%) |
| Manufacturing | 6 (37.5%) | 10 (62.5%) |
| Wholesale Trade | 0 (0.0%) | 4 (100.0%) |
| Retail Trade | 13 (59.1%) | 9 (40.9%) |
| Transportation & Warehousing | 0 (0.0%) | 0 (0.0%) |
| Utilities | 0 (0.0%) | 0 (0.0%) |
| Information | 2 (28.6%) | 5 (71.4%) |
| Finance & Insurance | 0 (0.0%) | 1 (100.0%) |
| Real Estate, Rental & Leasing | 1 (100.0%) | 0 (0.0%) |
| Professional & Scientific | 0 (0.0%) | 0 (0.0%) |
| Enterprise Management | 0 (0.0%) | 0 (0.0%) |
| Administrative & Support | 3 (100.0%) | 0 (0.0%) |
| Educational Services | 6 (22.2%) | 21 (77.8%) |
| Health Care & Social Assistance | 3 (9.1%) | 30 (90.9%) |
| Arts, Entertainment & Recreation | 5 (71.4%) | 2 (28.6%) |
| Accommodation & Food Services | 5 (50.0%) | 5 (50.0%) |
| Public Administration | 2 (50.0%) | 2 (50.0%) |
| Total | 69 (40.8%) | 100 (59.2%) |
Education in Gilbertsville
School Enrollment in Gilbertsville
The most common levels of schooling among the 63 students in Gilbertsville are middle school (26 | 41.3%), college / undergraduate (19 | 30.2%), and elementary school (15 | 23.8%).
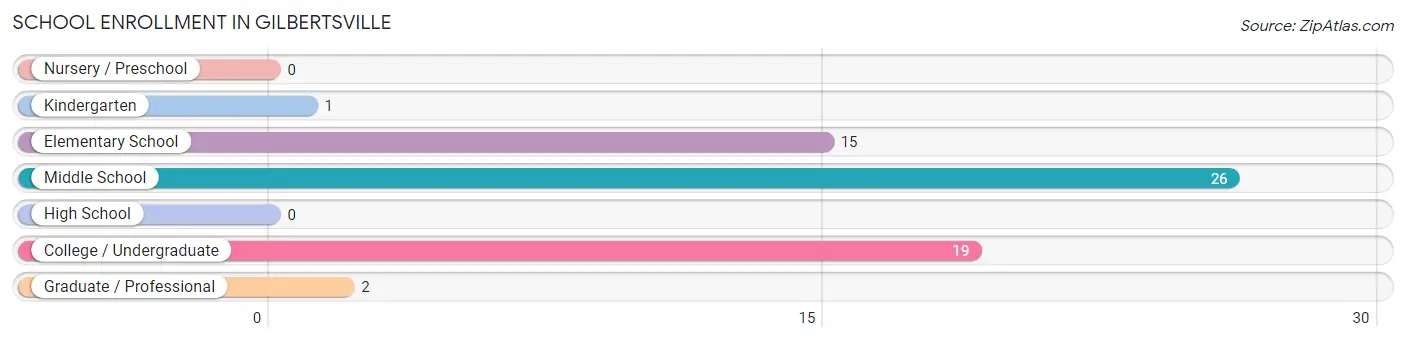
| School Level | # Students | % Students |
| Nursery / Preschool | 0 | 0.0% |
| Kindergarten | 1 | 1.6% |
| Elementary School | 15 | 23.8% |
| Middle School | 26 | 41.3% |
| High School | 0 | 0.0% |
| College / Undergraduate | 19 | 30.2% |
| Graduate / Professional | 2 | 3.2% |
| Total | 63 | 100.0% |
School Enrollment by Age by Funding Source in Gilbertsville
Out of a total of 63 students who are enrolled in schools in Gilbertsville, 17 (27.0%) attend a private institution, while the remaining 46 (73.0%) are enrolled in public schools. The age group of 35 years and over has the highest likelihood of being enrolled in private schools, with 7 (100.0% in the age bracket) enrolled. Conversely, the age group of 18 to 19 year olds has the lowest likelihood of being enrolled in a private school, with 8 (100.0% in the age bracket) attending a public institution.
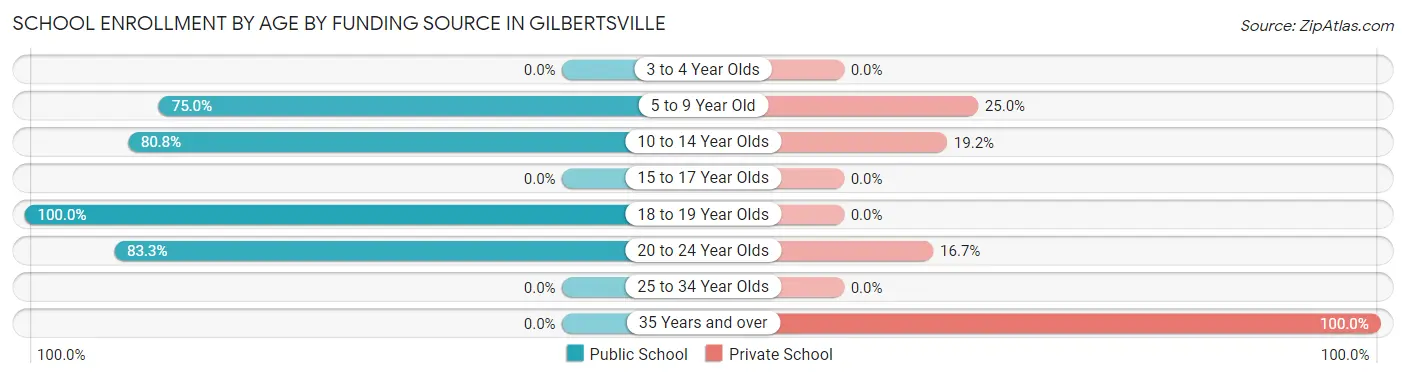
| Age Bracket | Public School | Private School |
| 3 to 4 Year Olds | 0 (0.0%) | 0 (0.0%) |
| 5 to 9 Year Old | 12 (75.0%) | 4 (25.0%) |
| 10 to 14 Year Olds | 21 (80.8%) | 5 (19.2%) |
| 15 to 17 Year Olds | 0 (0.0%) | 0 (0.0%) |
| 18 to 19 Year Olds | 8 (100.0%) | 0 (0.0%) |
| 20 to 24 Year Olds | 5 (83.3%) | 1 (16.7%) |
| 25 to 34 Year Olds | 0 (0.0%) | 0 (0.0%) |
| 35 Years and over | 0 (0.0%) | 7 (100.0%) |
| Total | 46 (73.0%) | 17 (27.0%) |
Educational Attainment by Field of Study in Gilbertsville
Education (19 | 19.4%), bio, nature & agricultural (13 | 13.3%), business (12 | 12.2%), social sciences (11 | 11.2%), and arts & humanities (10 | 10.2%) are the most common fields of study among 98 individuals in Gilbertsville who have obtained a bachelor's degree or higher.
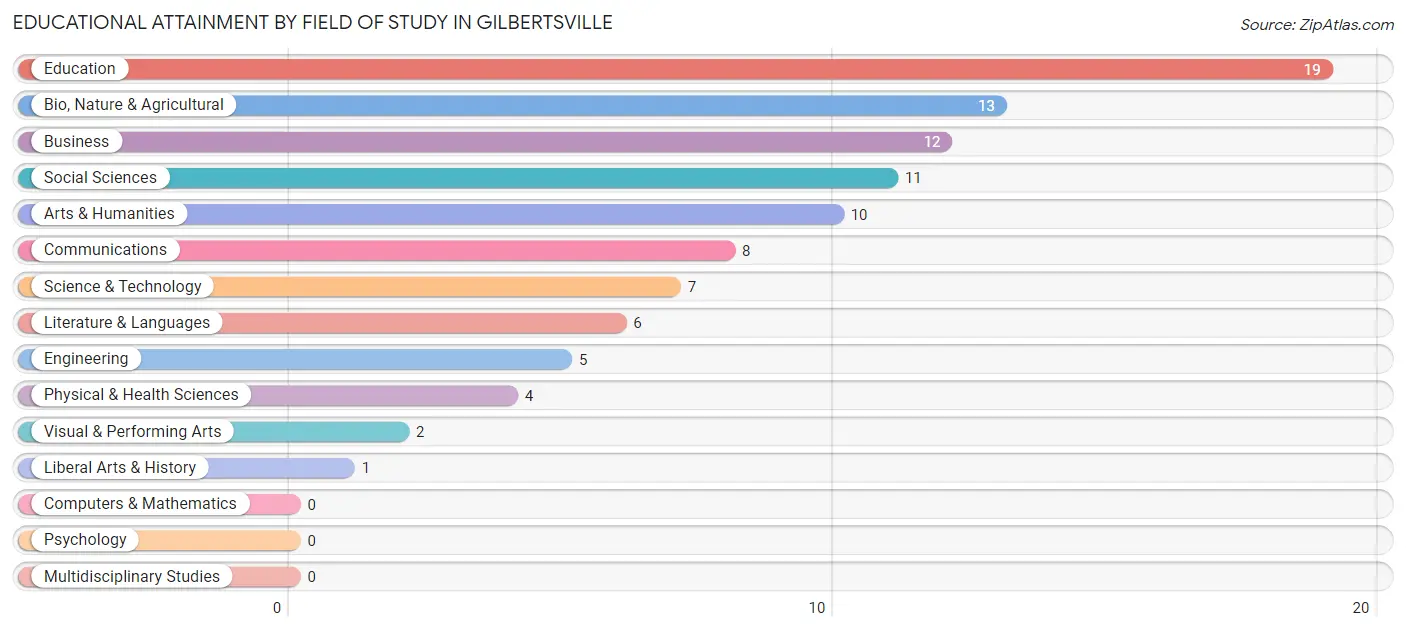
| Field of Study | # Graduates | % Graduates |
| Computers & Mathematics | 0 | 0.0% |
| Bio, Nature & Agricultural | 13 | 13.3% |
| Physical & Health Sciences | 4 | 4.1% |
| Psychology | 0 | 0.0% |
| Social Sciences | 11 | 11.2% |
| Engineering | 5 | 5.1% |
| Multidisciplinary Studies | 0 | 0.0% |
| Science & Technology | 7 | 7.1% |
| Business | 12 | 12.2% |
| Education | 19 | 19.4% |
| Literature & Languages | 6 | 6.1% |
| Liberal Arts & History | 1 | 1.0% |
| Visual & Performing Arts | 2 | 2.0% |
| Communications | 8 | 8.2% |
| Arts & Humanities | 10 | 10.2% |
| Total | 98 | 100.0% |
Transportation & Commute in Gilbertsville
Vehicle Availability by Sex in Gilbertsville
The most prevalent vehicle ownership categories in Gilbertsville are males with 2 vehicles (35, accounting for 54.7%) and females with 2 vehicles (39, making up 36.5%).
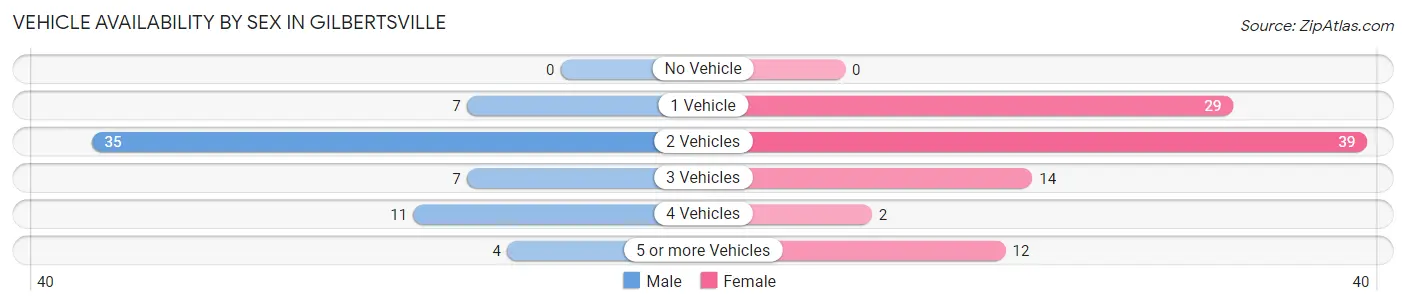
| Vehicles Available | Male | Female |
| No Vehicle | 0 (0.0%) | 0 (0.0%) |
| 1 Vehicle | 7 (10.9%) | 29 (30.2%) |
| 2 Vehicles | 35 (54.7%) | 39 (40.6%) |
| 3 Vehicles | 7 (10.9%) | 14 (14.6%) |
| 4 Vehicles | 11 (17.2%) | 2 (2.1%) |
| 5 or more Vehicles | 4 (6.2%) | 12 (12.5%) |
| Total | 64 (100.0%) | 96 (100.0%) |
Commute Time in Gilbertsville
The most frequently occuring commute durations in Gilbertsville are 20 to 24 minutes (41 commuters, 26.6%), 25 to 29 minutes (19 commuters, 12.3%), and 15 to 19 minutes (16 commuters, 10.4%).
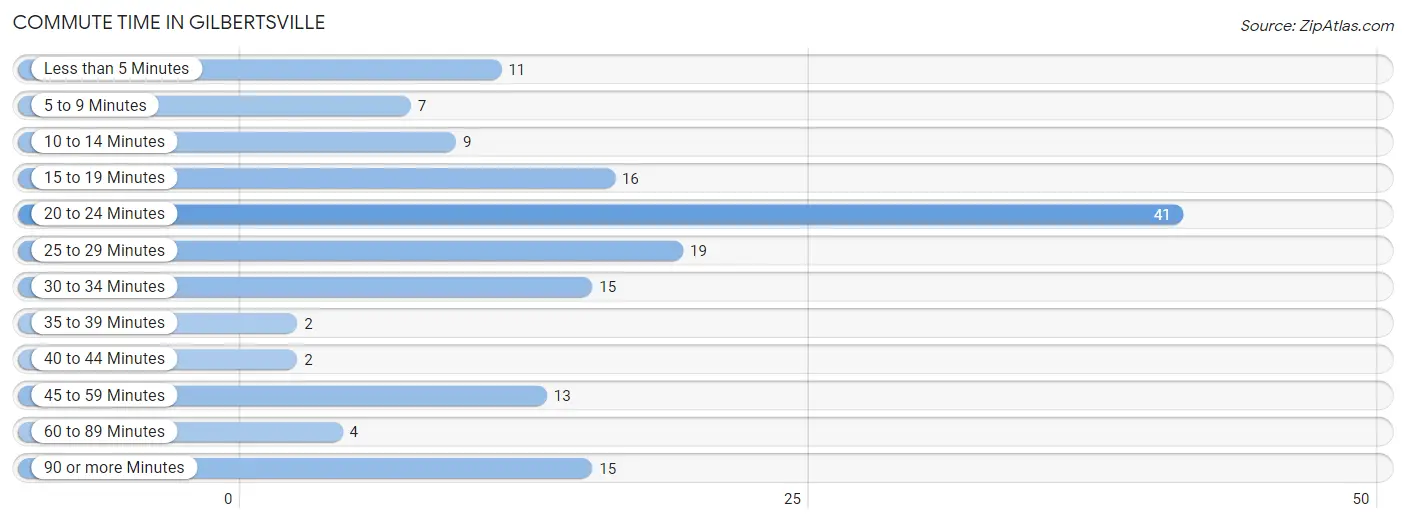
| Commute Time | # Commuters | % Commuters |
| Less than 5 Minutes | 11 | 7.1% |
| 5 to 9 Minutes | 7 | 4.5% |
| 10 to 14 Minutes | 9 | 5.8% |
| 15 to 19 Minutes | 16 | 10.4% |
| 20 to 24 Minutes | 41 | 26.6% |
| 25 to 29 Minutes | 19 | 12.3% |
| 30 to 34 Minutes | 15 | 9.7% |
| 35 to 39 Minutes | 2 | 1.3% |
| 40 to 44 Minutes | 2 | 1.3% |
| 45 to 59 Minutes | 13 | 8.4% |
| 60 to 89 Minutes | 4 | 2.6% |
| 90 or more Minutes | 15 | 9.7% |
Commute Time by Sex in Gilbertsville
The most common commute times in Gilbertsville are 90 or more minutes (15 commuters, 23.8%) for males and 20 to 24 minutes (39 commuters, 42.9%) for females.
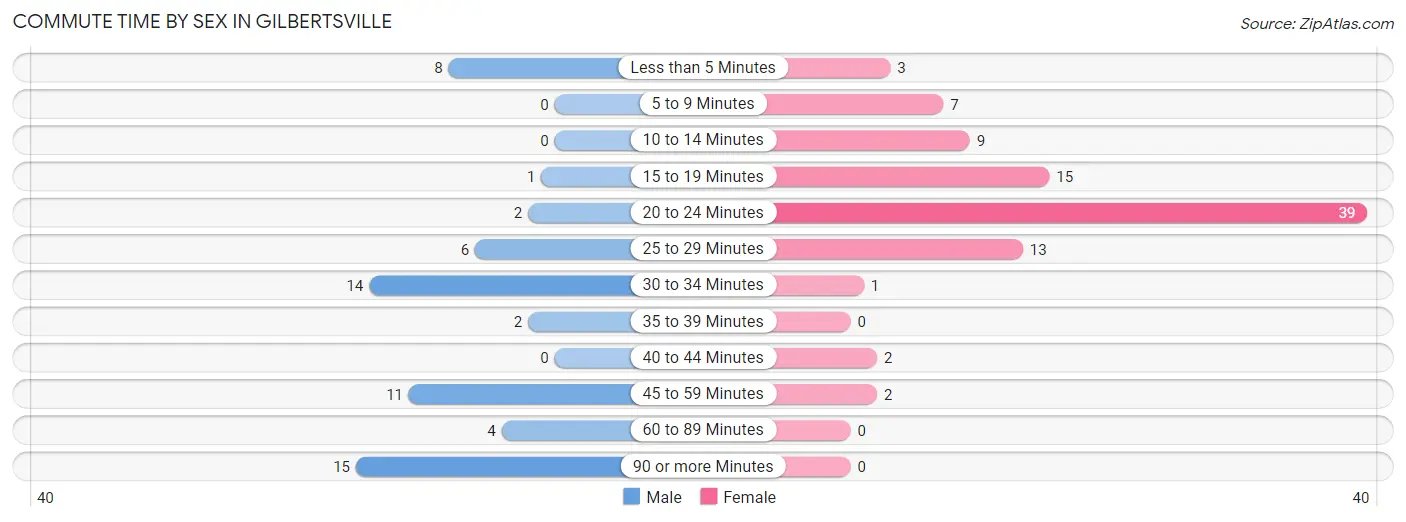
| Commute Time | Male | Female |
| Less than 5 Minutes | 8 (12.7%) | 3 (3.3%) |
| 5 to 9 Minutes | 0 (0.0%) | 7 (7.7%) |
| 10 to 14 Minutes | 0 (0.0%) | 9 (9.9%) |
| 15 to 19 Minutes | 1 (1.6%) | 15 (16.5%) |
| 20 to 24 Minutes | 2 (3.2%) | 39 (42.9%) |
| 25 to 29 Minutes | 6 (9.5%) | 13 (14.3%) |
| 30 to 34 Minutes | 14 (22.2%) | 1 (1.1%) |
| 35 to 39 Minutes | 2 (3.2%) | 0 (0.0%) |
| 40 to 44 Minutes | 0 (0.0%) | 2 (2.2%) |
| 45 to 59 Minutes | 11 (17.5%) | 2 (2.2%) |
| 60 to 89 Minutes | 4 (6.4%) | 0 (0.0%) |
| 90 or more Minutes | 15 (23.8%) | 0 (0.0%) |
Time of Departure to Work by Sex in Gilbertsville
The most frequent times of departure to work in Gilbertsville are 5:30 AM to 5:59 AM (23, 36.5%) for males and 8:00 AM to 8:29 AM (18, 19.8%) for females.
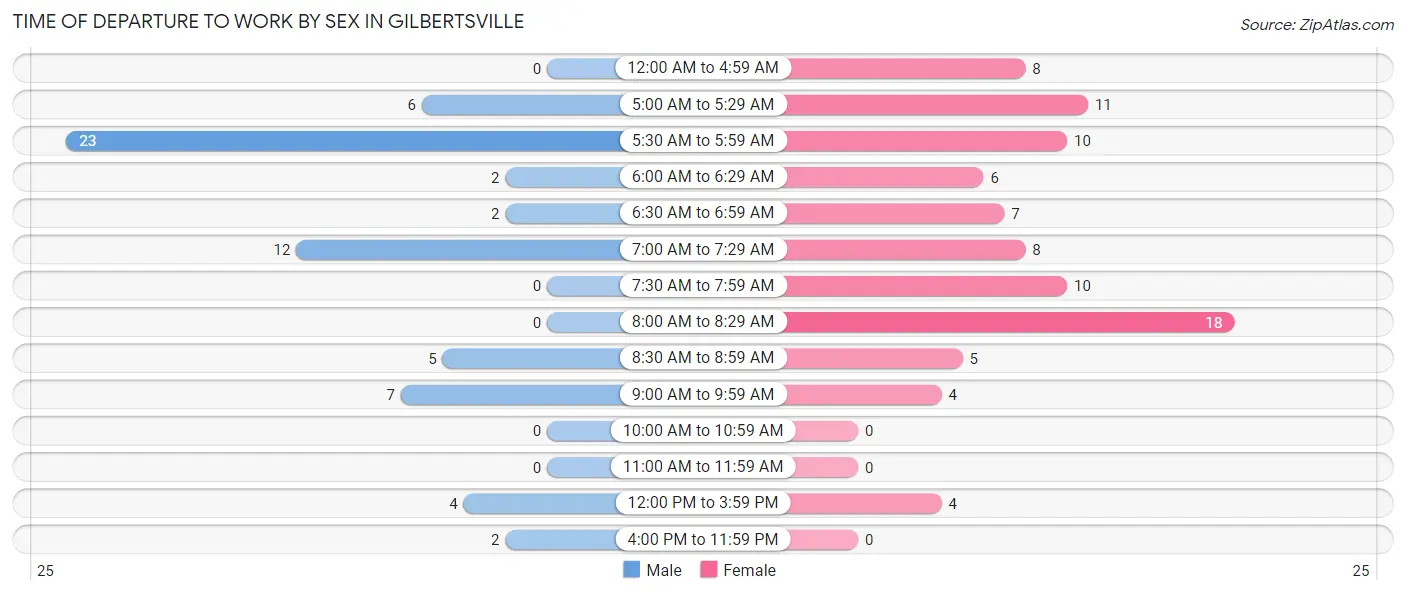
| Time of Departure | Male | Female |
| 12:00 AM to 4:59 AM | 0 (0.0%) | 8 (8.8%) |
| 5:00 AM to 5:29 AM | 6 (9.5%) | 11 (12.1%) |
| 5:30 AM to 5:59 AM | 23 (36.5%) | 10 (11.0%) |
| 6:00 AM to 6:29 AM | 2 (3.2%) | 6 (6.6%) |
| 6:30 AM to 6:59 AM | 2 (3.2%) | 7 (7.7%) |
| 7:00 AM to 7:29 AM | 12 (19.1%) | 8 (8.8%) |
| 7:30 AM to 7:59 AM | 0 (0.0%) | 10 (11.0%) |
| 8:00 AM to 8:29 AM | 0 (0.0%) | 18 (19.8%) |
| 8:30 AM to 8:59 AM | 5 (7.9%) | 5 (5.5%) |
| 9:00 AM to 9:59 AM | 7 (11.1%) | 4 (4.4%) |
| 10:00 AM to 10:59 AM | 0 (0.0%) | 0 (0.0%) |
| 11:00 AM to 11:59 AM | 0 (0.0%) | 0 (0.0%) |
| 12:00 PM to 3:59 PM | 4 (6.4%) | 4 (4.4%) |
| 4:00 PM to 11:59 PM | 2 (3.2%) | 0 (0.0%) |
| Total | 63 (100.0%) | 91 (100.0%) |
Housing Occupancy in Gilbertsville
Occupancy by Ownership in Gilbertsville
Of the total 143 dwellings in Gilbertsville, owner-occupied units account for 104 (72.7%), while renter-occupied units make up 39 (27.3%).
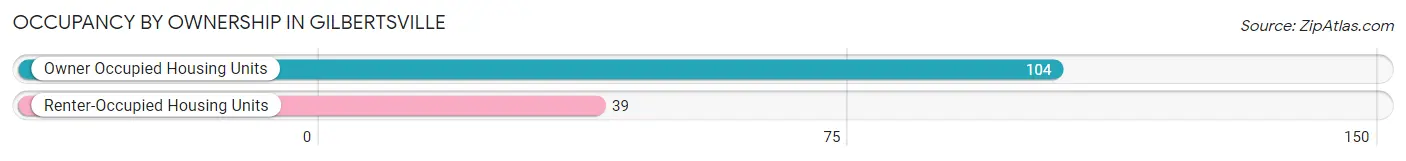
| Occupancy | # Housing Units | % Housing Units |
| Owner Occupied Housing Units | 104 | 72.7% |
| Renter-Occupied Housing Units | 39 | 27.3% |
| Total Occupied Housing Units | 143 | 100.0% |
Occupancy by Household Size in Gilbertsville
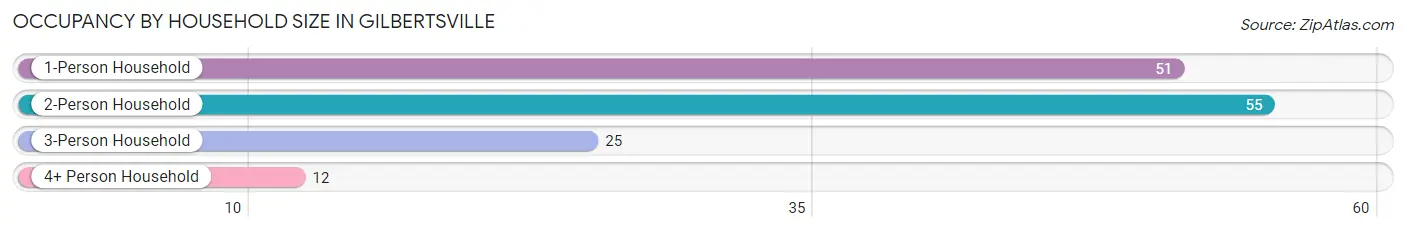
| Household Size | # Housing Units | % Housing Units |
| 1-Person Household | 51 | 35.7% |
| 2-Person Household | 55 | 38.5% |
| 3-Person Household | 25 | 17.5% |
| 4+ Person Household | 12 | 8.4% |
| Total Housing Units | 143 | 100.0% |
Occupancy by Ownership by Household Size in Gilbertsville
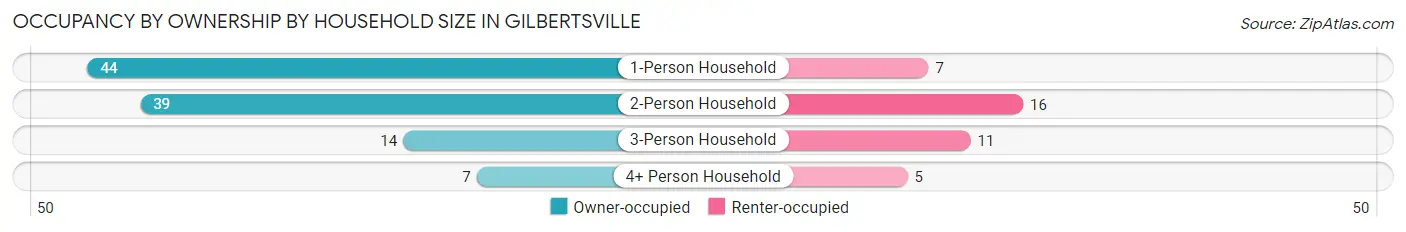
| Household Size | Owner-occupied | Renter-occupied |
| 1-Person Household | 44 (86.3%) | 7 (13.7%) |
| 2-Person Household | 39 (70.9%) | 16 (29.1%) |
| 3-Person Household | 14 (56.0%) | 11 (44.0%) |
| 4+ Person Household | 7 (58.3%) | 5 (41.7%) |
| Total Housing Units | 104 (72.7%) | 39 (27.3%) |
Occupancy by Educational Attainment in Gilbertsville
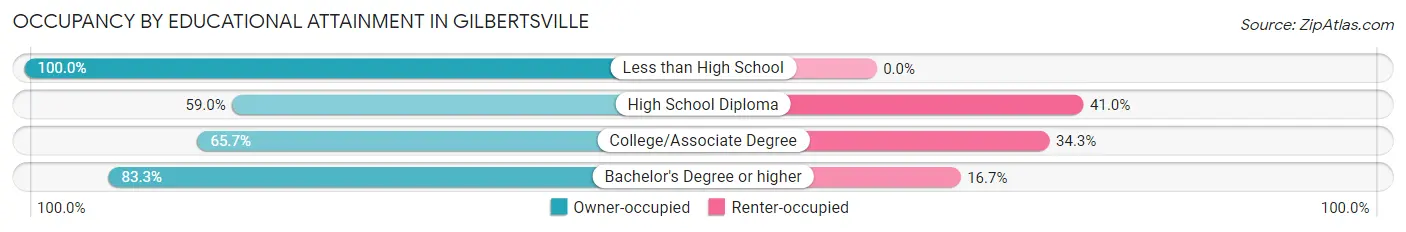
| Household Size | Owner-occupied | Renter-occupied |
| Less than High School | 3 (100.0%) | 0 (0.0%) |
| High School Diploma | 23 (59.0%) | 16 (41.0%) |
| College/Associate Degree | 23 (65.7%) | 12 (34.3%) |
| Bachelor's Degree or higher | 55 (83.3%) | 11 (16.7%) |
Occupancy by Age of Householder in Gilbertsville
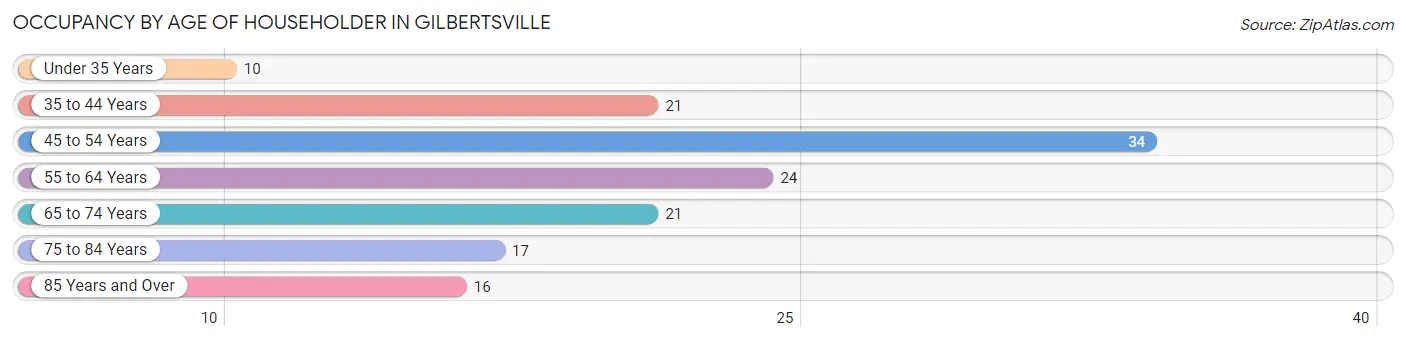
| Age Bracket | # Households | % Households |
| Under 35 Years | 10 | 7.0% |
| 35 to 44 Years | 21 | 14.7% |
| 45 to 54 Years | 34 | 23.8% |
| 55 to 64 Years | 24 | 16.8% |
| 65 to 74 Years | 21 | 14.7% |
| 75 to 84 Years | 17 | 11.9% |
| 85 Years and Over | 16 | 11.2% |
| Total | 143 | 100.0% |
Housing Finances in Gilbertsville
Median Income by Occupancy in Gilbertsville
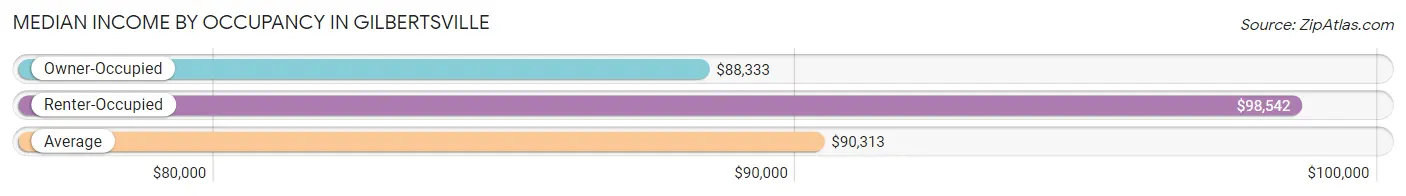
| Occupancy Type | # Households | Median Income |
| Owner-Occupied | 104 (72.7%) | $88,333 |
| Renter-Occupied | 39 (27.3%) | $98,542 |
| Average | 143 (100.0%) | $90,313 |
Occupancy by Householder Income Bracket in Gilbertsville
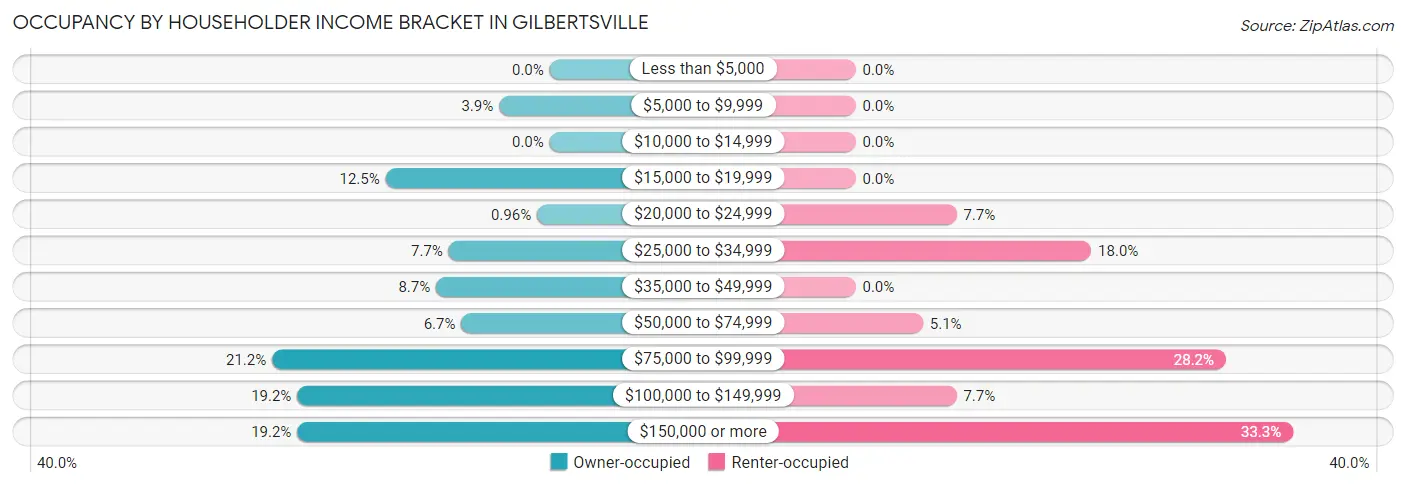
| Income Bracket | Owner-occupied | Renter-occupied |
| Less than $5,000 | 0 (0.0%) | 0 (0.0%) |
| $5,000 to $9,999 | 4 (3.8%) | 0 (0.0%) |
| $10,000 to $14,999 | 0 (0.0%) | 0 (0.0%) |
| $15,000 to $19,999 | 13 (12.5%) | 0 (0.0%) |
| $20,000 to $24,999 | 1 (1.0%) | 3 (7.7%) |
| $25,000 to $34,999 | 8 (7.7%) | 7 (17.9%) |
| $35,000 to $49,999 | 9 (8.6%) | 0 (0.0%) |
| $50,000 to $74,999 | 7 (6.7%) | 2 (5.1%) |
| $75,000 to $99,999 | 22 (21.1%) | 11 (28.2%) |
| $100,000 to $149,999 | 20 (19.2%) | 3 (7.7%) |
| $150,000 or more | 20 (19.2%) | 13 (33.3%) |
| Total | 104 (100.0%) | 39 (100.0%) |
Monthly Housing Cost Tiers in Gilbertsville
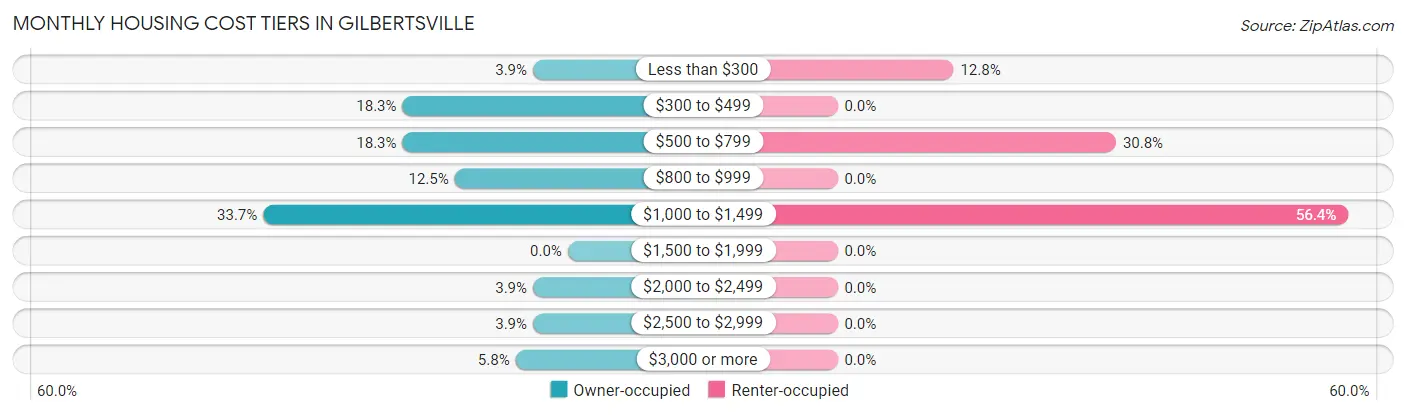
| Monthly Cost | Owner-occupied | Renter-occupied |
| Less than $300 | 4 (3.8%) | 5 (12.8%) |
| $300 to $499 | 19 (18.3%) | 0 (0.0%) |
| $500 to $799 | 19 (18.3%) | 12 (30.8%) |
| $800 to $999 | 13 (12.5%) | 0 (0.0%) |
| $1,000 to $1,499 | 35 (33.7%) | 22 (56.4%) |
| $1,500 to $1,999 | 0 (0.0%) | 0 (0.0%) |
| $2,000 to $2,499 | 4 (3.8%) | 0 (0.0%) |
| $2,500 to $2,999 | 4 (3.8%) | 0 (0.0%) |
| $3,000 or more | 6 (5.8%) | 0 (0.0%) |
| Total | 104 (100.0%) | 39 (100.0%) |
Physical Housing Characteristics in Gilbertsville
Housing Structures in Gilbertsville
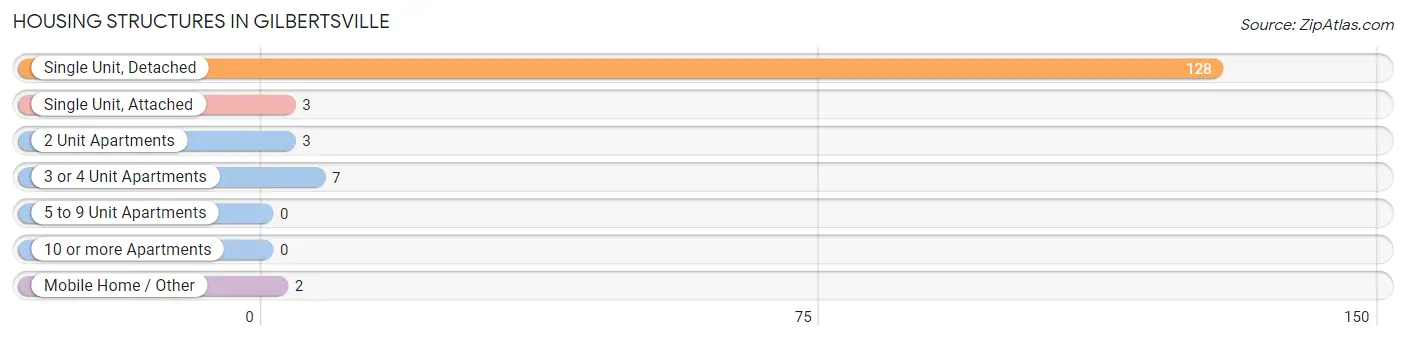
| Structure Type | # Housing Units | % Housing Units |
| Single Unit, Detached | 128 | 89.5% |
| Single Unit, Attached | 3 | 2.1% |
| 2 Unit Apartments | 3 | 2.1% |
| 3 or 4 Unit Apartments | 7 | 4.9% |
| 5 to 9 Unit Apartments | 0 | 0.0% |
| 10 or more Apartments | 0 | 0.0% |
| Mobile Home / Other | 2 | 1.4% |
| Total | 143 | 100.0% |
Housing Structures by Occupancy in Gilbertsville
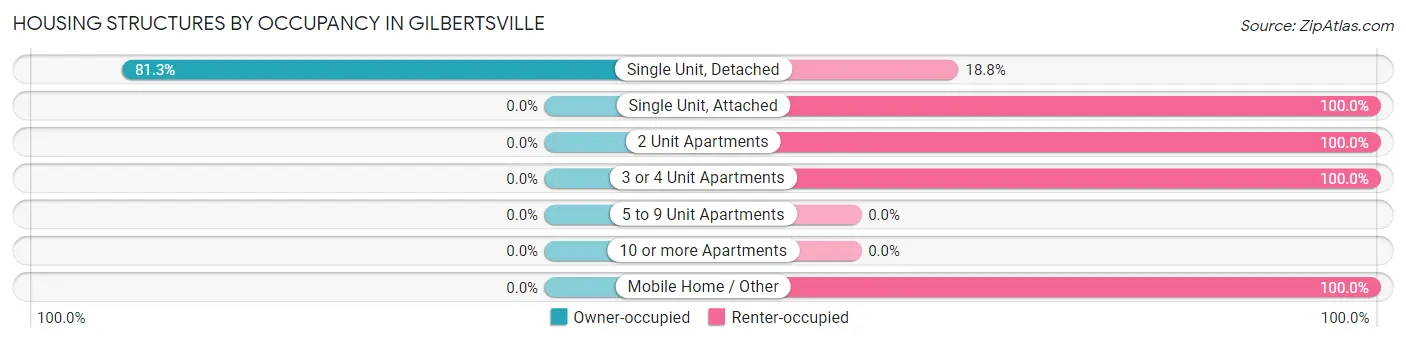
| Structure Type | Owner-occupied | Renter-occupied |
| Single Unit, Detached | 104 (81.2%) | 24 (18.8%) |
| Single Unit, Attached | 0 (0.0%) | 3 (100.0%) |
| 2 Unit Apartments | 0 (0.0%) | 3 (100.0%) |
| 3 or 4 Unit Apartments | 0 (0.0%) | 7 (100.0%) |
| 5 to 9 Unit Apartments | 0 (0.0%) | 0 (0.0%) |
| 10 or more Apartments | 0 (0.0%) | 0 (0.0%) |
| Mobile Home / Other | 0 (0.0%) | 2 (100.0%) |
| Total | 104 (72.7%) | 39 (27.3%) |
Housing Structures by Number of Rooms in Gilbertsville
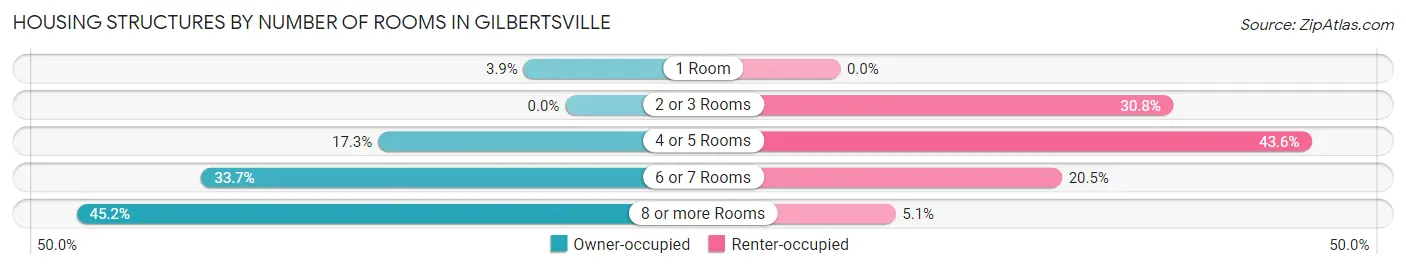
| Number of Rooms | Owner-occupied | Renter-occupied |
| 1 Room | 4 (3.8%) | 0 (0.0%) |
| 2 or 3 Rooms | 0 (0.0%) | 12 (30.8%) |
| 4 or 5 Rooms | 18 (17.3%) | 17 (43.6%) |
| 6 or 7 Rooms | 35 (33.7%) | 8 (20.5%) |
| 8 or more Rooms | 47 (45.2%) | 2 (5.1%) |
| Total | 104 (100.0%) | 39 (100.0%) |
Housing Structure by Heating Type in Gilbertsville
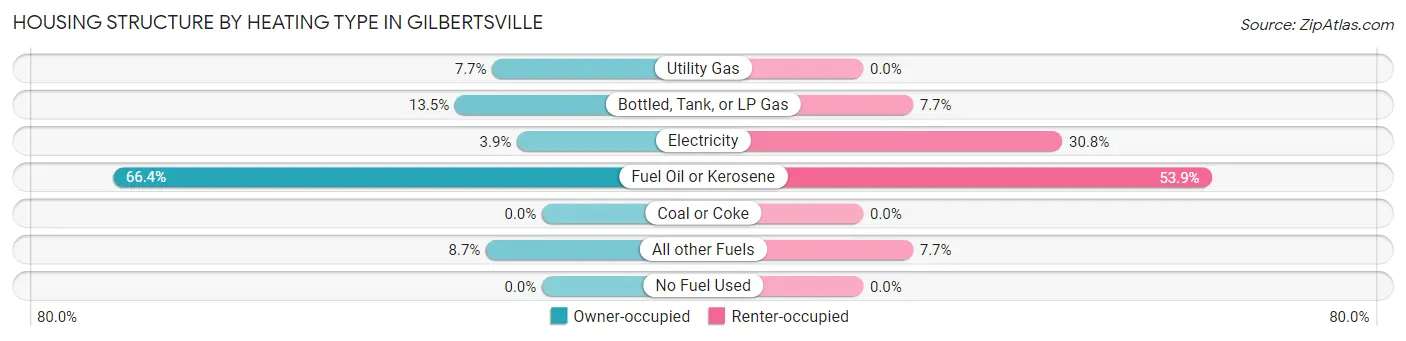
| Heating Type | Owner-occupied | Renter-occupied |
| Utility Gas | 8 (7.7%) | 0 (0.0%) |
| Bottled, Tank, or LP Gas | 14 (13.5%) | 3 (7.7%) |
| Electricity | 4 (3.8%) | 12 (30.8%) |
| Fuel Oil or Kerosene | 69 (66.3%) | 21 (53.8%) |
| Coal or Coke | 0 (0.0%) | 0 (0.0%) |
| All other Fuels | 9 (8.6%) | 3 (7.7%) |
| No Fuel Used | 0 (0.0%) | 0 (0.0%) |
| Total | 104 (100.0%) | 39 (100.0%) |
Household Vehicle Usage in Gilbertsville
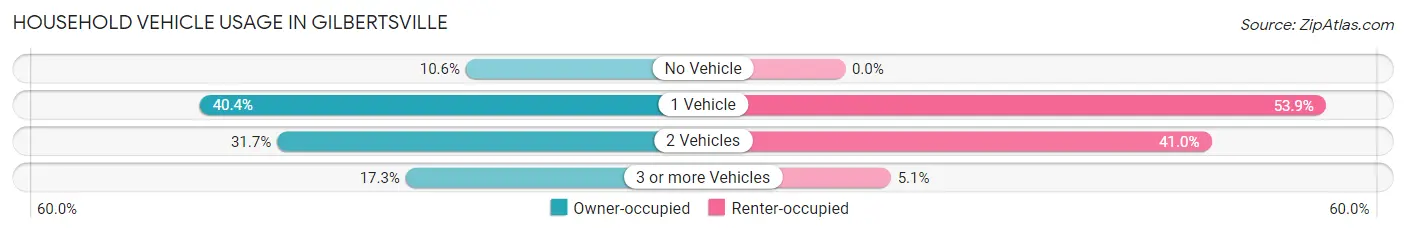
| Vehicles per Household | Owner-occupied | Renter-occupied |
| No Vehicle | 11 (10.6%) | 0 (0.0%) |
| 1 Vehicle | 42 (40.4%) | 21 (53.8%) |
| 2 Vehicles | 33 (31.7%) | 16 (41.0%) |
| 3 or more Vehicles | 18 (17.3%) | 2 (5.1%) |
| Total | 104 (100.0%) | 39 (100.0%) |
Real Estate & Mortgages in Gilbertsville
Real Estate and Mortgage Overview in Gilbertsville
| Characteristic | Without Mortgage | With Mortgage |
| Housing Units | 45 | 59 |
| Median Property Value | $136,300 | $148,900 |
| Median Household Income | - | - |
| Monthly Housing Costs | $496 | $5 |
| Real Estate Taxes | $2,136 | $0 |
Property Value by Mortgage Status in Gilbertsville
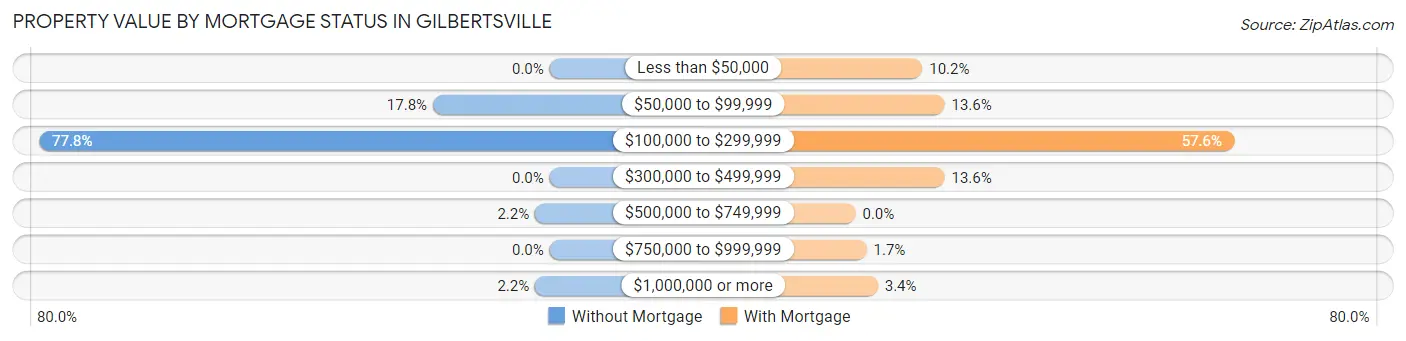
| Property Value | Without Mortgage | With Mortgage |
| Less than $50,000 | 0 (0.0%) | 6 (10.2%) |
| $50,000 to $99,999 | 8 (17.8%) | 8 (13.6%) |
| $100,000 to $299,999 | 35 (77.8%) | 34 (57.6%) |
| $300,000 to $499,999 | 0 (0.0%) | 8 (13.6%) |
| $500,000 to $749,999 | 1 (2.2%) | 0 (0.0%) |
| $750,000 to $999,999 | 0 (0.0%) | 1 (1.7%) |
| $1,000,000 or more | 1 (2.2%) | 2 (3.4%) |
| Total | 45 (100.0%) | 59 (100.0%) |
Household Income by Mortgage Status in Gilbertsville
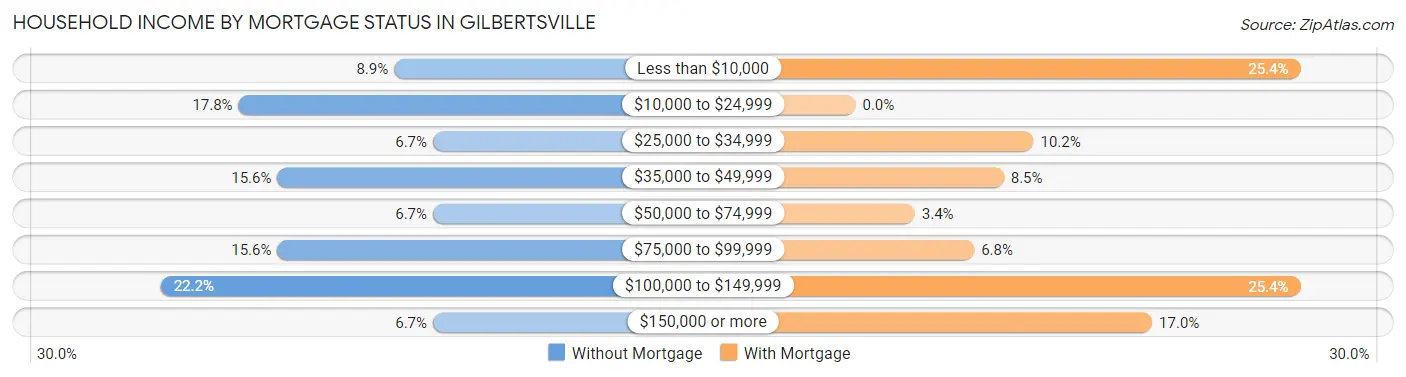
| Household Income | Without Mortgage | With Mortgage |
| Less than $10,000 | 4 (8.9%) | 15 (25.4%) |
| $10,000 to $24,999 | 8 (17.8%) | 0 (0.0%) |
| $25,000 to $34,999 | 3 (6.7%) | 6 (10.2%) |
| $35,000 to $49,999 | 7 (15.6%) | 5 (8.5%) |
| $50,000 to $74,999 | 3 (6.7%) | 2 (3.4%) |
| $75,000 to $99,999 | 7 (15.6%) | 4 (6.8%) |
| $100,000 to $149,999 | 10 (22.2%) | 15 (25.4%) |
| $150,000 or more | 3 (6.7%) | 10 (17.0%) |
| Total | 45 (100.0%) | 59 (100.0%) |
Property Value to Household Income Ratio in Gilbertsville
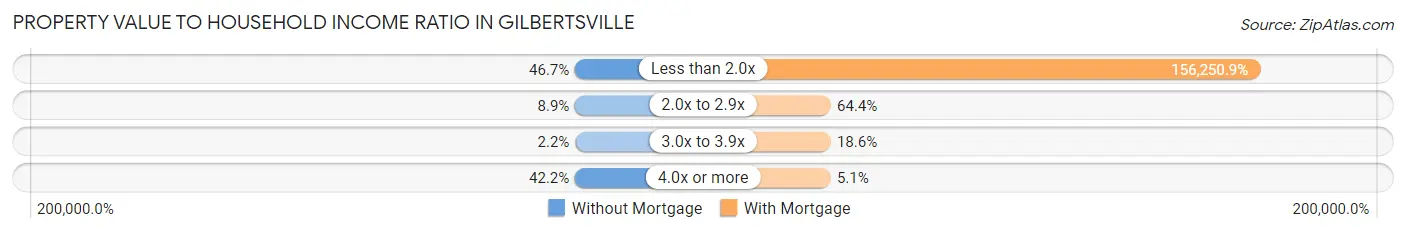
| Value-to-Income Ratio | Without Mortgage | With Mortgage |
| Less than 2.0x | 21 (46.7%) | 92,188 (156,250.8%) |
| 2.0x to 2.9x | 4 (8.9%) | 38 (64.4%) |
| 3.0x to 3.9x | 1 (2.2%) | 11 (18.6%) |
| 4.0x or more | 19 (42.2%) | 3 (5.1%) |
| Total | 45 (100.0%) | 59 (100.0%) |
Real Estate Taxes by Mortgage Status in Gilbertsville
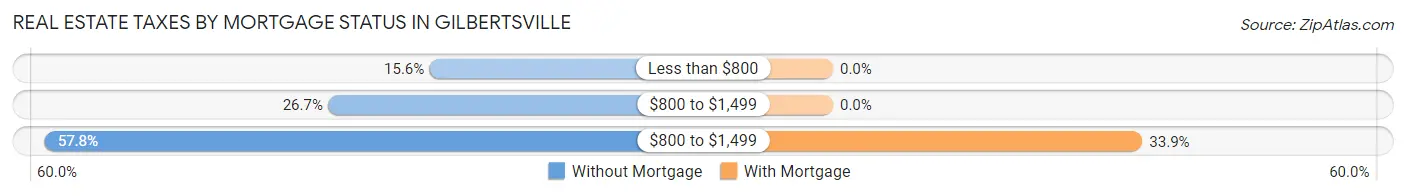
| Property Taxes | Without Mortgage | With Mortgage |
| Less than $800 | 7 (15.6%) | 0 (0.0%) |
| $800 to $1,499 | 12 (26.7%) | 0 (0.0%) |
| $800 to $1,499 | 26 (57.8%) | 20 (33.9%) |
| Total | 45 (100.0%) | 59 (100.0%) |
Health & Disability in Gilbertsville
Health Insurance Coverage by Age in Gilbertsville
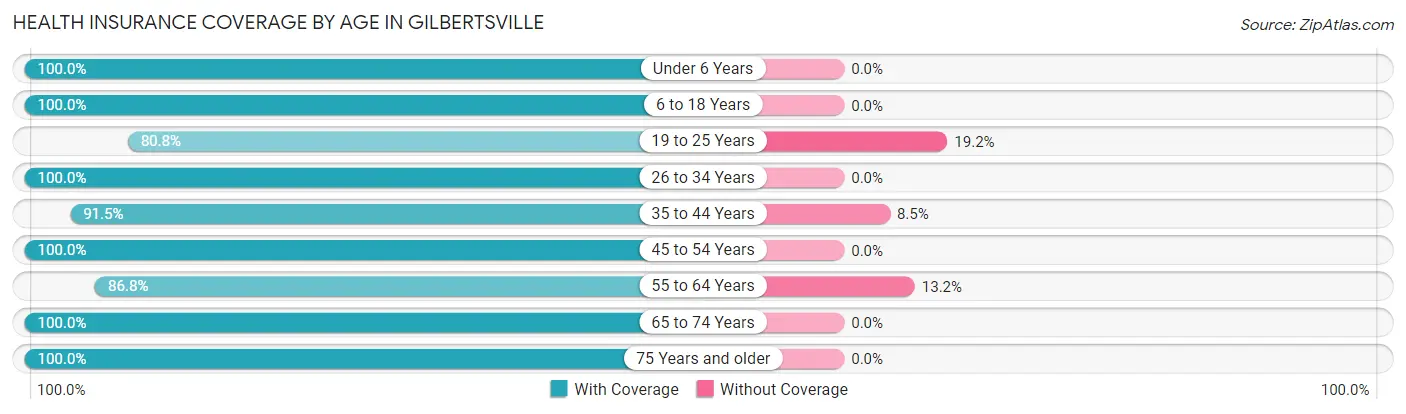
| Age Bracket | With Coverage | Without Coverage |
| Under 6 Years | 1 (100.0%) | 0 (0.0%) |
| 6 to 18 Years | 79 (100.0%) | 0 (0.0%) |
| 19 to 25 Years | 21 (80.8%) | 5 (19.2%) |
| 26 to 34 Years | 14 (100.0%) | 0 (0.0%) |
| 35 to 44 Years | 43 (91.5%) | 4 (8.5%) |
| 45 to 54 Years | 53 (100.0%) | 0 (0.0%) |
| 55 to 64 Years | 33 (86.8%) | 5 (13.2%) |
| 65 to 74 Years | 30 (100.0%) | 0 (0.0%) |
| 75 Years and older | 49 (100.0%) | 0 (0.0%) |
| Total | 323 (95.9%) | 14 (4.2%) |
Health Insurance Coverage by Citizenship Status in Gilbertsville
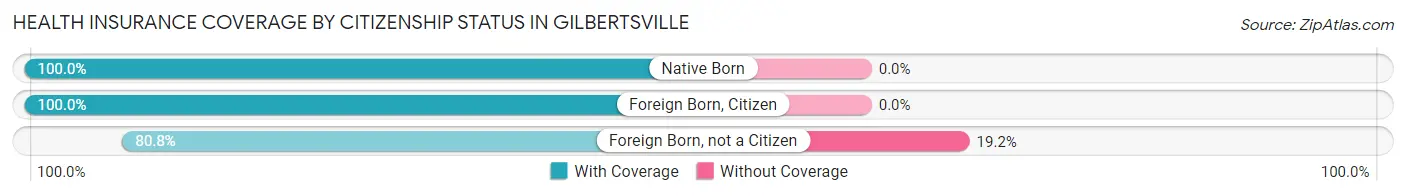
| Citizenship Status | With Coverage | Without Coverage |
| Native Born | 1 (100.0%) | 0 (0.0%) |
| Foreign Born, Citizen | 79 (100.0%) | 0 (0.0%) |
| Foreign Born, not a Citizen | 21 (80.8%) | 5 (19.2%) |
Health Insurance Coverage by Household Income in Gilbertsville
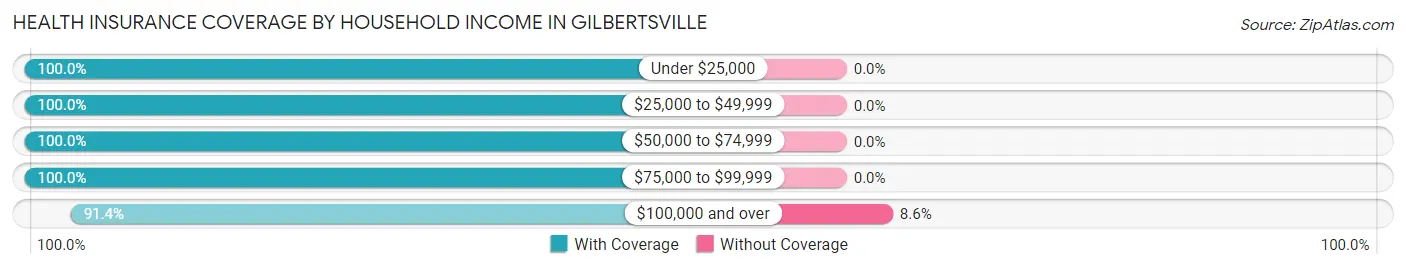
| Household Income | With Coverage | Without Coverage |
| Under $25,000 | 31 (100.0%) | 0 (0.0%) |
| $25,000 to $49,999 | 36 (100.0%) | 0 (0.0%) |
| $50,000 to $74,999 | 11 (100.0%) | 0 (0.0%) |
| $75,000 to $99,999 | 97 (100.0%) | 0 (0.0%) |
| $100,000 and over | 148 (91.4%) | 14 (8.6%) |
Public vs Private Health Insurance Coverage by Age in Gilbertsville
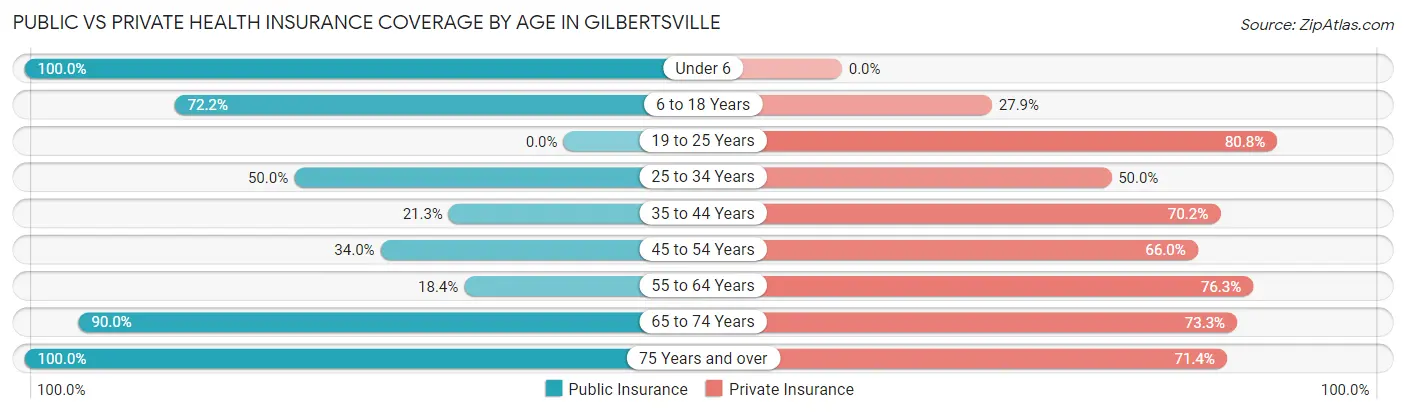
| Age Bracket | Public Insurance | Private Insurance |
| Under 6 | 1 (100.0%) | 0 (0.0%) |
| 6 to 18 Years | 57 (72.2%) | 22 (27.9%) |
| 19 to 25 Years | 0 (0.0%) | 21 (80.8%) |
| 25 to 34 Years | 7 (50.0%) | 7 (50.0%) |
| 35 to 44 Years | 10 (21.3%) | 33 (70.2%) |
| 45 to 54 Years | 18 (34.0%) | 35 (66.0%) |
| 55 to 64 Years | 7 (18.4%) | 29 (76.3%) |
| 65 to 74 Years | 27 (90.0%) | 22 (73.3%) |
| 75 Years and over | 49 (100.0%) | 35 (71.4%) |
| Total | 176 (52.2%) | 204 (60.5%) |
Disability Status by Sex by Age in Gilbertsville
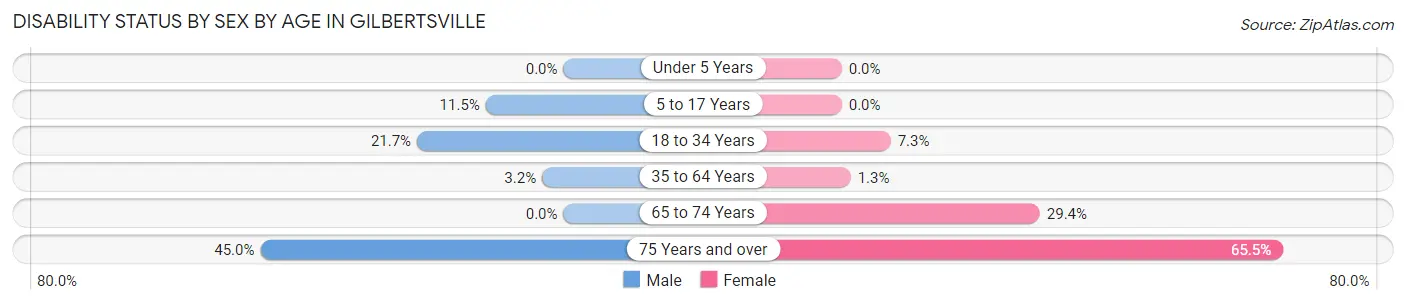
| Age Bracket | Male | Female |
| Under 5 Years | 0 (0.0%) | 0 (0.0%) |
| 5 to 17 Years | 3 (11.5%) | 0 (0.0%) |
| 18 to 34 Years | 5 (21.7%) | 4 (7.3%) |
| 35 to 64 Years | 2 (3.2%) | 1 (1.3%) |
| 65 to 74 Years | 0 (0.0%) | 5 (29.4%) |
| 75 Years and over | 9 (45.0%) | 19 (65.5%) |
Disability Class by Sex by Age in Gilbertsville
Disability Class: Hearing Difficulty
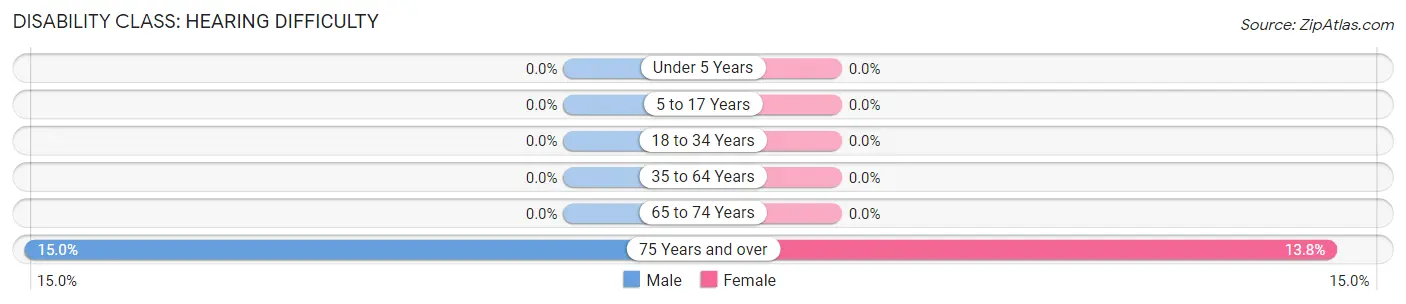
| Age Bracket | Male | Female |
| Under 5 Years | 0 (0.0%) | 0 (0.0%) |
| 5 to 17 Years | 0 (0.0%) | 0 (0.0%) |
| 18 to 34 Years | 0 (0.0%) | 0 (0.0%) |
| 35 to 64 Years | 0 (0.0%) | 0 (0.0%) |
| 65 to 74 Years | 0 (0.0%) | 0 (0.0%) |
| 75 Years and over | 3 (15.0%) | 4 (13.8%) |
Disability Class: Vision Difficulty

| Age Bracket | Male | Female |
| Under 5 Years | 0 (0.0%) | 0 (0.0%) |
| 5 to 17 Years | 0 (0.0%) | 0 (0.0%) |
| 18 to 34 Years | 5 (21.7%) | 0 (0.0%) |
| 35 to 64 Years | 0 (0.0%) | 0 (0.0%) |
| 65 to 74 Years | 0 (0.0%) | 0 (0.0%) |
| 75 Years and over | 0 (0.0%) | 7 (24.1%) |
Disability Class: Cognitive Difficulty
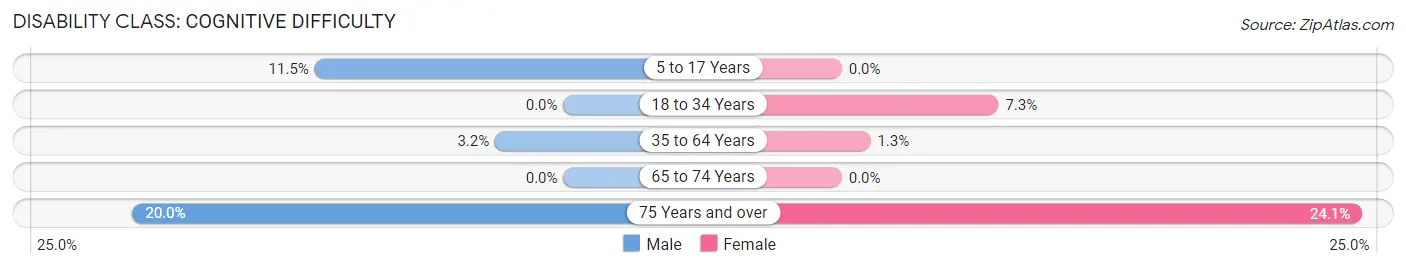
| Age Bracket | Male | Female |
| 5 to 17 Years | 3 (11.5%) | 0 (0.0%) |
| 18 to 34 Years | 0 (0.0%) | 4 (7.3%) |
| 35 to 64 Years | 2 (3.2%) | 1 (1.3%) |
| 65 to 74 Years | 0 (0.0%) | 0 (0.0%) |
| 75 Years and over | 4 (20.0%) | 7 (24.1%) |
Disability Class: Ambulatory Difficulty
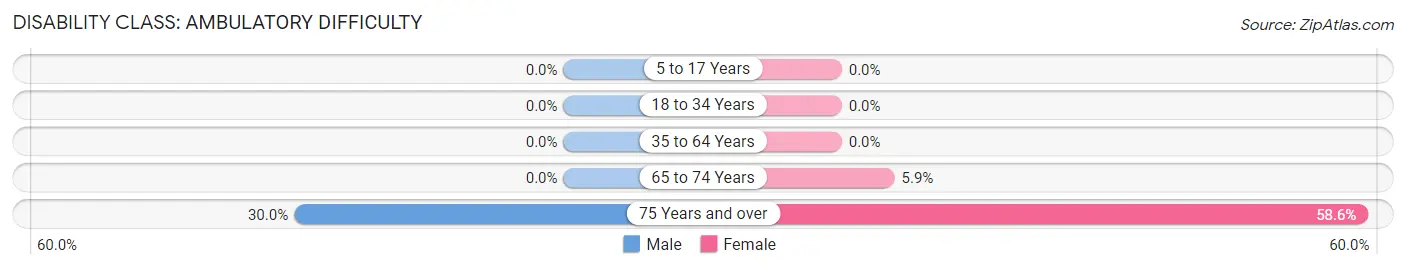
| Age Bracket | Male | Female |
| 5 to 17 Years | 0 (0.0%) | 0 (0.0%) |
| 18 to 34 Years | 0 (0.0%) | 0 (0.0%) |
| 35 to 64 Years | 0 (0.0%) | 0 (0.0%) |
| 65 to 74 Years | 0 (0.0%) | 1 (5.9%) |
| 75 Years and over | 6 (30.0%) | 17 (58.6%) |
Disability Class: Self-Care Difficulty
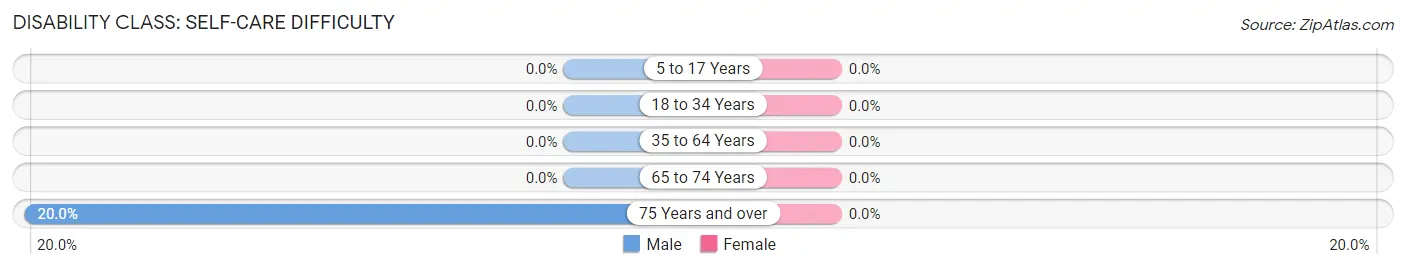
| Age Bracket | Male | Female |
| 5 to 17 Years | 0 (0.0%) | 0 (0.0%) |
| 18 to 34 Years | 0 (0.0%) | 0 (0.0%) |
| 35 to 64 Years | 0 (0.0%) | 0 (0.0%) |
| 65 to 74 Years | 0 (0.0%) | 0 (0.0%) |
| 75 Years and over | 4 (20.0%) | 0 (0.0%) |
Technology Access in Gilbertsville
Computing Device Access in Gilbertsville
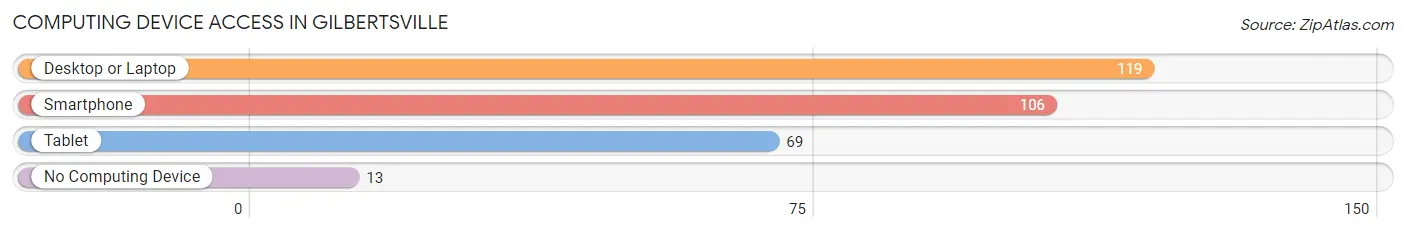
| Device Type | # Households | % Households |
| Desktop or Laptop | 119 | 83.2% |
| Smartphone | 106 | 74.1% |
| Tablet | 69 | 48.2% |
| No Computing Device | 13 | 9.1% |
| Total | 143 | 100.0% |
Internet Access in Gilbertsville
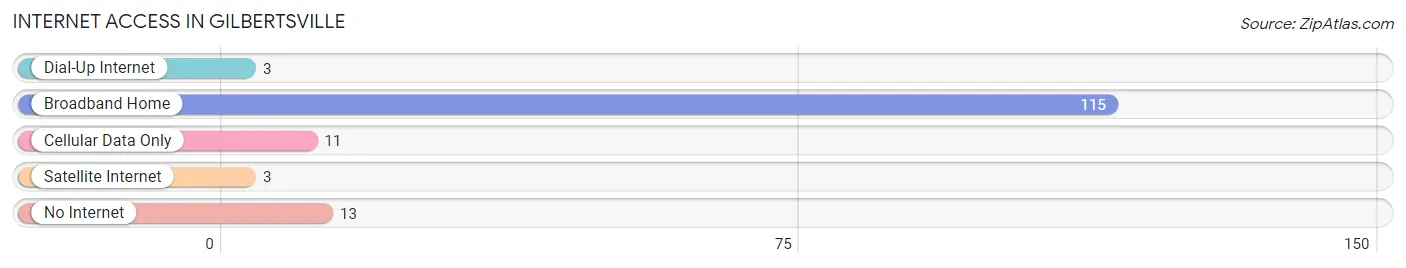
| Internet Type | # Households | % Households |
| Dial-Up Internet | 3 | 2.1% |
| Broadband Home | 115 | 80.4% |
| Cellular Data Only | 11 | 7.7% |
| Satellite Internet | 3 | 2.1% |
| No Internet | 13 | 9.1% |
| Total | 143 | 100.0% |
Gilbertsville Summary
Gilbertsville is a small hamlet located in the town of Butternuts in Otsego County, New York. It is situated in the foothills of the Catskill Mountains, about 20 miles south of Cooperstown. The hamlet is home to about 500 people and is known for its rural charm and small-town atmosphere.
History
The hamlet of Gilbertsville was first settled in the late 1700s by the Gilbert family, who were among the first settlers in the area. The family built a sawmill and gristmill on the banks of the Unadilla River, which provided the foundation for the hamlet’s early economy. The hamlet was officially established in 1812 and was named after the Gilbert family.
In the mid-1800s, the hamlet began to grow and prosper. The Unadilla River provided power for several mills, including a woolen mill, a paper mill, and a gristmill. The hamlet also had a blacksmith shop, a general store, and a post office.
In the late 1800s, the hamlet began to decline as the mills closed and the population dwindled. However, the hamlet was revitalized in the early 1900s when the New York State Conservation Department purchased land in the area and established the Gilbertsville State Forest. The forest provided recreational opportunities for the residents of the hamlet and helped to attract new businesses and residents.
Geography
Gilbertsville is located in the foothills of the Catskill Mountains in Otsego County, New York. The hamlet is situated on the banks of the Unadilla River, which flows through the area. The hamlet is surrounded by rolling hills and forests, providing a picturesque backdrop.
The hamlet is located about 20 miles south of Cooperstown and about 40 miles west of Albany. The nearest major cities are Binghamton, Utica, and Syracuse.
Economy
The economy of Gilbertsville is largely based on tourism. The hamlet is home to several bed and breakfasts, as well as a few restaurants and shops. The Gilbertsville State Forest is a popular destination for hikers, campers, and other outdoor enthusiasts.
The hamlet also has a few small businesses, including a general store, a hardware store, and a gas station. The hamlet is also home to a few farms, which produce a variety of crops, including corn, hay, and apples.
Demographics
As of the 2010 census, the population of Gilbertsville was 498. The population is largely white (97.2%) and the median age is 44. The median household income is $45,000 and the median home value is $150,000.
The hamlet is home to a variety of religious denominations, including Baptist, Methodist, and Catholic. The hamlet is also home to a few small churches.
Conclusion
Gilbertsville is a small hamlet located in the town of Butternuts in Otsego County, New York. The hamlet is situated in the foothills of the Catskill Mountains and is known for its rural charm and small-town atmosphere. The hamlet’s economy is largely based on tourism, with several bed and breakfasts, restaurants, and shops. The hamlet is also home to a few small businesses and farms. The population of Gilbertsville is largely white and the median age is 44. The hamlet is home to a variety of religious denominations and a few small churches.
Common Questions
What is Per Capita Income in Gilbertsville?
Per Capita income in Gilbertsville is $47,858.
What is the Median Family Income in Gilbertsville?
Median Family Income in Gilbertsville is $98,125.
What is the Median Household income in Gilbertsville?
Median Household Income in Gilbertsville is $90,313.
What is Income or Wage Gap in Gilbertsville?
Income or Wage Gap in Gilbertsville is 54.0%.
Women in Gilbertsville earn 46.0 cents for every dollar earned by a man.
What is Inequality or Gini Index in Gilbertsville?
Inequality or Gini Index in Gilbertsville is 0.39.
What is the Total Population of Gilbertsville?
Total Population of Gilbertsville is 337.
What is the Total Male Population of Gilbertsville?
Total Male Population of Gilbertsville is 145.
What is the Total Female Population of Gilbertsville?
Total Female Population of Gilbertsville is 192.
What is the Ratio of Males per 100 Females in Gilbertsville?
There are 75.52 Males per 100 Females in Gilbertsville.
What is the Ratio of Females per 100 Males in Gilbertsville?
There are 132.41 Females per 100 Males in Gilbertsville.
What is the Median Population Age in Gilbertsville?
Median Population Age in Gilbertsville is 45.5 Years.
What is the Average Family Size in Gilbertsville
Average Family Size in Gilbertsville is 3.0 People.
What is the Average Household Size in Gilbertsville
Average Household Size in Gilbertsville is 2.4 People.
How Large is the Labor Force in Gilbertsville?
There are 182 People in the Labor Forcein in Gilbertsville.
What is the Percentage of People in the Labor Force in Gilbertsville?
61.7% of People are in the Labor Force in Gilbertsville.
What is the Unemployment Rate in Gilbertsville?
Unemployment Rate in Gilbertsville is 7.1%.