Brightwaters, NY Map & Demographics
Brightwaters Map
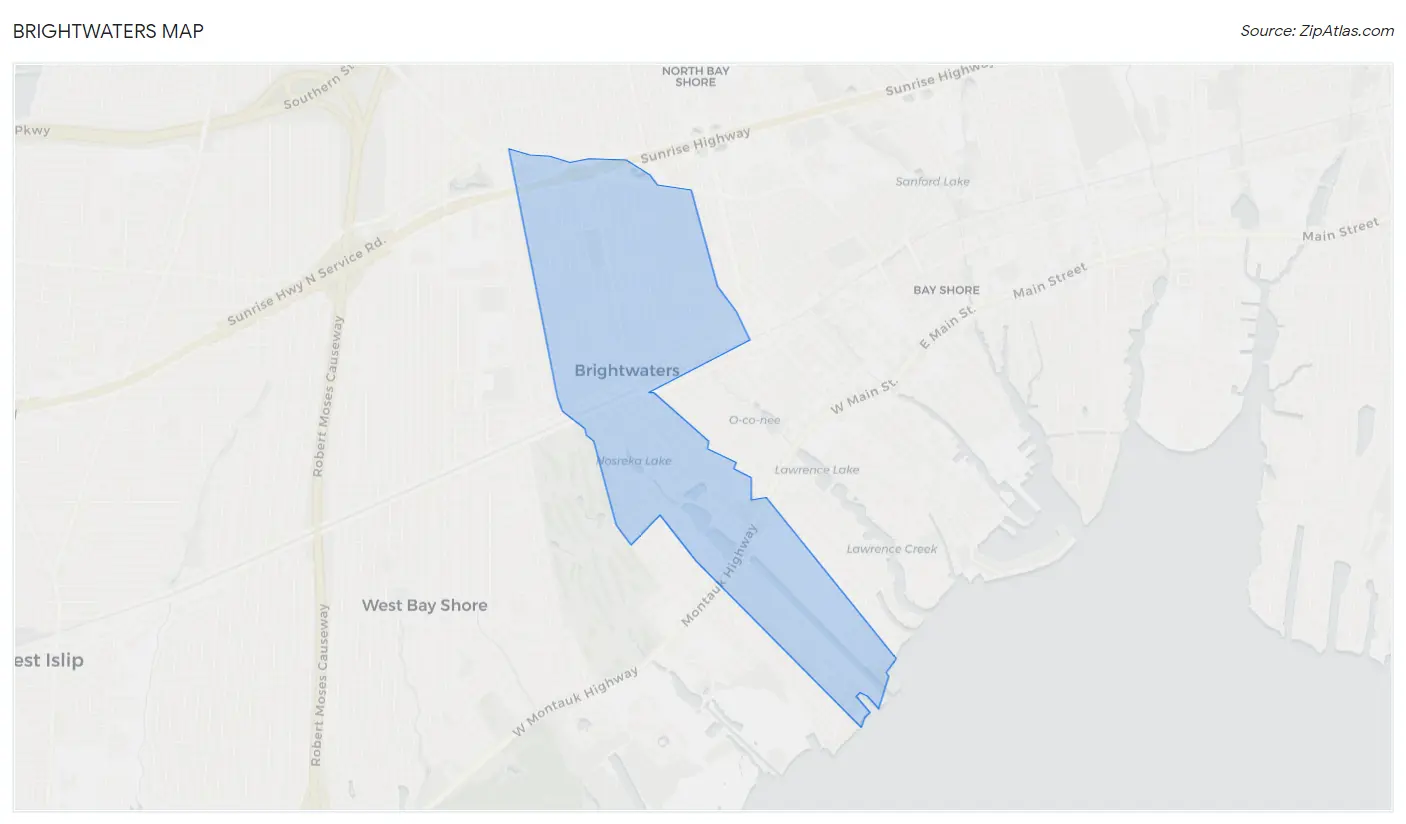
Brightwaters Overview
$66,172
PER CAPITA INCOME
$189,676
AVG FAMILY INCOME
$187,581
AVG HOUSEHOLD INCOME
31.6%
WAGE / INCOME GAP [ % ]
68.4¢/ $1
WAGE / INCOME GAP [ $ ]
0.35
INEQUALITY / GINI INDEX
3,181
TOTAL POPULATION
1,572
MALE POPULATION
1,609
FEMALE POPULATION
97.70
MALES / 100 FEMALES
102.35
FEMALES / 100 MALES
39.7
MEDIAN AGE
3.4
AVG FAMILY SIZE
3.1
AVG HOUSEHOLD SIZE
1,657
LABOR FORCE [ PEOPLE ]
69.2%
PERCENT IN LABOR FORCE
3.1%
UNEMPLOYMENT RATE
Brightwaters Zip Codes
Brightwaters Area Codes
Income in Brightwaters
Income Overview in Brightwaters
Per Capita Income in Brightwaters is $66,172, while median incomes of families and households are $189,676 and $187,581 respectively.
| Characteristic | Number | Measure |
| Per Capita Income | 3,181 | $66,172 |
| Median Family Income | 869 | $189,676 |
| Mean Family Income | 869 | $214,182 |
| Median Household Income | 1,020 | $187,581 |
| Mean Household Income | 1,020 | $202,958 |
| Income Deficit | 869 | $0 |
| Wage / Income Gap (%) | 3,181 | 31.64% |
| Wage / Income Gap ($) | 3,181 | 68.36¢ per $1 |
| Gini / Inequality Index | 3,181 | 0.35 |
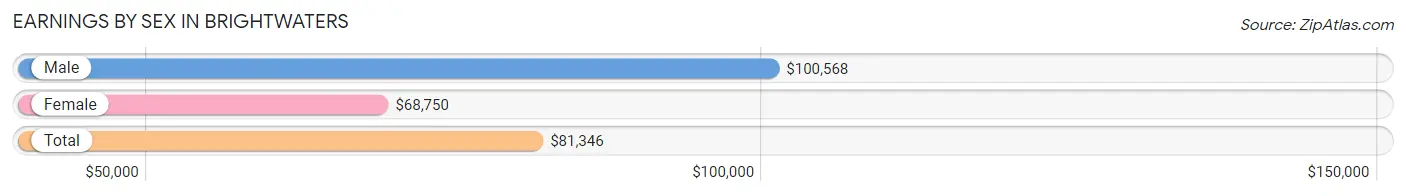
Earnings by Sex in Brightwaters
Average Earnings in Brightwaters are $81,346, $100,568 for men and $68,750 for women, a difference of 31.6%.
| Sex | Number | Average Earnings |
| Male | 922 (53.3%) | $100,568 |
| Female | 808 (46.7%) | $68,750 |
| Total | 1,730 (100.0%) | $81,346 |
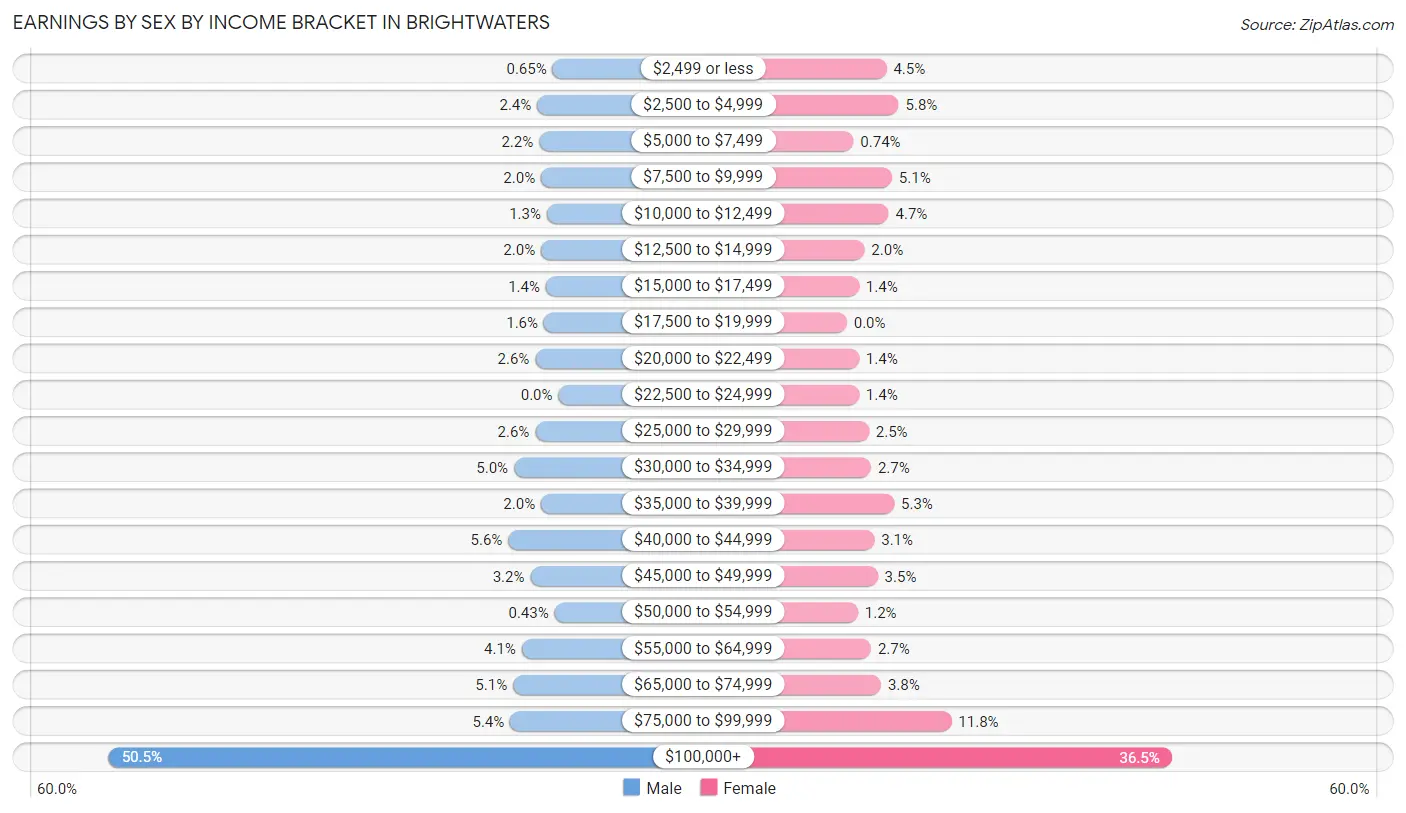
Earnings by Sex by Income Bracket in Brightwaters
The most common earnings brackets in Brightwaters are $100,000+ for men (466 | 50.5%) and $100,000+ for women (295 | 36.5%).
| Income | Male | Female |
| $2,499 or less | 6 (0.6%) | 36 (4.5%) |
| $2,500 to $4,999 | 22 (2.4%) | 47 (5.8%) |
| $5,000 to $7,499 | 20 (2.2%) | 6 (0.7%) |
| $7,500 to $9,999 | 18 (1.9%) | 41 (5.1%) |
| $10,000 to $12,499 | 12 (1.3%) | 38 (4.7%) |
| $12,500 to $14,999 | 18 (1.9%) | 16 (2.0%) |
| $15,000 to $17,499 | 13 (1.4%) | 11 (1.4%) |
| $17,500 to $19,999 | 15 (1.6%) | 0 (0.0%) |
| $20,000 to $22,499 | 24 (2.6%) | 11 (1.4%) |
| $22,500 to $24,999 | 0 (0.0%) | 11 (1.4%) |
| $25,000 to $29,999 | 24 (2.6%) | 20 (2.5%) |
| $30,000 to $34,999 | 46 (5.0%) | 22 (2.7%) |
| $35,000 to $39,999 | 18 (1.9%) | 43 (5.3%) |
| $40,000 to $44,999 | 52 (5.6%) | 25 (3.1%) |
| $45,000 to $49,999 | 29 (3.2%) | 28 (3.5%) |
| $50,000 to $54,999 | 4 (0.4%) | 10 (1.2%) |
| $55,000 to $64,999 | 38 (4.1%) | 22 (2.7%) |
| $65,000 to $74,999 | 47 (5.1%) | 31 (3.8%) |
| $75,000 to $99,999 | 50 (5.4%) | 95 (11.8%) |
| $100,000+ | 466 (50.5%) | 295 (36.5%) |
| Total | 922 (100.0%) | 808 (100.0%) |
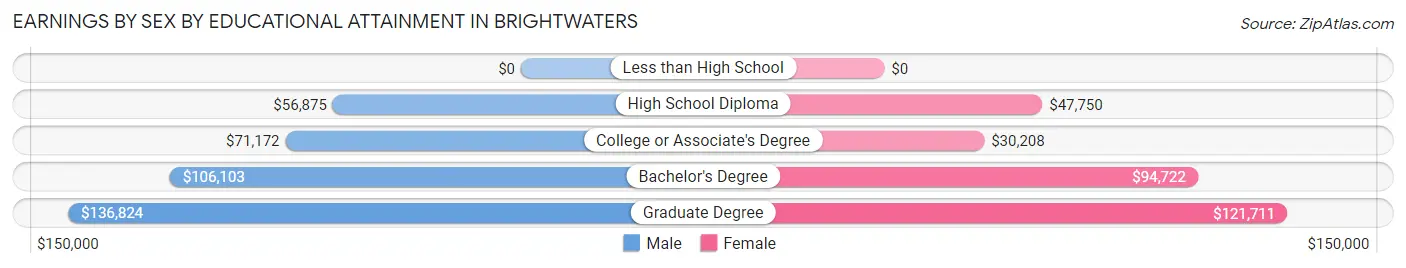
Earnings by Sex by Educational Attainment in Brightwaters
Average earnings in Brightwaters are $107,096 for men and $81,827 for women, a difference of 23.6%. Men with an educational attainment of graduate degree enjoy the highest average annual earnings of $136,824, while those with high school diploma education earn the least with $56,875. Women with an educational attainment of graduate degree earn the most with the average annual earnings of $121,711, while those with college or associate's degree education have the smallest earnings of $30,208.
| Educational Attainment | Male Income | Female Income |
| Less than High School | - | - |
| High School Diploma | $56,875 | $47,750 |
| College or Associate's Degree | $71,172 | $30,208 |
| Bachelor's Degree | $106,103 | $94,722 |
| Graduate Degree | $136,824 | $121,711 |
| Total | $107,096 | $81,827 |
Family Income in Brightwaters
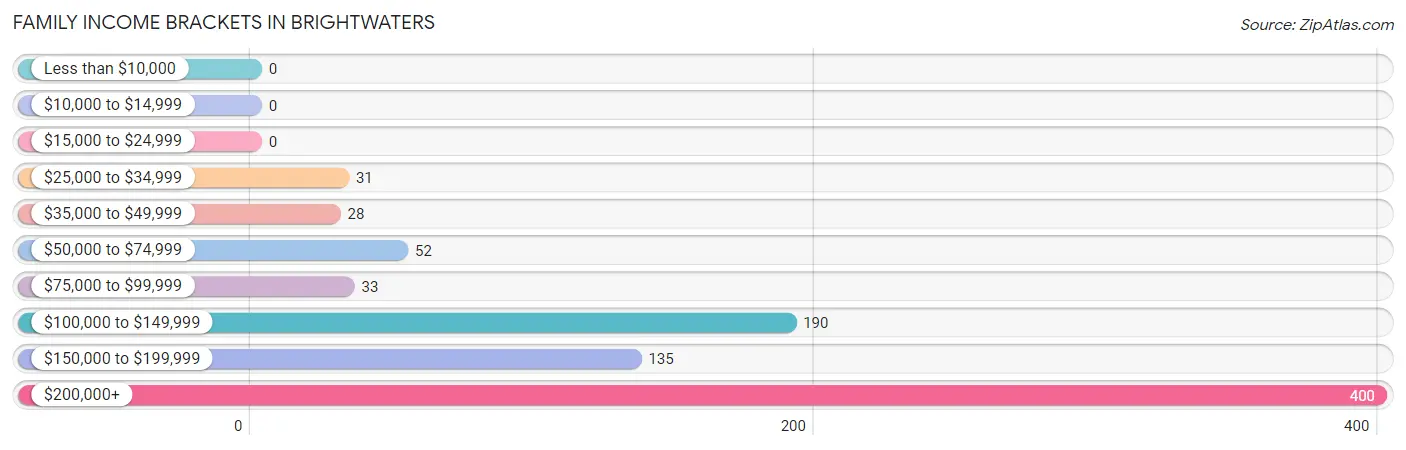
Family Income Brackets in Brightwaters
According to the Brightwaters family income data, there are 400 families falling into the $200,000+ income range, which is the most common income bracket and makes up 46.0% of all families.
| Income Bracket | # Families | % Families |
| Less than $10,000 | 0 | 0.0% |
| $10,000 to $14,999 | 0 | 0.0% |
| $15,000 to $24,999 | 0 | 0.0% |
| $25,000 to $34,999 | 31 | 3.6% |
| $35,000 to $49,999 | 28 | 3.2% |
| $50,000 to $74,999 | 52 | 6.0% |
| $75,000 to $99,999 | 33 | 3.8% |
| $100,000 to $149,999 | 190 | 21.9% |
| $150,000 to $199,999 | 135 | 15.5% |
| $200,000+ | 400 | 46.0% |
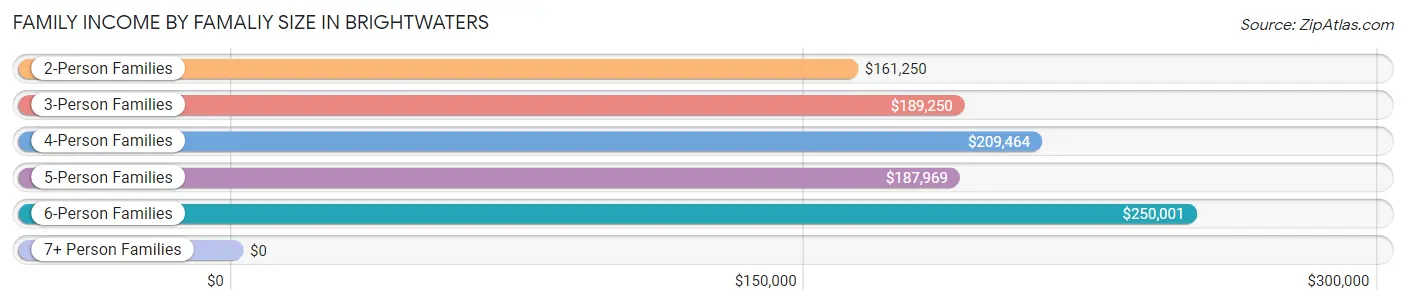
Family Income by Famaliy Size in Brightwaters
6-person families (26 | 3.0%) account for the highest median family income in Brightwaters with $250,001 per family, while 2-person families (322 | 37.0%) have the highest median income of $80,625 per family member.
| Income Bracket | # Families | Median Income |
| 2-Person Families | 322 (37.0%) | $161,250 |
| 3-Person Families | 177 (20.4%) | $189,250 |
| 4-Person Families | 268 (30.8%) | $209,464 |
| 5-Person Families | 76 (8.7%) | $187,969 |
| 6-Person Families | 26 (3.0%) | $250,001 |
| 7+ Person Families | 0 (0.0%) | $0 |
| Total | 869 (100.0%) | $189,676 |
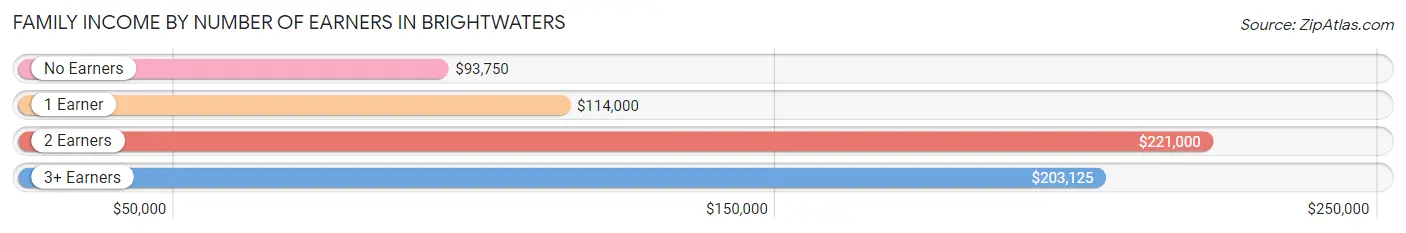
Family Income by Number of Earners in Brightwaters
The median family income in Brightwaters is $189,676, with families comprising 2 earners (434) having the highest median family income of $221,000, while families with no earners (106) have the lowest median family income of $93,750, accounting for 49.9% and 12.2% of families, respectively.
| Number of Earners | # Families | Median Income |
| No Earners | 106 (12.2%) | $93,750 |
| 1 Earner | 190 (21.9%) | $114,000 |
| 2 Earners | 434 (49.9%) | $221,000 |
| 3+ Earners | 139 (16.0%) | $203,125 |
| Total | 869 (100.0%) | $189,676 |
Household Income in Brightwaters
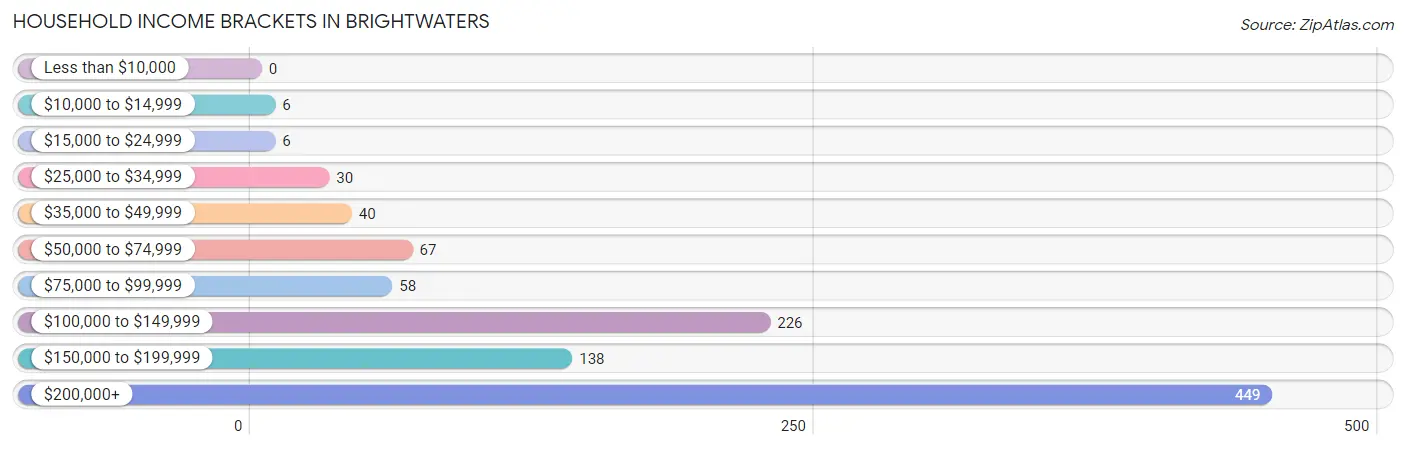
Household Income Brackets in Brightwaters
With 449 households falling in the category, the $200,000+ income range is the most frequent in Brightwaters, accounting for 44.0% of all households.
| Income Bracket | # Households | % Households |
| Less than $10,000 | 0 | 0.0% |
| $10,000 to $14,999 | 6 | 0.6% |
| $15,000 to $24,999 | 6 | 0.6% |
| $25,000 to $34,999 | 30 | 2.9% |
| $35,000 to $49,999 | 40 | 3.9% |
| $50,000 to $74,999 | 67 | 6.6% |
| $75,000 to $99,999 | 58 | 5.7% |
| $100,000 to $149,999 | 226 | 22.2% |
| $150,000 to $199,999 | 138 | 13.5% |
| $200,000+ | 449 | 44.0% |
Household Income by Householder Age in Brightwaters
The median household income in Brightwaters is $187,581, with the highest median household income of $207,679 found in the 25 to 44 years age bracket for the primary householder. A total of 296 households (29.0%) fall into this category.
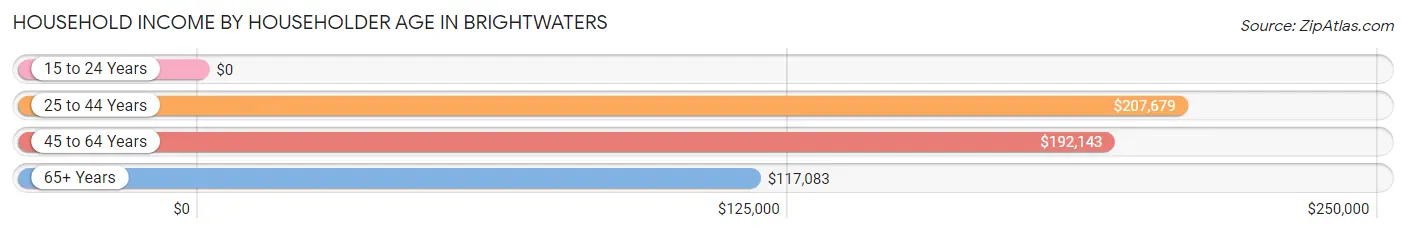
| Income Bracket | # Households | Median Income |
| 15 to 24 Years | 0 (0.0%) | $0 |
| 25 to 44 Years | 296 (29.0%) | $207,679 |
| 45 to 64 Years | 466 (45.7%) | $192,143 |
| 65+ Years | 258 (25.3%) | $117,083 |
| Total | 1,020 (100.0%) | $187,581 |
Poverty in Brightwaters
Income Below Poverty by Sex and Age in Brightwaters
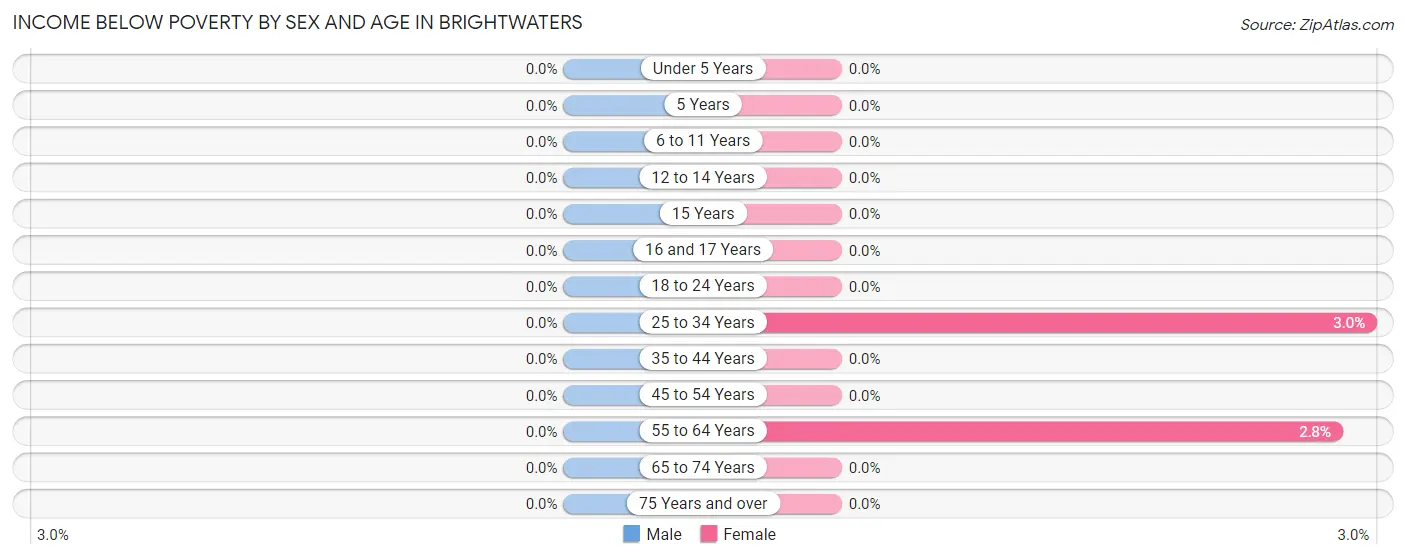
| Age Bracket | Male | Female |
| Under 5 Years | 0 (0.0%) | 0 (0.0%) |
| 5 Years | 0 (0.0%) | 0 (0.0%) |
| 6 to 11 Years | 0 (0.0%) | 0 (0.0%) |
| 12 to 14 Years | 0 (0.0%) | 0 (0.0%) |
| 15 Years | 0 (0.0%) | 0 (0.0%) |
| 16 and 17 Years | 0 (0.0%) | 0 (0.0%) |
| 18 to 24 Years | 0 (0.0%) | 0 (0.0%) |
| 25 to 34 Years | 0 (0.0%) | 5 (3.0%) |
| 35 to 44 Years | 0 (0.0%) | 0 (0.0%) |
| 45 to 54 Years | 0 (0.0%) | 0 (0.0%) |
| 55 to 64 Years | 0 (0.0%) | 6 (2.8%) |
| 65 to 74 Years | 0 (0.0%) | 0 (0.0%) |
| 75 Years and over | 0 (0.0%) | 0 (0.0%) |
| Total | 0 (0.0%) | 11 (0.7%) |
Income Above Poverty by Sex and Age in Brightwaters
According to the poverty statistics in Brightwaters, males aged under 5 years and females aged under 5 years are the age groups that are most secure financially, with 100.0% of males and 100.0% of females in these age groups living above the poverty line.
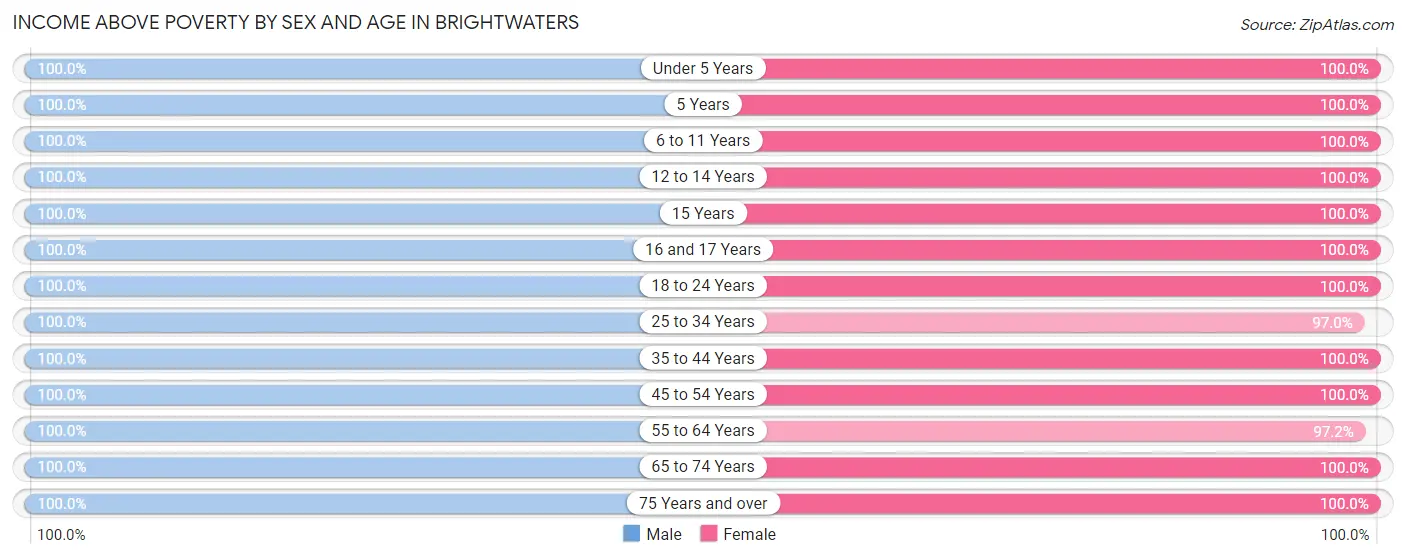
| Age Bracket | Male | Female |
| Under 5 Years | 57 (100.0%) | 79 (100.0%) |
| 5 Years | 34 (100.0%) | 34 (100.0%) |
| 6 to 11 Years | 94 (100.0%) | 259 (100.0%) |
| 12 to 14 Years | 103 (100.0%) | 58 (100.0%) |
| 15 Years | 36 (100.0%) | 32 (100.0%) |
| 16 and 17 Years | 89 (100.0%) | 22 (100.0%) |
| 18 to 24 Years | 103 (100.0%) | 109 (100.0%) |
| 25 to 34 Years | 106 (100.0%) | 163 (97.0%) |
| 35 to 44 Years | 254 (100.0%) | 183 (100.0%) |
| 45 to 54 Years | 218 (100.0%) | 208 (100.0%) |
| 55 to 64 Years | 267 (100.0%) | 209 (97.2%) |
| 65 to 74 Years | 142 (100.0%) | 143 (100.0%) |
| 75 Years and over | 69 (100.0%) | 94 (100.0%) |
| Total | 1,572 (100.0%) | 1,593 (99.3%) |
Income Below Poverty Among Married-Couple Families in Brightwaters
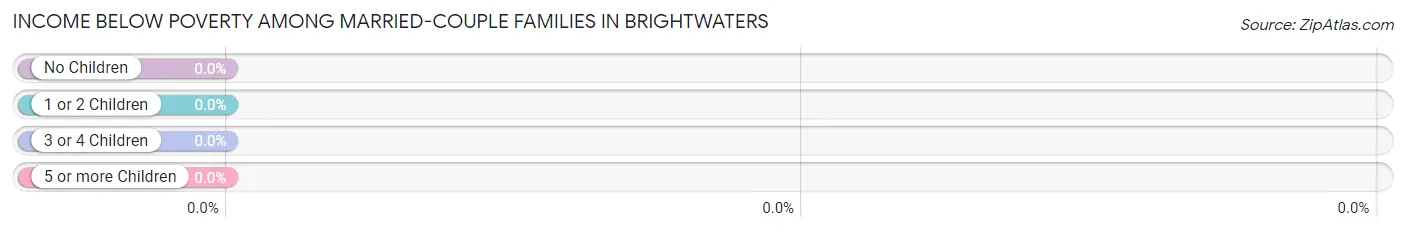
| Children | Above Poverty | Below Poverty |
| No Children | 435 (100.0%) | 0 (0.0%) |
| 1 or 2 Children | 298 (100.0%) | 0 (0.0%) |
| 3 or 4 Children | 54 (100.0%) | 0 (0.0%) |
| 5 or more Children | 0 (0.0%) | 0 (0.0%) |
| Total | 787 (100.0%) | 0 (0.0%) |
Income Below Poverty Among Single-Parent Households in Brightwaters
| Children | Single Father | Single Mother |
| No Children | 0 (0.0%) | 0 (0.0%) |
| 1 or 2 Children | 0 (0.0%) | 0 (0.0%) |
| 3 or 4 Children | 0 (0.0%) | 0 (0.0%) |
| 5 or more Children | 0 (0.0%) | 0 (0.0%) |
| Total | 0 (0.0%) | 0 (0.0%) |
Income Below Poverty Among Married-Couple vs Single-Parent Households in Brightwaters
| Children | Married-Couple Families | Single-Parent Households |
| No Children | 0 (0.0%) | 0 (0.0%) |
| 1 or 2 Children | 0 (0.0%) | 0 (0.0%) |
| 3 or 4 Children | 0 (0.0%) | 0 (0.0%) |
| 5 or more Children | 0 (0.0%) | 0 (0.0%) |
| Total | 0 (0.0%) | 0 (0.0%) |
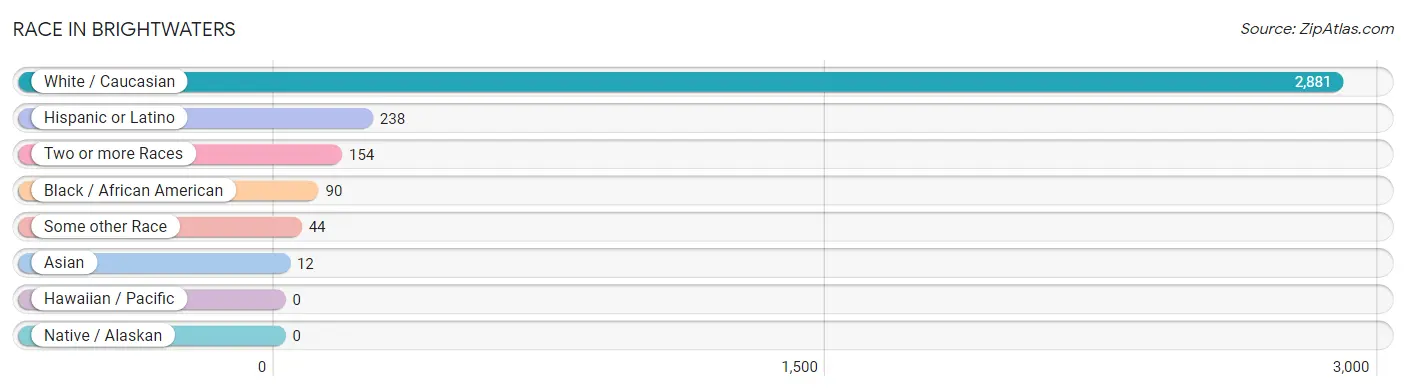
Race in Brightwaters
The most populous races in Brightwaters are White / Caucasian (2,881 | 90.6%), Hispanic or Latino (238 | 7.5%), and Two or more Races (154 | 4.8%).
| Race | # Population | % Population |
| Asian | 12 | 0.4% |
| Black / African American | 90 | 2.8% |
| Hawaiian / Pacific | 0 | 0.0% |
| Hispanic or Latino | 238 | 7.5% |
| Native / Alaskan | 0 | 0.0% |
| White / Caucasian | 2,881 | 90.6% |
| Two or more Races | 154 | 4.8% |
| Some other Race | 44 | 1.4% |
| Total | 3,181 | 100.0% |
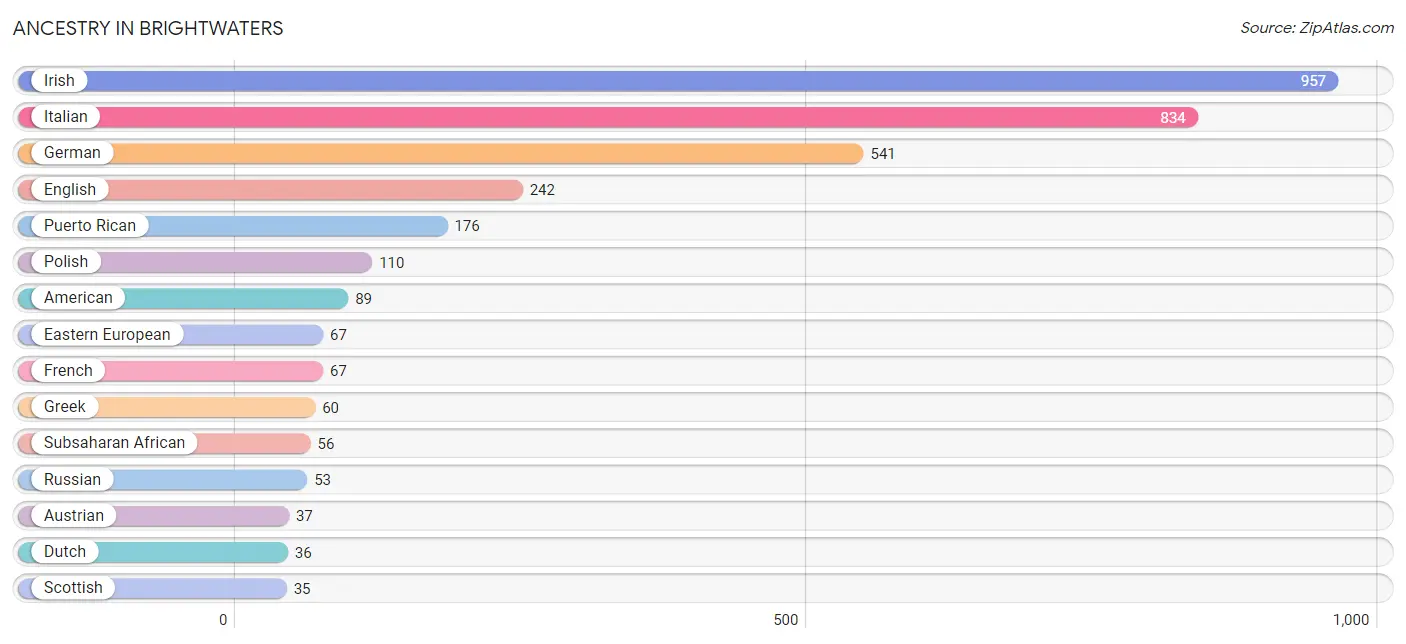
Ancestry in Brightwaters
The most populous ancestries reported in Brightwaters are Irish (957 | 30.1%), Italian (834 | 26.2%), German (541 | 17.0%), English (242 | 7.6%), and Puerto Rican (176 | 5.5%), together accounting for 86.4% of all Brightwaters residents.
| Ancestry | # Population | % Population |
| American | 89 | 2.8% |
| Arab | 5 | 0.2% |
| Austrian | 37 | 1.2% |
| British | 6 | 0.2% |
| Burmese | 22 | 0.7% |
| Celtic | 19 | 0.6% |
| Central American | 21 | 0.7% |
| Chilean | 5 | 0.2% |
| Colombian | 5 | 0.2% |
| Croatian | 15 | 0.5% |
| Czech | 6 | 0.2% |
| Danish | 15 | 0.5% |
| Dutch | 36 | 1.1% |
| Eastern European | 67 | 2.1% |
| Ecuadorian | 18 | 0.6% |
| English | 242 | 7.6% |
| European | 21 | 0.7% |
| French | 67 | 2.1% |
| German | 541 | 17.0% |
| Ghanaian | 25 | 0.8% |
| Greek | 60 | 1.9% |
| Guatemalan | 21 | 0.7% |
| Haitian | 23 | 0.7% |
| Hungarian | 10 | 0.3% |
| Irish | 957 | 30.1% |
| Italian | 834 | 26.2% |
| Lithuanian | 23 | 0.7% |
| Mexican | 6 | 0.2% |
| Nigerian | 31 | 1.0% |
| Norwegian | 29 | 0.9% |
| Polish | 110 | 3.5% |
| Portuguese | 11 | 0.4% |
| Puerto Rican | 176 | 5.5% |
| Romanian | 8 | 0.3% |
| Russian | 53 | 1.7% |
| Scotch-Irish | 11 | 0.4% |
| Scottish | 35 | 1.1% |
| Slovene | 6 | 0.2% |
| South American | 28 | 0.9% |
| Spaniard | 6 | 0.2% |
| Subsaharan African | 56 | 1.8% |
| Swiss | 20 | 0.6% |
| Syrian | 5 | 0.2% |
| Ukrainian | 21 | 0.7% |
| Welsh | 9 | 0.3% | View All 45 Rows |
Immigrants in Brightwaters
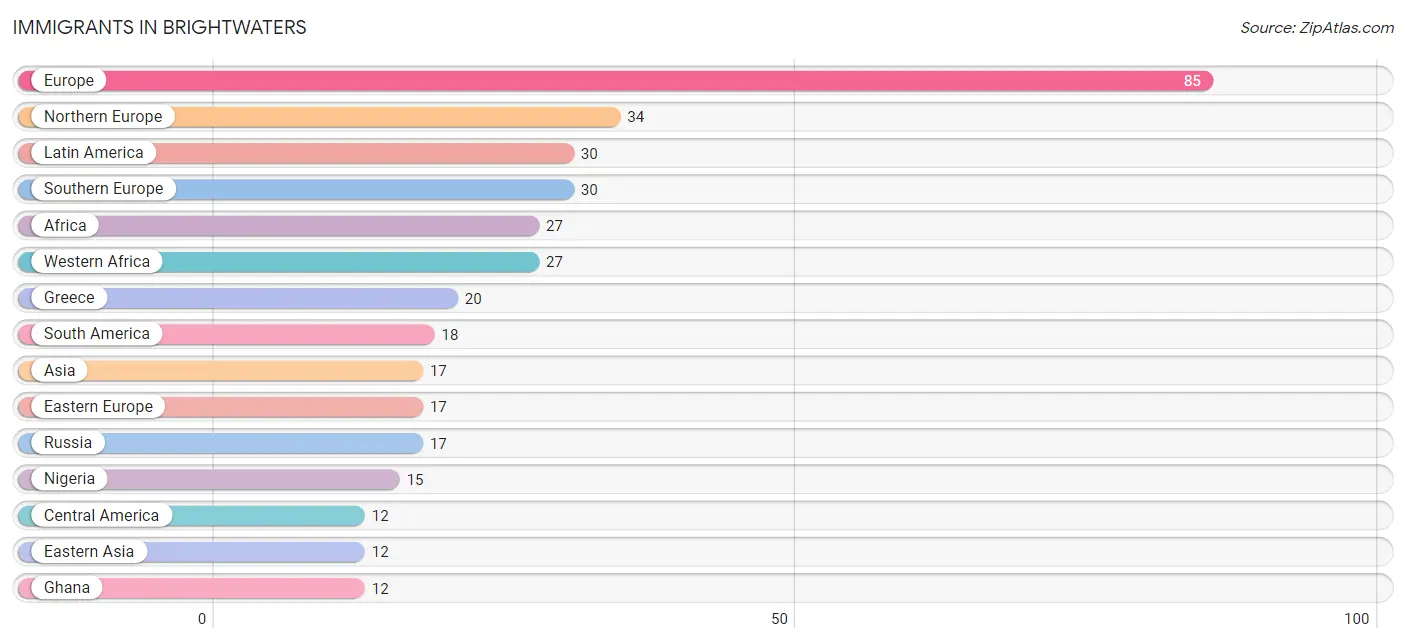
The most numerous immigrant groups reported in Brightwaters came from Europe (85 | 2.7%), Northern Europe (34 | 1.1%), Latin America (30 | 0.9%), Southern Europe (30 | 0.9%), and Africa (27 | 0.9%), together accounting for 6.5% of all Brightwaters residents.
| Immigration Origin | # Population | % Population |
| Africa | 27 | 0.9% |
| Argentina | 3 | 0.1% |
| Asia | 17 | 0.5% |
| Canada | 7 | 0.2% |
| Central America | 12 | 0.4% |
| Colombia | 5 | 0.2% |
| Eastern Asia | 12 | 0.4% |
| Eastern Europe | 17 | 0.5% |
| Ecuador | 10 | 0.3% |
| England | 4 | 0.1% |
| Europe | 85 | 2.7% |
| Ghana | 12 | 0.4% |
| Greece | 20 | 0.6% |
| Guatemala | 6 | 0.2% |
| Italy | 4 | 0.1% |
| Korea | 12 | 0.4% |
| Latin America | 30 | 0.9% |
| Mexico | 6 | 0.2% |
| Netherlands | 4 | 0.1% |
| Nigeria | 15 | 0.5% |
| Northern Europe | 34 | 1.1% |
| Russia | 17 | 0.5% |
| South America | 18 | 0.6% |
| Southern Europe | 30 | 0.9% |
| Spain | 6 | 0.2% |
| Turkey | 5 | 0.2% |
| Western Africa | 27 | 0.9% |
| Western Asia | 5 | 0.2% |
| Western Europe | 4 | 0.1% | View All 29 Rows |
Sex and Age in Brightwaters
Sex and Age in Brightwaters
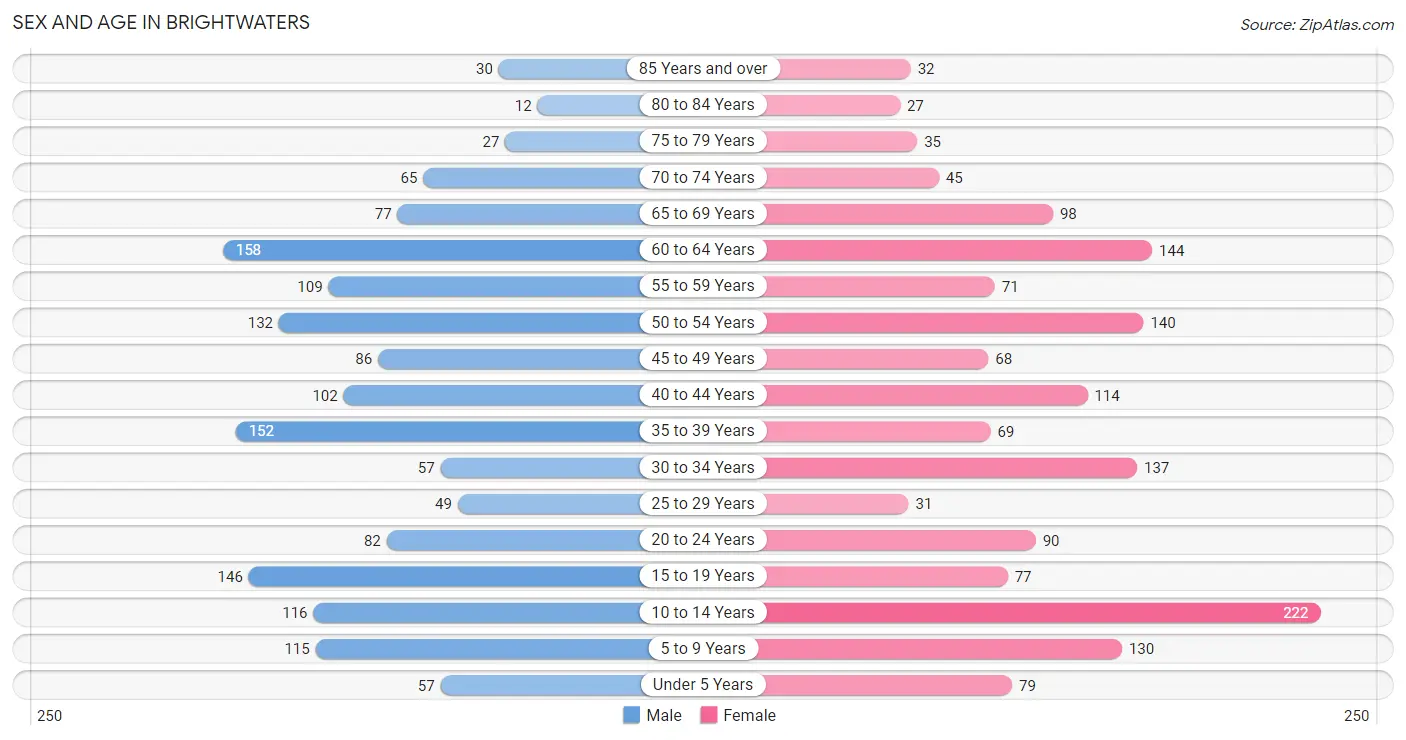
The most populous age groups in Brightwaters are 60 to 64 Years (158 | 10.1%) for men and 10 to 14 Years (222 | 13.8%) for women.
| Age Bracket | Male | Female |
| Under 5 Years | 57 (3.6%) | 79 (4.9%) |
| 5 to 9 Years | 115 (7.3%) | 130 (8.1%) |
| 10 to 14 Years | 116 (7.4%) | 222 (13.8%) |
| 15 to 19 Years | 146 (9.3%) | 77 (4.8%) |
| 20 to 24 Years | 82 (5.2%) | 90 (5.6%) |
| 25 to 29 Years | 49 (3.1%) | 31 (1.9%) |
| 30 to 34 Years | 57 (3.6%) | 137 (8.5%) |
| 35 to 39 Years | 152 (9.7%) | 69 (4.3%) |
| 40 to 44 Years | 102 (6.5%) | 114 (7.1%) |
| 45 to 49 Years | 86 (5.5%) | 68 (4.2%) |
| 50 to 54 Years | 132 (8.4%) | 140 (8.7%) |
| 55 to 59 Years | 109 (6.9%) | 71 (4.4%) |
| 60 to 64 Years | 158 (10.1%) | 144 (8.9%) |
| 65 to 69 Years | 77 (4.9%) | 98 (6.1%) |
| 70 to 74 Years | 65 (4.1%) | 45 (2.8%) |
| 75 to 79 Years | 27 (1.7%) | 35 (2.2%) |
| 80 to 84 Years | 12 (0.8%) | 27 (1.7%) |
| 85 Years and over | 30 (1.9%) | 32 (2.0%) |
| Total | 1,572 (100.0%) | 1,609 (100.0%) |
Families and Households in Brightwaters
Median Family Size in Brightwaters
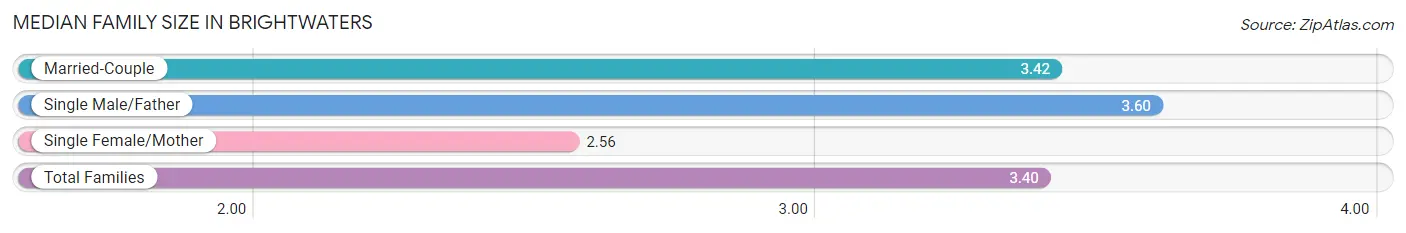
The median family size in Brightwaters is 3.40 persons per family, with single male/father families (50 | 5.8%) accounting for the largest median family size of 3.6 persons per family. On the other hand, single female/mother families (32 | 3.7%) represent the smallest median family size with 2.56 persons per family.
| Family Type | # Families | Family Size |
| Married-Couple | 787 (90.6%) | 3.42 |
| Single Male/Father | 50 (5.8%) | 3.60 |
| Single Female/Mother | 32 (3.7%) | 2.56 |
| Total Families | 869 (100.0%) | 3.40 |
Median Household Size in Brightwaters
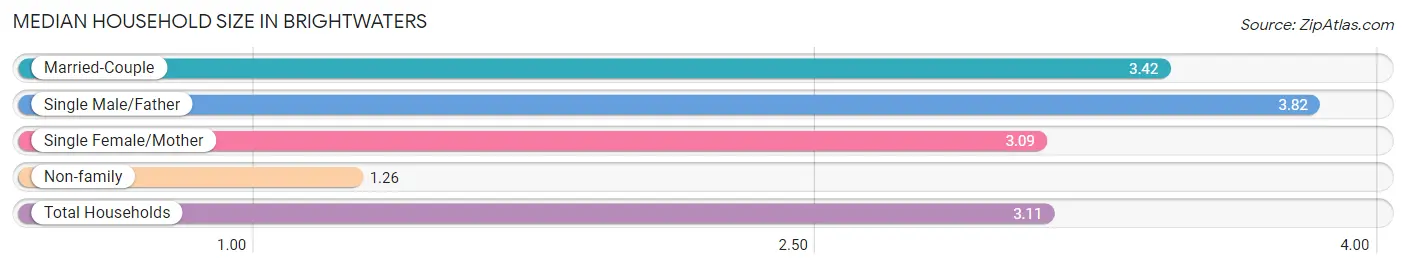
The median household size in Brightwaters is 3.11 persons per household, with single male/father households (50 | 4.9%) accounting for the largest median household size of 3.82 persons per household. non-family households (151 | 14.8%) represent the smallest median household size with 1.26 persons per household.
| Household Type | # Households | Household Size |
| Married-Couple | 787 (77.2%) | 3.42 |
| Single Male/Father | 50 (4.9%) | 3.82 |
| Single Female/Mother | 32 (3.1%) | 3.09 |
| Non-family | 151 (14.8%) | 1.26 |
| Total Households | 1,020 (100.0%) | 3.11 |
Household Size by Marriage Status in Brightwaters
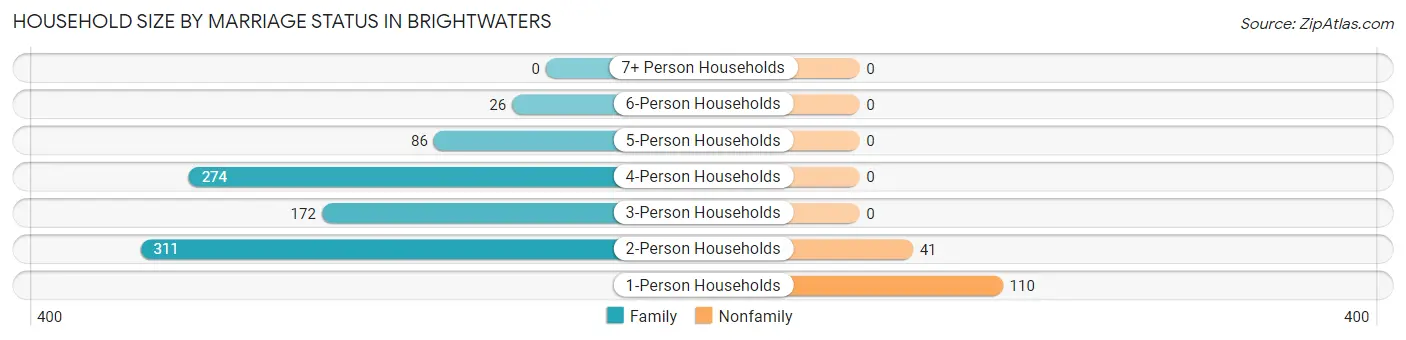
Out of a total of 1,020 households in Brightwaters, 869 (85.2%) are family households, while 151 (14.8%) are nonfamily households. The most numerous type of family households are 2-person households, comprising 311, and the most common type of nonfamily households are 1-person households, comprising 110.
| Household Size | Family Households | Nonfamily Households |
| 1-Person Households | - | 110 (10.8%) |
| 2-Person Households | 311 (30.5%) | 41 (4.0%) |
| 3-Person Households | 172 (16.9%) | 0 (0.0%) |
| 4-Person Households | 274 (26.9%) | 0 (0.0%) |
| 5-Person Households | 86 (8.4%) | 0 (0.0%) |
| 6-Person Households | 26 (2.5%) | 0 (0.0%) |
| 7+ Person Households | 0 (0.0%) | 0 (0.0%) |
| Total | 869 (85.2%) | 151 (14.8%) |
Female Fertility in Brightwaters
Fertility by Age in Brightwaters
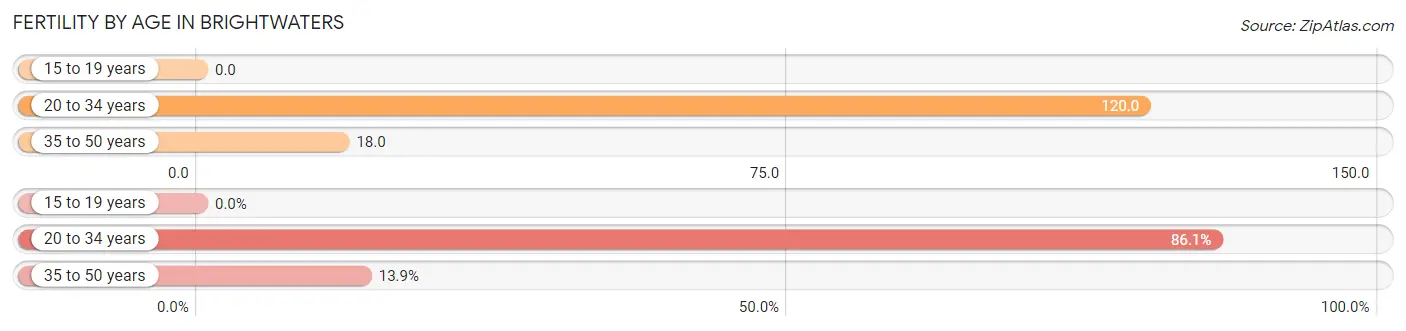
Average fertility rate in Brightwaters is 59.0 births per 1,000 women. Women in the age bracket of 20 to 34 years have the highest fertility rate with 120.0 births per 1,000 women. Women in the age bracket of 20 to 34 years acount for 86.1% of all women with births.
| Age Bracket | Women with Births | Births / 1,000 Women |
| 15 to 19 years | 0 (0.0%) | 0.0 |
| 20 to 34 years | 31 (86.1%) | 120.0 |
| 35 to 50 years | 5 (13.9%) | 18.0 |
| Total | 36 (100.0%) | 59.0 |
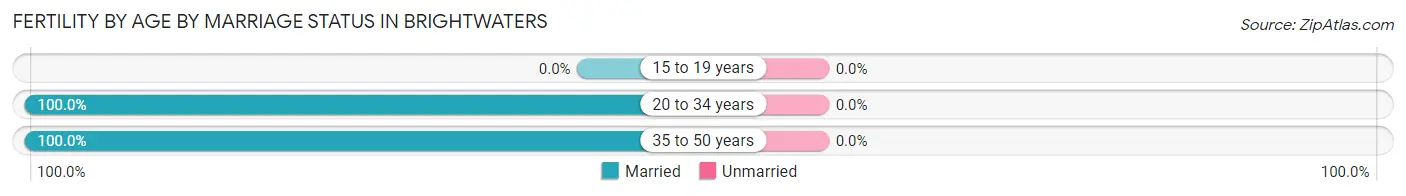
Fertility by Age by Marriage Status in Brightwaters
| Age Bracket | Married | Unmarried |
| 15 to 19 years | 0 (0.0%) | 0 (0.0%) |
| 20 to 34 years | 31 (100.0%) | 0 (0.0%) |
| 35 to 50 years | 5 (100.0%) | 0 (0.0%) |
| Total | 36 (100.0%) | 0 (0.0%) |
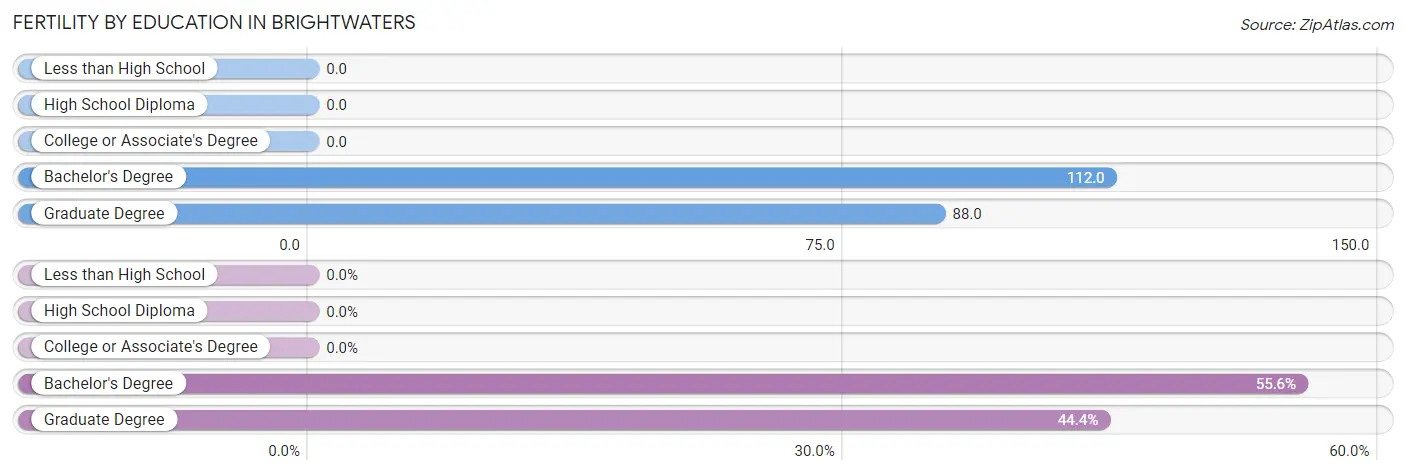
Fertility by Education in Brightwaters
| Educational Attainment | Women with Births | Births / 1,000 Women |
| Less than High School | 0 (0.0%) | 0.0 |
| High School Diploma | 0 (0.0%) | 0.0 |
| College or Associate's Degree | 0 (0.0%) | 0.0 |
| Bachelor's Degree | 20 (55.6%) | 112.0 |
| Graduate Degree | 16 (44.4%) | 88.0 |
| Total | 36 (100.0%) | 59.0 |
Fertility by Education by Marriage Status in Brightwaters
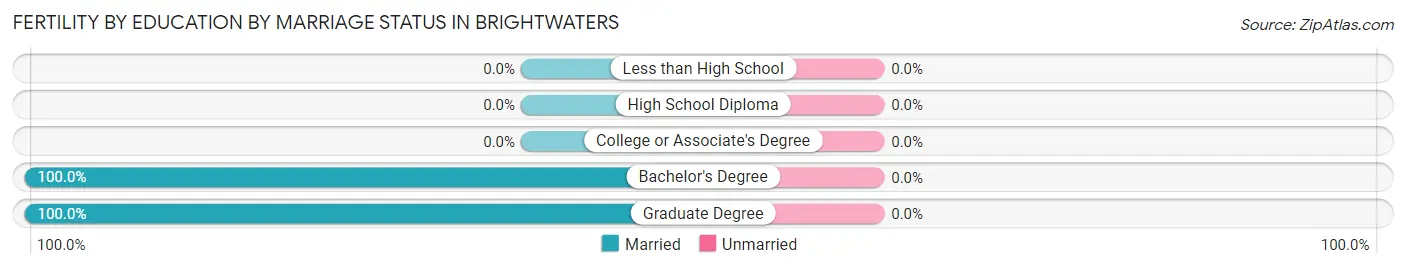
| Educational Attainment | Married | Unmarried |
| Less than High School | 0 (0.0%) | 0 (0.0%) |
| High School Diploma | 0 (0.0%) | 0 (0.0%) |
| College or Associate's Degree | 0 (0.0%) | 0 (0.0%) |
| Bachelor's Degree | 20 (100.0%) | 0 (0.0%) |
| Graduate Degree | 16 (100.0%) | 0 (0.0%) |
| Total | 36 (100.0%) | 0 (0.0%) |
Employment Characteristics in Brightwaters
Employment by Class of Employer in Brightwaters
Among the 1,572 employed individuals in Brightwaters, private company employees (875 | 55.7%), local government employees (296 | 18.8%), and self-employed (incorporated) (171 | 10.9%) make up the most common classes of employment.
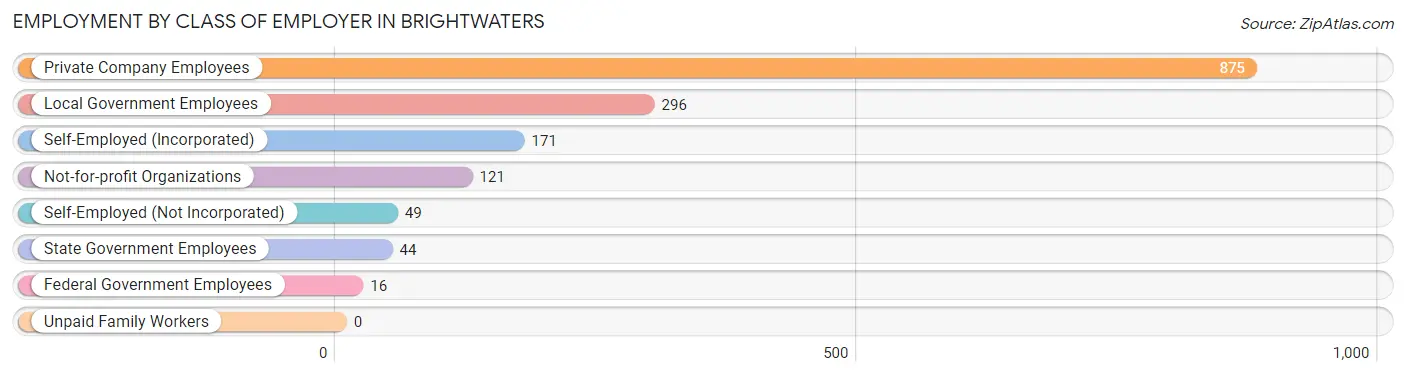
| Employer Class | # Employees | % Employees |
| Private Company Employees | 875 | 55.7% |
| Self-Employed (Incorporated) | 171 | 10.9% |
| Self-Employed (Not Incorporated) | 49 | 3.1% |
| Not-for-profit Organizations | 121 | 7.7% |
| Local Government Employees | 296 | 18.8% |
| State Government Employees | 44 | 2.8% |
| Federal Government Employees | 16 | 1.0% |
| Unpaid Family Workers | 0 | 0.0% |
| Total | 1,572 | 100.0% |
Employment Status by Age in Brightwaters
According to the labor force statistics for Brightwaters, out of the total population over 16 years of age (2,394), 69.2% or 1,657 individuals are in the labor force, with 3.1% or 51 of them unemployed. The age group with the highest labor force participation rate is 20 to 24 years, with 96.5% or 166 individuals in the labor force. Within the labor force, the 35 to 44 years age range has the highest percentage of unemployed individuals, with 8.1% or 33 of them being unemployed.
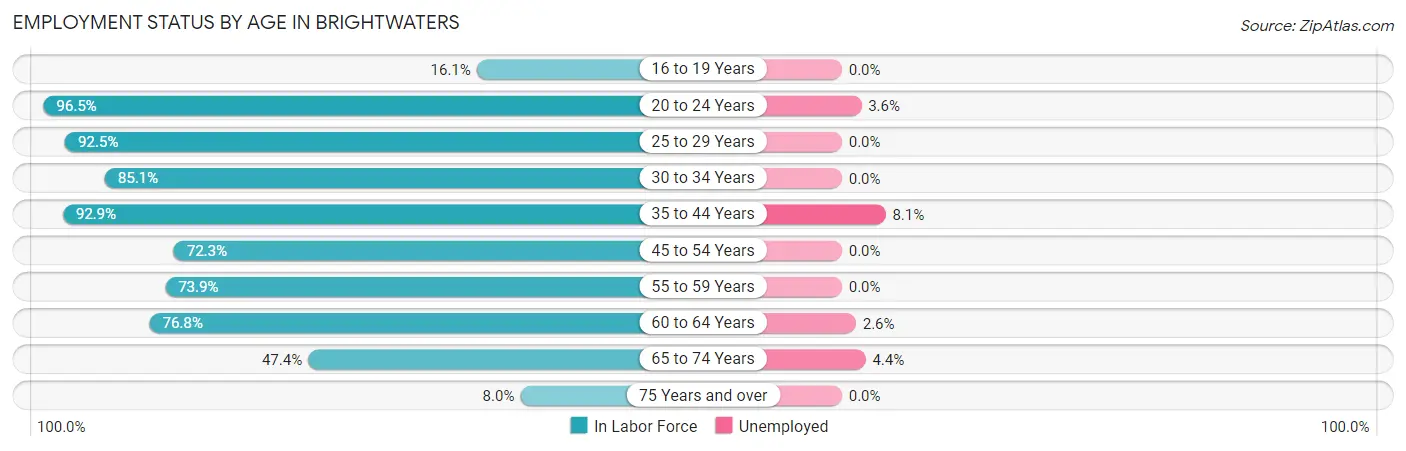
| Age Bracket | In Labor Force | Unemployed |
| 16 to 19 Years | 25 (16.1%) | 0 (0.0%) |
| 20 to 24 Years | 166 (96.5%) | 6 (3.6%) |
| 25 to 29 Years | 74 (92.5%) | 0 (0.0%) |
| 30 to 34 Years | 165 (85.1%) | 0 (0.0%) |
| 35 to 44 Years | 406 (92.9%) | 33 (8.1%) |
| 45 to 54 Years | 308 (72.3%) | 0 (0.0%) |
| 55 to 59 Years | 133 (73.9%) | 0 (0.0%) |
| 60 to 64 Years | 232 (76.8%) | 6 (2.6%) |
| 65 to 74 Years | 135 (47.4%) | 6 (4.4%) |
| 75 Years and over | 13 (8.0%) | 0 (0.0%) |
| Total | 1,657 (69.2%) | 51 (3.1%) |
Employment Status by Educational Attainment in Brightwaters
According to labor force statistics for Brightwaters, 81.4% of individuals (1,318) out of the total population between 25 and 64 years of age (1,619) are in the labor force, with 3.0% or 40 of them being unemployed. The group with the highest labor force participation rate are those with the educational attainment of less than high school, with 100.0% or 17 individuals in the labor force. Within the labor force, individuals with college / associate degree education have the highest percentage of unemployment, with 10.7% or 30 of them being unemployed.
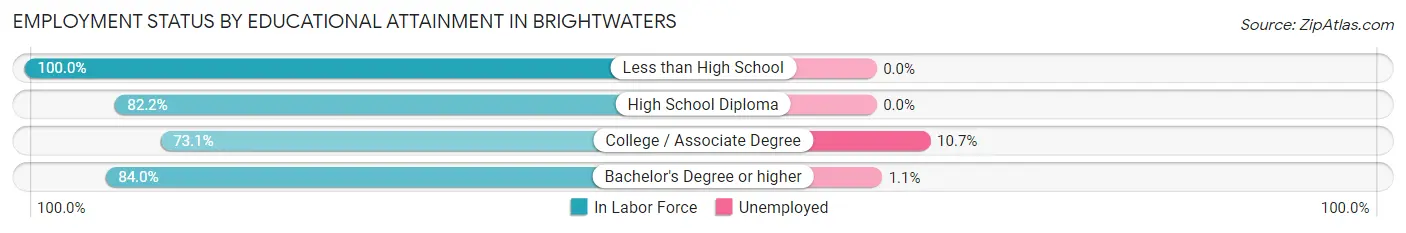
| Educational Attainment | In Labor Force | Unemployed |
| Less than High School | 17 (100.0%) | 0 (0.0%) |
| High School Diploma | 129 (82.2%) | 0 (0.0%) |
| College / Associate Degree | 277 (73.1%) | 41 (10.7%) |
| Bachelor's Degree or higher | 895 (84.0%) | 12 (1.1%) |
| Total | 1,318 (81.4%) | 49 (3.0%) |
Employment Occupations by Sex in Brightwaters
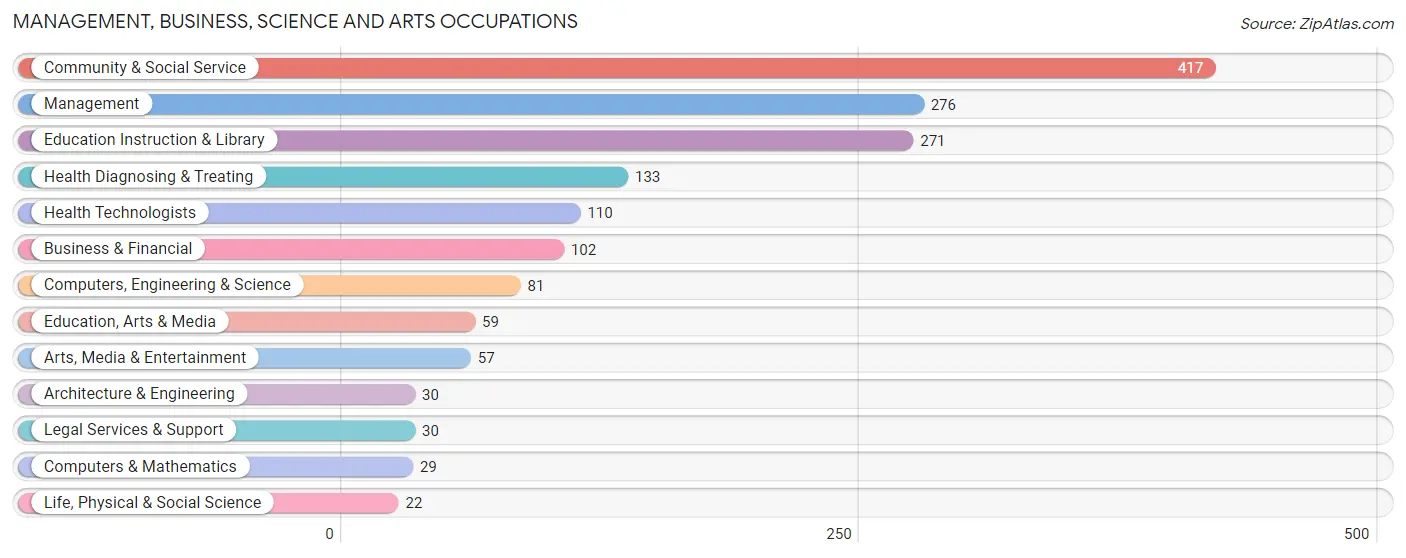
Management, Business, Science and Arts Occupations
The most common Management, Business, Science and Arts occupations in Brightwaters are Community & Social Service (417 | 26.1%), Management (276 | 17.2%), Education Instruction & Library (271 | 16.9%), Health Diagnosing & Treating (133 | 8.3%), and Health Technologists (110 | 6.9%).
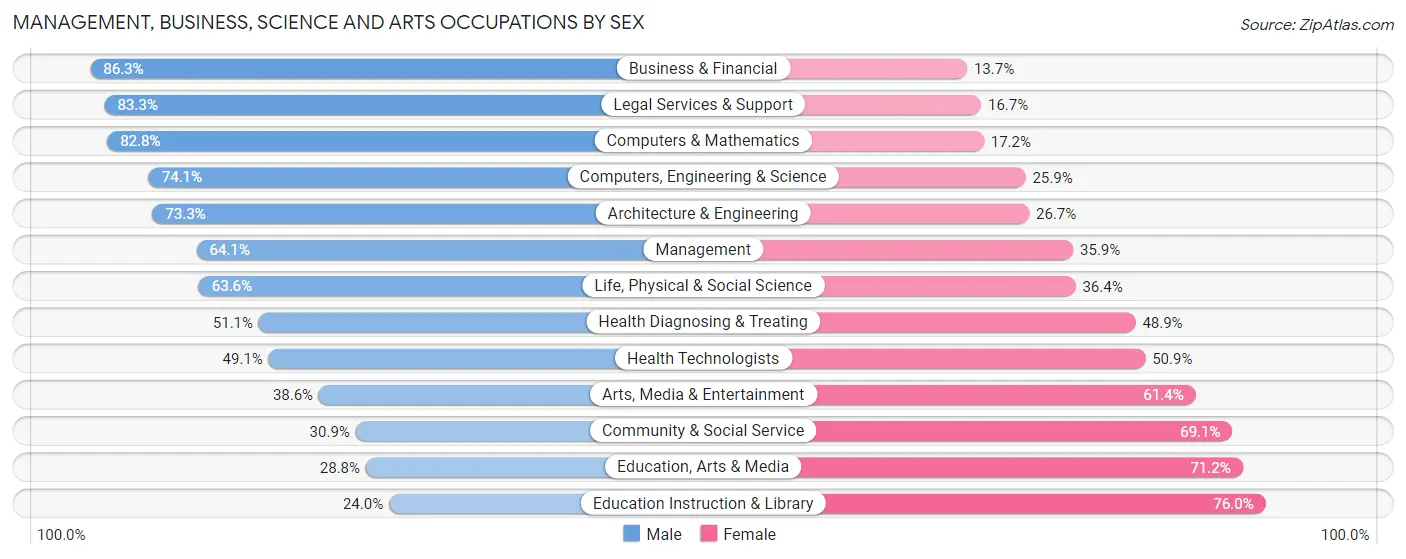
Management, Business, Science and Arts Occupations by Sex
Within the Management, Business, Science and Arts occupations in Brightwaters, the most male-oriented occupations are Business & Financial (86.3%), Legal Services & Support (83.3%), and Computers & Mathematics (82.8%), while the most female-oriented occupations are Education Instruction & Library (76.0%), Education, Arts & Media (71.2%), and Community & Social Service (69.1%).
| Occupation | Male | Female |
| Management | 177 (64.1%) | 99 (35.9%) |
| Business & Financial | 88 (86.3%) | 14 (13.7%) |
| Computers, Engineering & Science | 60 (74.1%) | 21 (25.9%) |
| Computers & Mathematics | 24 (82.8%) | 5 (17.2%) |
| Architecture & Engineering | 22 (73.3%) | 8 (26.7%) |
| Life, Physical & Social Science | 14 (63.6%) | 8 (36.4%) |
| Community & Social Service | 129 (30.9%) | 288 (69.1%) |
| Education, Arts & Media | 17 (28.8%) | 42 (71.2%) |
| Legal Services & Support | 25 (83.3%) | 5 (16.7%) |
| Education Instruction & Library | 65 (24.0%) | 206 (76.0%) |
| Arts, Media & Entertainment | 22 (38.6%) | 35 (61.4%) |
| Health Diagnosing & Treating | 68 (51.1%) | 65 (48.9%) |
| Health Technologists | 54 (49.1%) | 56 (50.9%) |
| Total (Category) | 522 (51.7%) | 487 (48.3%) |
| Total (Overall) | 866 (54.1%) | 735 (45.9%) |
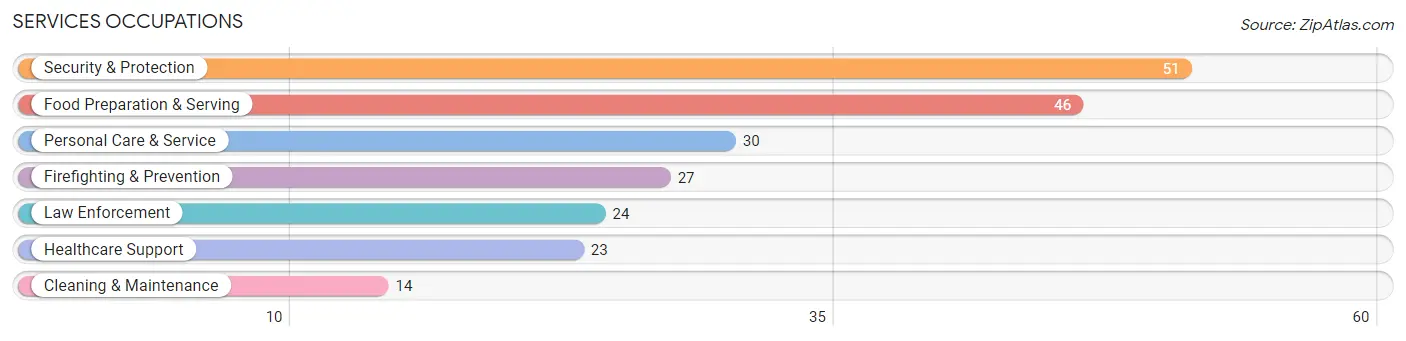
Services Occupations
The most common Services occupations in Brightwaters are Security & Protection (51 | 3.2%), Food Preparation & Serving (46 | 2.9%), Personal Care & Service (30 | 1.9%), Firefighting & Prevention (27 | 1.7%), and Law Enforcement (24 | 1.5%).
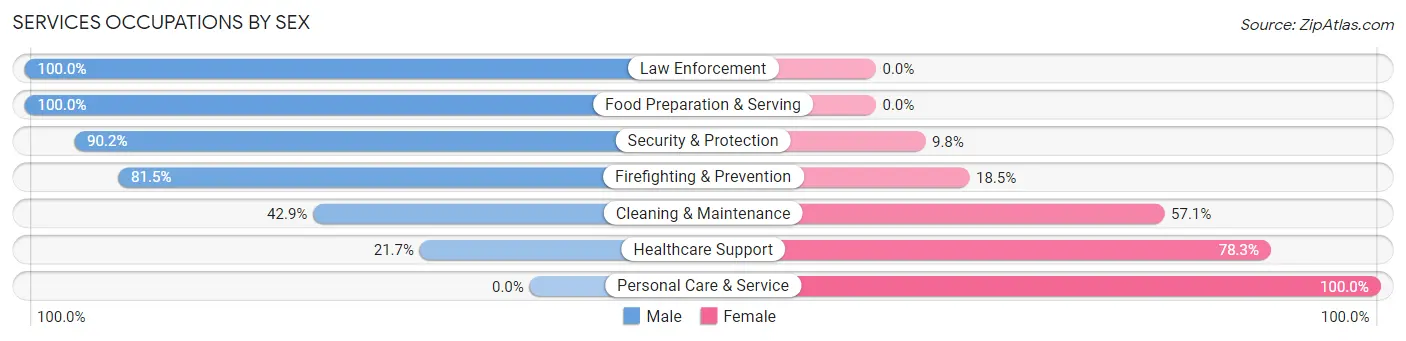
Services Occupations by Sex
Within the Services occupations in Brightwaters, the most male-oriented occupations are Law Enforcement (100.0%), Food Preparation & Serving (100.0%), and Security & Protection (90.2%), while the most female-oriented occupations are Personal Care & Service (100.0%), Healthcare Support (78.3%), and Cleaning & Maintenance (57.1%).
| Occupation | Male | Female |
| Healthcare Support | 5 (21.7%) | 18 (78.3%) |
| Security & Protection | 46 (90.2%) | 5 (9.8%) |
| Firefighting & Prevention | 22 (81.5%) | 5 (18.5%) |
| Law Enforcement | 24 (100.0%) | 0 (0.0%) |
| Food Preparation & Serving | 46 (100.0%) | 0 (0.0%) |
| Cleaning & Maintenance | 6 (42.9%) | 8 (57.1%) |
| Personal Care & Service | 0 (0.0%) | 30 (100.0%) |
| Total (Category) | 103 (62.8%) | 61 (37.2%) |
| Total (Overall) | 866 (54.1%) | 735 (45.9%) |
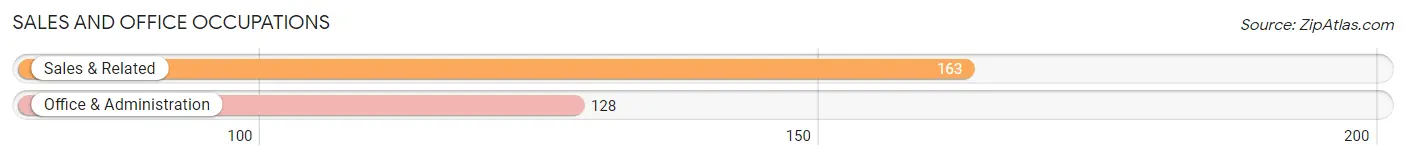
Sales and Office Occupations
The most common Sales and Office occupations in Brightwaters are Sales & Related (163 | 10.2%), and Office & Administration (128 | 8.0%).
Sales and Office Occupations by Sex
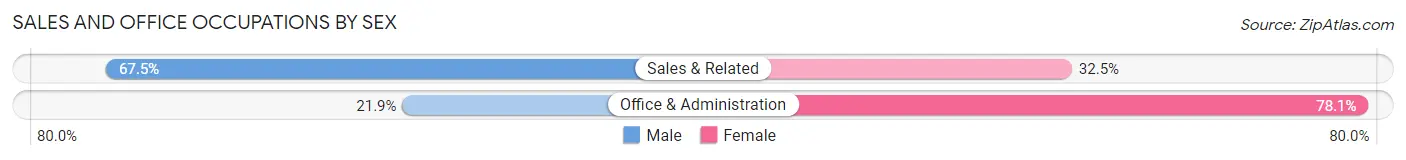
| Occupation | Male | Female |
| Sales & Related | 110 (67.5%) | 53 (32.5%) |
| Office & Administration | 28 (21.9%) | 100 (78.1%) |
| Total (Category) | 138 (47.4%) | 153 (52.6%) |
| Total (Overall) | 866 (54.1%) | 735 (45.9%) |
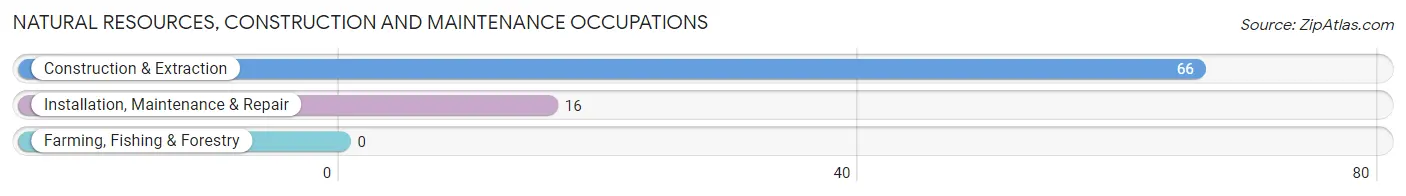
Natural Resources, Construction and Maintenance Occupations
The most common Natural Resources, Construction and Maintenance occupations in Brightwaters are Construction & Extraction (66 | 4.1%), and Installation, Maintenance & Repair (16 | 1.0%).
Natural Resources, Construction and Maintenance Occupations by Sex
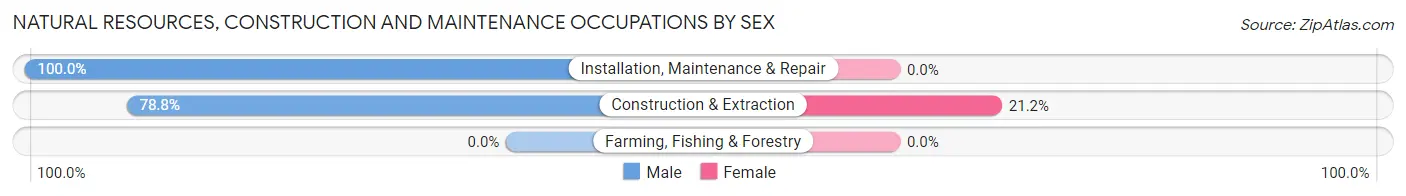
| Occupation | Male | Female |
| Farming, Fishing & Forestry | 0 (0.0%) | 0 (0.0%) |
| Construction & Extraction | 52 (78.8%) | 14 (21.2%) |
| Installation, Maintenance & Repair | 16 (100.0%) | 0 (0.0%) |
| Total (Category) | 68 (82.9%) | 14 (17.1%) |
| Total (Overall) | 866 (54.1%) | 735 (45.9%) |
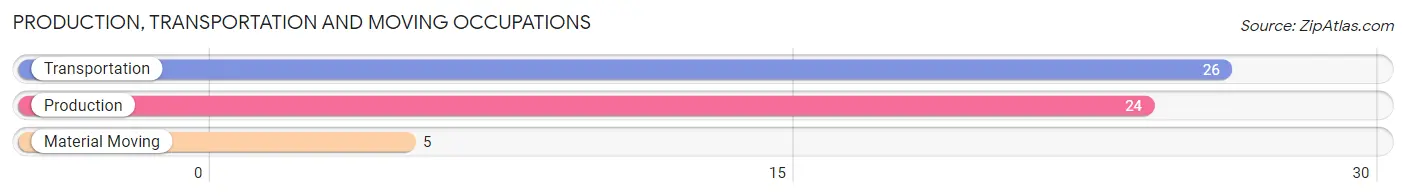
Production, Transportation and Moving Occupations
The most common Production, Transportation and Moving occupations in Brightwaters are Transportation (26 | 1.6%), Production (24 | 1.5%), and Material Moving (5 | 0.3%).
Production, Transportation and Moving Occupations by Sex
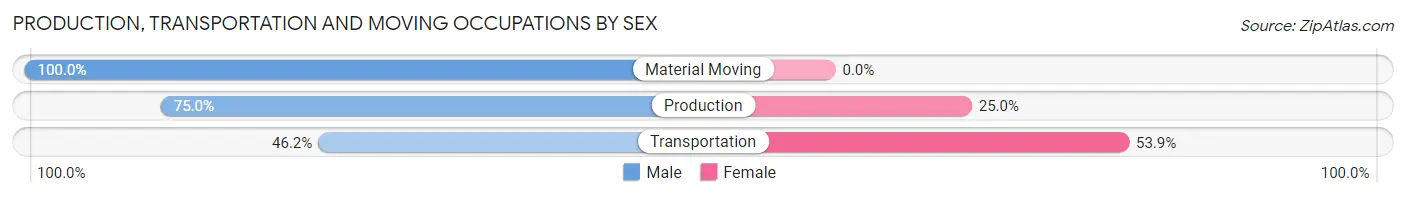
| Occupation | Male | Female |
| Production | 18 (75.0%) | 6 (25.0%) |
| Transportation | 12 (46.2%) | 14 (53.8%) |
| Material Moving | 5 (100.0%) | 0 (0.0%) |
| Total (Category) | 35 (63.6%) | 20 (36.4%) |
| Total (Overall) | 866 (54.1%) | 735 (45.9%) |
Employment Industries by Sex in Brightwaters
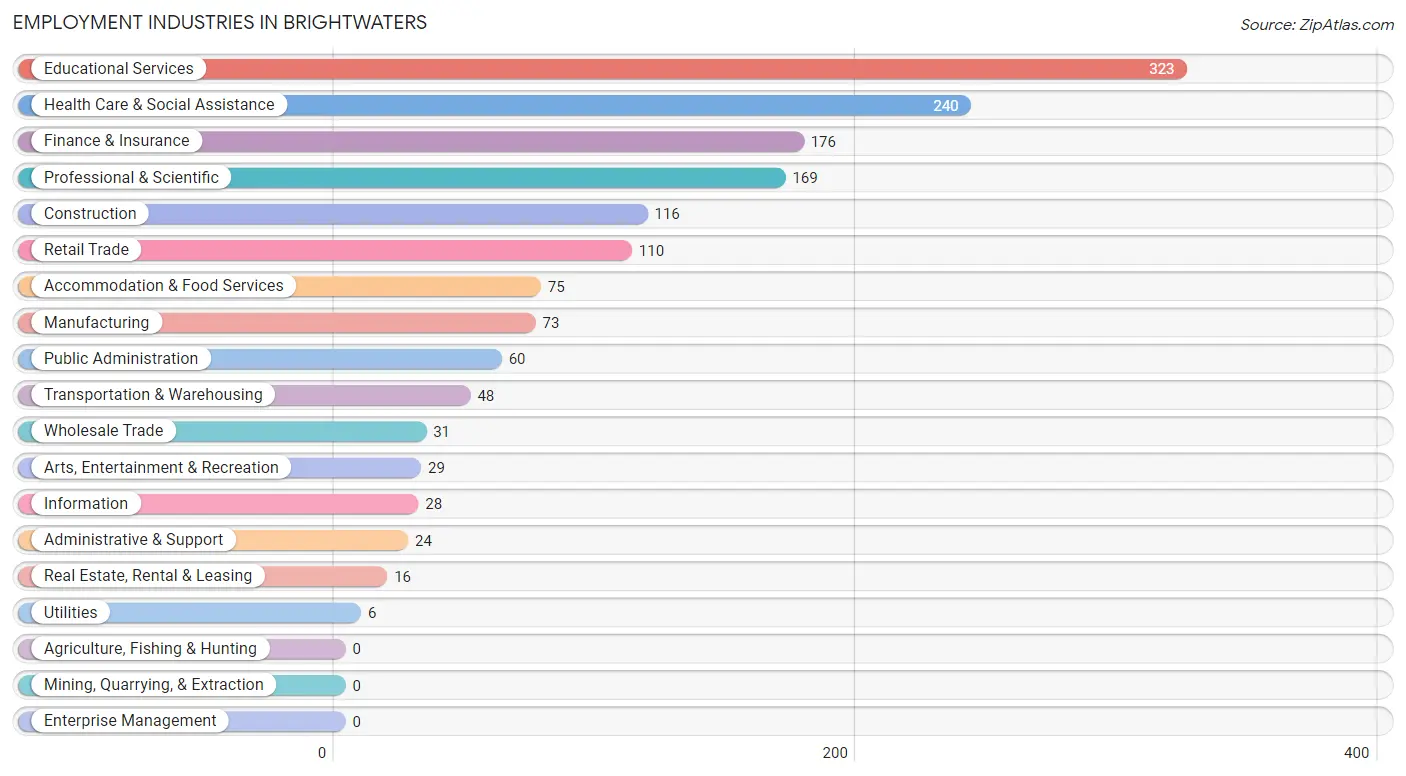
Employment Industries in Brightwaters
The major employment industries in Brightwaters include Educational Services (323 | 20.2%), Health Care & Social Assistance (240 | 15.0%), Finance & Insurance (176 | 11.0%), Professional & Scientific (169 | 10.6%), and Construction (116 | 7.2%).
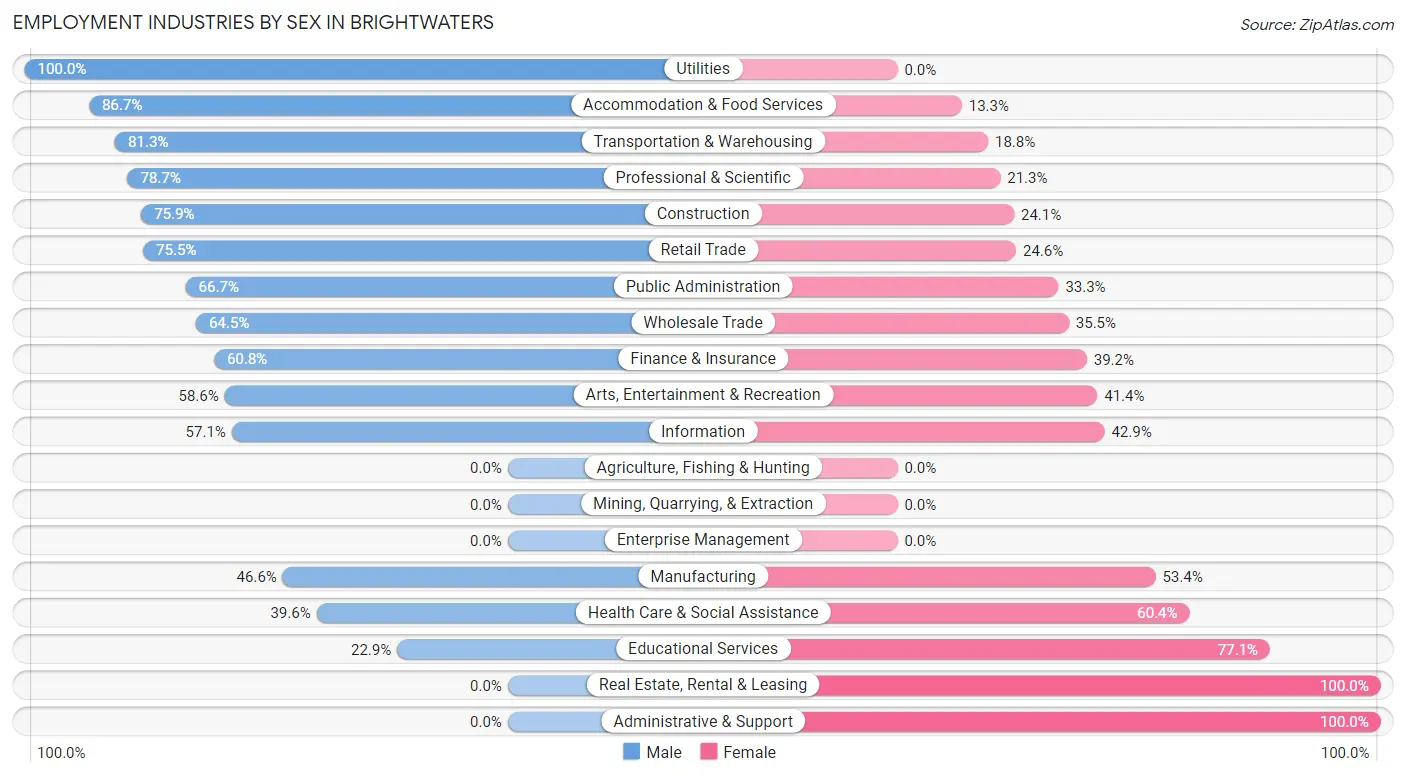
Employment Industries by Sex in Brightwaters
The Brightwaters industries that see more men than women are Utilities (100.0%), Accommodation & Food Services (86.7%), and Transportation & Warehousing (81.2%), whereas the industries that tend to have a higher number of women are Real Estate, Rental & Leasing (100.0%), Administrative & Support (100.0%), and Educational Services (77.1%).
| Industry | Male | Female |
| Agriculture, Fishing & Hunting | 0 (0.0%) | 0 (0.0%) |
| Mining, Quarrying, & Extraction | 0 (0.0%) | 0 (0.0%) |
| Construction | 88 (75.9%) | 28 (24.1%) |
| Manufacturing | 34 (46.6%) | 39 (53.4%) |
| Wholesale Trade | 20 (64.5%) | 11 (35.5%) |
| Retail Trade | 83 (75.4%) | 27 (24.5%) |
| Transportation & Warehousing | 39 (81.2%) | 9 (18.8%) |
| Utilities | 6 (100.0%) | 0 (0.0%) |
| Information | 16 (57.1%) | 12 (42.9%) |
| Finance & Insurance | 107 (60.8%) | 69 (39.2%) |
| Real Estate, Rental & Leasing | 0 (0.0%) | 16 (100.0%) |
| Professional & Scientific | 133 (78.7%) | 36 (21.3%) |
| Enterprise Management | 0 (0.0%) | 0 (0.0%) |
| Administrative & Support | 0 (0.0%) | 24 (100.0%) |
| Educational Services | 74 (22.9%) | 249 (77.1%) |
| Health Care & Social Assistance | 95 (39.6%) | 145 (60.4%) |
| Arts, Entertainment & Recreation | 17 (58.6%) | 12 (41.4%) |
| Accommodation & Food Services | 65 (86.7%) | 10 (13.3%) |
| Public Administration | 40 (66.7%) | 20 (33.3%) |
| Total | 866 (54.1%) | 735 (45.9%) |
Education in Brightwaters
School Enrollment in Brightwaters
The most common levels of schooling among the 973 students in Brightwaters are middle school (290 | 29.8%), high school (214 | 22.0%), and elementary school (190 | 19.5%).
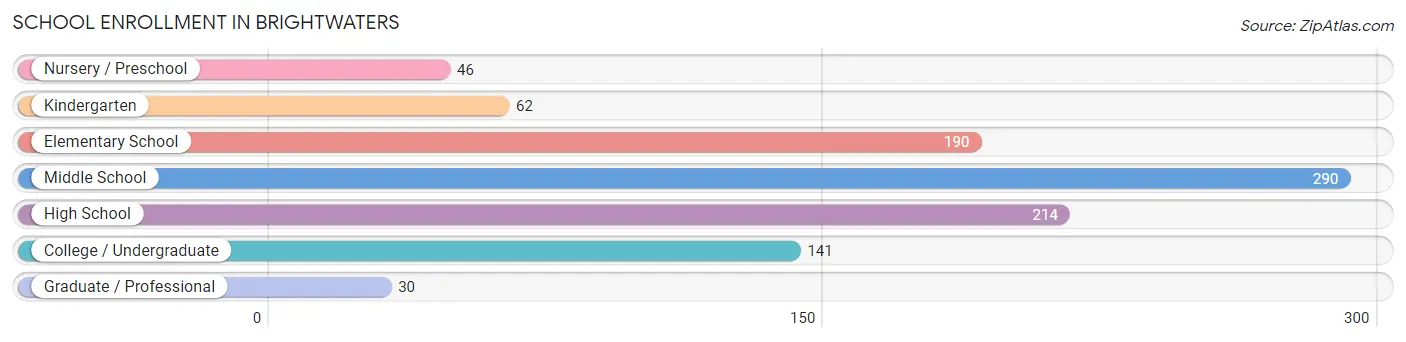
| School Level | # Students | % Students |
| Nursery / Preschool | 46 | 4.7% |
| Kindergarten | 62 | 6.4% |
| Elementary School | 190 | 19.5% |
| Middle School | 290 | 29.8% |
| High School | 214 | 22.0% |
| College / Undergraduate | 141 | 14.5% |
| Graduate / Professional | 30 | 3.1% |
| Total | 973 | 100.0% |
School Enrollment by Age by Funding Source in Brightwaters
Out of a total of 973 students who are enrolled in schools in Brightwaters, 114 (11.7%) attend a private institution, while the remaining 859 (88.3%) are enrolled in public schools. The age group of 25 to 34 year olds has the highest likelihood of being enrolled in private schools, with 5 (25.0% in the age bracket) enrolled. Conversely, the age group of 18 to 19 year olds has the lowest likelihood of being enrolled in a private school, with 34 (100.0% in the age bracket) attending a public institution.
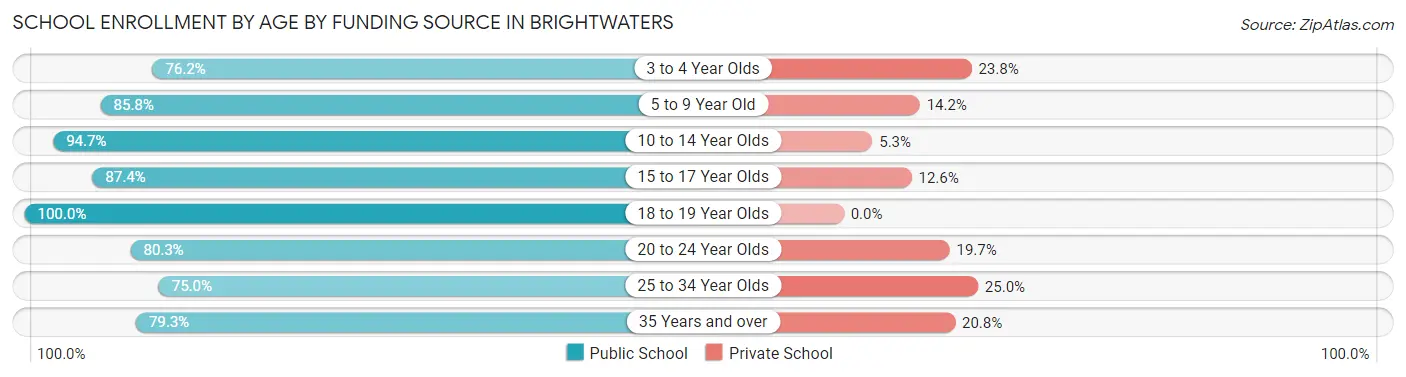
| Age Bracket | Public School | Private School |
| 3 to 4 Year Olds | 32 (76.2%) | 10 (23.8%) |
| 5 to 9 Year Old | 200 (85.8%) | 33 (14.2%) |
| 10 to 14 Year Olds | 320 (94.7%) | 18 (5.3%) |
| 15 to 17 Year Olds | 159 (87.4%) | 23 (12.6%) |
| 18 to 19 Year Olds | 34 (100.0%) | 0 (0.0%) |
| 20 to 24 Year Olds | 57 (80.3%) | 14 (19.7%) |
| 25 to 34 Year Olds | 15 (75.0%) | 5 (25.0%) |
| 35 Years and over | 42 (79.2%) | 11 (20.7%) |
| Total | 859 (88.3%) | 114 (11.7%) |
Educational Attainment by Field of Study in Brightwaters
Business (351 | 26.8%), education (200 | 15.3%), science & technology (139 | 10.6%), liberal arts & history (129 | 9.9%), and social sciences (83 | 6.3%) are the most common fields of study among 1,309 individuals in Brightwaters who have obtained a bachelor's degree or higher.
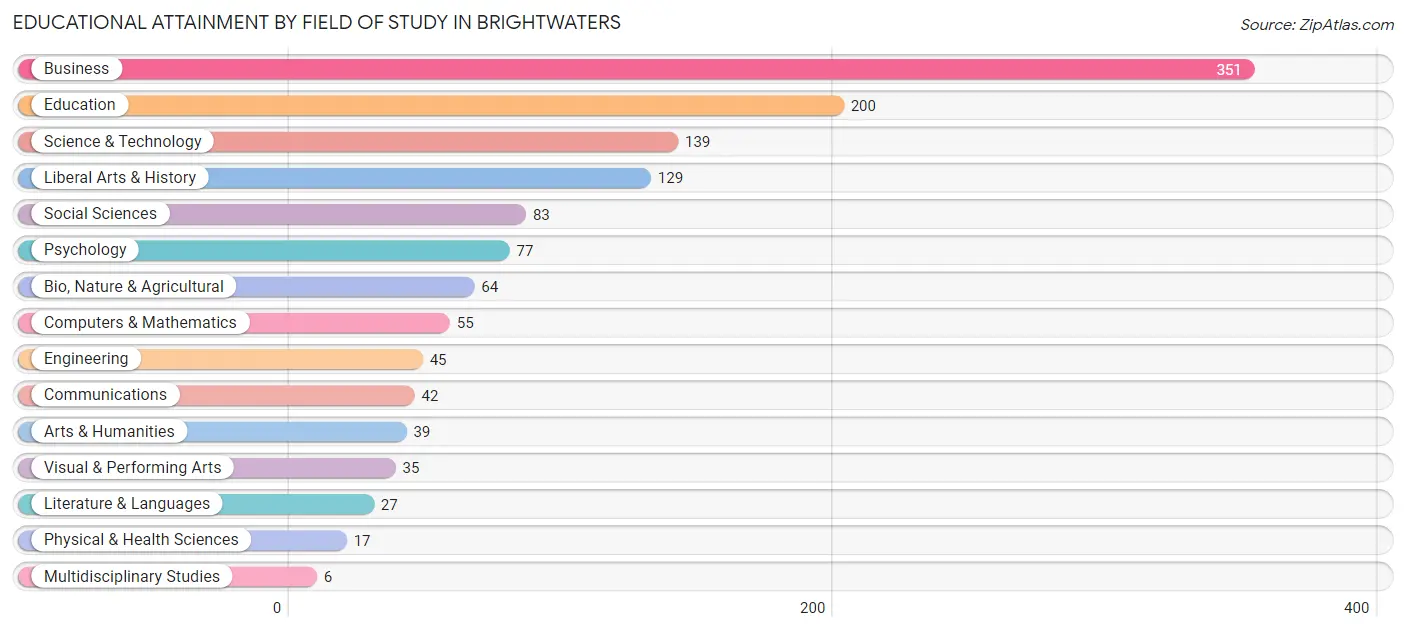
| Field of Study | # Graduates | % Graduates |
| Computers & Mathematics | 55 | 4.2% |
| Bio, Nature & Agricultural | 64 | 4.9% |
| Physical & Health Sciences | 17 | 1.3% |
| Psychology | 77 | 5.9% |
| Social Sciences | 83 | 6.3% |
| Engineering | 45 | 3.4% |
| Multidisciplinary Studies | 6 | 0.5% |
| Science & Technology | 139 | 10.6% |
| Business | 351 | 26.8% |
| Education | 200 | 15.3% |
| Literature & Languages | 27 | 2.1% |
| Liberal Arts & History | 129 | 9.9% |
| Visual & Performing Arts | 35 | 2.7% |
| Communications | 42 | 3.2% |
| Arts & Humanities | 39 | 3.0% |
| Total | 1,309 | 100.0% |
Transportation & Commute in Brightwaters
Vehicle Availability by Sex in Brightwaters
The most prevalent vehicle ownership categories in Brightwaters are males with 2 vehicles (423, accounting for 49.0%) and females with 2 vehicles (398, making up 59.8%).
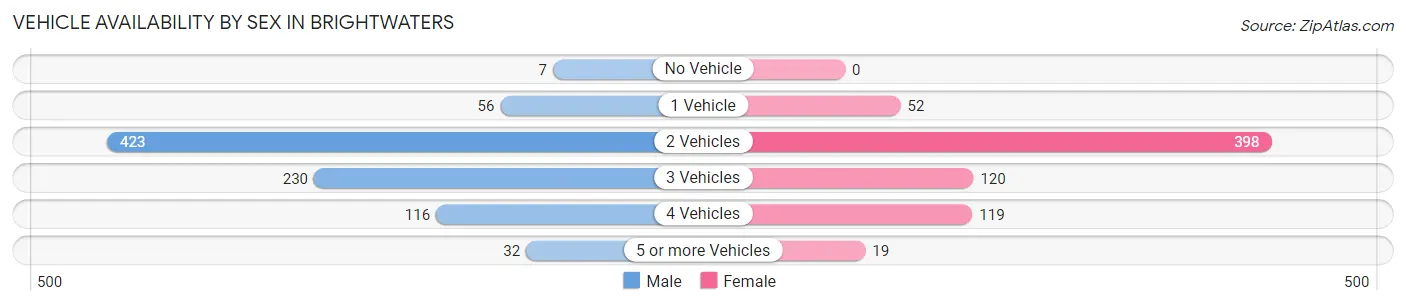
| Vehicles Available | Male | Female |
| No Vehicle | 7 (0.8%) | 0 (0.0%) |
| 1 Vehicle | 56 (6.5%) | 52 (7.3%) |
| 2 Vehicles | 423 (49.0%) | 398 (56.2%) |
| 3 Vehicles | 230 (26.6%) | 120 (17.0%) |
| 4 Vehicles | 116 (13.4%) | 119 (16.8%) |
| 5 or more Vehicles | 32 (3.7%) | 19 (2.7%) |
| Total | 864 (100.0%) | 708 (100.0%) |
Commute Time in Brightwaters
The most frequently occuring commute durations in Brightwaters are 10 to 14 minutes (206 commuters, 16.1%), 20 to 24 minutes (194 commuters, 15.1%), and 15 to 19 minutes (168 commuters, 13.1%).
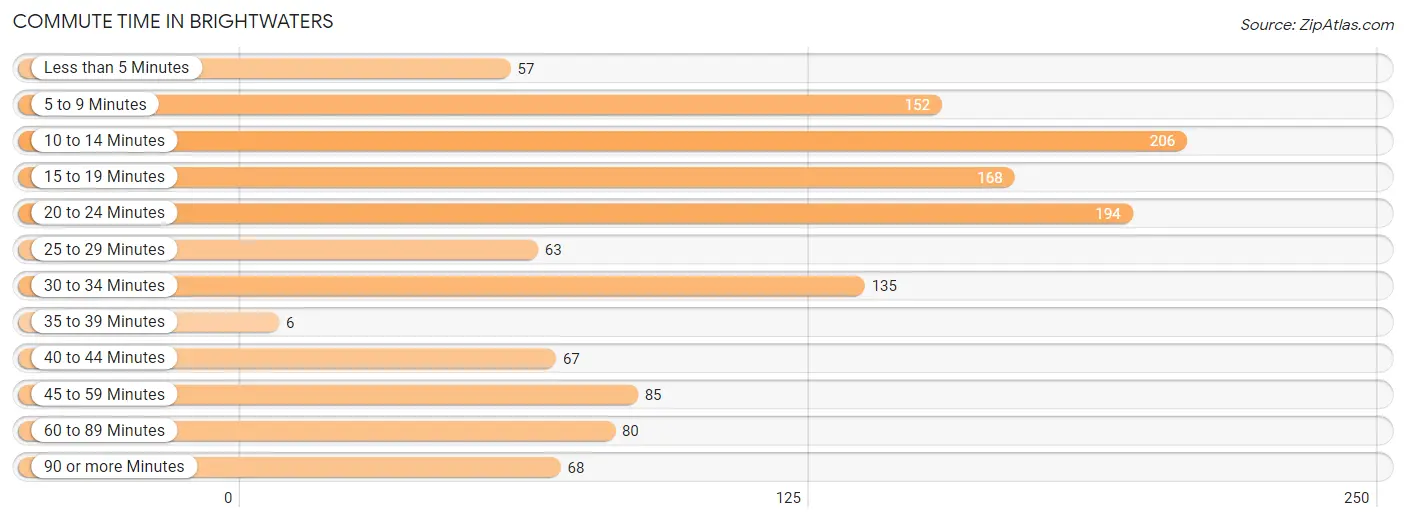
| Commute Time | # Commuters | % Commuters |
| Less than 5 Minutes | 57 | 4.4% |
| 5 to 9 Minutes | 152 | 11.9% |
| 10 to 14 Minutes | 206 | 16.1% |
| 15 to 19 Minutes | 168 | 13.1% |
| 20 to 24 Minutes | 194 | 15.1% |
| 25 to 29 Minutes | 63 | 4.9% |
| 30 to 34 Minutes | 135 | 10.5% |
| 35 to 39 Minutes | 6 | 0.5% |
| 40 to 44 Minutes | 67 | 5.2% |
| 45 to 59 Minutes | 85 | 6.6% |
| 60 to 89 Minutes | 80 | 6.2% |
| 90 or more Minutes | 68 | 5.3% |
Commute Time by Sex in Brightwaters
The most common commute times in Brightwaters are 20 to 24 minutes (111 commuters, 15.9%) for males and 10 to 14 minutes (114 commuters, 19.6%) for females.
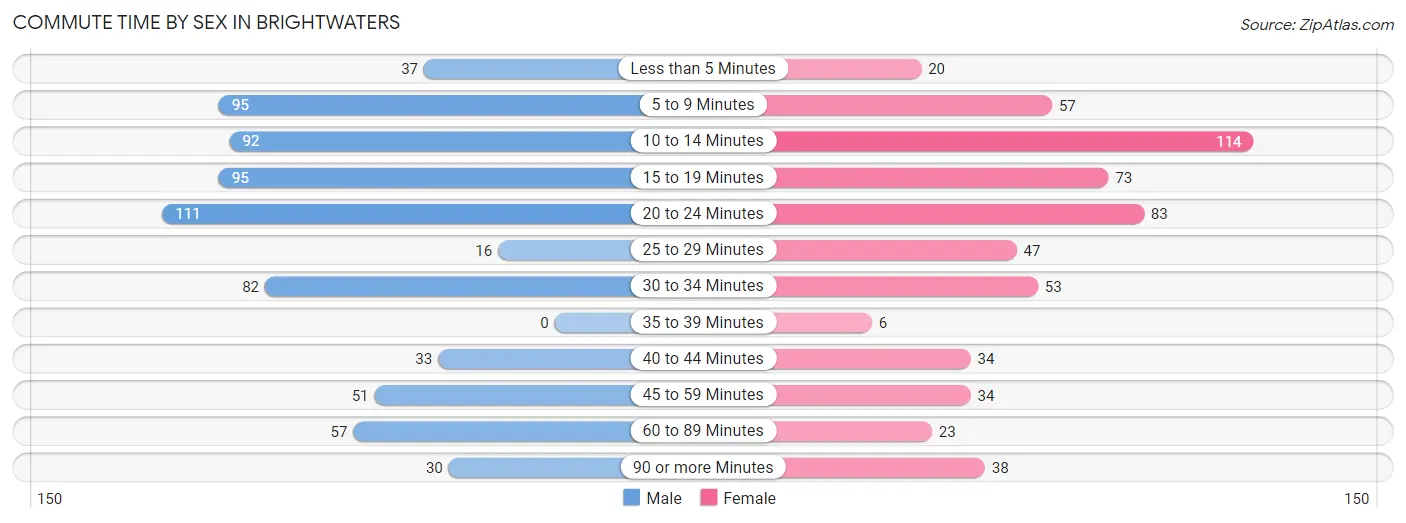
| Commute Time | Male | Female |
| Less than 5 Minutes | 37 (5.3%) | 20 (3.4%) |
| 5 to 9 Minutes | 95 (13.6%) | 57 (9.8%) |
| 10 to 14 Minutes | 92 (13.2%) | 114 (19.6%) |
| 15 to 19 Minutes | 95 (13.6%) | 73 (12.5%) |
| 20 to 24 Minutes | 111 (15.9%) | 83 (14.3%) |
| 25 to 29 Minutes | 16 (2.3%) | 47 (8.1%) |
| 30 to 34 Minutes | 82 (11.7%) | 53 (9.1%) |
| 35 to 39 Minutes | 0 (0.0%) | 6 (1.0%) |
| 40 to 44 Minutes | 33 (4.7%) | 34 (5.8%) |
| 45 to 59 Minutes | 51 (7.3%) | 34 (5.8%) |
| 60 to 89 Minutes | 57 (8.2%) | 23 (4.0%) |
| 90 or more Minutes | 30 (4.3%) | 38 (6.5%) |
Time of Departure to Work by Sex in Brightwaters
The most frequent times of departure to work in Brightwaters are 8:00 AM to 8:29 AM (186, 26.6%) for males and 8:00 AM to 8:29 AM (123, 21.1%) for females.
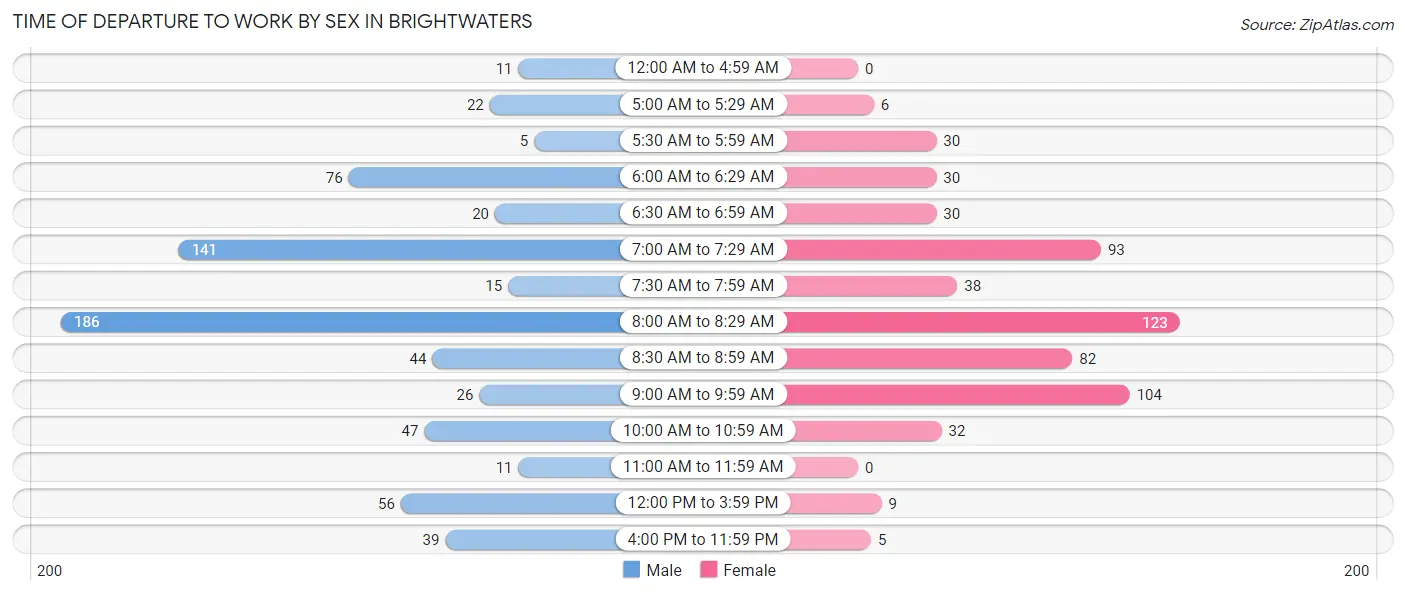
| Time of Departure | Male | Female |
| 12:00 AM to 4:59 AM | 11 (1.6%) | 0 (0.0%) |
| 5:00 AM to 5:29 AM | 22 (3.2%) | 6 (1.0%) |
| 5:30 AM to 5:59 AM | 5 (0.7%) | 30 (5.1%) |
| 6:00 AM to 6:29 AM | 76 (10.9%) | 30 (5.1%) |
| 6:30 AM to 6:59 AM | 20 (2.9%) | 30 (5.1%) |
| 7:00 AM to 7:29 AM | 141 (20.2%) | 93 (16.0%) |
| 7:30 AM to 7:59 AM | 15 (2.1%) | 38 (6.5%) |
| 8:00 AM to 8:29 AM | 186 (26.6%) | 123 (21.1%) |
| 8:30 AM to 8:59 AM | 44 (6.3%) | 82 (14.1%) |
| 9:00 AM to 9:59 AM | 26 (3.7%) | 104 (17.9%) |
| 10:00 AM to 10:59 AM | 47 (6.7%) | 32 (5.5%) |
| 11:00 AM to 11:59 AM | 11 (1.6%) | 0 (0.0%) |
| 12:00 PM to 3:59 PM | 56 (8.0%) | 9 (1.5%) |
| 4:00 PM to 11:59 PM | 39 (5.6%) | 5 (0.9%) |
| Total | 699 (100.0%) | 582 (100.0%) |
Housing Occupancy in Brightwaters
Occupancy by Ownership in Brightwaters
Of the total 1,020 dwellings in Brightwaters, owner-occupied units account for 964 (94.5%), while renter-occupied units make up 56 (5.5%).
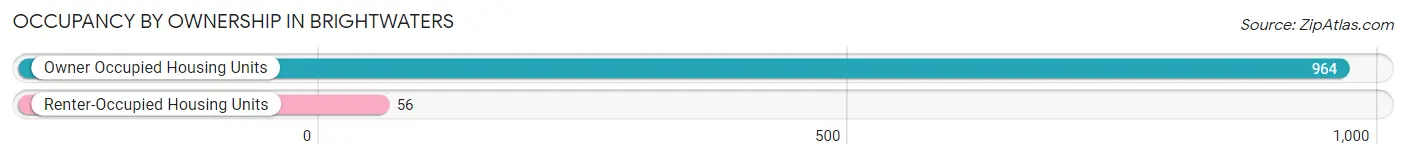
| Occupancy | # Housing Units | % Housing Units |
| Owner Occupied Housing Units | 964 | 94.5% |
| Renter-Occupied Housing Units | 56 | 5.5% |
| Total Occupied Housing Units | 1,020 | 100.0% |
Occupancy by Household Size in Brightwaters
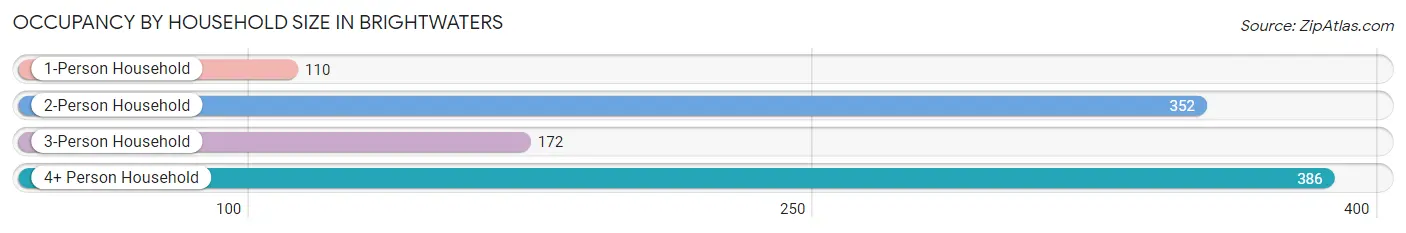
| Household Size | # Housing Units | % Housing Units |
| 1-Person Household | 110 | 10.8% |
| 2-Person Household | 352 | 34.5% |
| 3-Person Household | 172 | 16.9% |
| 4+ Person Household | 386 | 37.8% |
| Total Housing Units | 1,020 | 100.0% |
Occupancy by Ownership by Household Size in Brightwaters
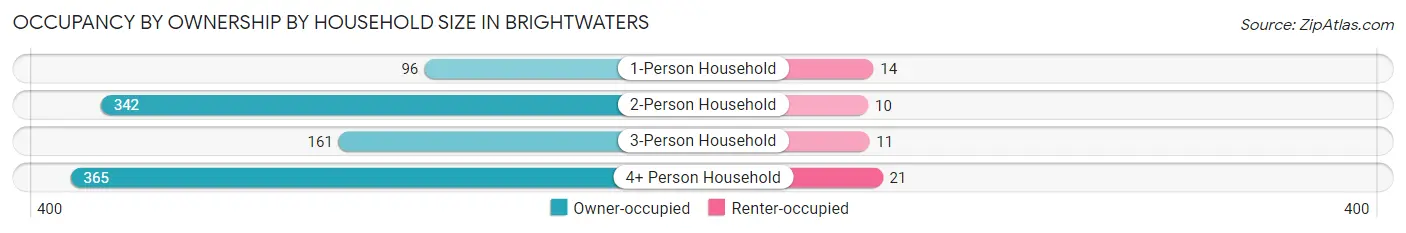
| Household Size | Owner-occupied | Renter-occupied |
| 1-Person Household | 96 (87.3%) | 14 (12.7%) |
| 2-Person Household | 342 (97.2%) | 10 (2.8%) |
| 3-Person Household | 161 (93.6%) | 11 (6.4%) |
| 4+ Person Household | 365 (94.6%) | 21 (5.4%) |
| Total Housing Units | 964 (94.5%) | 56 (5.5%) |
Occupancy by Educational Attainment in Brightwaters
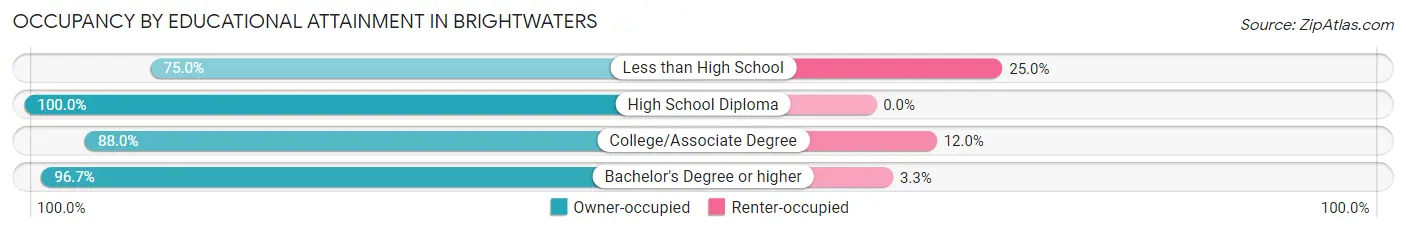
| Household Size | Owner-occupied | Renter-occupied |
| Less than High School | 18 (75.0%) | 6 (25.0%) |
| High School Diploma | 83 (100.0%) | 0 (0.0%) |
| College/Associate Degree | 198 (88.0%) | 27 (12.0%) |
| Bachelor's Degree or higher | 665 (96.7%) | 23 (3.3%) |
Occupancy by Age of Householder in Brightwaters
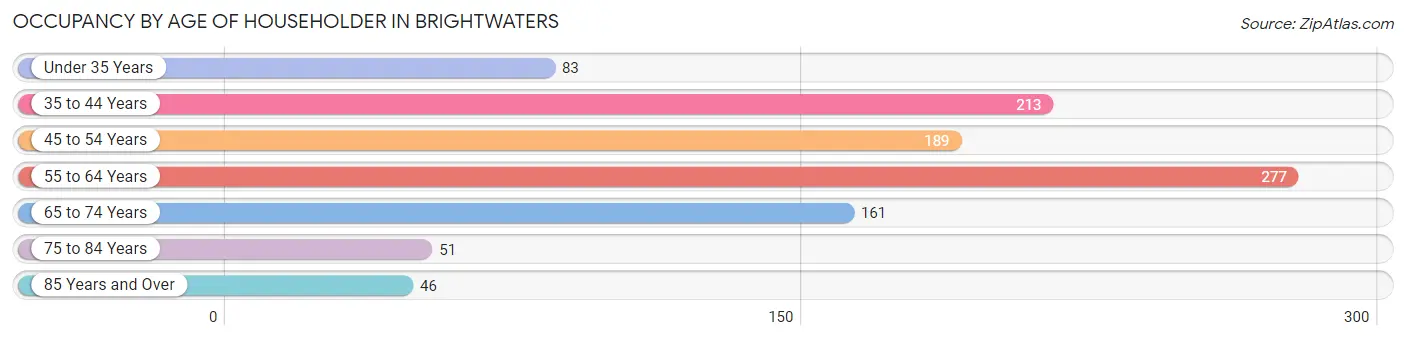
| Age Bracket | # Households | % Households |
| Under 35 Years | 83 | 8.1% |
| 35 to 44 Years | 213 | 20.9% |
| 45 to 54 Years | 189 | 18.5% |
| 55 to 64 Years | 277 | 27.2% |
| 65 to 74 Years | 161 | 15.8% |
| 75 to 84 Years | 51 | 5.0% |
| 85 Years and Over | 46 | 4.5% |
| Total | 1,020 | 100.0% |
Housing Finances in Brightwaters
Median Income by Occupancy in Brightwaters
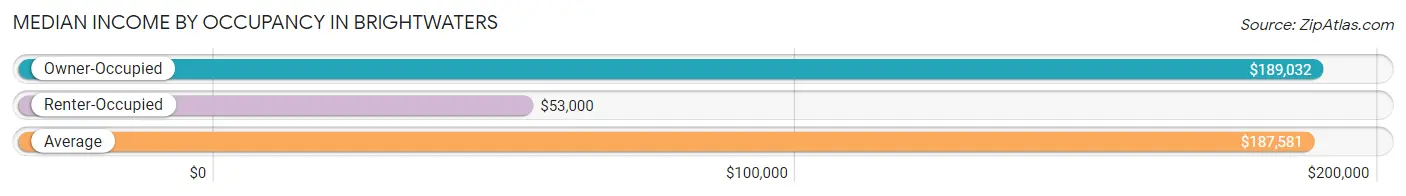
| Occupancy Type | # Households | Median Income |
| Owner-Occupied | 964 (94.5%) | $189,032 |
| Renter-Occupied | 56 (5.5%) | $53,000 |
| Average | 1,020 (100.0%) | $187,581 |
Occupancy by Householder Income Bracket in Brightwaters
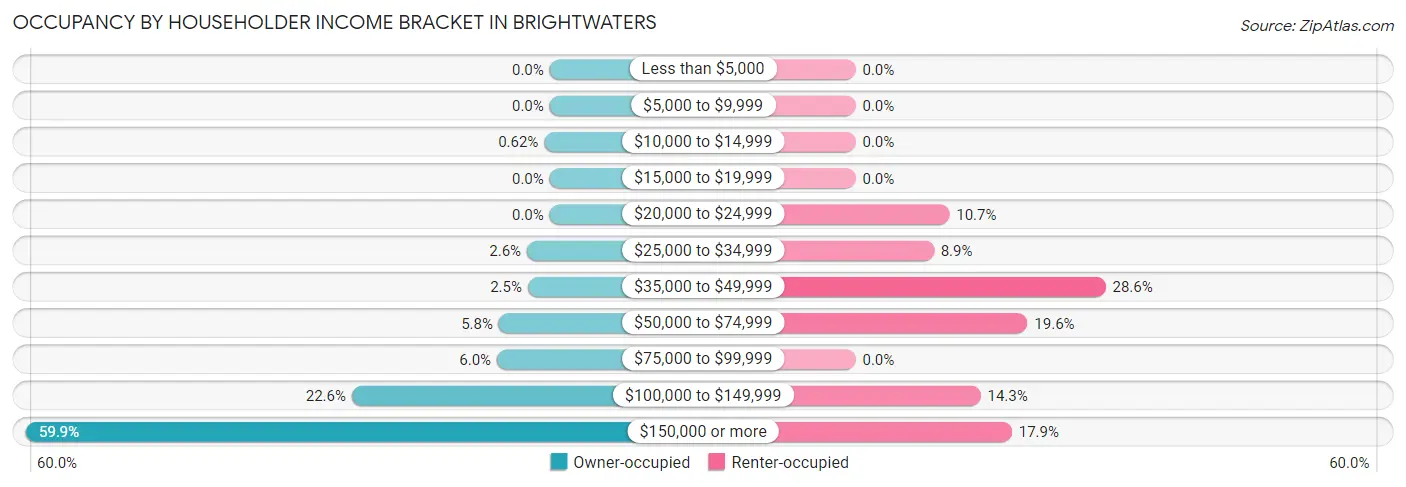
| Income Bracket | Owner-occupied | Renter-occupied |
| Less than $5,000 | 0 (0.0%) | 0 (0.0%) |
| $5,000 to $9,999 | 0 (0.0%) | 0 (0.0%) |
| $10,000 to $14,999 | 6 (0.6%) | 0 (0.0%) |
| $15,000 to $19,999 | 0 (0.0%) | 0 (0.0%) |
| $20,000 to $24,999 | 0 (0.0%) | 6 (10.7%) |
| $25,000 to $34,999 | 25 (2.6%) | 5 (8.9%) |
| $35,000 to $49,999 | 24 (2.5%) | 16 (28.6%) |
| $50,000 to $74,999 | 56 (5.8%) | 11 (19.6%) |
| $75,000 to $99,999 | 58 (6.0%) | 0 (0.0%) |
| $100,000 to $149,999 | 218 (22.6%) | 8 (14.3%) |
| $150,000 or more | 577 (59.9%) | 10 (17.9%) |
| Total | 964 (100.0%) | 56 (100.0%) |
Monthly Housing Cost Tiers in Brightwaters
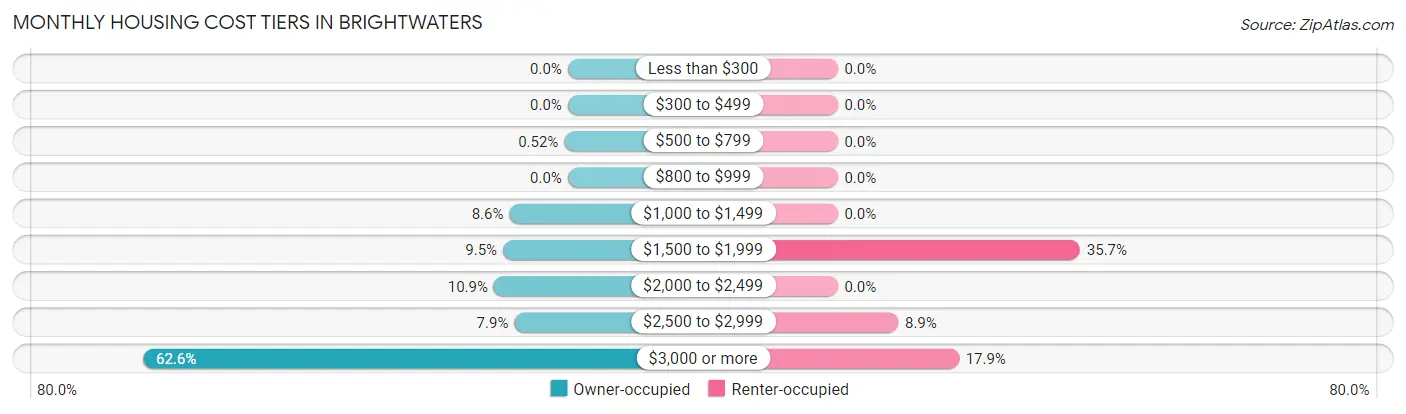
| Monthly Cost | Owner-occupied | Renter-occupied |
| Less than $300 | 0 (0.0%) | 0 (0.0%) |
| $300 to $499 | 0 (0.0%) | 0 (0.0%) |
| $500 to $799 | 5 (0.5%) | 0 (0.0%) |
| $800 to $999 | 0 (0.0%) | 0 (0.0%) |
| $1,000 to $1,499 | 83 (8.6%) | 0 (0.0%) |
| $1,500 to $1,999 | 92 (9.5%) | 20 (35.7%) |
| $2,000 to $2,499 | 105 (10.9%) | 0 (0.0%) |
| $2,500 to $2,999 | 76 (7.9%) | 5 (8.9%) |
| $3,000 or more | 603 (62.5%) | 10 (17.9%) |
| Total | 964 (100.0%) | 56 (100.0%) |
Physical Housing Characteristics in Brightwaters
Housing Structures in Brightwaters
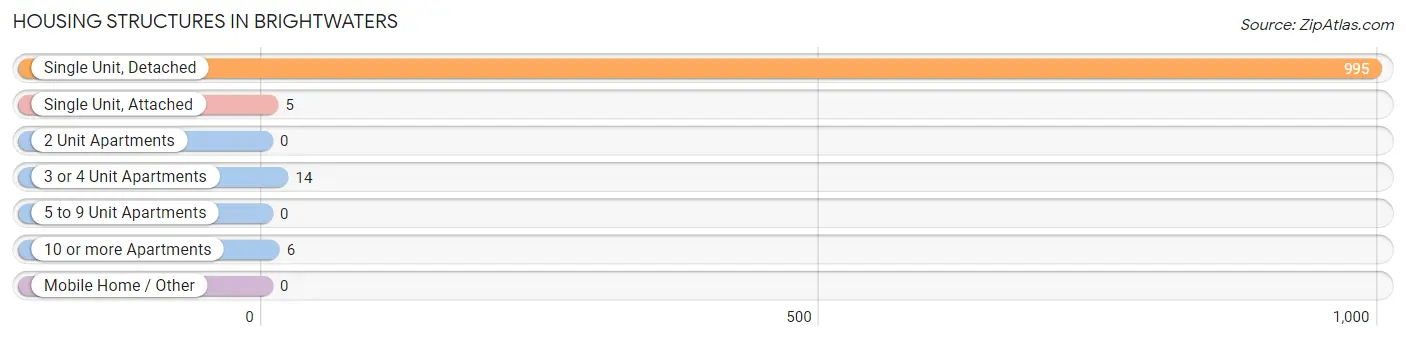
| Structure Type | # Housing Units | % Housing Units |
| Single Unit, Detached | 995 | 97.6% |
| Single Unit, Attached | 5 | 0.5% |
| 2 Unit Apartments | 0 | 0.0% |
| 3 or 4 Unit Apartments | 14 | 1.4% |
| 5 to 9 Unit Apartments | 0 | 0.0% |
| 10 or more Apartments | 6 | 0.6% |
| Mobile Home / Other | 0 | 0.0% |
| Total | 1,020 | 100.0% |
Housing Structures by Occupancy in Brightwaters
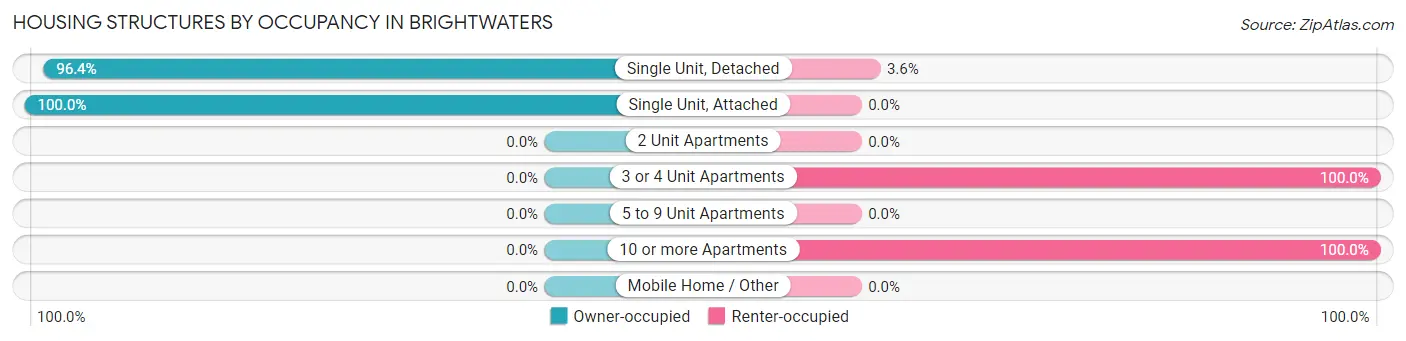
| Structure Type | Owner-occupied | Renter-occupied |
| Single Unit, Detached | 959 (96.4%) | 36 (3.6%) |
| Single Unit, Attached | 5 (100.0%) | 0 (0.0%) |
| 2 Unit Apartments | 0 (0.0%) | 0 (0.0%) |
| 3 or 4 Unit Apartments | 0 (0.0%) | 14 (100.0%) |
| 5 to 9 Unit Apartments | 0 (0.0%) | 0 (0.0%) |
| 10 or more Apartments | 0 (0.0%) | 6 (100.0%) |
| Mobile Home / Other | 0 (0.0%) | 0 (0.0%) |
| Total | 964 (94.5%) | 56 (5.5%) |
Housing Structures by Number of Rooms in Brightwaters
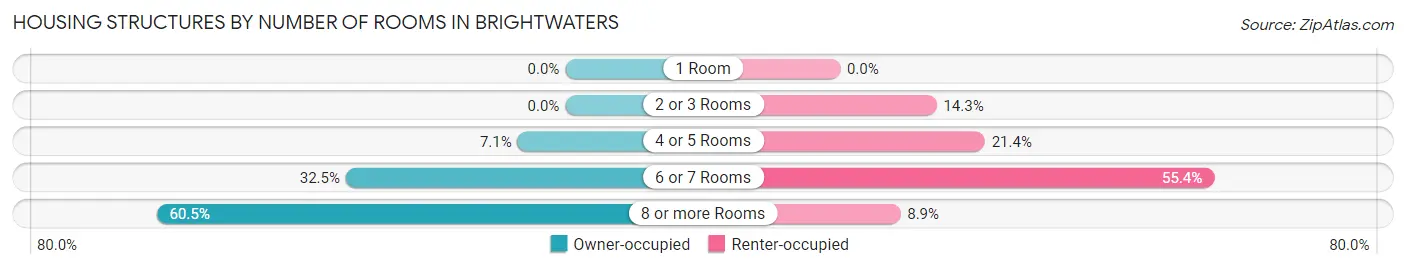
| Number of Rooms | Owner-occupied | Renter-occupied |
| 1 Room | 0 (0.0%) | 0 (0.0%) |
| 2 or 3 Rooms | 0 (0.0%) | 8 (14.3%) |
| 4 or 5 Rooms | 68 (7.0%) | 12 (21.4%) |
| 6 or 7 Rooms | 313 (32.5%) | 31 (55.4%) |
| 8 or more Rooms | 583 (60.5%) | 5 (8.9%) |
| Total | 964 (100.0%) | 56 (100.0%) |
Housing Structure by Heating Type in Brightwaters
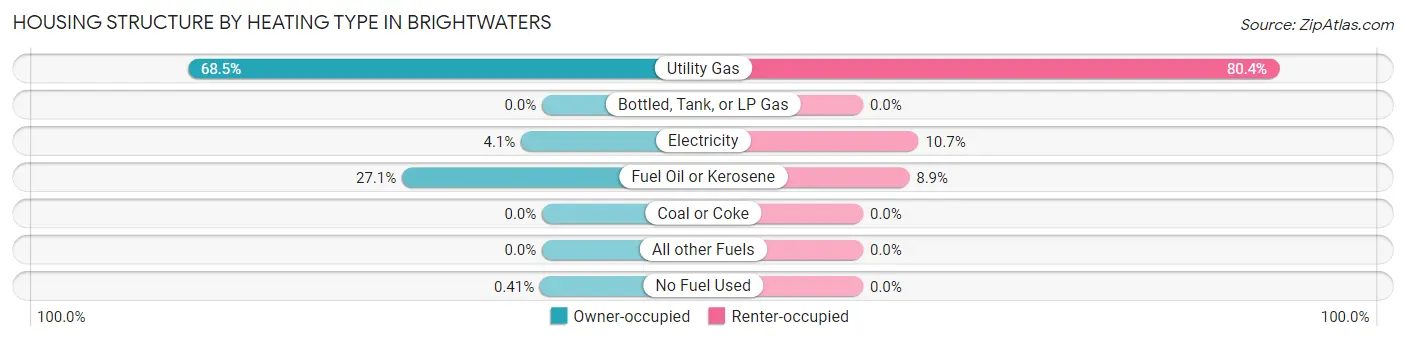
| Heating Type | Owner-occupied | Renter-occupied |
| Utility Gas | 660 (68.5%) | 45 (80.4%) |
| Bottled, Tank, or LP Gas | 0 (0.0%) | 0 (0.0%) |
| Electricity | 39 (4.1%) | 6 (10.7%) |
| Fuel Oil or Kerosene | 261 (27.1%) | 5 (8.9%) |
| Coal or Coke | 0 (0.0%) | 0 (0.0%) |
| All other Fuels | 0 (0.0%) | 0 (0.0%) |
| No Fuel Used | 4 (0.4%) | 0 (0.0%) |
| Total | 964 (100.0%) | 56 (100.0%) |
Household Vehicle Usage in Brightwaters
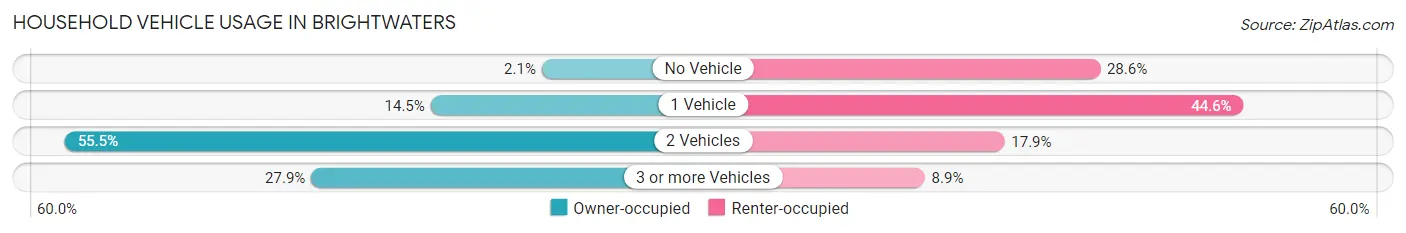
| Vehicles per Household | Owner-occupied | Renter-occupied |
| No Vehicle | 20 (2.1%) | 16 (28.6%) |
| 1 Vehicle | 140 (14.5%) | 25 (44.6%) |
| 2 Vehicles | 535 (55.5%) | 10 (17.9%) |
| 3 or more Vehicles | 269 (27.9%) | 5 (8.9%) |
| Total | 964 (100.0%) | 56 (100.0%) |
Real Estate & Mortgages in Brightwaters
Real Estate and Mortgage Overview in Brightwaters
| Characteristic | Without Mortgage | With Mortgage |
| Housing Units | 256 | 708 |
| Median Property Value | $617,300 | $696,000 |
| Median Household Income | $128,750 | $465 |
| Monthly Housing Costs | $1,501 | $598 |
| Real Estate Taxes | $10,001 | $22 |
Property Value by Mortgage Status in Brightwaters
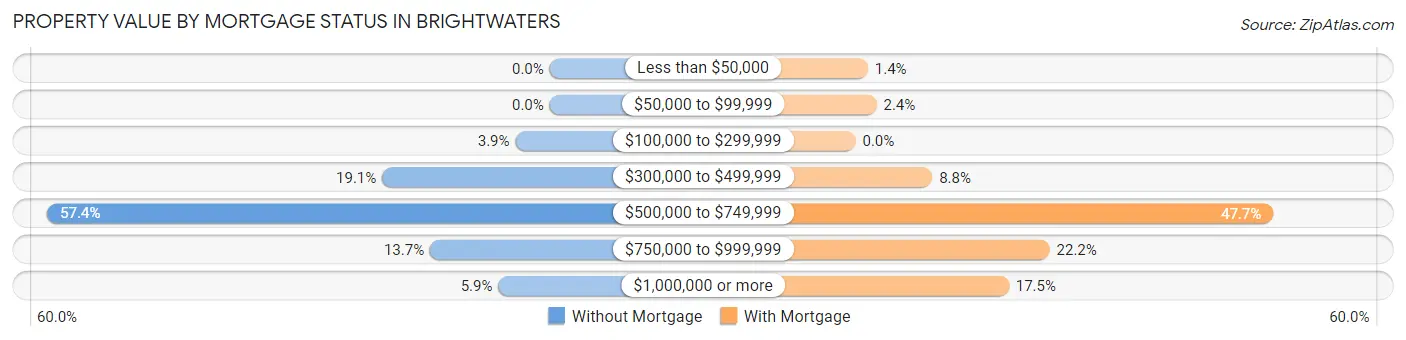
| Property Value | Without Mortgage | With Mortgage |
| Less than $50,000 | 0 (0.0%) | 10 (1.4%) |
| $50,000 to $99,999 | 0 (0.0%) | 17 (2.4%) |
| $100,000 to $299,999 | 10 (3.9%) | 0 (0.0%) |
| $300,000 to $499,999 | 49 (19.1%) | 62 (8.8%) |
| $500,000 to $749,999 | 147 (57.4%) | 338 (47.7%) |
| $750,000 to $999,999 | 35 (13.7%) | 157 (22.2%) |
| $1,000,000 or more | 15 (5.9%) | 124 (17.5%) |
| Total | 256 (100.0%) | 708 (100.0%) |
Household Income by Mortgage Status in Brightwaters
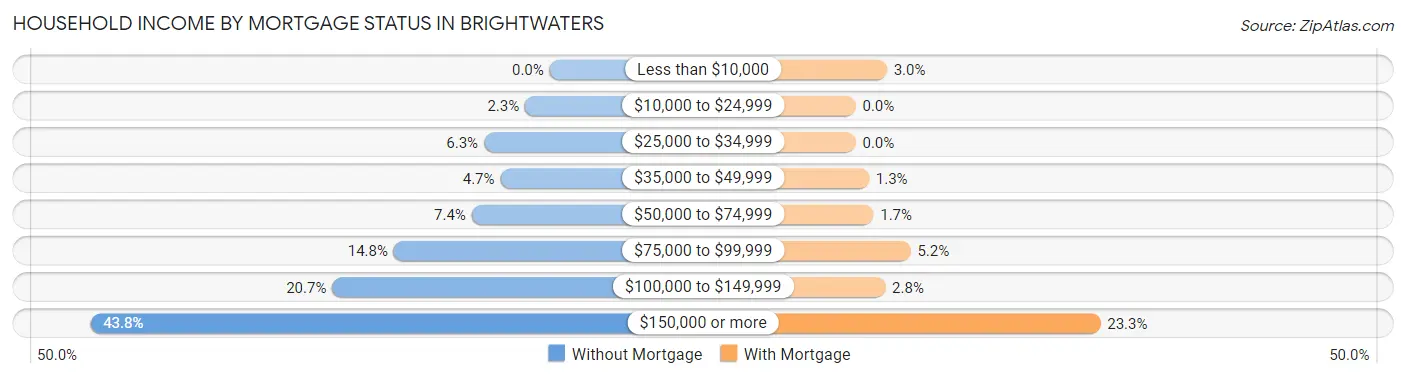
| Household Income | Without Mortgage | With Mortgage |
| Less than $10,000 | 0 (0.0%) | 21 (3.0%) |
| $10,000 to $24,999 | 6 (2.3%) | 0 (0.0%) |
| $25,000 to $34,999 | 16 (6.2%) | 0 (0.0%) |
| $35,000 to $49,999 | 12 (4.7%) | 9 (1.3%) |
| $50,000 to $74,999 | 19 (7.4%) | 12 (1.7%) |
| $75,000 to $99,999 | 38 (14.8%) | 37 (5.2%) |
| $100,000 to $149,999 | 53 (20.7%) | 20 (2.8%) |
| $150,000 or more | 112 (43.8%) | 165 (23.3%) |
| Total | 256 (100.0%) | 708 (100.0%) |
Property Value to Household Income Ratio in Brightwaters
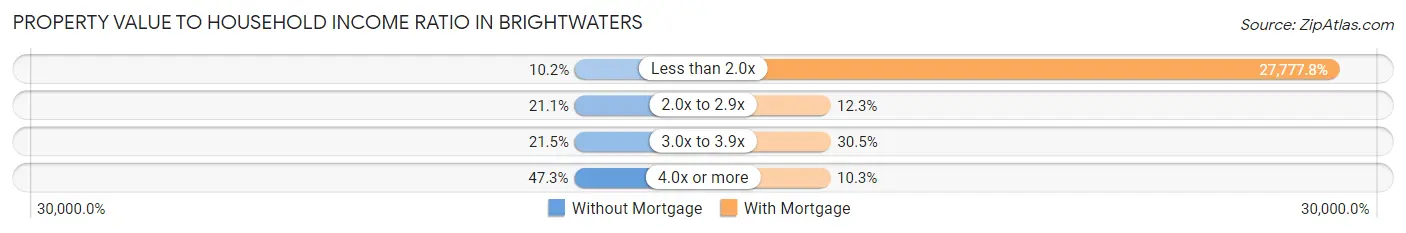
| Value-to-Income Ratio | Without Mortgage | With Mortgage |
| Less than 2.0x | 26 (10.2%) | 196,667 (27,777.8%) |
| 2.0x to 2.9x | 54 (21.1%) | 87 (12.3%) |
| 3.0x to 3.9x | 55 (21.5%) | 216 (30.5%) |
| 4.0x or more | 121 (47.3%) | 73 (10.3%) |
| Total | 256 (100.0%) | 708 (100.0%) |
Real Estate Taxes by Mortgage Status in Brightwaters
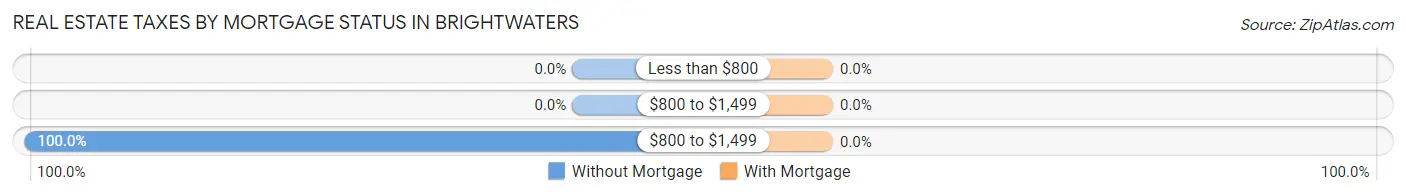
| Property Taxes | Without Mortgage | With Mortgage |
| Less than $800 | 0 (0.0%) | 0 (0.0%) |
| $800 to $1,499 | 0 (0.0%) | 0 (0.0%) |
| $800 to $1,499 | 256 (100.0%) | 0 (0.0%) |
| Total | 256 (100.0%) | 708 (100.0%) |
Health & Disability in Brightwaters
Health Insurance Coverage by Age in Brightwaters
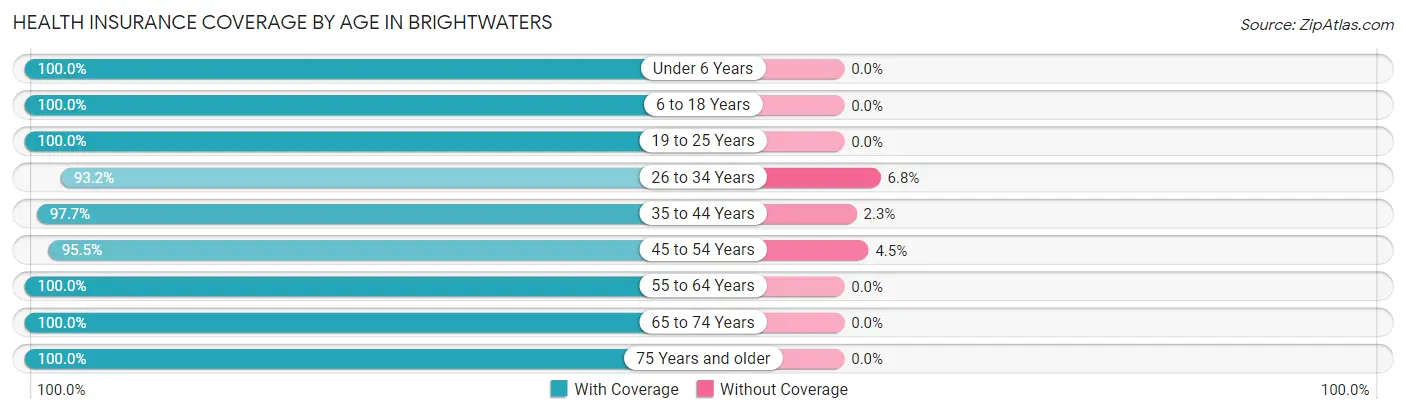
| Age Bracket | With Coverage | Without Coverage |
| Under 6 Years | 204 (100.0%) | 0 (0.0%) |
| 6 to 18 Years | 706 (100.0%) | 0 (0.0%) |
| 19 to 25 Years | 222 (100.0%) | 0 (0.0%) |
| 26 to 34 Years | 234 (93.2%) | 17 (6.8%) |
| 35 to 44 Years | 427 (97.7%) | 10 (2.3%) |
| 45 to 54 Years | 402 (95.5%) | 19 (4.5%) |
| 55 to 64 Years | 482 (100.0%) | 0 (0.0%) |
| 65 to 74 Years | 285 (100.0%) | 0 (0.0%) |
| 75 Years and older | 163 (100.0%) | 0 (0.0%) |
| Total | 3,125 (98.6%) | 46 (1.5%) |
Health Insurance Coverage by Citizenship Status in Brightwaters
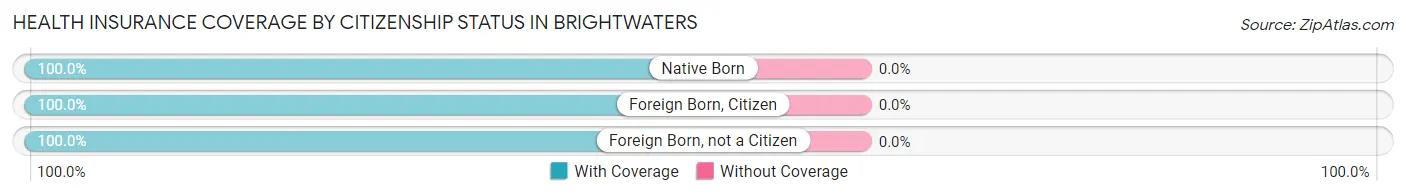
| Citizenship Status | With Coverage | Without Coverage |
| Native Born | 204 (100.0%) | 0 (0.0%) |
| Foreign Born, Citizen | 706 (100.0%) | 0 (0.0%) |
| Foreign Born, not a Citizen | 222 (100.0%) | 0 (0.0%) |
Health Insurance Coverage by Household Income in Brightwaters
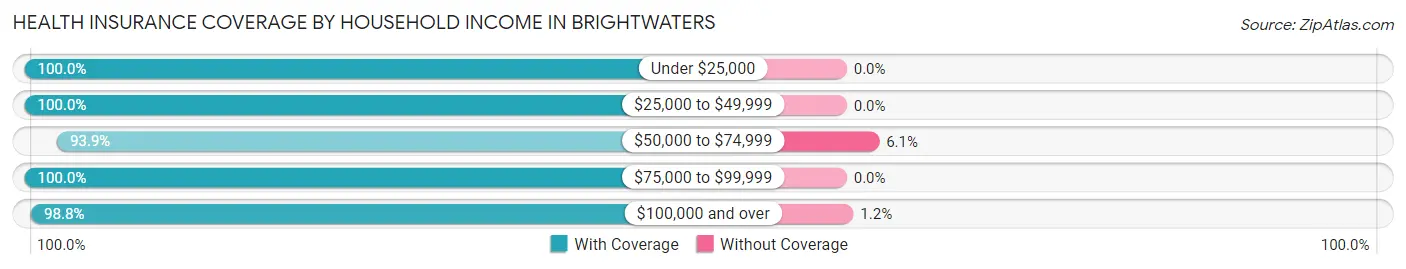
| Household Income | With Coverage | Without Coverage |
| Under $25,000 | 12 (100.0%) | 0 (0.0%) |
| $25,000 to $49,999 | 174 (100.0%) | 0 (0.0%) |
| $50,000 to $74,999 | 201 (93.9%) | 13 (6.1%) |
| $75,000 to $99,999 | 106 (100.0%) | 0 (0.0%) |
| $100,000 and over | 2,632 (98.8%) | 33 (1.2%) |
Public vs Private Health Insurance Coverage by Age in Brightwaters
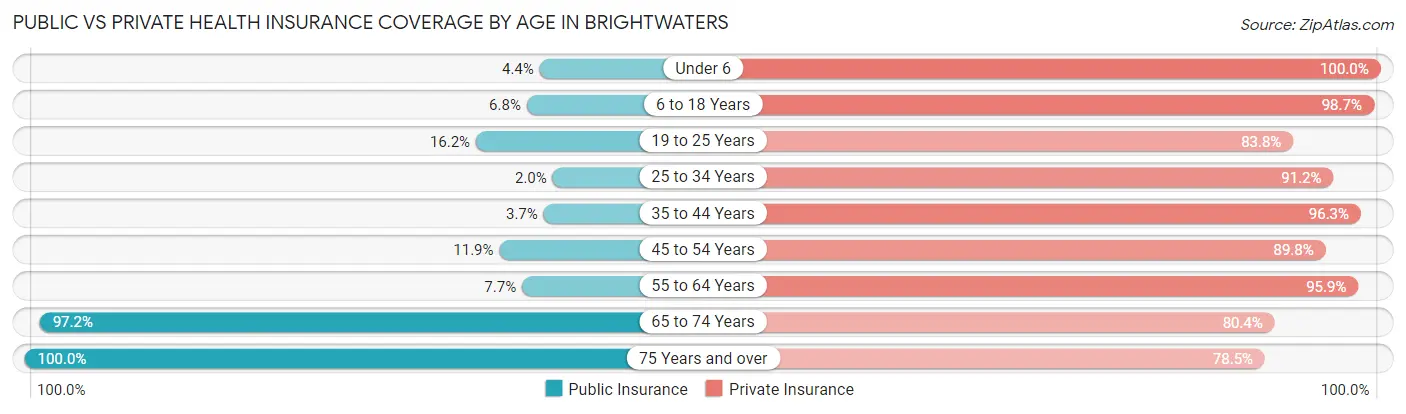
| Age Bracket | Public Insurance | Private Insurance |
| Under 6 | 9 (4.4%) | 204 (100.0%) |
| 6 to 18 Years | 48 (6.8%) | 697 (98.7%) |
| 19 to 25 Years | 36 (16.2%) | 186 (83.8%) |
| 25 to 34 Years | 5 (2.0%) | 229 (91.2%) |
| 35 to 44 Years | 16 (3.7%) | 421 (96.3%) |
| 45 to 54 Years | 50 (11.9%) | 378 (89.8%) |
| 55 to 64 Years | 37 (7.7%) | 462 (95.9%) |
| 65 to 74 Years | 277 (97.2%) | 229 (80.3%) |
| 75 Years and over | 163 (100.0%) | 128 (78.5%) |
| Total | 641 (20.2%) | 2,934 (92.5%) |
Disability Status by Sex by Age in Brightwaters
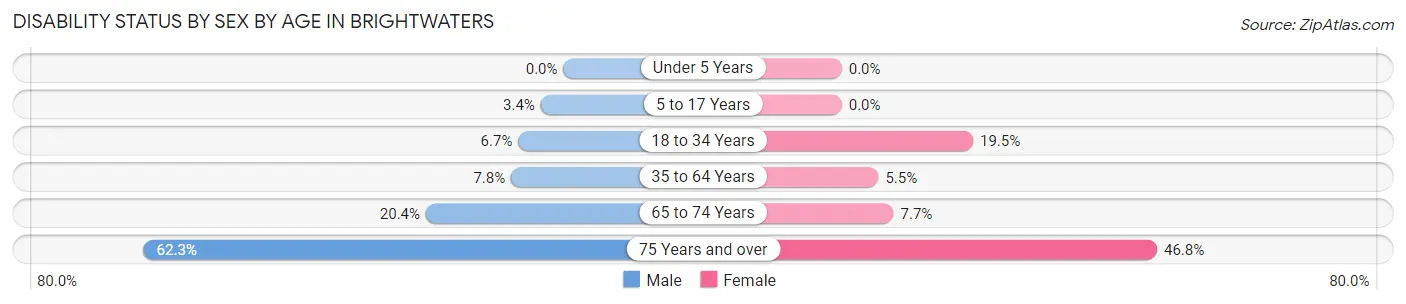
| Age Bracket | Male | Female |
| Under 5 Years | 0 (0.0%) | 0 (0.0%) |
| 5 to 17 Years | 12 (3.4%) | 0 (0.0%) |
| 18 to 34 Years | 14 (6.7%) | 54 (19.5%) |
| 35 to 64 Years | 57 (7.8%) | 33 (5.4%) |
| 65 to 74 Years | 29 (20.4%) | 11 (7.7%) |
| 75 Years and over | 43 (62.3%) | 44 (46.8%) |
Disability Class by Sex by Age in Brightwaters
Disability Class: Hearing Difficulty
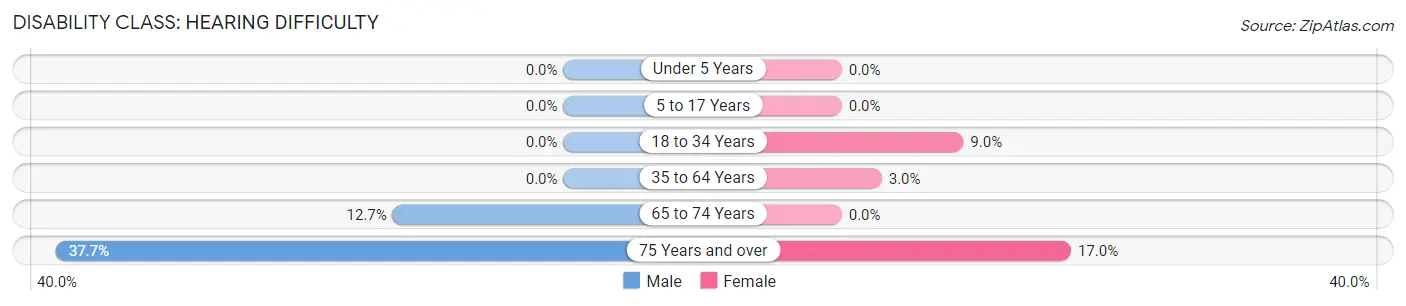
| Age Bracket | Male | Female |
| Under 5 Years | 0 (0.0%) | 0 (0.0%) |
| 5 to 17 Years | 0 (0.0%) | 0 (0.0%) |
| 18 to 34 Years | 0 (0.0%) | 25 (9.0%) |
| 35 to 64 Years | 0 (0.0%) | 18 (3.0%) |
| 65 to 74 Years | 18 (12.7%) | 0 (0.0%) |
| 75 Years and over | 26 (37.7%) | 16 (17.0%) |
Disability Class: Vision Difficulty
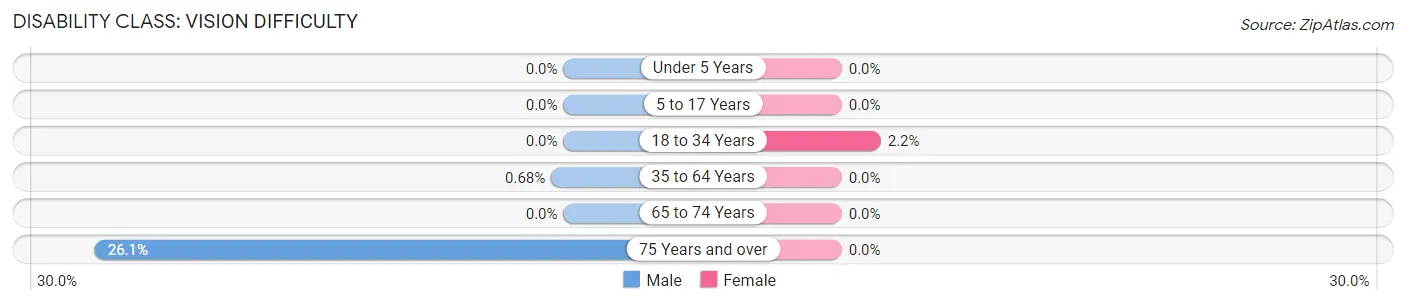
| Age Bracket | Male | Female |
| Under 5 Years | 0 (0.0%) | 0 (0.0%) |
| 5 to 17 Years | 0 (0.0%) | 0 (0.0%) |
| 18 to 34 Years | 0 (0.0%) | 6 (2.2%) |
| 35 to 64 Years | 5 (0.7%) | 0 (0.0%) |
| 65 to 74 Years | 0 (0.0%) | 0 (0.0%) |
| 75 Years and over | 18 (26.1%) | 0 (0.0%) |
Disability Class: Cognitive Difficulty
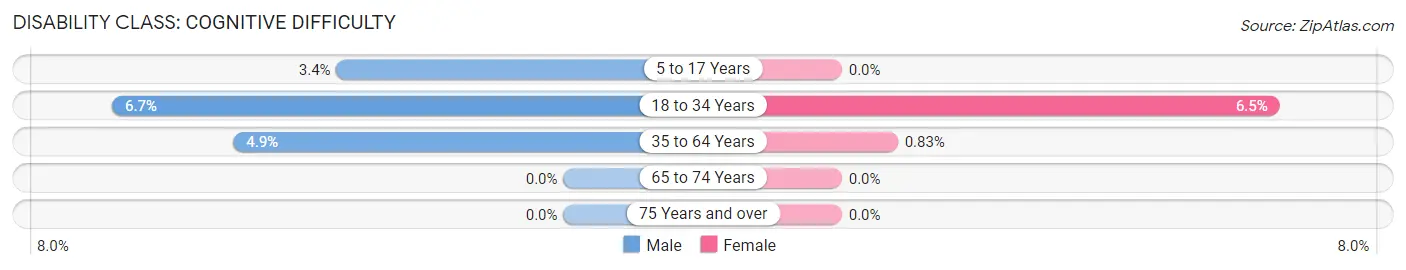
| Age Bracket | Male | Female |
| 5 to 17 Years | 12 (3.4%) | 0 (0.0%) |
| 18 to 34 Years | 14 (6.7%) | 18 (6.5%) |
| 35 to 64 Years | 36 (4.9%) | 5 (0.8%) |
| 65 to 74 Years | 0 (0.0%) | 0 (0.0%) |
| 75 Years and over | 0 (0.0%) | 0 (0.0%) |
Disability Class: Ambulatory Difficulty
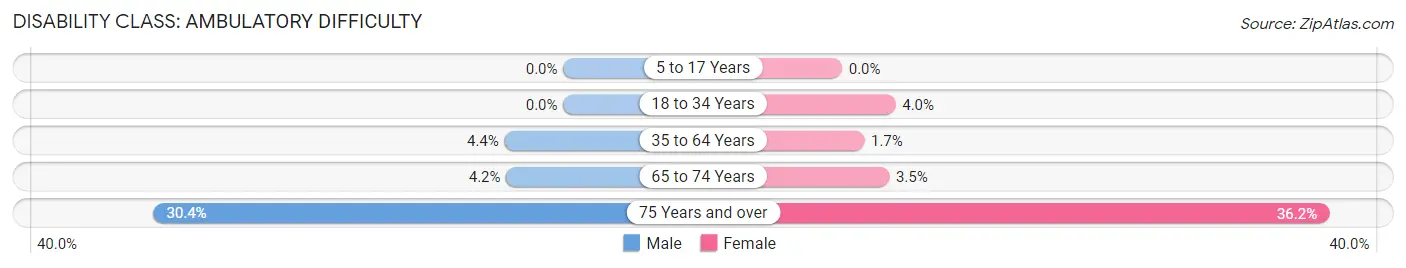
| Age Bracket | Male | Female |
| 5 to 17 Years | 0 (0.0%) | 0 (0.0%) |
| 18 to 34 Years | 0 (0.0%) | 11 (4.0%) |
| 35 to 64 Years | 32 (4.4%) | 10 (1.7%) |
| 65 to 74 Years | 6 (4.2%) | 5 (3.5%) |
| 75 Years and over | 21 (30.4%) | 34 (36.2%) |
Disability Class: Self-Care Difficulty
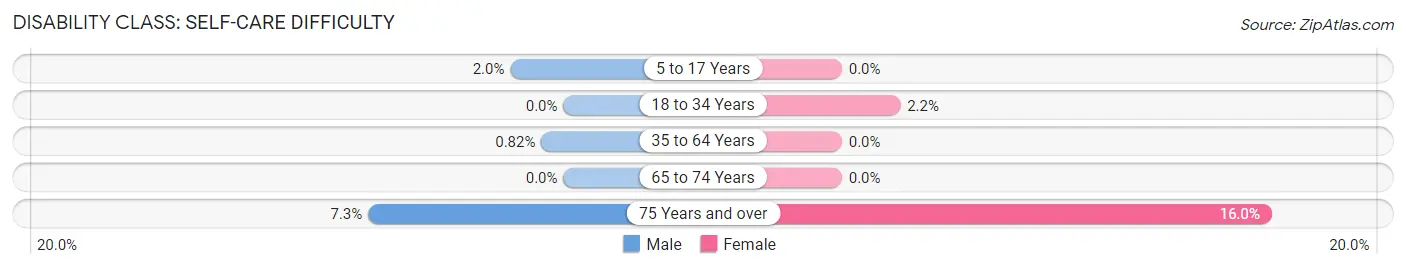
| Age Bracket | Male | Female |
| 5 to 17 Years | 7 (2.0%) | 0 (0.0%) |
| 18 to 34 Years | 0 (0.0%) | 6 (2.2%) |
| 35 to 64 Years | 6 (0.8%) | 0 (0.0%) |
| 65 to 74 Years | 0 (0.0%) | 0 (0.0%) |
| 75 Years and over | 5 (7.2%) | 15 (16.0%) |
Technology Access in Brightwaters
Computing Device Access in Brightwaters
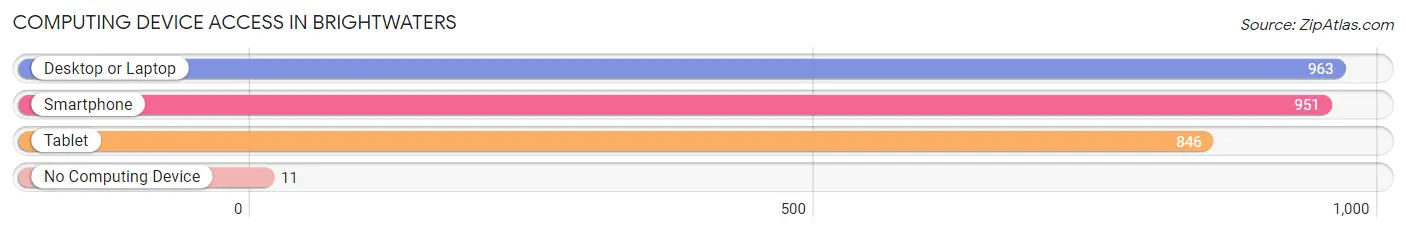
| Device Type | # Households | % Households |
| Desktop or Laptop | 963 | 94.4% |
| Smartphone | 951 | 93.2% |
| Tablet | 846 | 82.9% |
| No Computing Device | 11 | 1.1% |
| Total | 1,020 | 100.0% |
Internet Access in Brightwaters
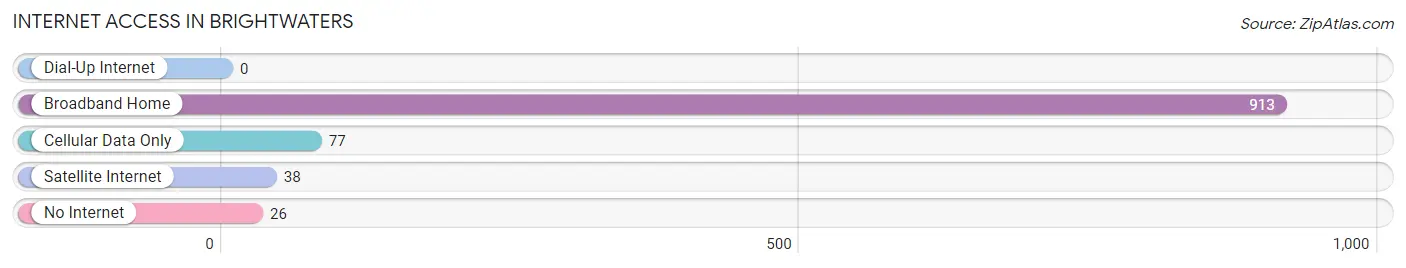
| Internet Type | # Households | % Households |
| Dial-Up Internet | 0 | 0.0% |
| Broadband Home | 913 | 89.5% |
| Cellular Data Only | 77 | 7.5% |
| Satellite Internet | 38 | 3.7% |
| No Internet | 26 | 2.5% |
| Total | 1,020 | 100.0% |
Brightwaters Summary
History
The hamlet of Brightwaters, New York is located in the Town of Islip in Suffolk County, New York. It is situated on the south shore of Long Island, approximately 40 miles east of New York City. The area was originally inhabited by the Secatogue Indians, who were part of the Algonquin Nation. The first European settlers arrived in the area in the late 1600s, and the hamlet was officially established in 1872.
The hamlet was originally known as West Islip, but was renamed Brightwaters in 1892. The name was chosen to reflect the sparkling waters of the nearby Great South Bay. The hamlet was a popular summer destination for wealthy New Yorkers, who built large estates along the bay. The area was also home to a number of resorts, including the Brightwaters Hotel, which opened in 1894.
The hamlet experienced a period of growth in the early 20th century, with the construction of the Long Island Rail Road station in 1910. This allowed for easy access to New York City, and the population of Brightwaters began to grow. The hamlet was incorporated in 1927, and the population continued to grow throughout the mid-20th century.
Geography
Brightwaters is located in the Town of Islip in Suffolk County, New York. It is situated on the south shore of Long Island, approximately 40 miles east of New York City. The hamlet is bordered by the Great South Bay to the north, the hamlet of Bay Shore to the east, the hamlet of West Islip to the south, and the hamlet of Islip to the west.
The hamlet has a total area of 2.2 square miles, all of which is land. The terrain is mostly flat, with some rolling hills in the northern part of the hamlet. The highest point in Brightwaters is located at the intersection of South Country Road and Brightwaters Boulevard, which is approximately 50 feet above sea level.
Economy
The economy of Brightwaters is largely based on tourism and retail. The hamlet is home to a number of small businesses, including restaurants, shops, and other services. The hamlet is also home to a number of marinas, which provide access to the Great South Bay.
The hamlet is also home to a number of corporate offices, including those of the Brightwaters Corporation, a real estate development company. The hamlet is also home to a number of medical offices, including those of the Brightwaters Medical Center.
Demographics
As of the 2010 census, the population of Brightwaters was 6,837. The population density was 3,093.3 people per square mile. The racial makeup of the hamlet was 87.3% White, 5.2% African American, 0.3% Native American, 2.7% Asian, 0.1% Pacific Islander, 1.7% from other races, and 2.8% from two or more races. Hispanic or Latino of any race were 6.3% of the population.
The median household income in Brightwaters was $90,945, and the median family income was $103,945. The per capita income was $41,945. About 3.2% of families and 4.3% of the population were below the poverty line, including 5.2% of those under age 18 and 4.2% of those age 65 or over.
Common Questions
What is Per Capita Income in Brightwaters?
Per Capita income in Brightwaters is $66,172.
What is the Median Family Income in Brightwaters?
Median Family Income in Brightwaters is $189,676.
What is the Median Household income in Brightwaters?
Median Household Income in Brightwaters is $187,581.
What is Income or Wage Gap in Brightwaters?
Income or Wage Gap in Brightwaters is 31.6%.
Women in Brightwaters earn 68.4 cents for every dollar earned by a man.
What is Inequality or Gini Index in Brightwaters?
Inequality or Gini Index in Brightwaters is 0.35.
What is the Total Population of Brightwaters?
Total Population of Brightwaters is 3,181.
What is the Total Male Population of Brightwaters?
Total Male Population of Brightwaters is 1,572.
What is the Total Female Population of Brightwaters?
Total Female Population of Brightwaters is 1,609.
What is the Ratio of Males per 100 Females in Brightwaters?
There are 97.70 Males per 100 Females in Brightwaters.
What is the Ratio of Females per 100 Males in Brightwaters?
There are 102.35 Females per 100 Males in Brightwaters.
What is the Median Population Age in Brightwaters?
Median Population Age in Brightwaters is 39.7 Years.
What is the Average Family Size in Brightwaters
Average Family Size in Brightwaters is 3.4 People.
What is the Average Household Size in Brightwaters
Average Household Size in Brightwaters is 3.1 People.
How Large is the Labor Force in Brightwaters?
There are 1,657 People in the Labor Forcein in Brightwaters.
What is the Percentage of People in the Labor Force in Brightwaters?
69.2% of People are in the Labor Force in Brightwaters.
What is the Unemployment Rate in Brightwaters?
Unemployment Rate in Brightwaters is 3.1%.