Millerton, NY Map & Demographics
Millerton Map
Millerton Overview
$38,253
PER CAPITA INCOME
$88,194
AVG FAMILY INCOME
$78,953
AVG HOUSEHOLD INCOME
2.3%
WAGE / INCOME GAP [ % ]
97.7¢/ $1
WAGE / INCOME GAP [ $ ]
0.34
INEQUALITY / GINI INDEX
862
TOTAL POPULATION
425
MALE POPULATION
437
FEMALE POPULATION
97.25
MALES / 100 FEMALES
102.82
FEMALES / 100 MALES
43.2
MEDIAN AGE
3.3
AVG FAMILY SIZE
2.6
AVG HOUSEHOLD SIZE
505
LABOR FORCE [ PEOPLE ]
69.0%
PERCENT IN LABOR FORCE
2.8%
UNEMPLOYMENT RATE
Millerton Zip Codes
Millerton Area Codes
Income in Millerton
Income Overview in Millerton
Per Capita Income in Millerton is $38,253, while median incomes of families and households are $88,194 and $78,953 respectively.
| Characteristic | Number | Measure |
| Per Capita Income | 862 | $38,253 |
| Median Family Income | 201 | $88,194 |
| Mean Family Income | 201 | $104,995 |
| Median Household Income | 322 | $78,953 |
| Mean Household Income | 322 | $97,007 |
| Income Deficit | 201 | $0 |
| Wage / Income Gap (%) | 862 | 2.32% |
| Wage / Income Gap ($) | 862 | 97.68¢ per $1 |
| Gini / Inequality Index | 862 | 0.34 |
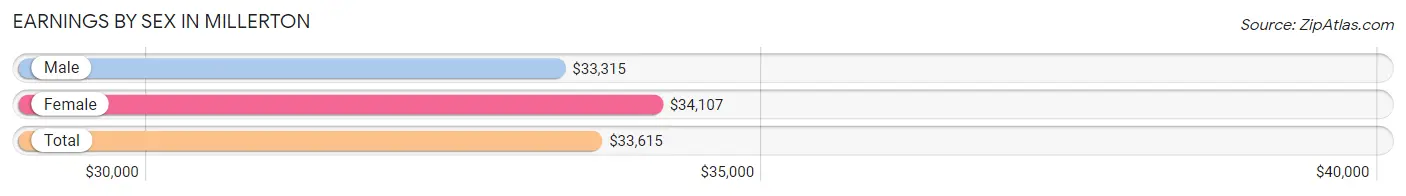
Earnings by Sex in Millerton
Average Earnings in Millerton are $33,615, $33,315 for men and $34,107 for women, a difference of 2.3%.
| Sex | Number | Average Earnings |
| Male | 307 (57.2%) | $33,315 |
| Female | 230 (42.8%) | $34,107 |
| Total | 537 (100.0%) | $33,615 |
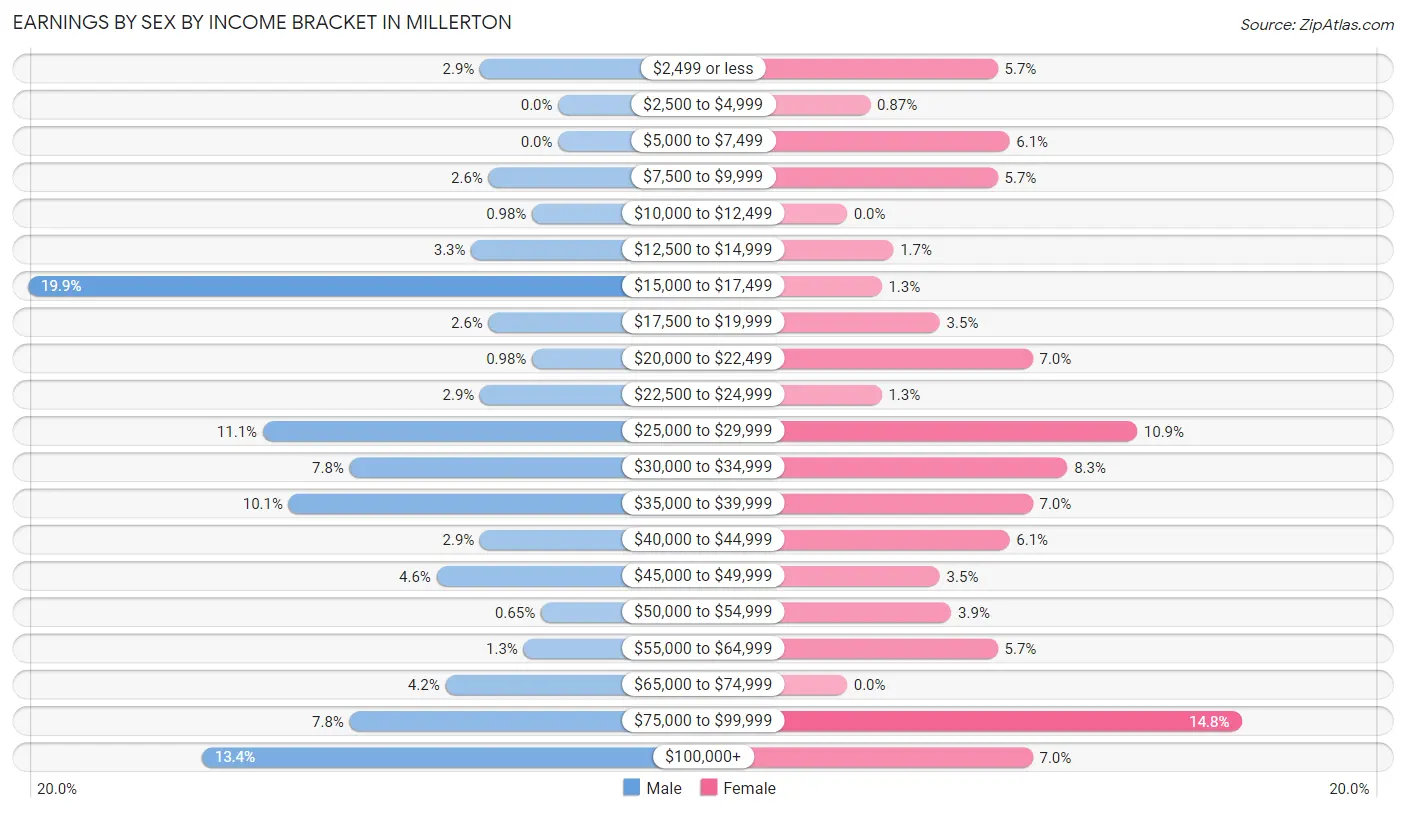
Earnings by Sex by Income Bracket in Millerton
The most common earnings brackets in Millerton are $15,000 to $17,499 for men (61 | 19.9%) and $75,000 to $99,999 for women (34 | 14.8%).
| Income | Male | Female |
| $2,499 or less | 9 (2.9%) | 13 (5.7%) |
| $2,500 to $4,999 | 0 (0.0%) | 2 (0.9%) |
| $5,000 to $7,499 | 0 (0.0%) | 14 (6.1%) |
| $7,500 to $9,999 | 8 (2.6%) | 13 (5.7%) |
| $10,000 to $12,499 | 3 (1.0%) | 0 (0.0%) |
| $12,500 to $14,999 | 10 (3.3%) | 4 (1.7%) |
| $15,000 to $17,499 | 61 (19.9%) | 3 (1.3%) |
| $17,500 to $19,999 | 8 (2.6%) | 8 (3.5%) |
| $20,000 to $22,499 | 3 (1.0%) | 16 (7.0%) |
| $22,500 to $24,999 | 9 (2.9%) | 3 (1.3%) |
| $25,000 to $29,999 | 34 (11.1%) | 25 (10.9%) |
| $30,000 to $34,999 | 24 (7.8%) | 19 (8.3%) |
| $35,000 to $39,999 | 31 (10.1%) | 16 (7.0%) |
| $40,000 to $44,999 | 9 (2.9%) | 14 (6.1%) |
| $45,000 to $49,999 | 14 (4.6%) | 8 (3.5%) |
| $50,000 to $54,999 | 2 (0.6%) | 9 (3.9%) |
| $55,000 to $64,999 | 4 (1.3%) | 13 (5.7%) |
| $65,000 to $74,999 | 13 (4.2%) | 0 (0.0%) |
| $75,000 to $99,999 | 24 (7.8%) | 34 (14.8%) |
| $100,000+ | 41 (13.4%) | 16 (7.0%) |
| Total | 307 (100.0%) | 230 (100.0%) |
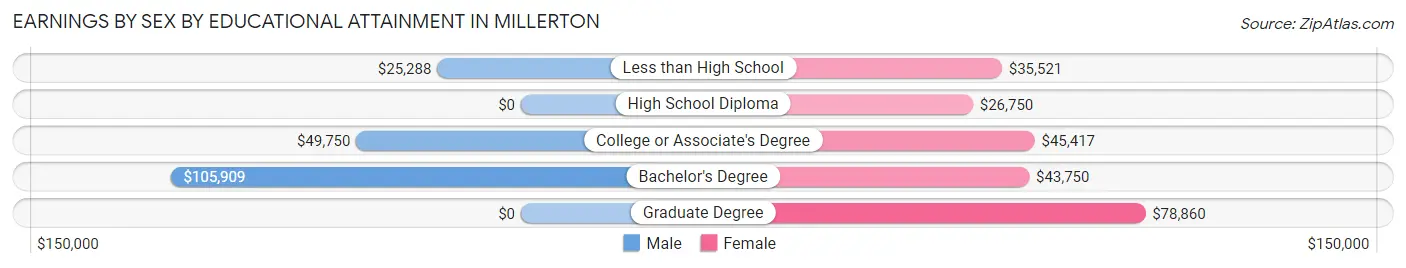
Earnings by Sex by Educational Attainment in Millerton
Average earnings in Millerton are $38,500 for men and $43,125 for women, a difference of 10.7%. Men with an educational attainment of bachelor's degree enjoy the highest average annual earnings of $105,909, while those with less than high school education earn the least with $25,288. Women with an educational attainment of graduate degree earn the most with the average annual earnings of $78,860, while those with high school diploma education have the smallest earnings of $26,750.
| Educational Attainment | Male Income | Female Income |
| Less than High School | $25,288 | $35,521 |
| High School Diploma | - | - |
| College or Associate's Degree | $49,750 | $45,417 |
| Bachelor's Degree | $105,909 | $43,750 |
| Graduate Degree | - | - |
| Total | $38,500 | $43,125 |
Family Income in Millerton
Family Income Brackets in Millerton
According to the Millerton family income data, there are 48 families falling into the $75,000 to $99,999 income range, which is the most common income bracket and makes up 23.9% of all families.
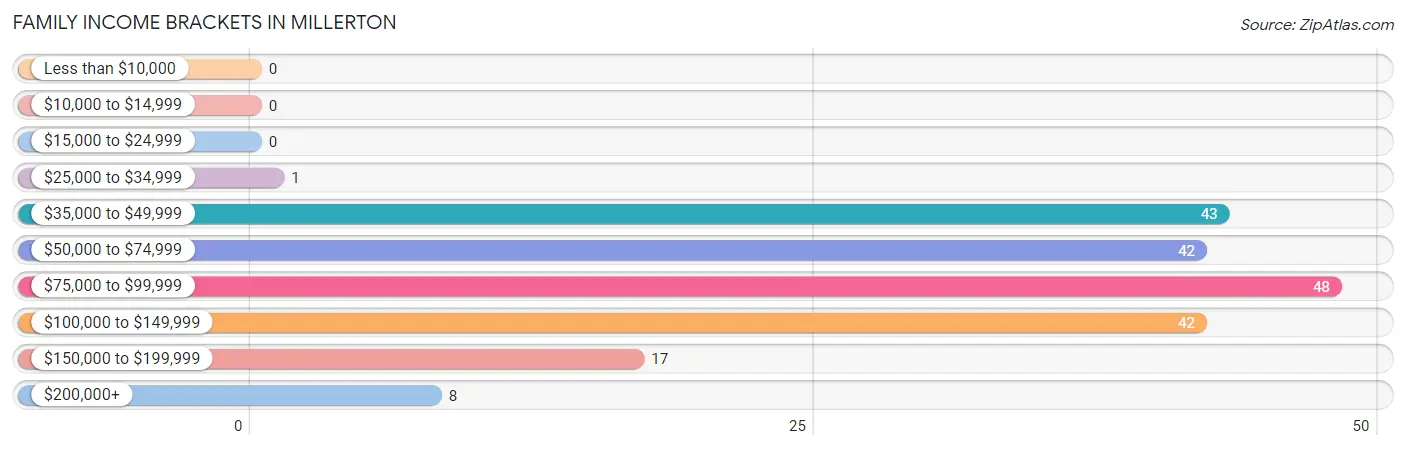
| Income Bracket | # Families | % Families |
| Less than $10,000 | 0 | 0.0% |
| $10,000 to $14,999 | 0 | 0.0% |
| $15,000 to $24,999 | 0 | 0.0% |
| $25,000 to $34,999 | 1 | 0.5% |
| $35,000 to $49,999 | 43 | 21.4% |
| $50,000 to $74,999 | 42 | 20.9% |
| $75,000 to $99,999 | 48 | 23.9% |
| $100,000 to $149,999 | 42 | 20.9% |
| $150,000 to $199,999 | 17 | 8.5% |
| $200,000+ | 8 | 4.0% |
Family Income by Famaliy Size in Millerton
4-person families (23 | 11.4%) account for the highest median family income in Millerton with $93,250 per family, while 2-person families (83 | 41.3%) have the highest median income of $46,614 per family member.
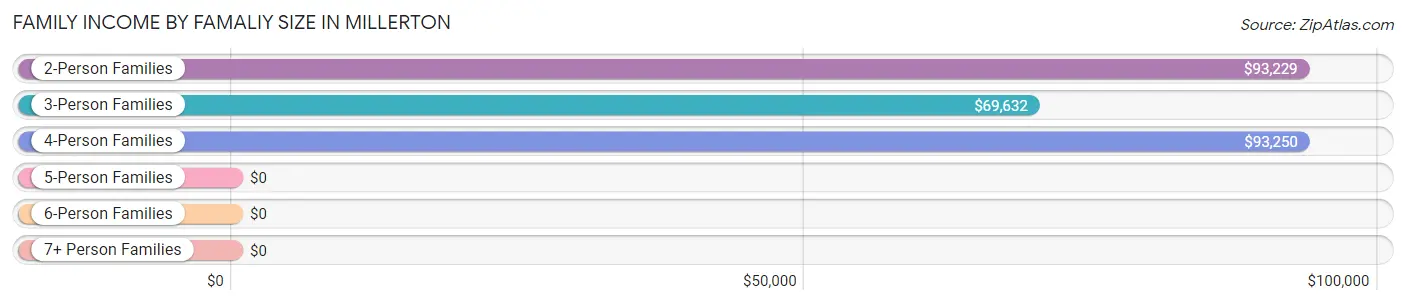
| Income Bracket | # Families | Median Income |
| 2-Person Families | 83 (41.3%) | $93,229 |
| 3-Person Families | 69 (34.3%) | $69,632 |
| 4-Person Families | 23 (11.4%) | $93,250 |
| 5-Person Families | 6 (3.0%) | $0 |
| 6-Person Families | 14 (7.0%) | $0 |
| 7+ Person Families | 6 (3.0%) | $0 |
| Total | 201 (100.0%) | $88,194 |
Family Income by Number of Earners in Millerton
The median family income in Millerton is $88,194, with families comprising 2 earners (58) having the highest median family income of $93,393, while families with no earners (20) have the lowest median family income of $64,286, accounting for 28.9% and 10.0% of families, respectively.
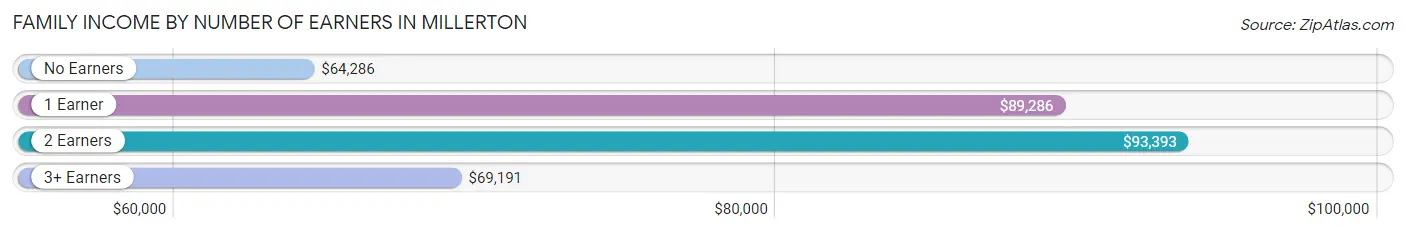
| Number of Earners | # Families | Median Income |
| No Earners | 20 (10.0%) | $64,286 |
| 1 Earner | 58 (28.9%) | $89,286 |
| 2 Earners | 58 (28.9%) | $93,393 |
| 3+ Earners | 65 (32.3%) | $69,191 |
| Total | 201 (100.0%) | $88,194 |
Household Income in Millerton
Household Income Brackets in Millerton
With 102 households falling in the category, the $75,000 to $99,999 income range is the most frequent in Millerton, accounting for 31.7% of all households.
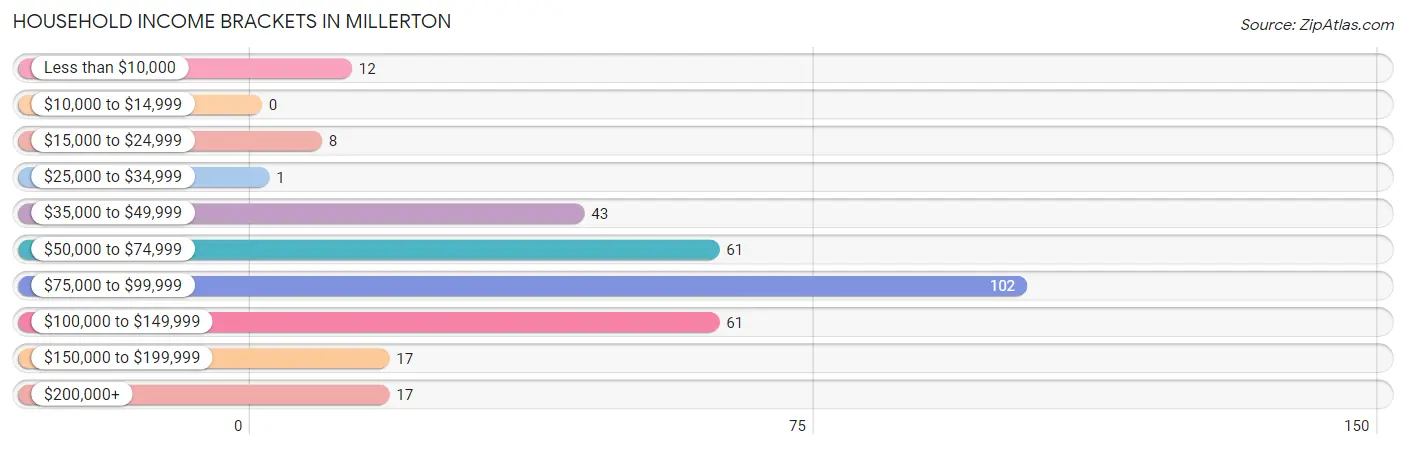
| Income Bracket | # Households | % Households |
| Less than $10,000 | 12 | 3.7% |
| $10,000 to $14,999 | 0 | 0.0% |
| $15,000 to $24,999 | 8 | 2.5% |
| $25,000 to $34,999 | 1 | 0.3% |
| $35,000 to $49,999 | 43 | 13.4% |
| $50,000 to $74,999 | 61 | 18.9% |
| $75,000 to $99,999 | 102 | 31.7% |
| $100,000 to $149,999 | 61 | 18.9% |
| $150,000 to $199,999 | 17 | 5.3% |
| $200,000+ | 17 | 5.3% |
Household Income by Householder Age in Millerton
The median household income in Millerton is $78,953, with the highest median household income of $94,444 found in the 25 to 44 years age bracket for the primary householder. A total of 70 households (21.7%) fall into this category. Meanwhile, the 15 to 24 years age bracket for the primary householder has the lowest median household income of $0, with 18 households (5.6%) in this group.
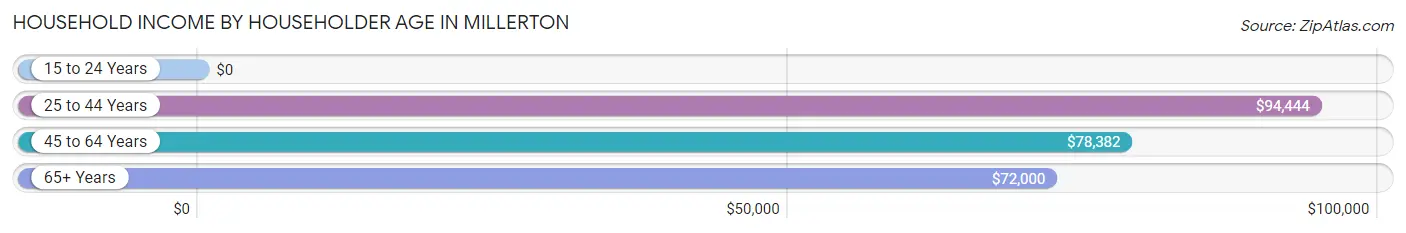
| Income Bracket | # Households | Median Income |
| 15 to 24 Years | 18 (5.6%) | $0 |
| 25 to 44 Years | 70 (21.7%) | $94,444 |
| 45 to 64 Years | 110 (34.2%) | $78,382 |
| 65+ Years | 124 (38.5%) | $72,000 |
| Total | 322 (100.0%) | $78,953 |
Poverty in Millerton
Income Below Poverty by Sex and Age in Millerton
With 3.1% poverty level for males and 2.8% for females among the residents of Millerton, 35 to 44 year old males and 75 year old and over females are the most vulnerable to poverty, with 8 males (36.4%) and 8 females (26.7%) in their respective age groups living below the poverty level.
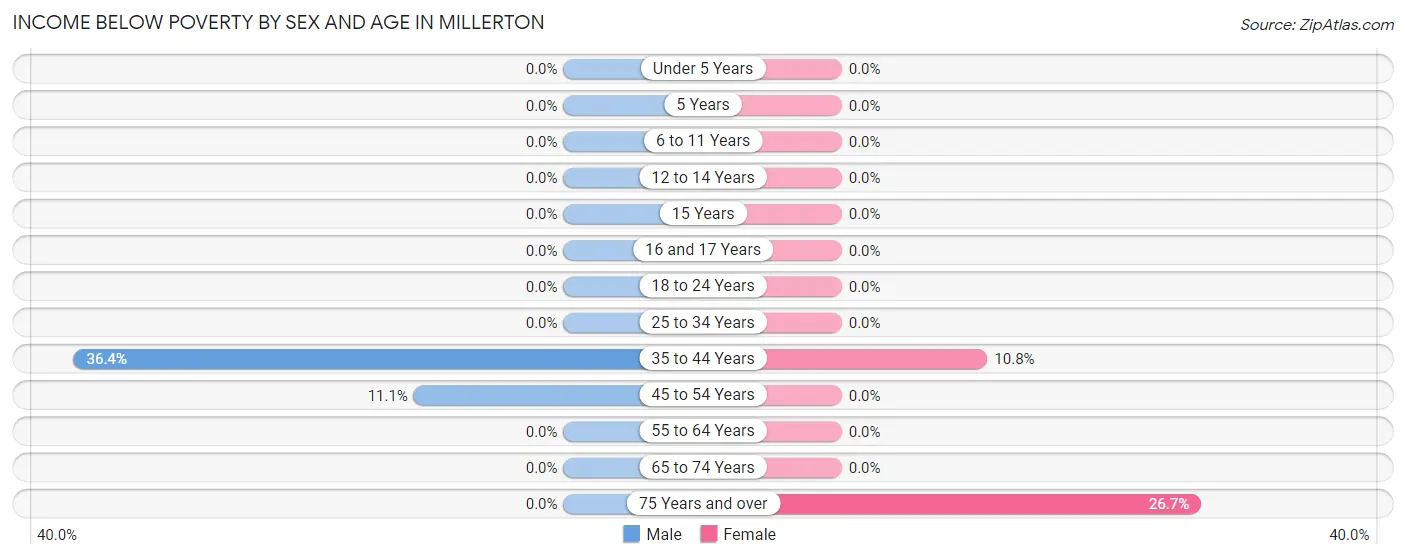
| Age Bracket | Male | Female |
| Under 5 Years | 0 (0.0%) | 0 (0.0%) |
| 5 Years | 0 (0.0%) | 0 (0.0%) |
| 6 to 11 Years | 0 (0.0%) | 0 (0.0%) |
| 12 to 14 Years | 0 (0.0%) | 0 (0.0%) |
| 15 Years | 0 (0.0%) | 0 (0.0%) |
| 16 and 17 Years | 0 (0.0%) | 0 (0.0%) |
| 18 to 24 Years | 0 (0.0%) | 0 (0.0%) |
| 25 to 34 Years | 0 (0.0%) | 0 (0.0%) |
| 35 to 44 Years | 8 (36.4%) | 4 (10.8%) |
| 45 to 54 Years | 5 (11.1%) | 0 (0.0%) |
| 55 to 64 Years | 0 (0.0%) | 0 (0.0%) |
| 65 to 74 Years | 0 (0.0%) | 0 (0.0%) |
| 75 Years and over | 0 (0.0%) | 8 (26.7%) |
| Total | 13 (3.1%) | 12 (2.8%) |
Income Above Poverty by Sex and Age in Millerton
According to the poverty statistics in Millerton, males aged under 5 years and females aged under 5 years are the age groups that are most secure financially, with 100.0% of males and 100.0% of females in these age groups living above the poverty line.
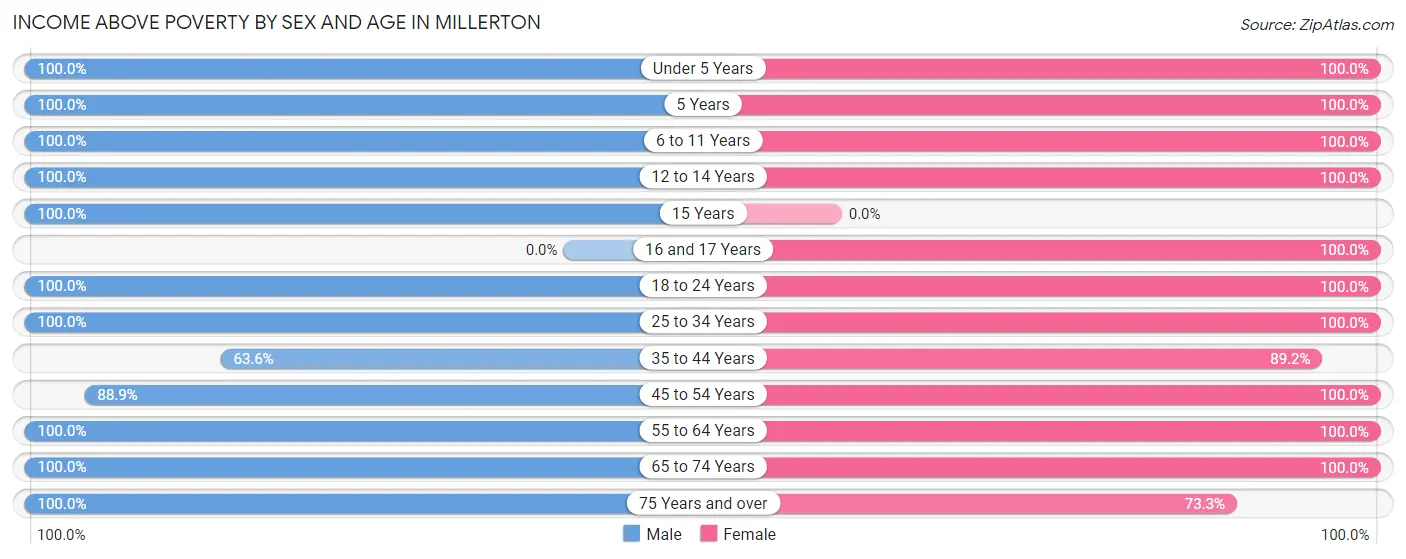
| Age Bracket | Male | Female |
| Under 5 Years | 6 (100.0%) | 48 (100.0%) |
| 5 Years | 7 (100.0%) | 3 (100.0%) |
| 6 to 11 Years | 3 (100.0%) | 14 (100.0%) |
| 12 to 14 Years | 4 (100.0%) | 22 (100.0%) |
| 15 Years | 23 (100.0%) | 0 (0.0%) |
| 16 and 17 Years | 0 (0.0%) | 14 (100.0%) |
| 18 to 24 Years | 69 (100.0%) | 41 (100.0%) |
| 25 to 34 Years | 95 (100.0%) | 53 (100.0%) |
| 35 to 44 Years | 14 (63.6%) | 33 (89.2%) |
| 45 to 54 Years | 40 (88.9%) | 61 (100.0%) |
| 55 to 64 Years | 58 (100.0%) | 37 (100.0%) |
| 65 to 74 Years | 70 (100.0%) | 77 (100.0%) |
| 75 Years and over | 23 (100.0%) | 22 (73.3%) |
| Total | 412 (96.9%) | 425 (97.3%) |
Income Below Poverty Among Married-Couple Families in Millerton
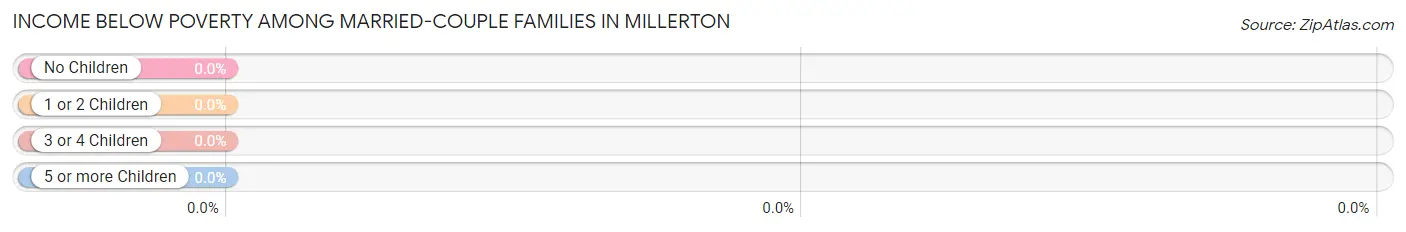
| Children | Above Poverty | Below Poverty |
| No Children | 99 (100.0%) | 0 (0.0%) |
| 1 or 2 Children | 27 (100.0%) | 0 (0.0%) |
| 3 or 4 Children | 6 (100.0%) | 0 (0.0%) |
| 5 or more Children | 0 (0.0%) | 0 (0.0%) |
| Total | 132 (100.0%) | 0 (0.0%) |
Income Below Poverty Among Single-Parent Households in Millerton
| Children | Single Father | Single Mother |
| No Children | 0 (0.0%) | 0 (0.0%) |
| 1 or 2 Children | 0 (0.0%) | 0 (0.0%) |
| 3 or 4 Children | 0 (0.0%) | 0 (0.0%) |
| 5 or more Children | 0 (0.0%) | 0 (0.0%) |
| Total | 0 (0.0%) | 0 (0.0%) |
Income Below Poverty Among Married-Couple vs Single-Parent Households in Millerton
| Children | Married-Couple Families | Single-Parent Households |
| No Children | 0 (0.0%) | 0 (0.0%) |
| 1 or 2 Children | 0 (0.0%) | 0 (0.0%) |
| 3 or 4 Children | 0 (0.0%) | 0 (0.0%) |
| 5 or more Children | 0 (0.0%) | 0 (0.0%) |
| Total | 0 (0.0%) | 0 (0.0%) |
Race in Millerton
The most populous races in Millerton are White / Caucasian (509 | 59.1%), Hispanic or Latino (257 | 29.8%), and Some other Race (122 | 14.1%).
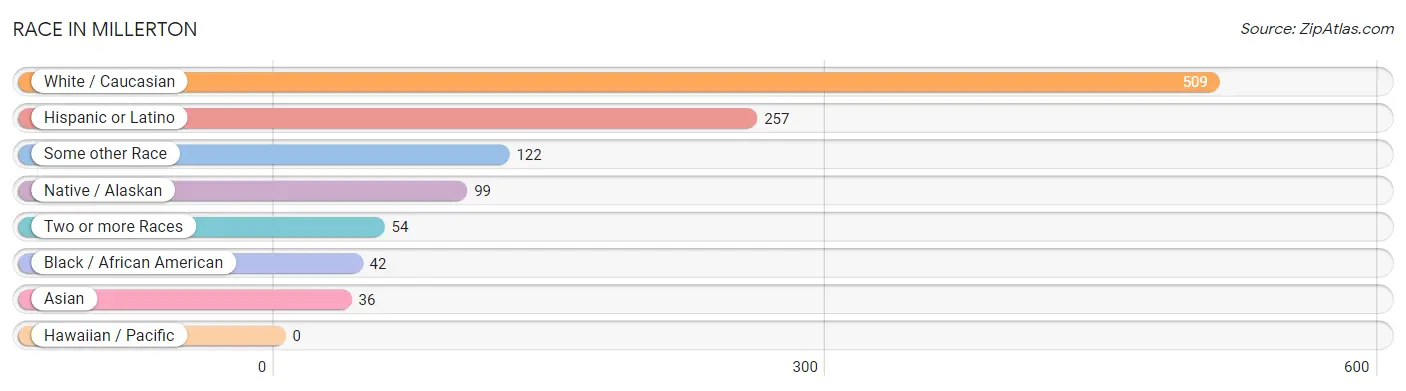
| Race | # Population | % Population |
| Asian | 36 | 4.2% |
| Black / African American | 42 | 4.9% |
| Hawaiian / Pacific | 0 | 0.0% |
| Hispanic or Latino | 257 | 29.8% |
| Native / Alaskan | 99 | 11.5% |
| White / Caucasian | 509 | 59.1% |
| Two or more Races | 54 | 6.3% |
| Some other Race | 122 | 14.1% |
| Total | 862 | 100.0% |
Ancestry in Millerton
The most populous ancestries reported in Millerton are Irish (178 | 20.6%), Central American (172 | 20.0%), Guatemalan (172 | 20.0%), German (139 | 16.1%), and English (121 | 14.0%), together accounting for 90.7% of all Millerton residents.
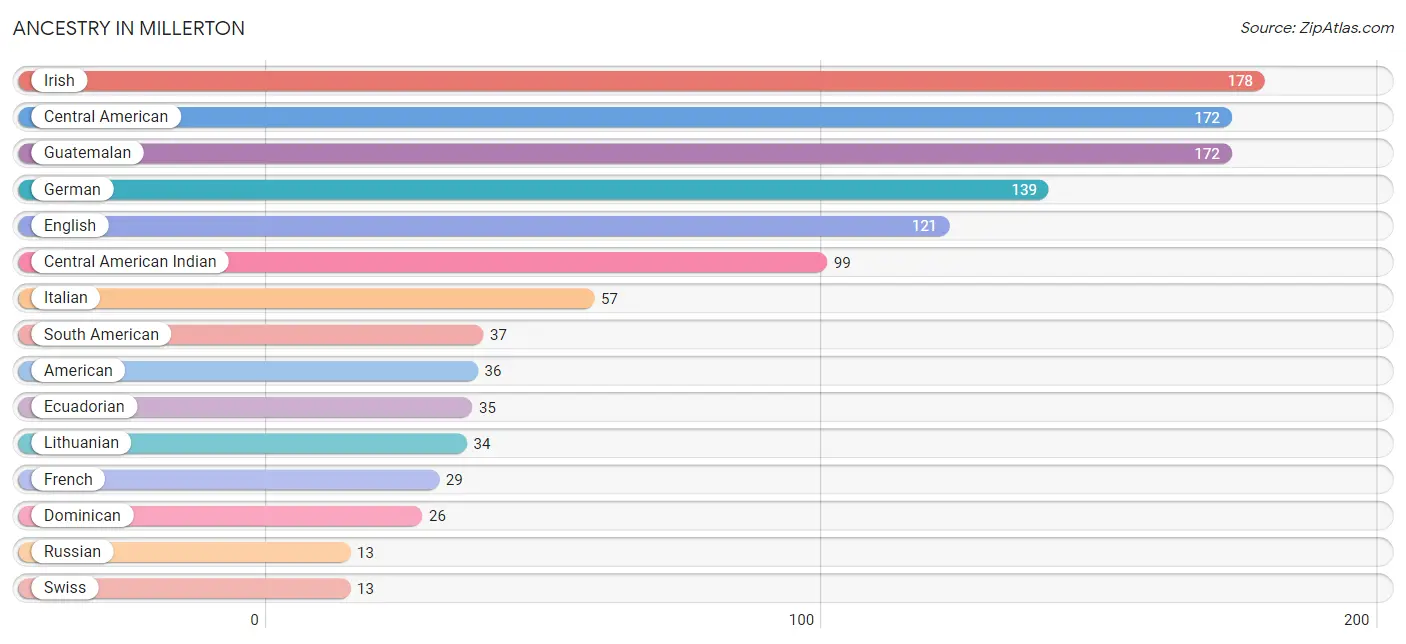
| Ancestry | # Population | % Population |
| American | 36 | 4.2% |
| Austrian | 7 | 0.8% |
| Bhutanese | 8 | 0.9% |
| Central American | 172 | 20.0% |
| Central American Indian | 99 | 11.5% |
| Czech | 4 | 0.5% |
| Dominican | 26 | 3.0% |
| Dutch | 5 | 0.6% |
| Ecuadorian | 35 | 4.1% |
| English | 121 | 14.0% |
| French | 29 | 3.4% |
| German | 139 | 16.1% |
| Guatemalan | 172 | 20.0% |
| Hungarian | 5 | 0.6% |
| Irish | 178 | 20.6% |
| Italian | 57 | 6.6% |
| Korean | 6 | 0.7% |
| Lithuanian | 34 | 3.9% |
| Mexican | 8 | 0.9% |
| Norwegian | 3 | 0.4% |
| Paraguayan | 2 | 0.2% |
| Polish | 10 | 1.2% |
| Russian | 13 | 1.5% |
| Scotch-Irish | 11 | 1.3% |
| Scottish | 9 | 1.0% |
| Slovene | 3 | 0.4% |
| South American | 37 | 4.3% |
| Swiss | 13 | 1.5% |
| Thai | 9 | 1.0% | View All 29 Rows |
Immigrants in Millerton
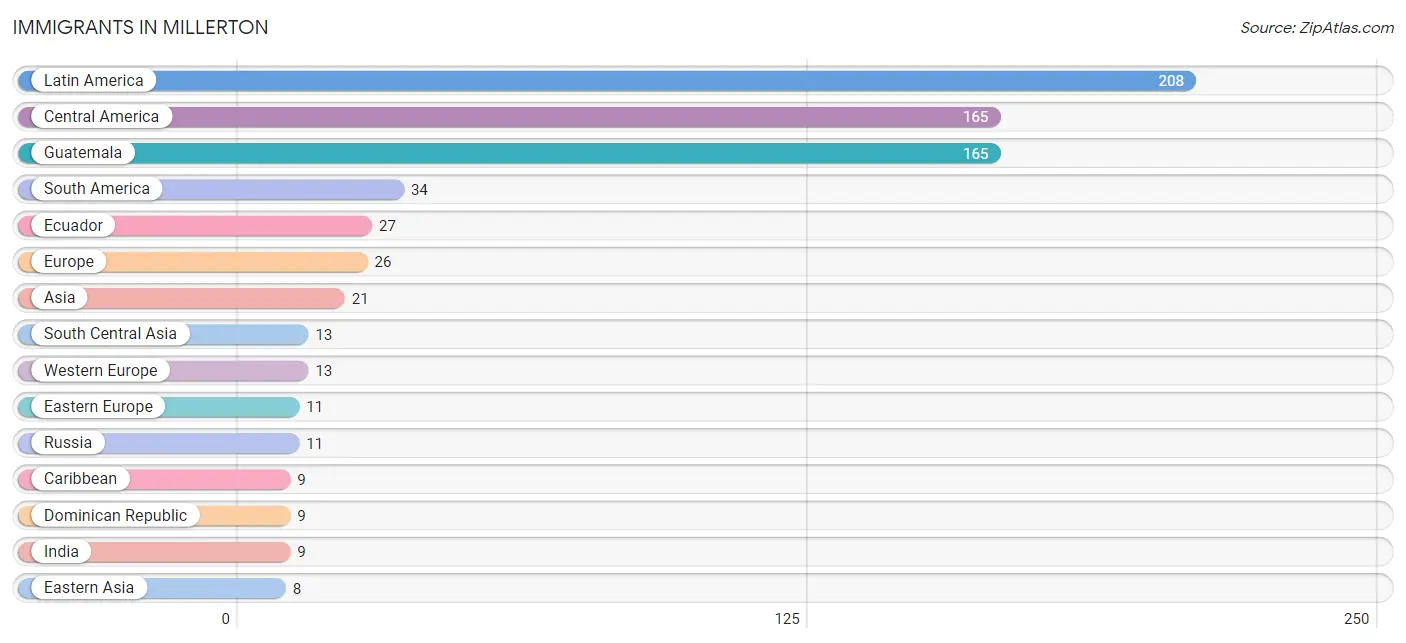
The most numerous immigrant groups reported in Millerton came from Latin America (208 | 24.1%), Central America (165 | 19.1%), Guatemala (165 | 19.1%), South America (34 | 3.9%), and Ecuador (27 | 3.1%), together accounting for 69.5% of all Millerton residents.
| Immigration Origin | # Population | % Population |
| Asia | 21 | 2.4% |
| Austria | 7 | 0.8% |
| Caribbean | 9 | 1.0% |
| Central America | 165 | 19.1% |
| Colombia | 1 | 0.1% |
| Dominican Republic | 9 | 1.0% |
| Eastern Asia | 8 | 0.9% |
| Eastern Europe | 11 | 1.3% |
| Ecuador | 27 | 3.1% |
| Europe | 26 | 3.0% |
| France | 6 | 0.7% |
| Guatemala | 165 | 19.1% |
| India | 9 | 1.0% |
| Italy | 2 | 0.2% |
| Japan | 8 | 0.9% |
| Latin America | 208 | 24.1% |
| Nepal | 4 | 0.5% |
| Russia | 11 | 1.3% |
| South America | 34 | 3.9% |
| South Central Asia | 13 | 1.5% |
| Southern Europe | 2 | 0.2% |
| Western Europe | 13 | 1.5% | View All 22 Rows |
Sex and Age in Millerton
Sex and Age in Millerton
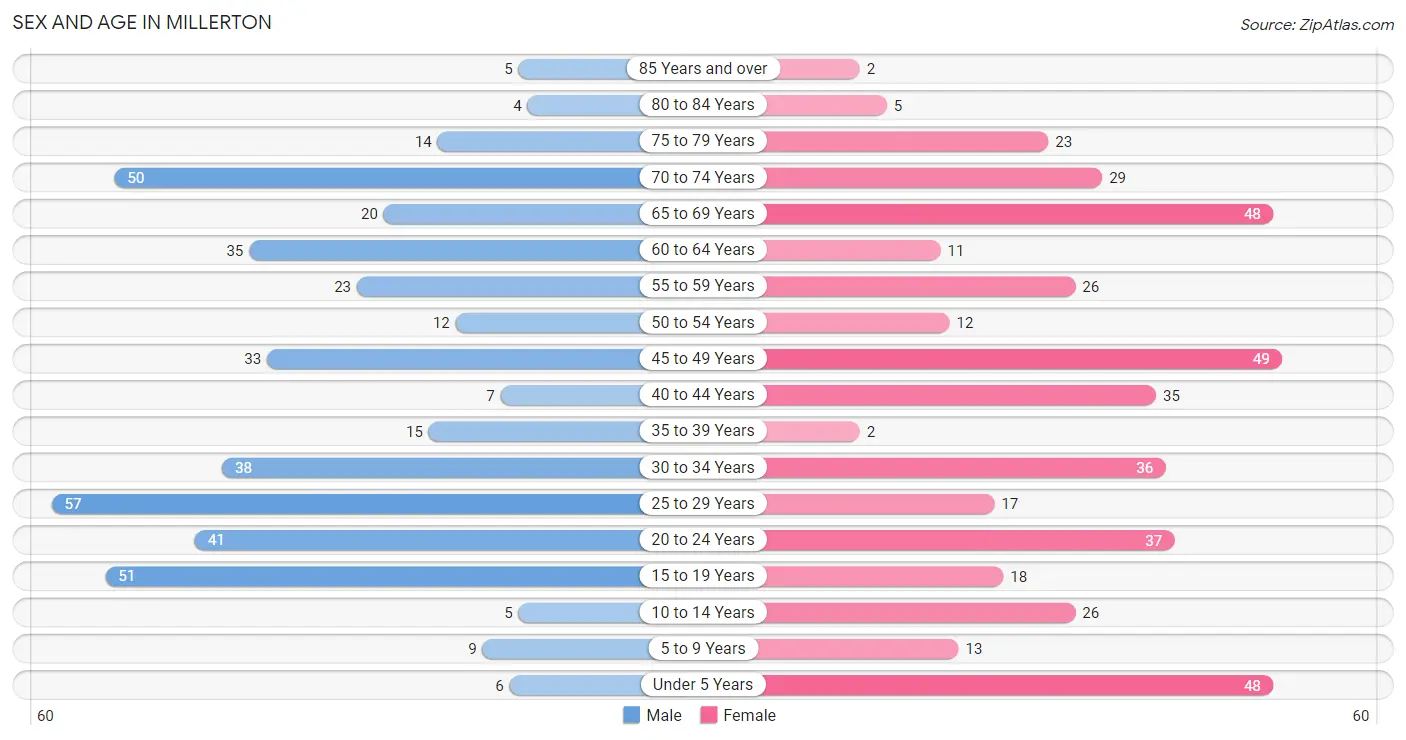
The most populous age groups in Millerton are 25 to 29 Years (57 | 13.4%) for men and 45 to 49 Years (49 | 11.2%) for women.
| Age Bracket | Male | Female |
| Under 5 Years | 6 (1.4%) | 48 (11.0%) |
| 5 to 9 Years | 9 (2.1%) | 13 (3.0%) |
| 10 to 14 Years | 5 (1.2%) | 26 (5.9%) |
| 15 to 19 Years | 51 (12.0%) | 18 (4.1%) |
| 20 to 24 Years | 41 (9.7%) | 37 (8.5%) |
| 25 to 29 Years | 57 (13.4%) | 17 (3.9%) |
| 30 to 34 Years | 38 (8.9%) | 36 (8.2%) |
| 35 to 39 Years | 15 (3.5%) | 2 (0.5%) |
| 40 to 44 Years | 7 (1.7%) | 35 (8.0%) |
| 45 to 49 Years | 33 (7.8%) | 49 (11.2%) |
| 50 to 54 Years | 12 (2.8%) | 12 (2.8%) |
| 55 to 59 Years | 23 (5.4%) | 26 (5.9%) |
| 60 to 64 Years | 35 (8.2%) | 11 (2.5%) |
| 65 to 69 Years | 20 (4.7%) | 48 (11.0%) |
| 70 to 74 Years | 50 (11.8%) | 29 (6.6%) |
| 75 to 79 Years | 14 (3.3%) | 23 (5.3%) |
| 80 to 84 Years | 4 (0.9%) | 5 (1.1%) |
| 85 Years and over | 5 (1.2%) | 2 (0.5%) |
| Total | 425 (100.0%) | 437 (100.0%) |
Families and Households in Millerton
Median Family Size in Millerton
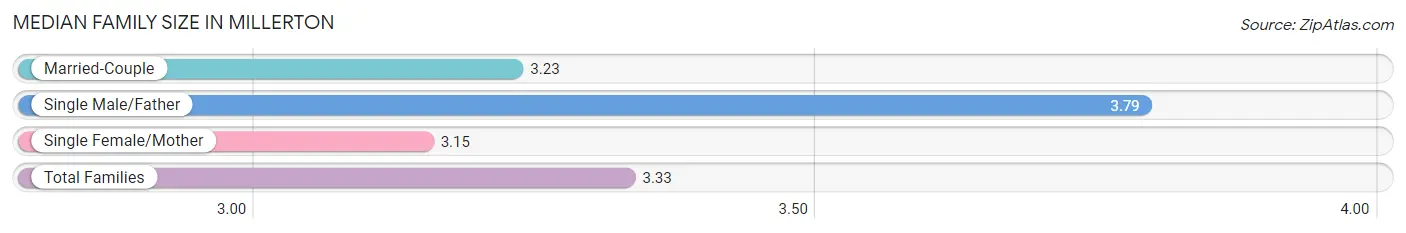
The median family size in Millerton is 3.33 persons per family, with single male/father families (42 | 20.9%) accounting for the largest median family size of 3.79 persons per family. On the other hand, single female/mother families (27 | 13.4%) represent the smallest median family size with 3.15 persons per family.
| Family Type | # Families | Family Size |
| Married-Couple | 132 (65.7%) | 3.23 |
| Single Male/Father | 42 (20.9%) | 3.79 |
| Single Female/Mother | 27 (13.4%) | 3.15 |
| Total Families | 201 (100.0%) | 3.33 |
Median Household Size in Millerton
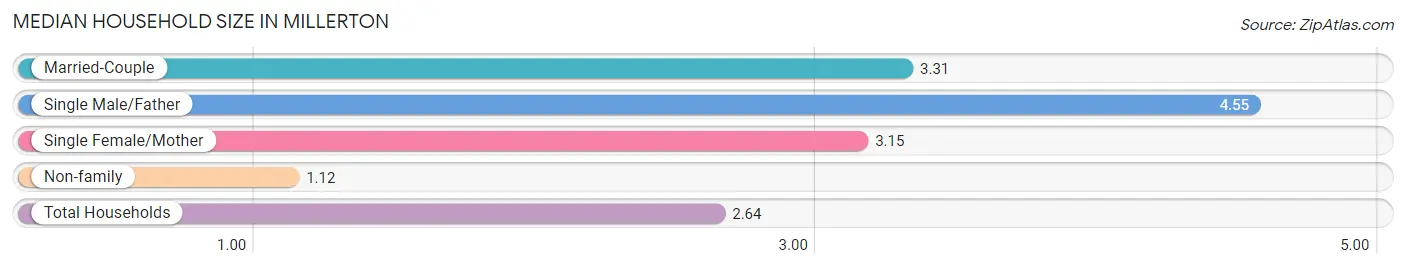
The median household size in Millerton is 2.64 persons per household, with single male/father households (42 | 13.0%) accounting for the largest median household size of 4.55 persons per household. non-family households (121 | 37.6%) represent the smallest median household size with 1.12 persons per household.
| Household Type | # Households | Household Size |
| Married-Couple | 132 (41.0%) | 3.31 |
| Single Male/Father | 42 (13.0%) | 4.55 |
| Single Female/Mother | 27 (8.4%) | 3.15 |
| Non-family | 121 (37.6%) | 1.12 |
| Total Households | 322 (100.0%) | 2.64 |
Household Size by Marriage Status in Millerton
Out of a total of 322 households in Millerton, 201 (62.4%) are family households, while 121 (37.6%) are nonfamily households. The most numerous type of family households are 2-person households, comprising 83, and the most common type of nonfamily households are 1-person households, comprising 103.
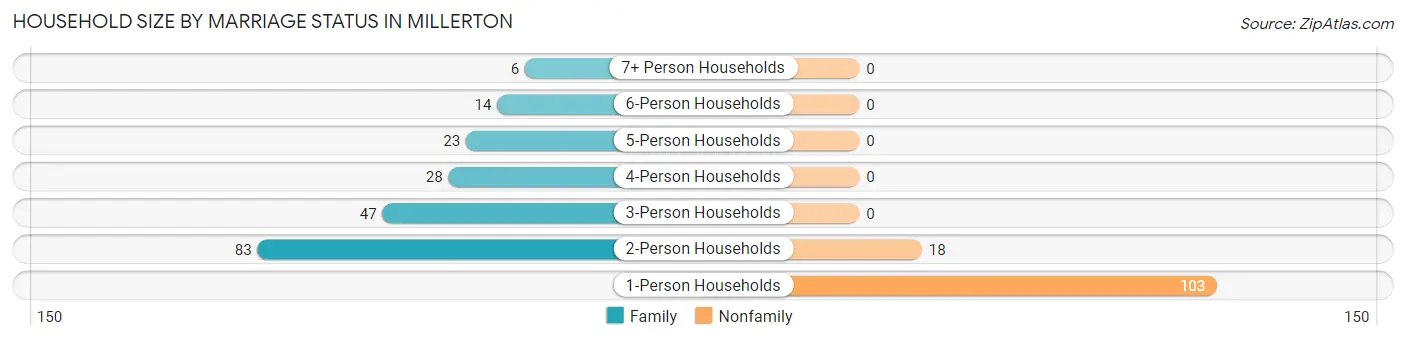
| Household Size | Family Households | Nonfamily Households |
| 1-Person Households | - | 103 (32.0%) |
| 2-Person Households | 83 (25.8%) | 18 (5.6%) |
| 3-Person Households | 47 (14.6%) | 0 (0.0%) |
| 4-Person Households | 28 (8.7%) | 0 (0.0%) |
| 5-Person Households | 23 (7.1%) | 0 (0.0%) |
| 6-Person Households | 14 (4.3%) | 0 (0.0%) |
| 7+ Person Households | 6 (1.9%) | 0 (0.0%) |
| Total | 201 (62.4%) | 121 (37.6%) |
Female Fertility in Millerton
Fertility by Age in Millerton
Average fertility rate in Millerton is 62.0 births per 1,000 women. Women in the age bracket of 20 to 34 years have the highest fertility rate with 133.0 births per 1,000 women. Women in the age bracket of 20 to 34 years acount for 100.0% of all women with births.
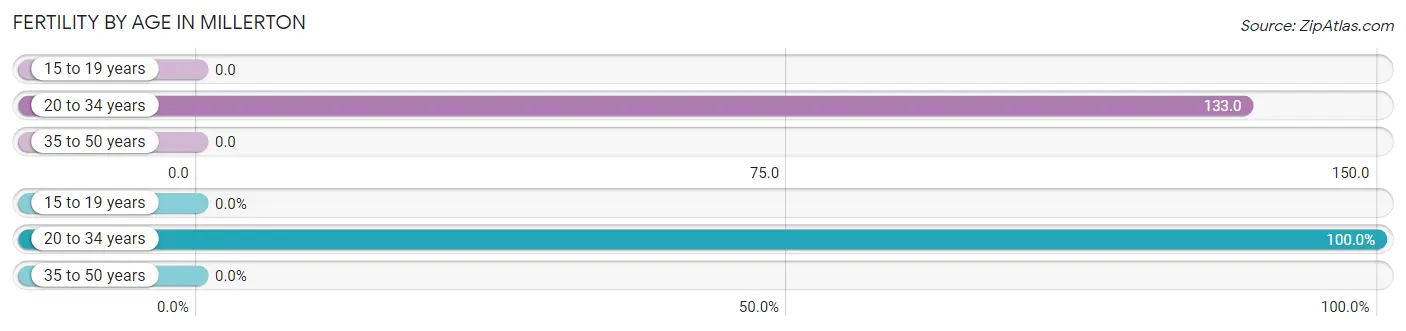
| Age Bracket | Women with Births | Births / 1,000 Women |
| 15 to 19 years | 0 (0.0%) | 0.0 |
| 20 to 34 years | 12 (100.0%) | 133.0 |
| 35 to 50 years | 0 (0.0%) | 0.0 |
| Total | 12 (100.0%) | 62.0 |
Fertility by Age by Marriage Status in Millerton
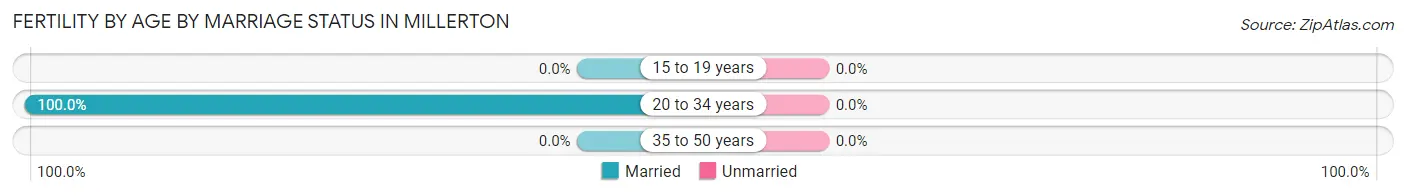
| Age Bracket | Married | Unmarried |
| 15 to 19 years | 0 (0.0%) | 0 (0.0%) |
| 20 to 34 years | 12 (100.0%) | 0 (0.0%) |
| 35 to 50 years | 0 (0.0%) | 0 (0.0%) |
| Total | 12 (100.0%) | 0 (0.0%) |
Fertility by Education in Millerton
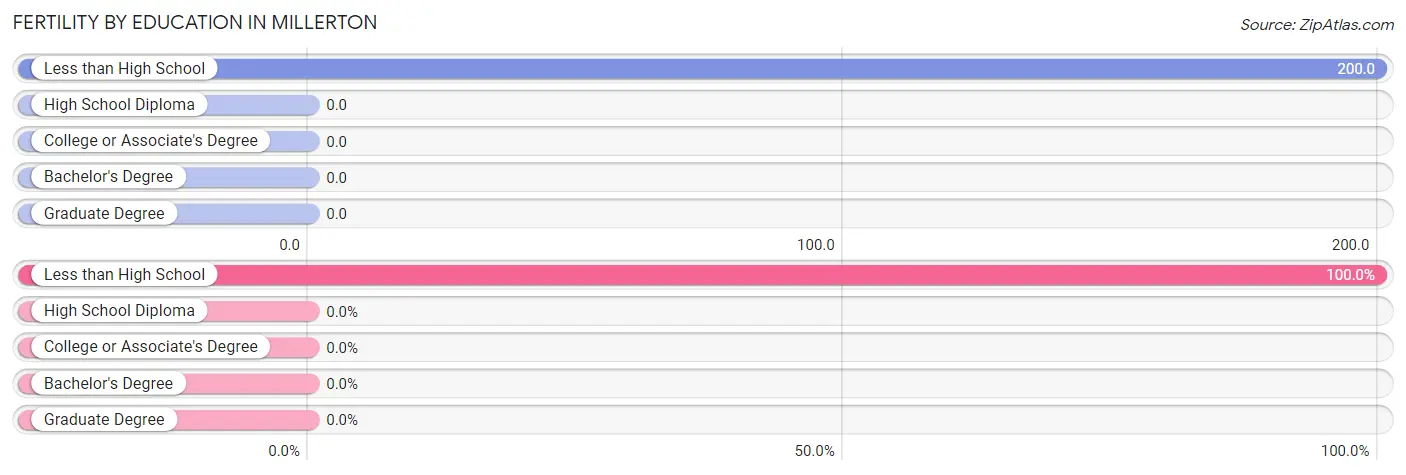
| Educational Attainment | Women with Births | Births / 1,000 Women |
| Less than High School | 12 (100.0%) | 200.0 |
| High School Diploma | 0 (0.0%) | 0.0 |
| College or Associate's Degree | 0 (0.0%) | 0.0 |
| Bachelor's Degree | 0 (0.0%) | 0.0 |
| Graduate Degree | 0 (0.0%) | 0.0 |
| Total | 12 (100.0%) | 62.0 |
Fertility by Education by Marriage Status in Millerton
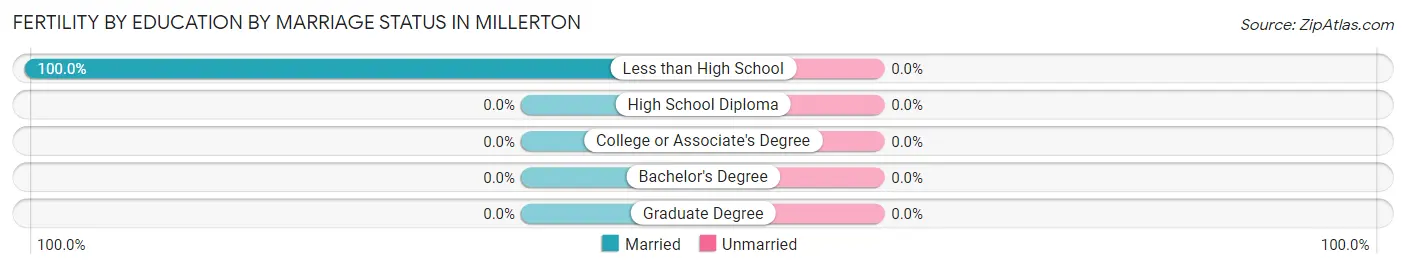
| Educational Attainment | Married | Unmarried |
| Less than High School | 12 (100.0%) | 0 (0.0%) |
| High School Diploma | 0 (0.0%) | 0 (0.0%) |
| College or Associate's Degree | 0 (0.0%) | 0 (0.0%) |
| Bachelor's Degree | 0 (0.0%) | 0 (0.0%) |
| Graduate Degree | 0 (0.0%) | 0 (0.0%) |
| Total | 12 (100.0%) | 0 (0.0%) |
Employment Characteristics in Millerton
Employment by Class of Employer in Millerton
Among the 456 employed individuals in Millerton, private company employees (254 | 55.7%), self-employed (not incorporated) (102 | 22.4%), and not-for-profit organizations (50 | 11.0%) make up the most common classes of employment.
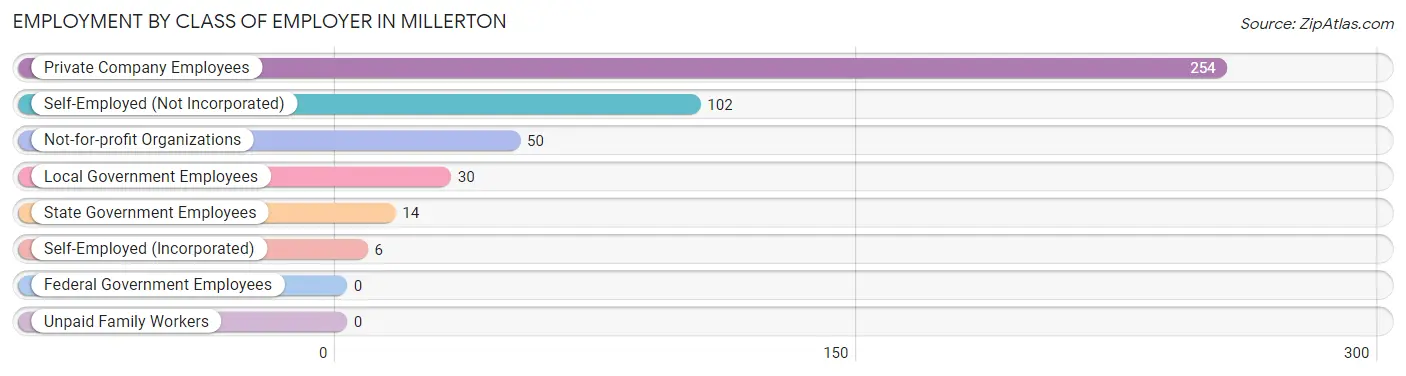
| Employer Class | # Employees | % Employees |
| Private Company Employees | 254 | 55.7% |
| Self-Employed (Incorporated) | 6 | 1.3% |
| Self-Employed (Not Incorporated) | 102 | 22.4% |
| Not-for-profit Organizations | 50 | 11.0% |
| Local Government Employees | 30 | 6.6% |
| State Government Employees | 14 | 3.1% |
| Federal Government Employees | 0 | 0.0% |
| Unpaid Family Workers | 0 | 0.0% |
| Total | 456 | 100.0% |
Employment Status by Age in Millerton
According to the labor force statistics for Millerton, out of the total population over 16 years of age (732), 69.0% or 505 individuals are in the labor force, with 2.8% or 14 of them unemployed. The age group with the highest labor force participation rate is 20 to 24 years, with 100.0% or 78 individuals in the labor force. Within the labor force, the 60 to 64 years age range has the highest percentage of unemployed individuals, with 12.5% or 3 of them being unemployed.
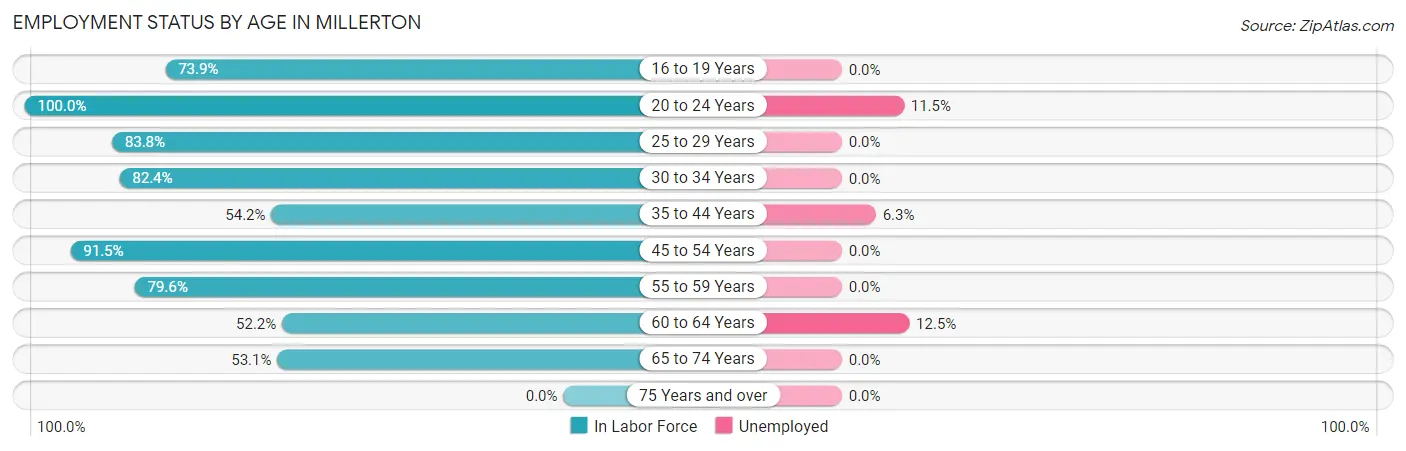
| Age Bracket | In Labor Force | Unemployed |
| 16 to 19 Years | 34 (73.9%) | 0 (0.0%) |
| 20 to 24 Years | 78 (100.0%) | 9 (11.5%) |
| 25 to 29 Years | 62 (83.8%) | 0 (0.0%) |
| 30 to 34 Years | 61 (82.4%) | 0 (0.0%) |
| 35 to 44 Years | 32 (54.2%) | 2 (6.3%) |
| 45 to 54 Years | 97 (91.5%) | 0 (0.0%) |
| 55 to 59 Years | 39 (79.6%) | 0 (0.0%) |
| 60 to 64 Years | 24 (52.2%) | 3 (12.5%) |
| 65 to 74 Years | 78 (53.1%) | 0 (0.0%) |
| 75 Years and over | 0 (0.0%) | 0 (0.0%) |
| Total | 505 (69.0%) | 14 (2.8%) |
Employment Status by Educational Attainment in Millerton
According to labor force statistics for Millerton, 77.2% of individuals (315) out of the total population between 25 and 64 years of age (408) are in the labor force, with 1.6% or 5 of them being unemployed. The group with the highest labor force participation rate are those with the educational attainment of college / associate degree, with 83.8% or 109 individuals in the labor force. Within the labor force, individuals with high school diploma education have the highest percentage of unemployment, with 6.7% or 3 of them being unemployed.
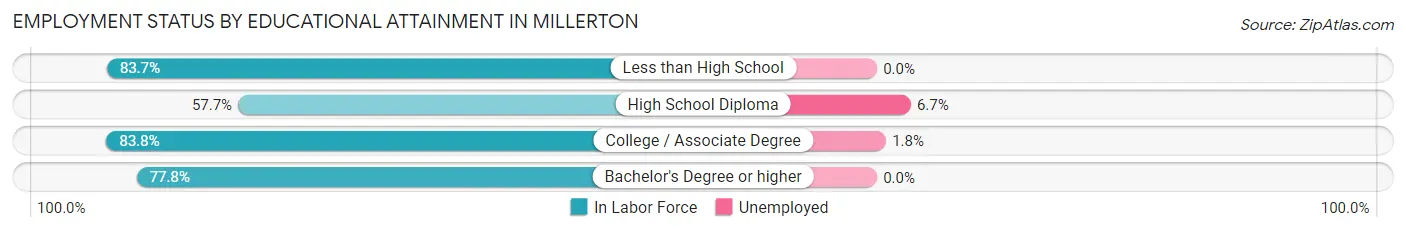
| Educational Attainment | In Labor Force | Unemployed |
| Less than High School | 77 (83.7%) | 0 (0.0%) |
| High School Diploma | 45 (57.7%) | 5 (6.7%) |
| College / Associate Degree | 109 (83.8%) | 2 (1.8%) |
| Bachelor's Degree or higher | 84 (77.8%) | 0 (0.0%) |
| Total | 315 (77.2%) | 7 (1.6%) |
Employment Occupations by Sex in Millerton
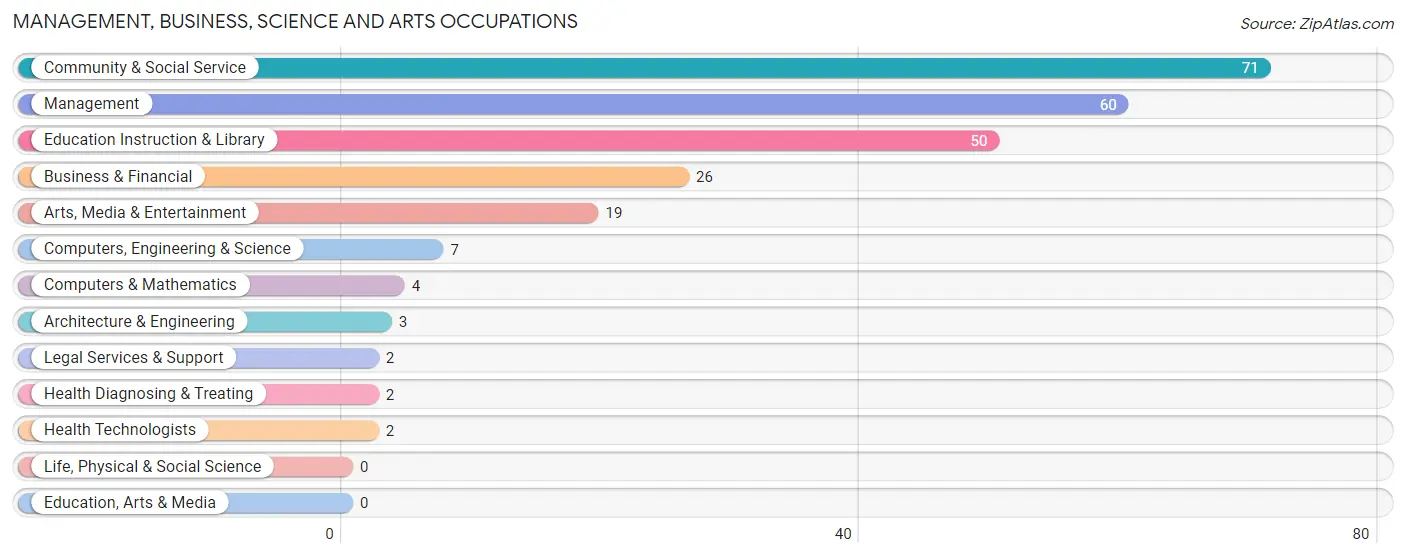
Management, Business, Science and Arts Occupations
The most common Management, Business, Science and Arts occupations in Millerton are Community & Social Service (71 | 14.5%), Management (60 | 12.2%), Education Instruction & Library (50 | 10.2%), Business & Financial (26 | 5.3%), and Arts, Media & Entertainment (19 | 3.9%).
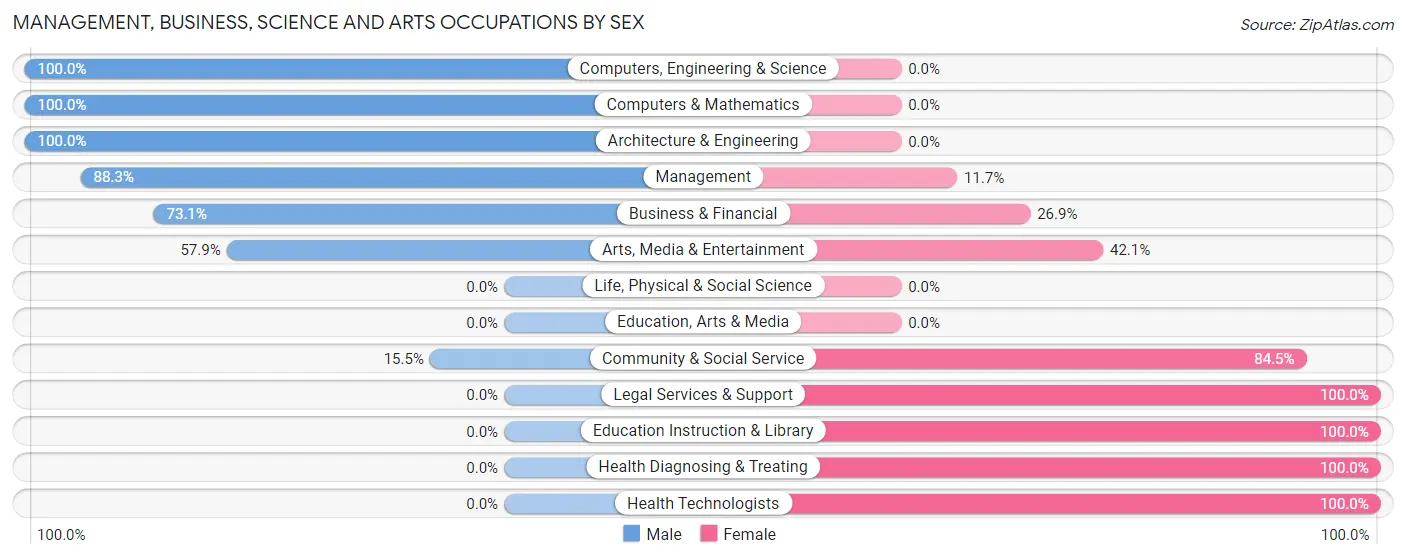
Management, Business, Science and Arts Occupations by Sex
Within the Management, Business, Science and Arts occupations in Millerton, the most male-oriented occupations are Computers, Engineering & Science (100.0%), Computers & Mathematics (100.0%), and Architecture & Engineering (100.0%), while the most female-oriented occupations are Legal Services & Support (100.0%), Education Instruction & Library (100.0%), and Health Diagnosing & Treating (100.0%).
| Occupation | Male | Female |
| Management | 53 (88.3%) | 7 (11.7%) |
| Business & Financial | 19 (73.1%) | 7 (26.9%) |
| Computers, Engineering & Science | 7 (100.0%) | 0 (0.0%) |
| Computers & Mathematics | 4 (100.0%) | 0 (0.0%) |
| Architecture & Engineering | 3 (100.0%) | 0 (0.0%) |
| Life, Physical & Social Science | 0 (0.0%) | 0 (0.0%) |
| Community & Social Service | 11 (15.5%) | 60 (84.5%) |
| Education, Arts & Media | 0 (0.0%) | 0 (0.0%) |
| Legal Services & Support | 0 (0.0%) | 2 (100.0%) |
| Education Instruction & Library | 0 (0.0%) | 50 (100.0%) |
| Arts, Media & Entertainment | 11 (57.9%) | 8 (42.1%) |
| Health Diagnosing & Treating | 0 (0.0%) | 2 (100.0%) |
| Health Technologists | 0 (0.0%) | 2 (100.0%) |
| Total (Category) | 90 (54.2%) | 76 (45.8%) |
| Total (Overall) | 298 (60.7%) | 193 (39.3%) |
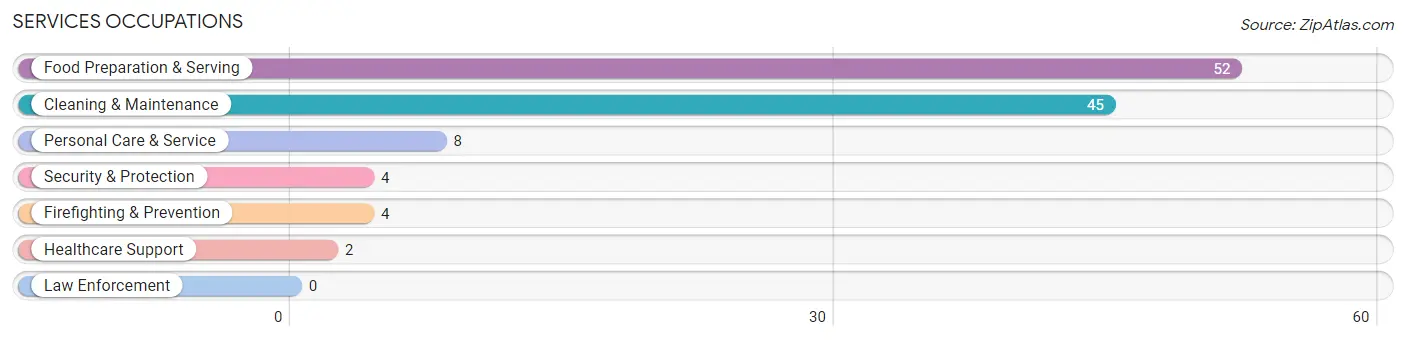
Services Occupations
The most common Services occupations in Millerton are Food Preparation & Serving (52 | 10.6%), Cleaning & Maintenance (45 | 9.2%), Personal Care & Service (8 | 1.6%), Security & Protection (4 | 0.8%), and Firefighting & Prevention (4 | 0.8%).
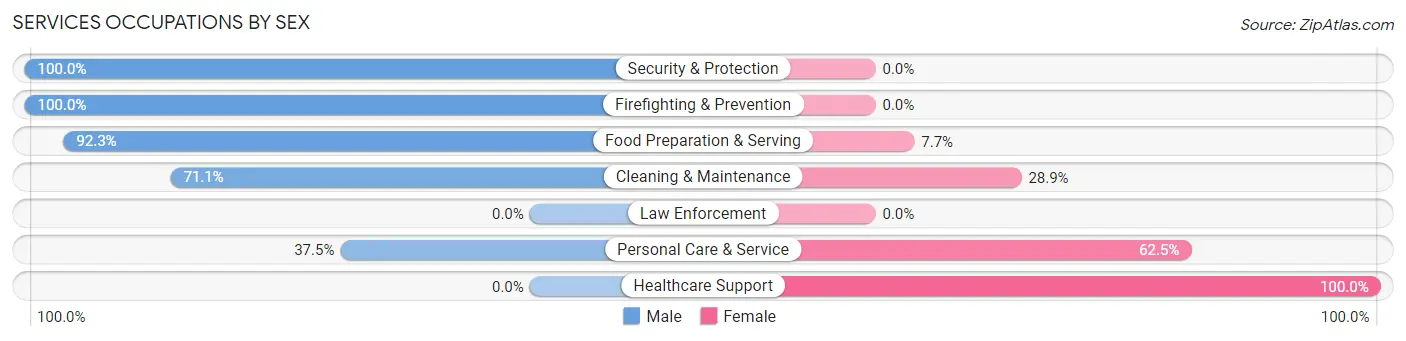
Services Occupations by Sex
Within the Services occupations in Millerton, the most male-oriented occupations are Security & Protection (100.0%), Firefighting & Prevention (100.0%), and Food Preparation & Serving (92.3%), while the most female-oriented occupations are Healthcare Support (100.0%), Personal Care & Service (62.5%), and Cleaning & Maintenance (28.9%).
| Occupation | Male | Female |
| Healthcare Support | 0 (0.0%) | 2 (100.0%) |
| Security & Protection | 4 (100.0%) | 0 (0.0%) |
| Firefighting & Prevention | 4 (100.0%) | 0 (0.0%) |
| Law Enforcement | 0 (0.0%) | 0 (0.0%) |
| Food Preparation & Serving | 48 (92.3%) | 4 (7.7%) |
| Cleaning & Maintenance | 32 (71.1%) | 13 (28.9%) |
| Personal Care & Service | 3 (37.5%) | 5 (62.5%) |
| Total (Category) | 87 (78.4%) | 24 (21.6%) |
| Total (Overall) | 298 (60.7%) | 193 (39.3%) |
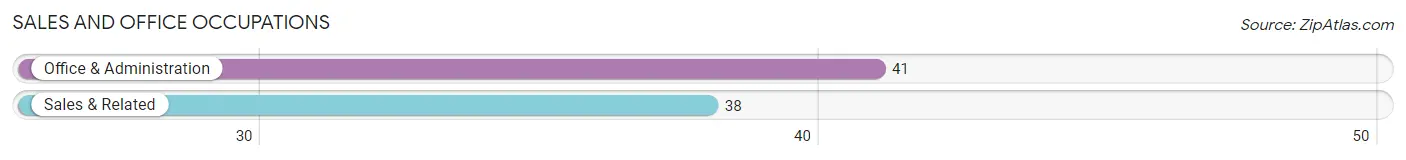
Sales and Office Occupations
The most common Sales and Office occupations in Millerton are Office & Administration (41 | 8.4%), and Sales & Related (38 | 7.7%).
Sales and Office Occupations by Sex
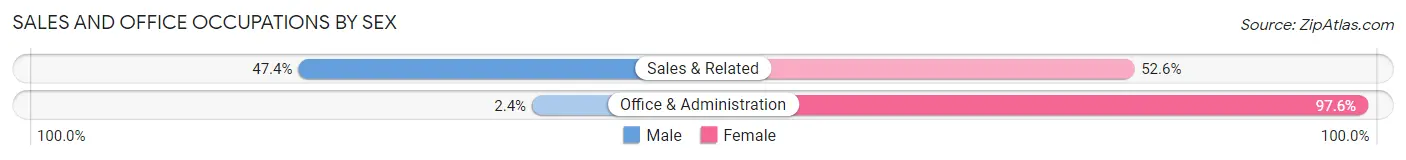
| Occupation | Male | Female |
| Sales & Related | 18 (47.4%) | 20 (52.6%) |
| Office & Administration | 1 (2.4%) | 40 (97.6%) |
| Total (Category) | 19 (24.0%) | 60 (75.9%) |
| Total (Overall) | 298 (60.7%) | 193 (39.3%) |
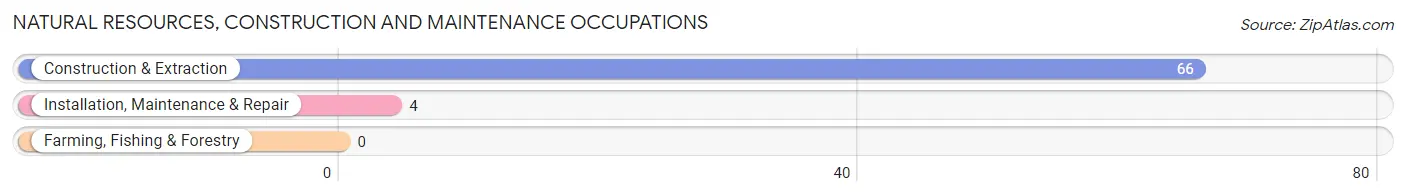
Natural Resources, Construction and Maintenance Occupations
The most common Natural Resources, Construction and Maintenance occupations in Millerton are Construction & Extraction (66 | 13.4%), and Installation, Maintenance & Repair (4 | 0.8%).
Natural Resources, Construction and Maintenance Occupations by Sex
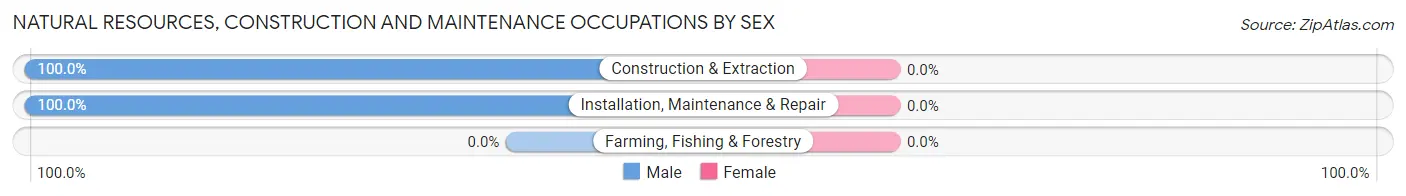
| Occupation | Male | Female |
| Farming, Fishing & Forestry | 0 (0.0%) | 0 (0.0%) |
| Construction & Extraction | 66 (100.0%) | 0 (0.0%) |
| Installation, Maintenance & Repair | 4 (100.0%) | 0 (0.0%) |
| Total (Category) | 70 (100.0%) | 0 (0.0%) |
| Total (Overall) | 298 (60.7%) | 193 (39.3%) |
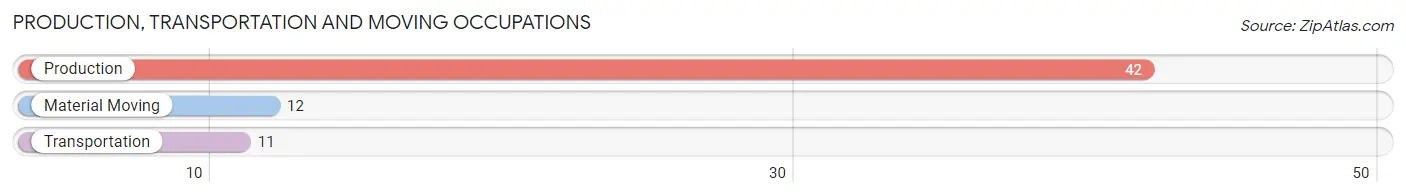
Production, Transportation and Moving Occupations
The most common Production, Transportation and Moving occupations in Millerton are Production (42 | 8.6%), Material Moving (12 | 2.4%), and Transportation (11 | 2.2%).
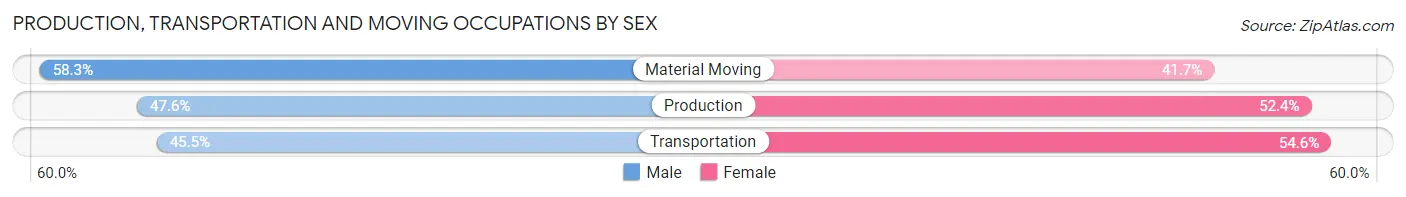
Production, Transportation and Moving Occupations by Sex
| Occupation | Male | Female |
| Production | 20 (47.6%) | 22 (52.4%) |
| Transportation | 5 (45.5%) | 6 (54.5%) |
| Material Moving | 7 (58.3%) | 5 (41.7%) |
| Total (Category) | 32 (49.2%) | 33 (50.8%) |
| Total (Overall) | 298 (60.7%) | 193 (39.3%) |
Employment Industries by Sex in Millerton
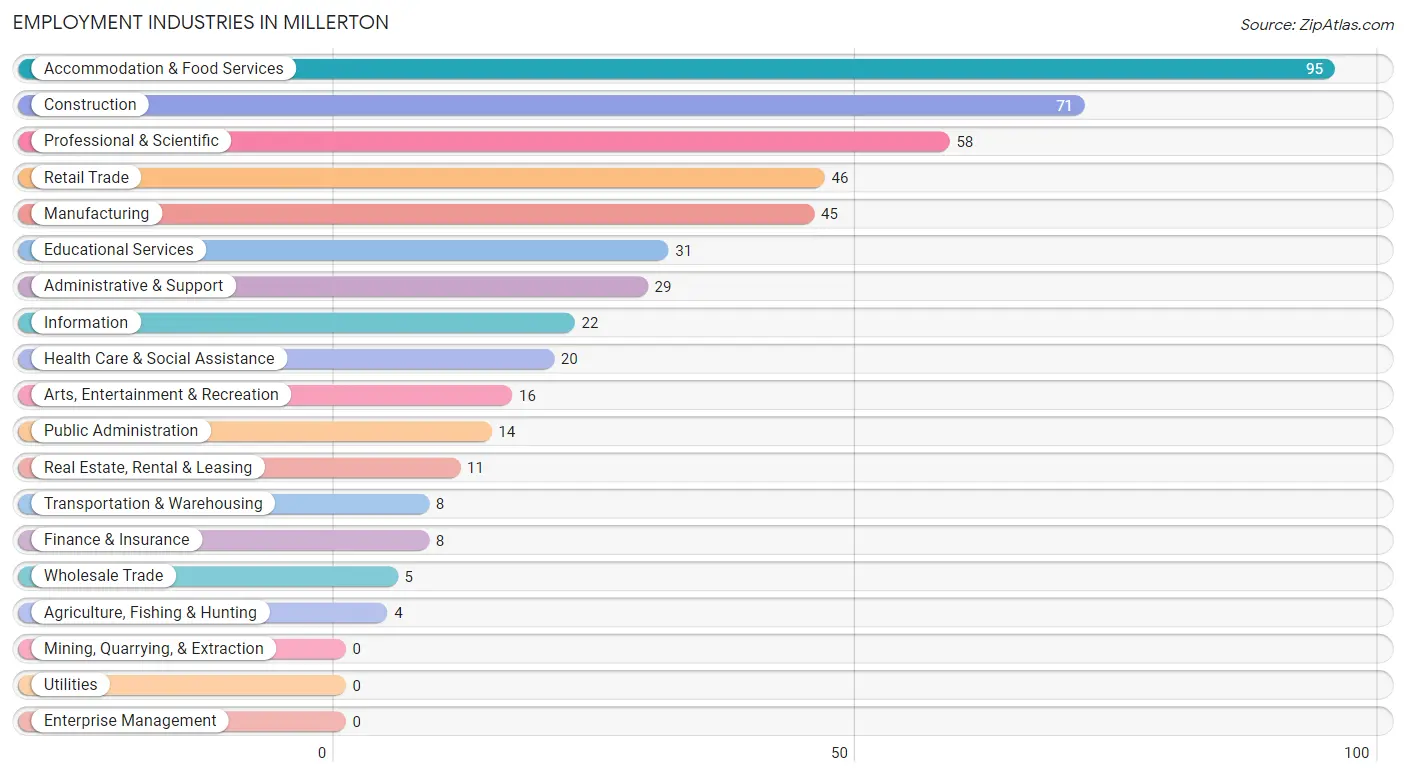
Employment Industries in Millerton
The major employment industries in Millerton include Accommodation & Food Services (95 | 19.4%), Construction (71 | 14.5%), Professional & Scientific (58 | 11.8%), Retail Trade (46 | 9.4%), and Manufacturing (45 | 9.2%).
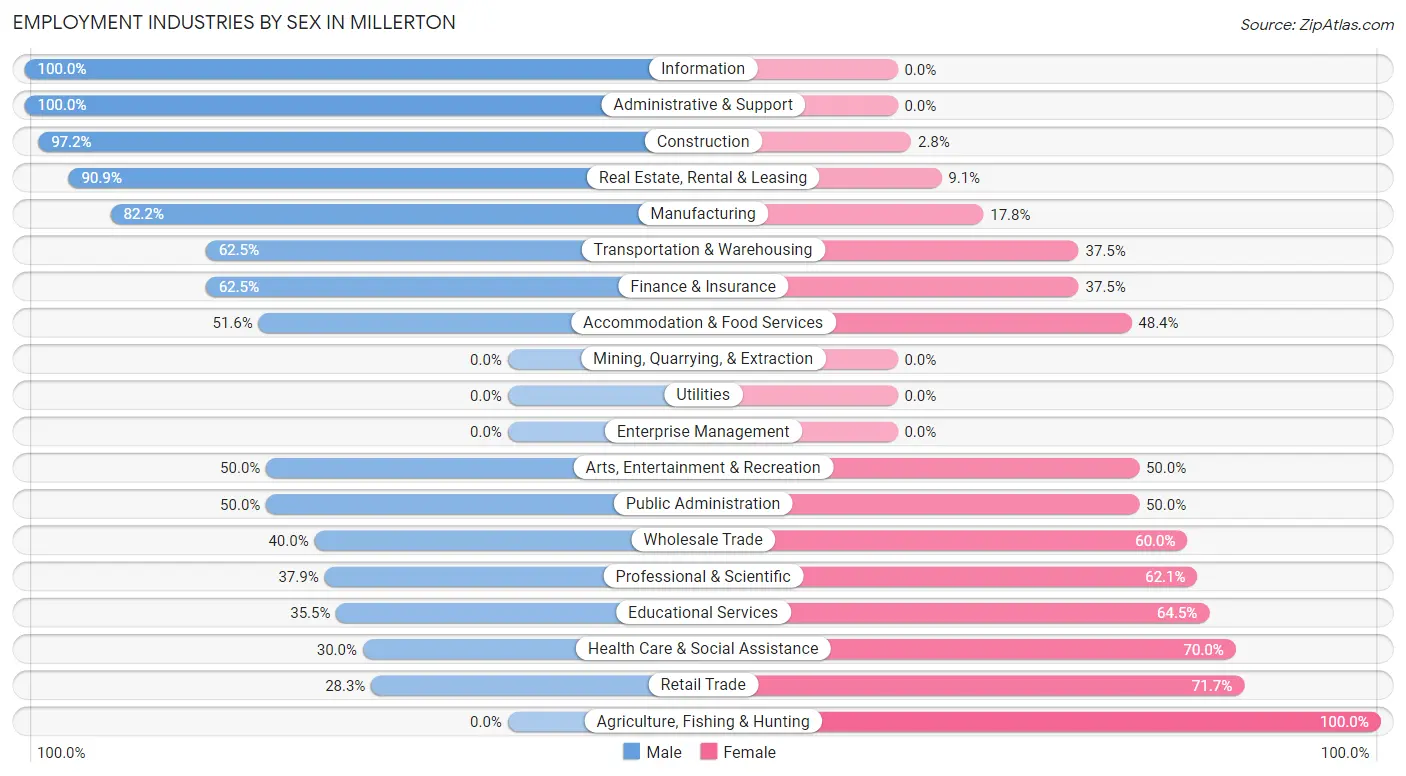
Employment Industries by Sex in Millerton
The Millerton industries that see more men than women are Information (100.0%), Administrative & Support (100.0%), and Construction (97.2%), whereas the industries that tend to have a higher number of women are Agriculture, Fishing & Hunting (100.0%), Retail Trade (71.7%), and Health Care & Social Assistance (70.0%).
| Industry | Male | Female |
| Agriculture, Fishing & Hunting | 0 (0.0%) | 4 (100.0%) |
| Mining, Quarrying, & Extraction | 0 (0.0%) | 0 (0.0%) |
| Construction | 69 (97.2%) | 2 (2.8%) |
| Manufacturing | 37 (82.2%) | 8 (17.8%) |
| Wholesale Trade | 2 (40.0%) | 3 (60.0%) |
| Retail Trade | 13 (28.3%) | 33 (71.7%) |
| Transportation & Warehousing | 5 (62.5%) | 3 (37.5%) |
| Utilities | 0 (0.0%) | 0 (0.0%) |
| Information | 22 (100.0%) | 0 (0.0%) |
| Finance & Insurance | 5 (62.5%) | 3 (37.5%) |
| Real Estate, Rental & Leasing | 10 (90.9%) | 1 (9.1%) |
| Professional & Scientific | 22 (37.9%) | 36 (62.1%) |
| Enterprise Management | 0 (0.0%) | 0 (0.0%) |
| Administrative & Support | 29 (100.0%) | 0 (0.0%) |
| Educational Services | 11 (35.5%) | 20 (64.5%) |
| Health Care & Social Assistance | 6 (30.0%) | 14 (70.0%) |
| Arts, Entertainment & Recreation | 8 (50.0%) | 8 (50.0%) |
| Accommodation & Food Services | 49 (51.6%) | 46 (48.4%) |
| Public Administration | 7 (50.0%) | 7 (50.0%) |
| Total | 298 (60.7%) | 193 (39.3%) |
Education in Millerton
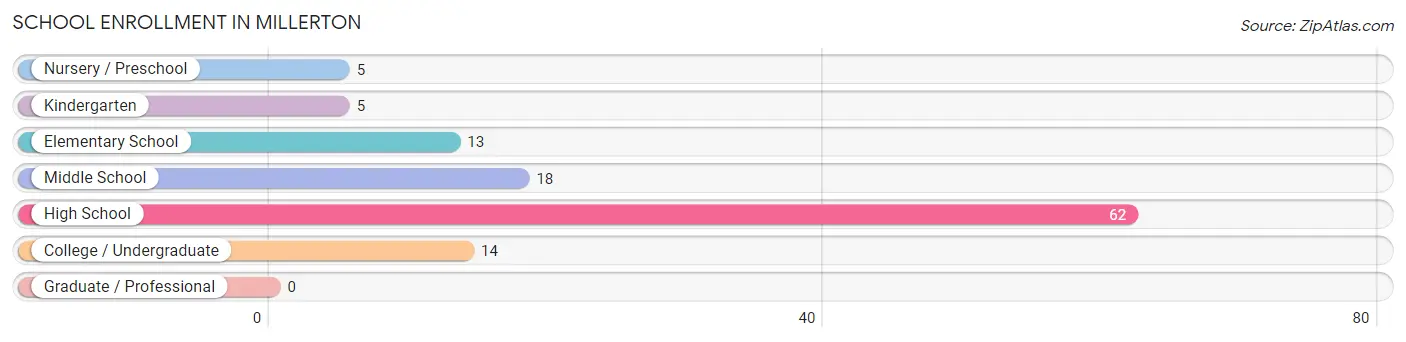
School Enrollment in Millerton
The most common levels of schooling among the 117 students in Millerton are high school (62 | 53.0%), middle school (18 | 15.4%), and college / undergraduate (14 | 12.0%).
| School Level | # Students | % Students |
| Nursery / Preschool | 5 | 4.3% |
| Kindergarten | 5 | 4.3% |
| Elementary School | 13 | 11.1% |
| Middle School | 18 | 15.4% |
| High School | 62 | 53.0% |
| College / Undergraduate | 14 | 12.0% |
| Graduate / Professional | 0 | 0.0% |
| Total | 117 | 100.0% |
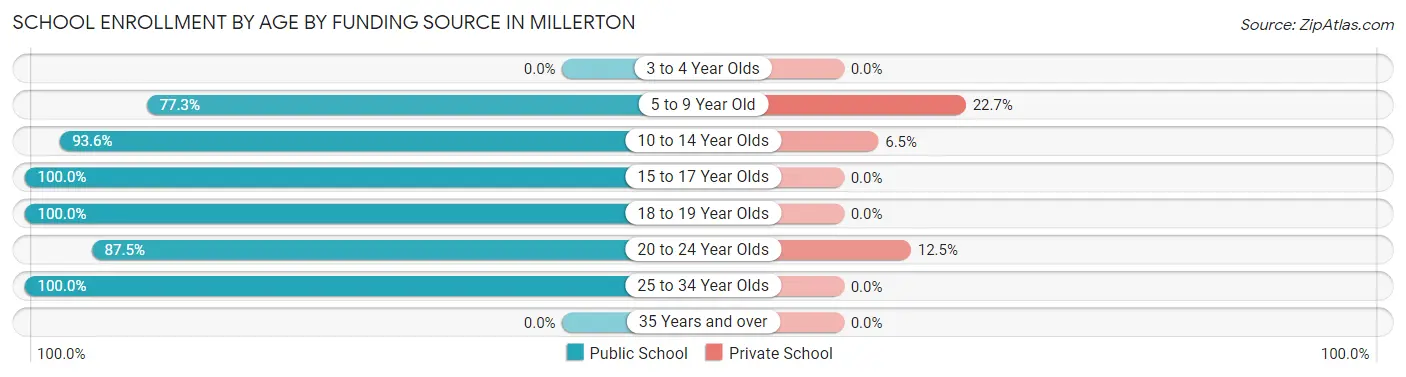
School Enrollment by Age by Funding Source in Millerton
Out of a total of 117 students who are enrolled in schools in Millerton, 9 (7.7%) attend a private institution, while the remaining 108 (92.3%) are enrolled in public schools. The age group of 5 to 9 year old has the highest likelihood of being enrolled in private schools, with 5 (22.7% in the age bracket) enrolled. Conversely, the age group of 15 to 17 year olds has the lowest likelihood of being enrolled in a private school, with 37 (100.0% in the age bracket) attending a public institution.
| Age Bracket | Public School | Private School |
| 3 to 4 Year Olds | 0 (0.0%) | 0 (0.0%) |
| 5 to 9 Year Old | 17 (77.3%) | 5 (22.7%) |
| 10 to 14 Year Olds | 29 (93.5%) | 2 (6.5%) |
| 15 to 17 Year Olds | 37 (100.0%) | 0 (0.0%) |
| 18 to 19 Year Olds | 9 (100.0%) | 0 (0.0%) |
| 20 to 24 Year Olds | 14 (87.5%) | 2 (12.5%) |
| 25 to 34 Year Olds | 2 (100.0%) | 0 (0.0%) |
| 35 Years and over | 0 (0.0%) | 0 (0.0%) |
| Total | 108 (92.3%) | 9 (7.7%) |
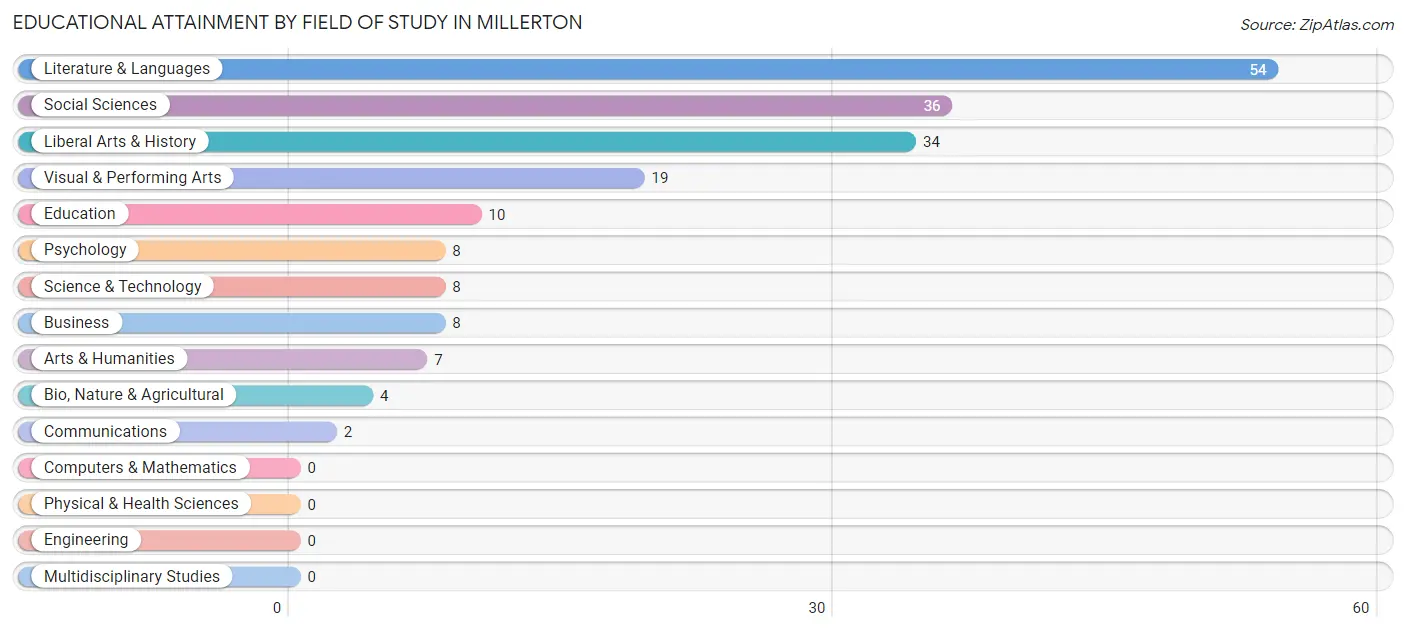
Educational Attainment by Field of Study in Millerton
Literature & languages (54 | 28.4%), social sciences (36 | 19.0%), liberal arts & history (34 | 17.9%), visual & performing arts (19 | 10.0%), and education (10 | 5.3%) are the most common fields of study among 190 individuals in Millerton who have obtained a bachelor's degree or higher.
| Field of Study | # Graduates | % Graduates |
| Computers & Mathematics | 0 | 0.0% |
| Bio, Nature & Agricultural | 4 | 2.1% |
| Physical & Health Sciences | 0 | 0.0% |
| Psychology | 8 | 4.2% |
| Social Sciences | 36 | 19.0% |
| Engineering | 0 | 0.0% |
| Multidisciplinary Studies | 0 | 0.0% |
| Science & Technology | 8 | 4.2% |
| Business | 8 | 4.2% |
| Education | 10 | 5.3% |
| Literature & Languages | 54 | 28.4% |
| Liberal Arts & History | 34 | 17.9% |
| Visual & Performing Arts | 19 | 10.0% |
| Communications | 2 | 1.1% |
| Arts & Humanities | 7 | 3.7% |
| Total | 190 | 100.0% |
Transportation & Commute in Millerton
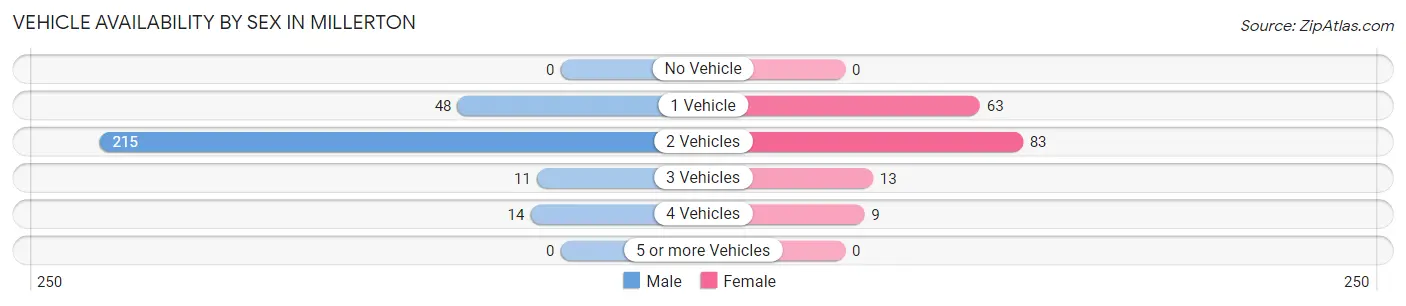
Vehicle Availability by Sex in Millerton
The most prevalent vehicle ownership categories in Millerton are males with 2 vehicles (215, accounting for 74.7%) and females with 2 vehicles (83, making up 128.0%).
| Vehicles Available | Male | Female |
| No Vehicle | 0 (0.0%) | 0 (0.0%) |
| 1 Vehicle | 48 (16.7%) | 63 (37.5%) |
| 2 Vehicles | 215 (74.7%) | 83 (49.4%) |
| 3 Vehicles | 11 (3.8%) | 13 (7.7%) |
| 4 Vehicles | 14 (4.9%) | 9 (5.4%) |
| 5 or more Vehicles | 0 (0.0%) | 0 (0.0%) |
| Total | 288 (100.0%) | 168 (100.0%) |
Commute Time in Millerton
The most frequently occuring commute durations in Millerton are 5 to 9 minutes (106 commuters, 27.8%), 15 to 19 minutes (84 commuters, 22.0%), and 10 to 14 minutes (67 commuters, 17.5%).
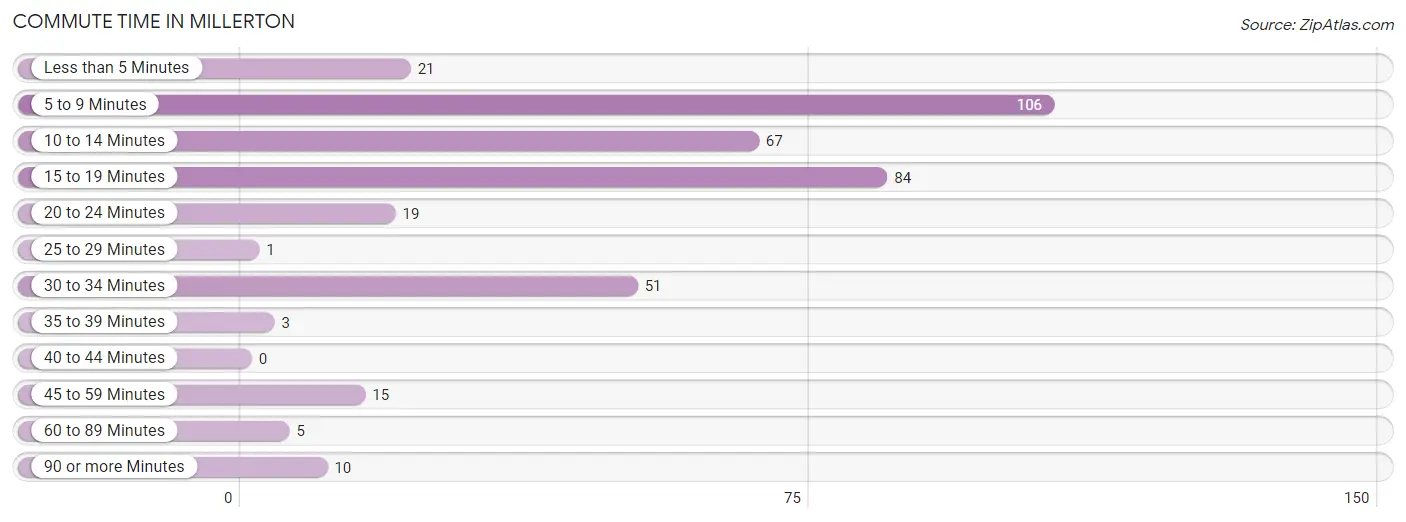
| Commute Time | # Commuters | % Commuters |
| Less than 5 Minutes | 21 | 5.5% |
| 5 to 9 Minutes | 106 | 27.8% |
| 10 to 14 Minutes | 67 | 17.5% |
| 15 to 19 Minutes | 84 | 22.0% |
| 20 to 24 Minutes | 19 | 5.0% |
| 25 to 29 Minutes | 1 | 0.3% |
| 30 to 34 Minutes | 51 | 13.4% |
| 35 to 39 Minutes | 3 | 0.8% |
| 40 to 44 Minutes | 0 | 0.0% |
| 45 to 59 Minutes | 15 | 3.9% |
| 60 to 89 Minutes | 5 | 1.3% |
| 90 or more Minutes | 10 | 2.6% |
Commute Time by Sex in Millerton
The most common commute times in Millerton are 15 to 19 minutes (68 commuters, 26.2%) for males and 5 to 9 minutes (44 commuters, 36.1%) for females.
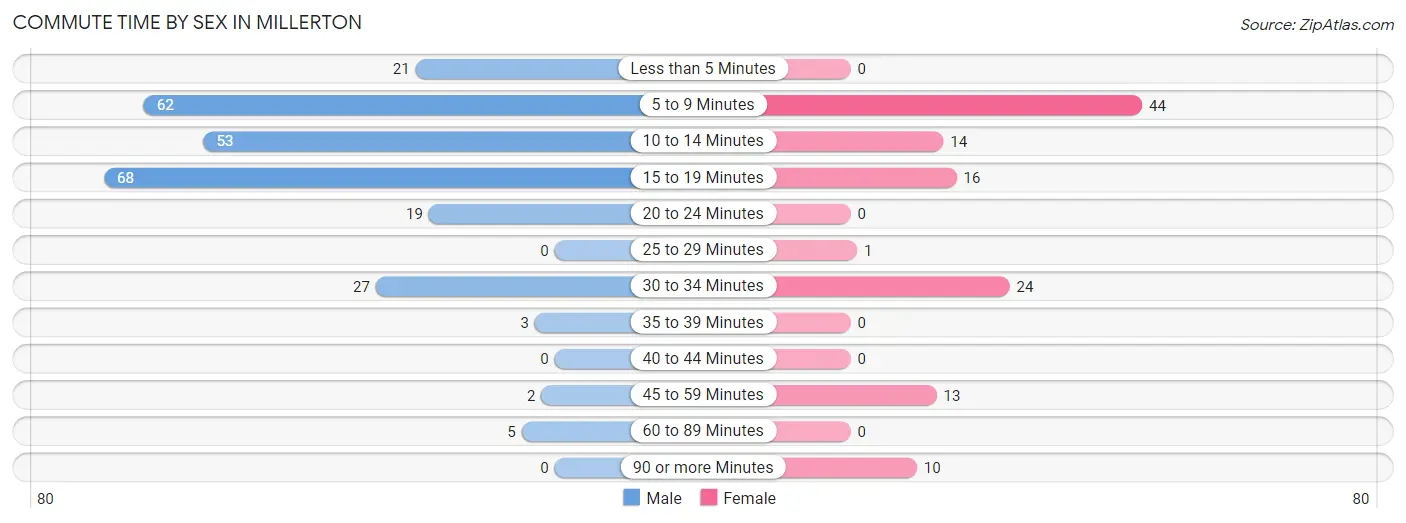
| Commute Time | Male | Female |
| Less than 5 Minutes | 21 (8.1%) | 0 (0.0%) |
| 5 to 9 Minutes | 62 (23.8%) | 44 (36.1%) |
| 10 to 14 Minutes | 53 (20.4%) | 14 (11.5%) |
| 15 to 19 Minutes | 68 (26.2%) | 16 (13.1%) |
| 20 to 24 Minutes | 19 (7.3%) | 0 (0.0%) |
| 25 to 29 Minutes | 0 (0.0%) | 1 (0.8%) |
| 30 to 34 Minutes | 27 (10.4%) | 24 (19.7%) |
| 35 to 39 Minutes | 3 (1.1%) | 0 (0.0%) |
| 40 to 44 Minutes | 0 (0.0%) | 0 (0.0%) |
| 45 to 59 Minutes | 2 (0.8%) | 13 (10.7%) |
| 60 to 89 Minutes | 5 (1.9%) | 0 (0.0%) |
| 90 or more Minutes | 0 (0.0%) | 10 (8.2%) |
Time of Departure to Work by Sex in Millerton
The most frequent times of departure to work in Millerton are 7:00 AM to 7:29 AM (68, 26.2%) for males and 7:00 AM to 7:29 AM (43, 35.2%) for females.
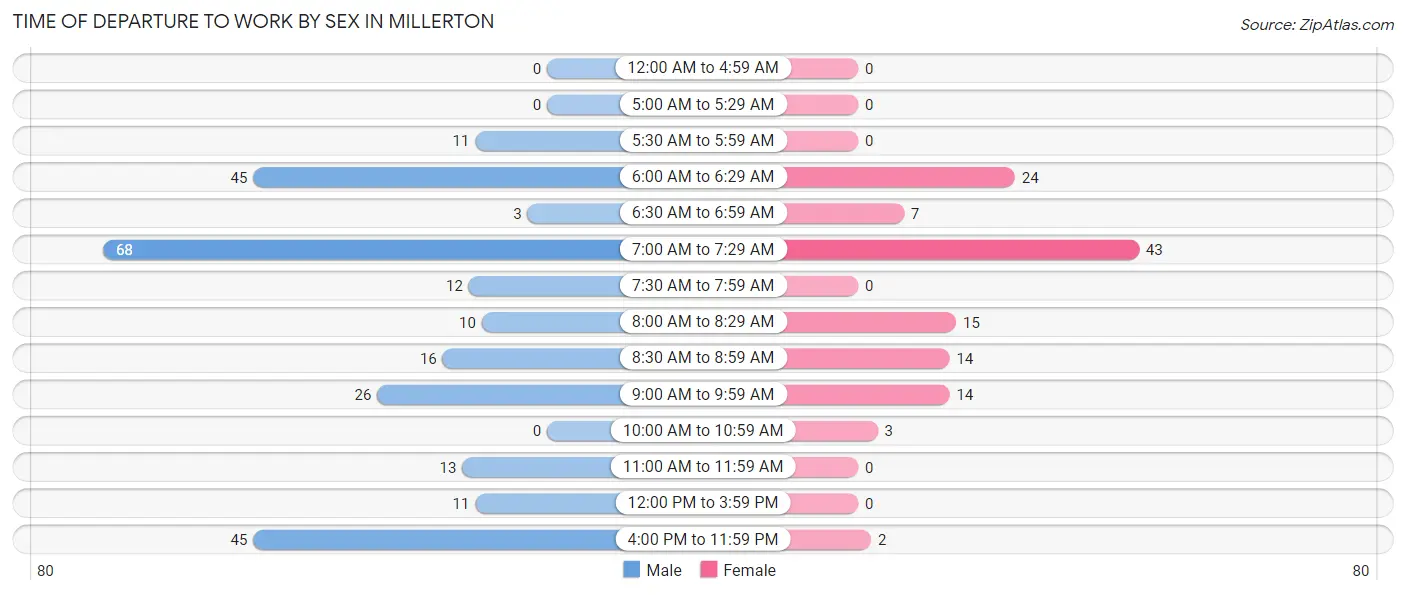
| Time of Departure | Male | Female |
| 12:00 AM to 4:59 AM | 0 (0.0%) | 0 (0.0%) |
| 5:00 AM to 5:29 AM | 0 (0.0%) | 0 (0.0%) |
| 5:30 AM to 5:59 AM | 11 (4.2%) | 0 (0.0%) |
| 6:00 AM to 6:29 AM | 45 (17.3%) | 24 (19.7%) |
| 6:30 AM to 6:59 AM | 3 (1.1%) | 7 (5.7%) |
| 7:00 AM to 7:29 AM | 68 (26.2%) | 43 (35.2%) |
| 7:30 AM to 7:59 AM | 12 (4.6%) | 0 (0.0%) |
| 8:00 AM to 8:29 AM | 10 (3.8%) | 15 (12.3%) |
| 8:30 AM to 8:59 AM | 16 (6.1%) | 14 (11.5%) |
| 9:00 AM to 9:59 AM | 26 (10.0%) | 14 (11.5%) |
| 10:00 AM to 10:59 AM | 0 (0.0%) | 3 (2.5%) |
| 11:00 AM to 11:59 AM | 13 (5.0%) | 0 (0.0%) |
| 12:00 PM to 3:59 PM | 11 (4.2%) | 0 (0.0%) |
| 4:00 PM to 11:59 PM | 45 (17.3%) | 2 (1.6%) |
| Total | 260 (100.0%) | 122 (100.0%) |
Housing Occupancy in Millerton
Occupancy by Ownership in Millerton
Of the total 322 dwellings in Millerton, owner-occupied units account for 173 (53.7%), while renter-occupied units make up 149 (46.3%).
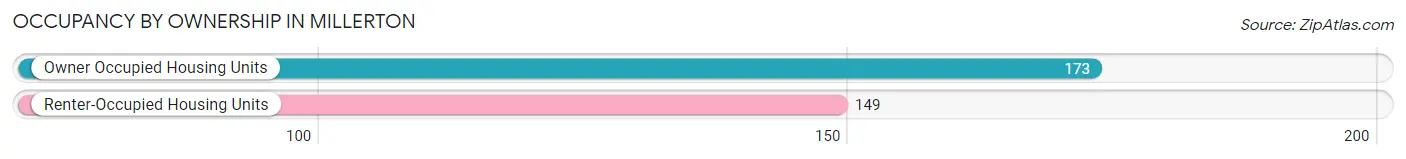
| Occupancy | # Housing Units | % Housing Units |
| Owner Occupied Housing Units | 173 | 53.7% |
| Renter-Occupied Housing Units | 149 | 46.3% |
| Total Occupied Housing Units | 322 | 100.0% |
Occupancy by Household Size in Millerton
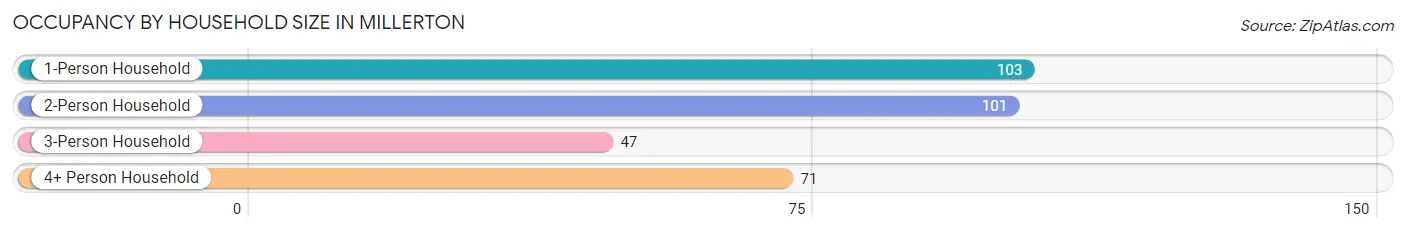
| Household Size | # Housing Units | % Housing Units |
| 1-Person Household | 103 | 32.0% |
| 2-Person Household | 101 | 31.4% |
| 3-Person Household | 47 | 14.6% |
| 4+ Person Household | 71 | 22.1% |
| Total Housing Units | 322 | 100.0% |
Occupancy by Ownership by Household Size in Millerton
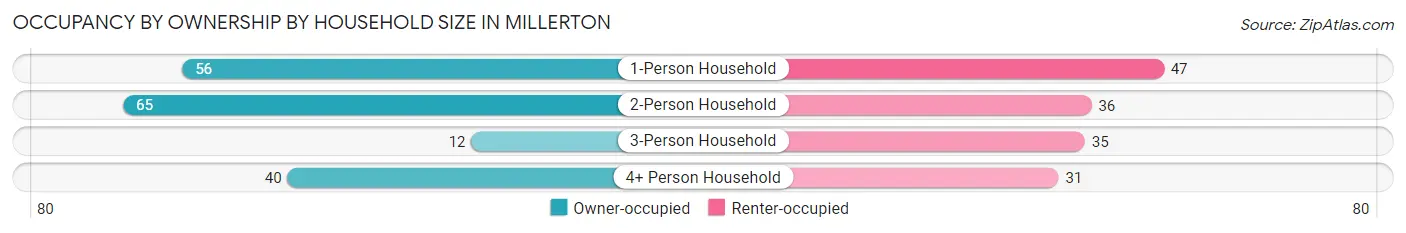
| Household Size | Owner-occupied | Renter-occupied |
| 1-Person Household | 56 (54.4%) | 47 (45.6%) |
| 2-Person Household | 65 (64.4%) | 36 (35.6%) |
| 3-Person Household | 12 (25.5%) | 35 (74.5%) |
| 4+ Person Household | 40 (56.3%) | 31 (43.7%) |
| Total Housing Units | 173 (53.7%) | 149 (46.3%) |
Occupancy by Educational Attainment in Millerton
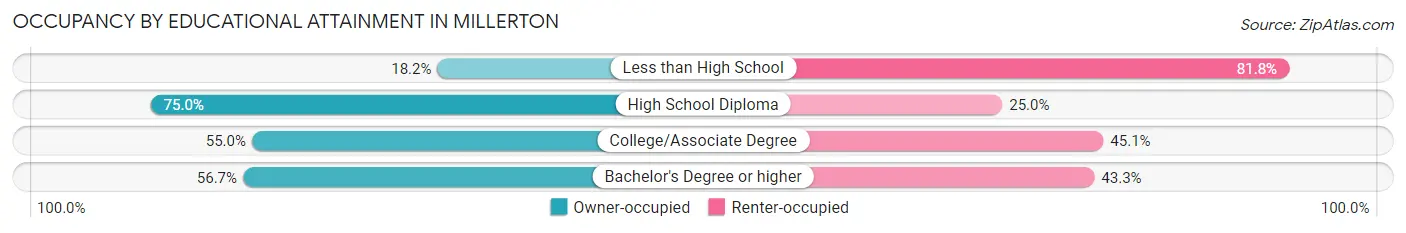
| Household Size | Owner-occupied | Renter-occupied |
| Less than High School | 10 (18.2%) | 45 (81.8%) |
| High School Diploma | 54 (75.0%) | 18 (25.0%) |
| College/Associate Degree | 50 (54.9%) | 41 (45.1%) |
| Bachelor's Degree or higher | 59 (56.7%) | 45 (43.3%) |
Occupancy by Age of Householder in Millerton
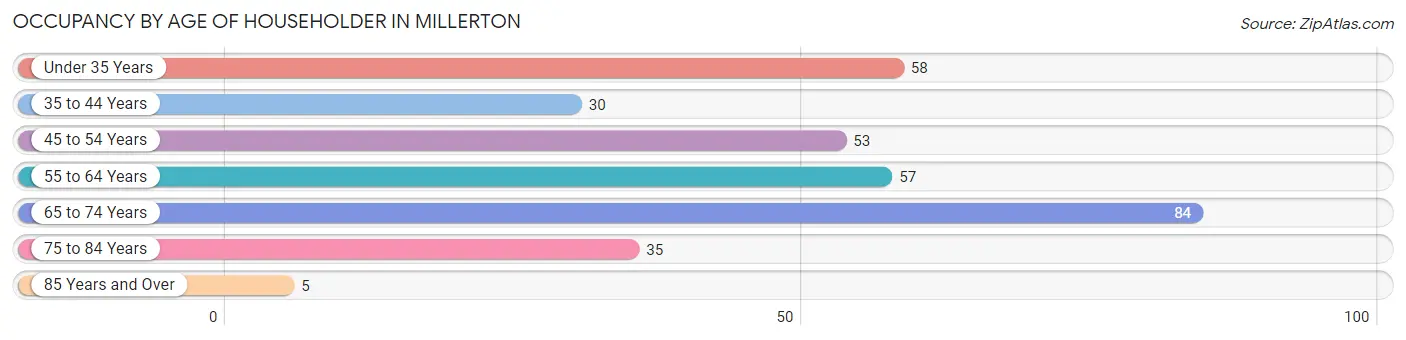
| Age Bracket | # Households | % Households |
| Under 35 Years | 58 | 18.0% |
| 35 to 44 Years | 30 | 9.3% |
| 45 to 54 Years | 53 | 16.5% |
| 55 to 64 Years | 57 | 17.7% |
| 65 to 74 Years | 84 | 26.1% |
| 75 to 84 Years | 35 | 10.9% |
| 85 Years and Over | 5 | 1.5% |
| Total | 322 | 100.0% |
Housing Finances in Millerton
Median Income by Occupancy in Millerton
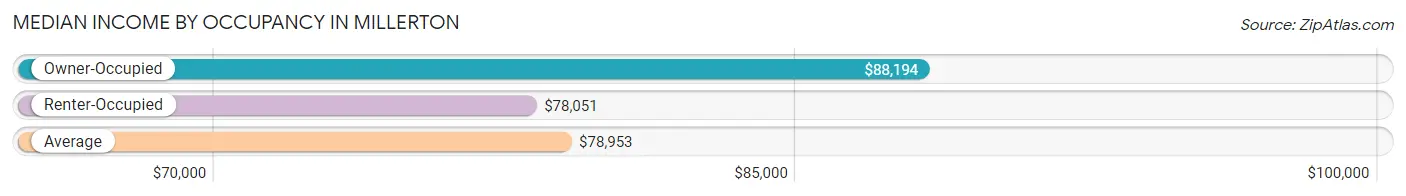
| Occupancy Type | # Households | Median Income |
| Owner-Occupied | 173 (53.7%) | $88,194 |
| Renter-Occupied | 149 (46.3%) | $78,051 |
| Average | 322 (100.0%) | $78,953 |
Occupancy by Householder Income Bracket in Millerton
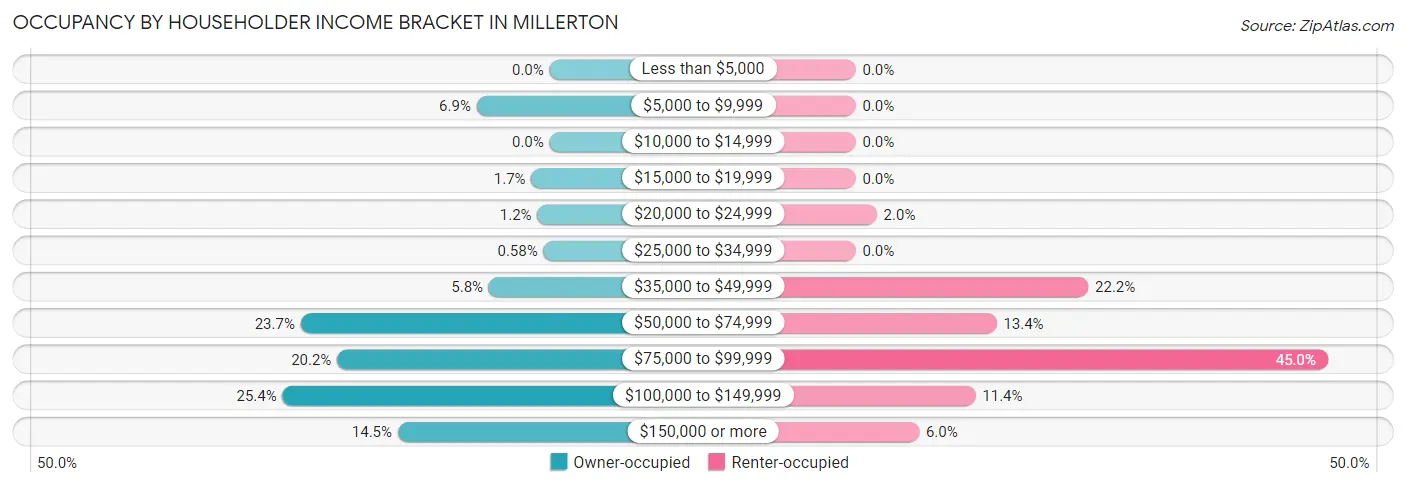
| Income Bracket | Owner-occupied | Renter-occupied |
| Less than $5,000 | 0 (0.0%) | 0 (0.0%) |
| $5,000 to $9,999 | 12 (6.9%) | 0 (0.0%) |
| $10,000 to $14,999 | 0 (0.0%) | 0 (0.0%) |
| $15,000 to $19,999 | 3 (1.7%) | 0 (0.0%) |
| $20,000 to $24,999 | 2 (1.2%) | 3 (2.0%) |
| $25,000 to $34,999 | 1 (0.6%) | 0 (0.0%) |
| $35,000 to $49,999 | 10 (5.8%) | 33 (22.2%) |
| $50,000 to $74,999 | 41 (23.7%) | 20 (13.4%) |
| $75,000 to $99,999 | 35 (20.2%) | 67 (45.0%) |
| $100,000 to $149,999 | 44 (25.4%) | 17 (11.4%) |
| $150,000 or more | 25 (14.4%) | 9 (6.0%) |
| Total | 173 (100.0%) | 149 (100.0%) |
Monthly Housing Cost Tiers in Millerton
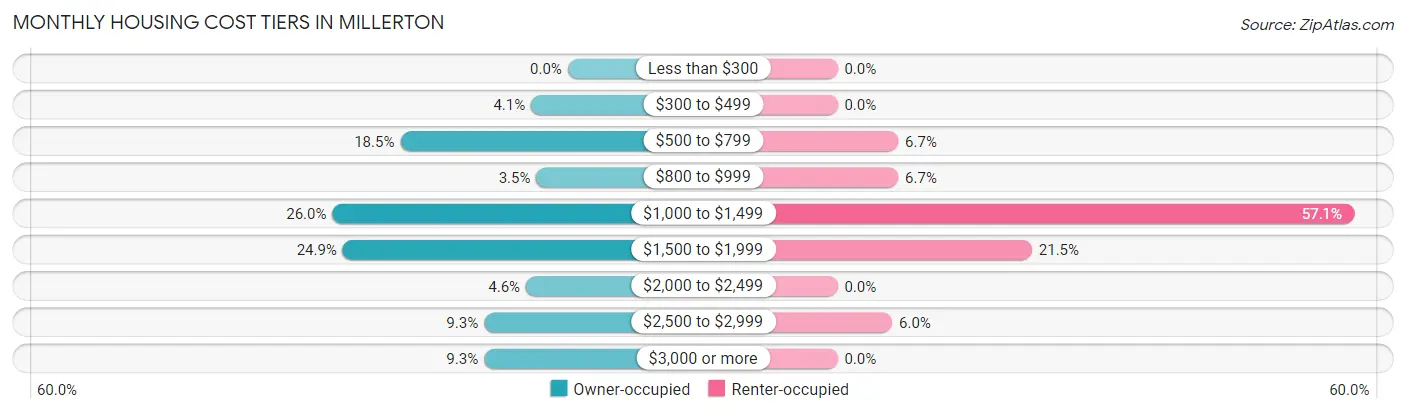
| Monthly Cost | Owner-occupied | Renter-occupied |
| Less than $300 | 0 (0.0%) | 0 (0.0%) |
| $300 to $499 | 7 (4.1%) | 0 (0.0%) |
| $500 to $799 | 32 (18.5%) | 10 (6.7%) |
| $800 to $999 | 6 (3.5%) | 10 (6.7%) |
| $1,000 to $1,499 | 45 (26.0%) | 85 (57.1%) |
| $1,500 to $1,999 | 43 (24.9%) | 32 (21.5%) |
| $2,000 to $2,499 | 8 (4.6%) | 0 (0.0%) |
| $2,500 to $2,999 | 16 (9.2%) | 9 (6.0%) |
| $3,000 or more | 16 (9.2%) | 0 (0.0%) |
| Total | 173 (100.0%) | 149 (100.0%) |
Physical Housing Characteristics in Millerton
Housing Structures in Millerton
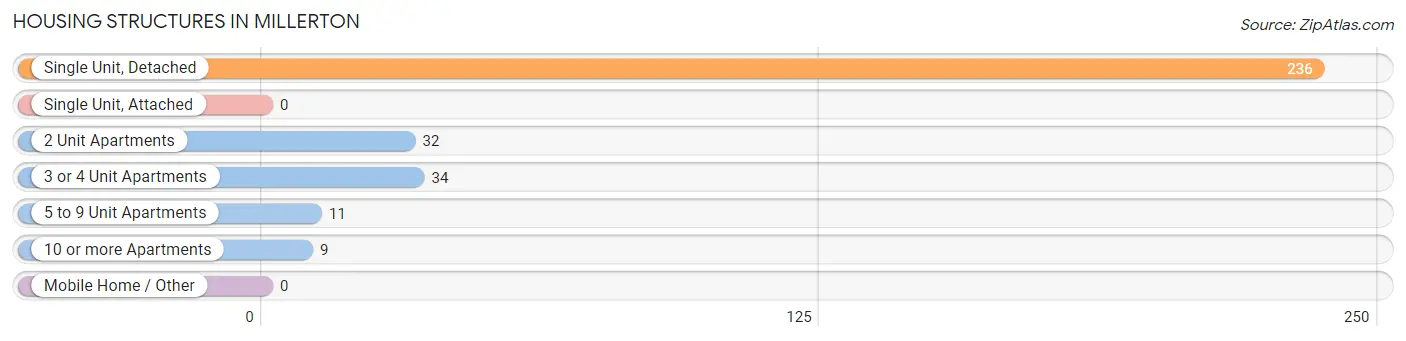
| Structure Type | # Housing Units | % Housing Units |
| Single Unit, Detached | 236 | 73.3% |
| Single Unit, Attached | 0 | 0.0% |
| 2 Unit Apartments | 32 | 9.9% |
| 3 or 4 Unit Apartments | 34 | 10.6% |
| 5 to 9 Unit Apartments | 11 | 3.4% |
| 10 or more Apartments | 9 | 2.8% |
| Mobile Home / Other | 0 | 0.0% |
| Total | 322 | 100.0% |
Housing Structures by Occupancy in Millerton
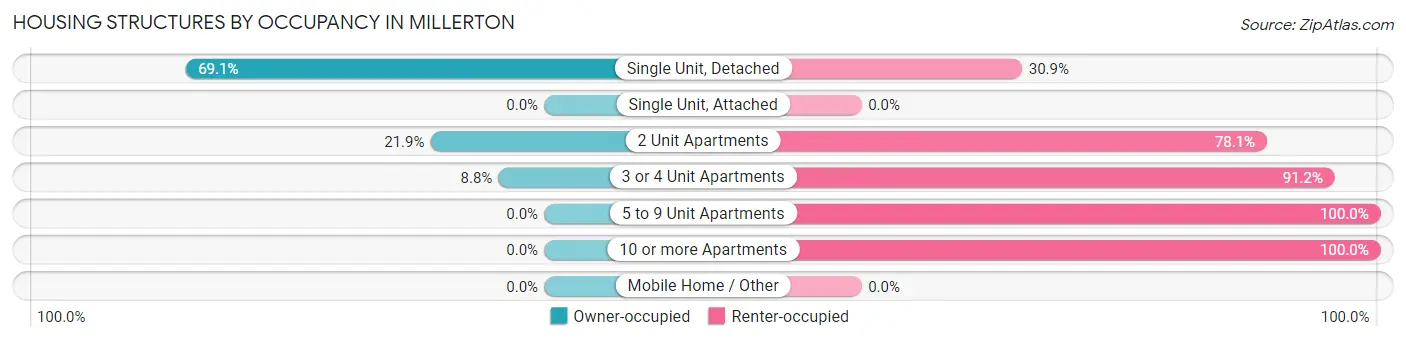
| Structure Type | Owner-occupied | Renter-occupied |
| Single Unit, Detached | 163 (69.1%) | 73 (30.9%) |
| Single Unit, Attached | 0 (0.0%) | 0 (0.0%) |
| 2 Unit Apartments | 7 (21.9%) | 25 (78.1%) |
| 3 or 4 Unit Apartments | 3 (8.8%) | 31 (91.2%) |
| 5 to 9 Unit Apartments | 0 (0.0%) | 11 (100.0%) |
| 10 or more Apartments | 0 (0.0%) | 9 (100.0%) |
| Mobile Home / Other | 0 (0.0%) | 0 (0.0%) |
| Total | 173 (53.7%) | 149 (46.3%) |
Housing Structures by Number of Rooms in Millerton
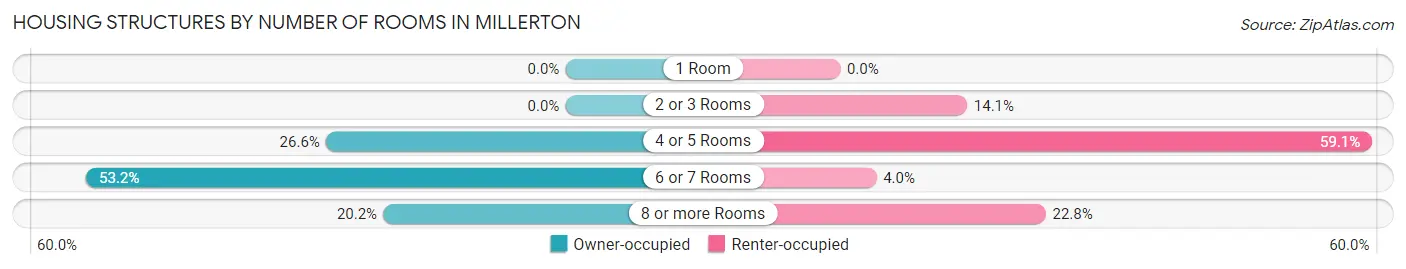
| Number of Rooms | Owner-occupied | Renter-occupied |
| 1 Room | 0 (0.0%) | 0 (0.0%) |
| 2 or 3 Rooms | 0 (0.0%) | 21 (14.1%) |
| 4 or 5 Rooms | 46 (26.6%) | 88 (59.1%) |
| 6 or 7 Rooms | 92 (53.2%) | 6 (4.0%) |
| 8 or more Rooms | 35 (20.2%) | 34 (22.8%) |
| Total | 173 (100.0%) | 149 (100.0%) |
Housing Structure by Heating Type in Millerton
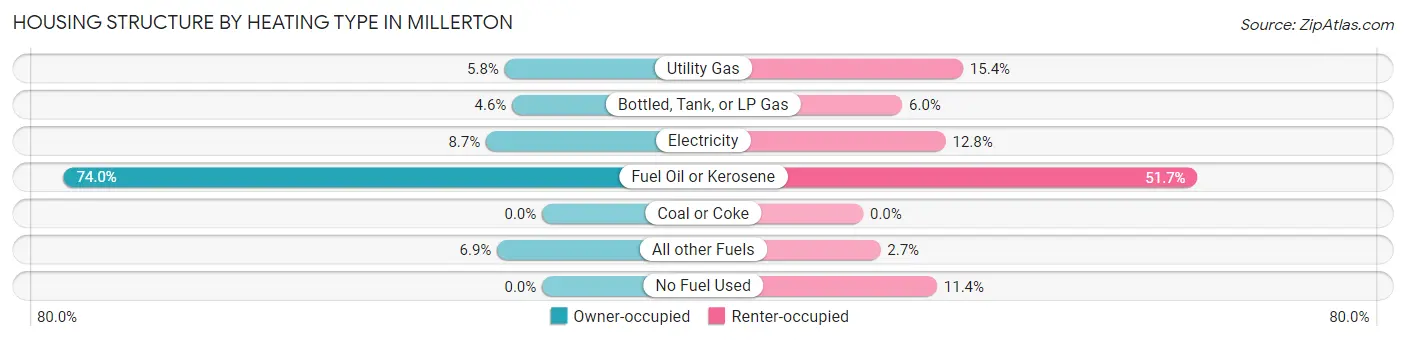
| Heating Type | Owner-occupied | Renter-occupied |
| Utility Gas | 10 (5.8%) | 23 (15.4%) |
| Bottled, Tank, or LP Gas | 8 (4.6%) | 9 (6.0%) |
| Electricity | 15 (8.7%) | 19 (12.8%) |
| Fuel Oil or Kerosene | 128 (74.0%) | 77 (51.7%) |
| Coal or Coke | 0 (0.0%) | 0 (0.0%) |
| All other Fuels | 12 (6.9%) | 4 (2.7%) |
| No Fuel Used | 0 (0.0%) | 17 (11.4%) |
| Total | 173 (100.0%) | 149 (100.0%) |
Household Vehicle Usage in Millerton
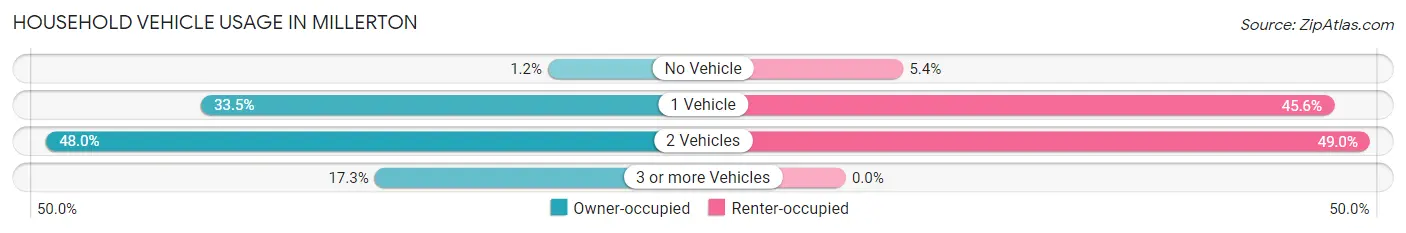
| Vehicles per Household | Owner-occupied | Renter-occupied |
| No Vehicle | 2 (1.2%) | 8 (5.4%) |
| 1 Vehicle | 58 (33.5%) | 68 (45.6%) |
| 2 Vehicles | 83 (48.0%) | 73 (49.0%) |
| 3 or more Vehicles | 30 (17.3%) | 0 (0.0%) |
| Total | 173 (100.0%) | 149 (100.0%) |
Real Estate & Mortgages in Millerton
Real Estate and Mortgage Overview in Millerton
| Characteristic | Without Mortgage | With Mortgage |
| Housing Units | 63 | 110 |
| Median Property Value | $227,000 | $252,600 |
| Median Household Income | $88,194 | $20 |
| Monthly Housing Costs | $717 | $16 |
| Real Estate Taxes | $4,288 | $0 |
Property Value by Mortgage Status in Millerton
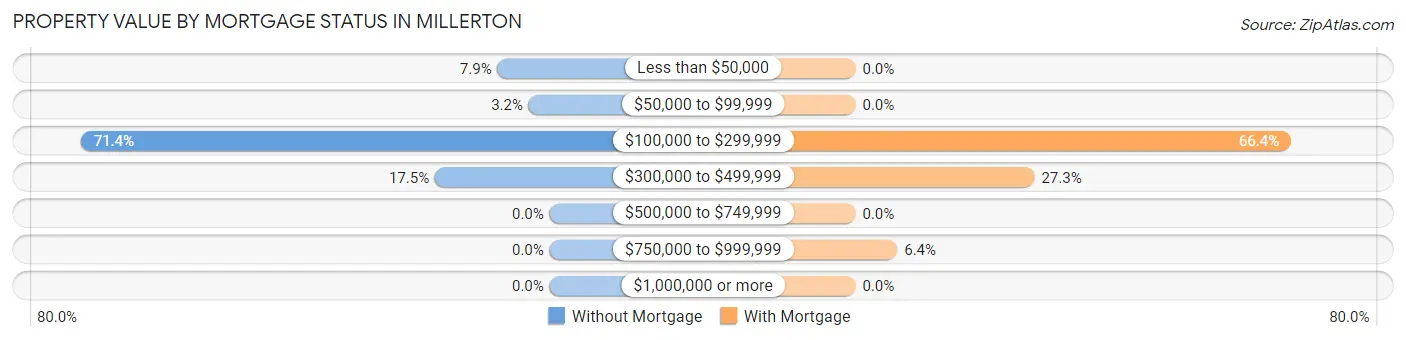
| Property Value | Without Mortgage | With Mortgage |
| Less than $50,000 | 5 (7.9%) | 0 (0.0%) |
| $50,000 to $99,999 | 2 (3.2%) | 0 (0.0%) |
| $100,000 to $299,999 | 45 (71.4%) | 73 (66.4%) |
| $300,000 to $499,999 | 11 (17.5%) | 30 (27.3%) |
| $500,000 to $749,999 | 0 (0.0%) | 0 (0.0%) |
| $750,000 to $999,999 | 0 (0.0%) | 7 (6.4%) |
| $1,000,000 or more | 0 (0.0%) | 0 (0.0%) |
| Total | 63 (100.0%) | 110 (100.0%) |
Household Income by Mortgage Status in Millerton
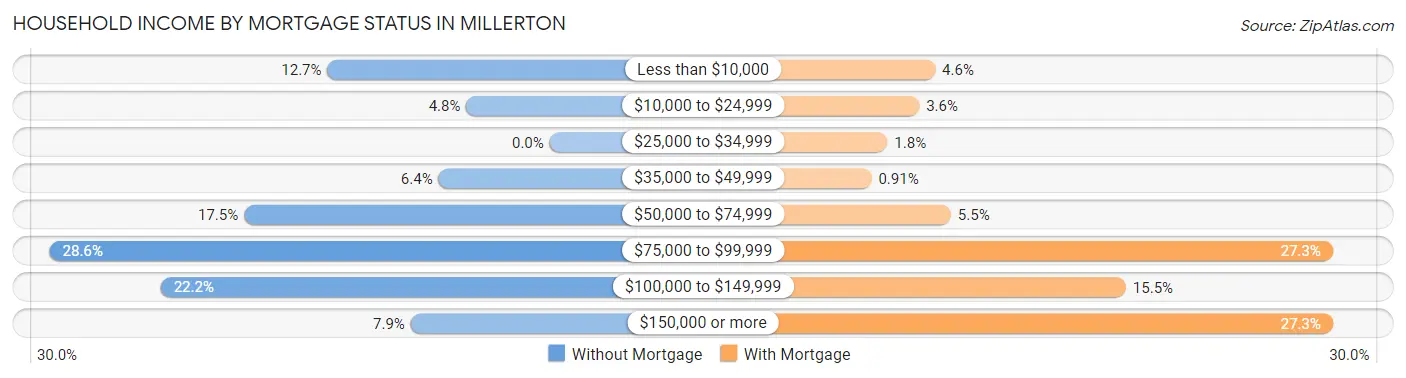
| Household Income | Without Mortgage | With Mortgage |
| Less than $10,000 | 8 (12.7%) | 5 (4.5%) |
| $10,000 to $24,999 | 3 (4.8%) | 4 (3.6%) |
| $25,000 to $34,999 | 0 (0.0%) | 2 (1.8%) |
| $35,000 to $49,999 | 4 (6.4%) | 1 (0.9%) |
| $50,000 to $74,999 | 11 (17.5%) | 6 (5.4%) |
| $75,000 to $99,999 | 18 (28.6%) | 30 (27.3%) |
| $100,000 to $149,999 | 14 (22.2%) | 17 (15.4%) |
| $150,000 or more | 5 (7.9%) | 30 (27.3%) |
| Total | 63 (100.0%) | 110 (100.0%) |
Property Value to Household Income Ratio in Millerton
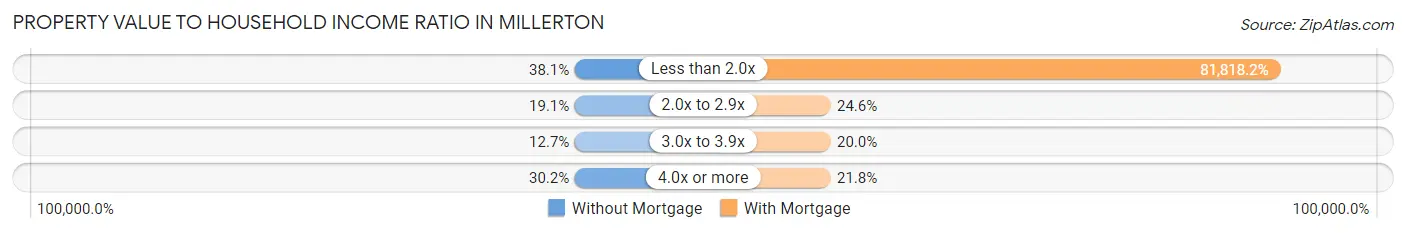
| Value-to-Income Ratio | Without Mortgage | With Mortgage |
| Less than 2.0x | 24 (38.1%) | 90,000 (81,818.2%) |
| 2.0x to 2.9x | 12 (19.1%) | 27 (24.5%) |
| 3.0x to 3.9x | 8 (12.7%) | 22 (20.0%) |
| 4.0x or more | 19 (30.2%) | 24 (21.8%) |
| Total | 63 (100.0%) | 110 (100.0%) |
Real Estate Taxes by Mortgage Status in Millerton
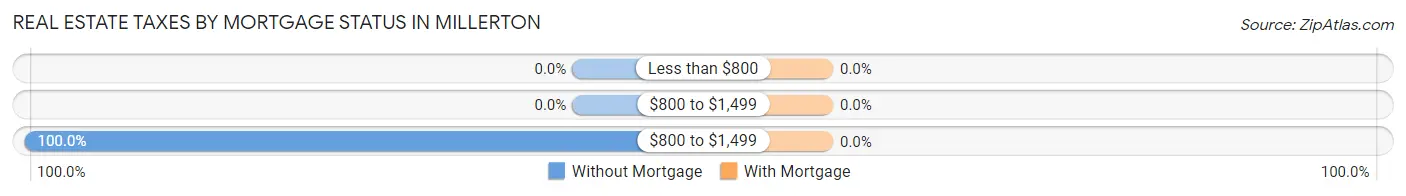
| Property Taxes | Without Mortgage | With Mortgage |
| Less than $800 | 0 (0.0%) | 0 (0.0%) |
| $800 to $1,499 | 0 (0.0%) | 0 (0.0%) |
| $800 to $1,499 | 63 (100.0%) | 0 (0.0%) |
| Total | 63 (100.0%) | 110 (100.0%) |
Health & Disability in Millerton
Health Insurance Coverage by Age in Millerton
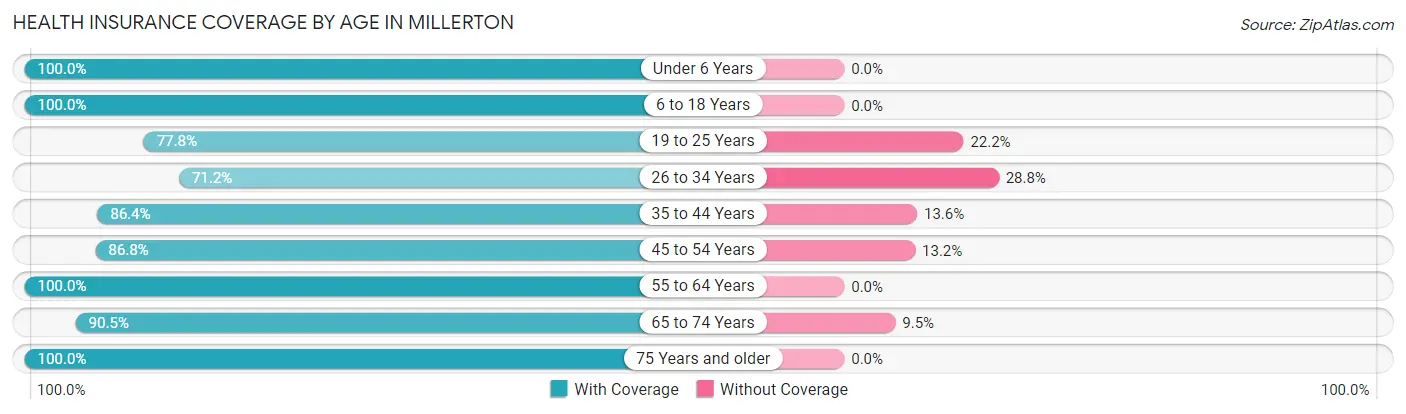
| Age Bracket | With Coverage | Without Coverage |
| Under 6 Years | 64 (100.0%) | 0 (0.0%) |
| 6 to 18 Years | 89 (100.0%) | 0 (0.0%) |
| 19 to 25 Years | 91 (77.8%) | 26 (22.2%) |
| 26 to 34 Years | 94 (71.2%) | 38 (28.8%) |
| 35 to 44 Years | 51 (86.4%) | 8 (13.6%) |
| 45 to 54 Years | 92 (86.8%) | 14 (13.2%) |
| 55 to 64 Years | 95 (100.0%) | 0 (0.0%) |
| 65 to 74 Years | 133 (90.5%) | 14 (9.5%) |
| 75 Years and older | 53 (100.0%) | 0 (0.0%) |
| Total | 762 (88.4%) | 100 (11.6%) |
Health Insurance Coverage by Citizenship Status in Millerton
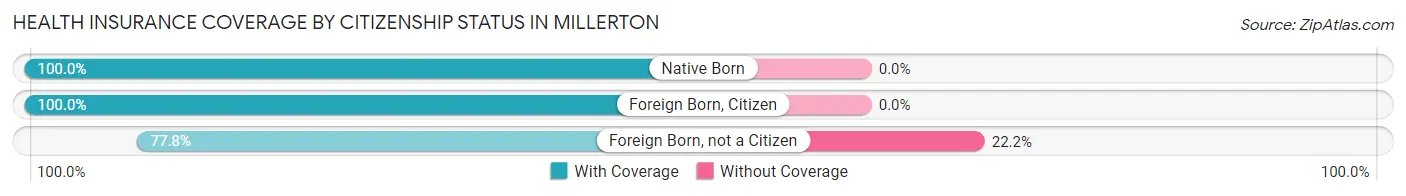
| Citizenship Status | With Coverage | Without Coverage |
| Native Born | 64 (100.0%) | 0 (0.0%) |
| Foreign Born, Citizen | 89 (100.0%) | 0 (0.0%) |
| Foreign Born, not a Citizen | 91 (77.8%) | 26 (22.2%) |
Health Insurance Coverage by Household Income in Millerton
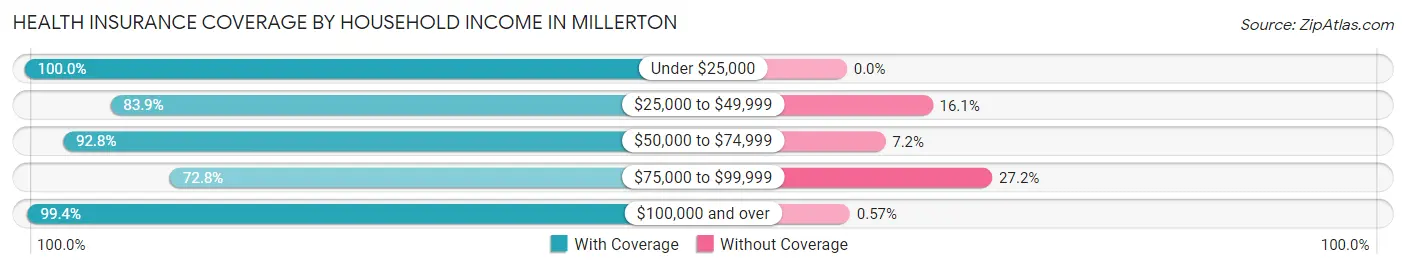
| Household Income | With Coverage | Without Coverage |
| Under $25,000 | 20 (100.0%) | 0 (0.0%) |
| $25,000 to $49,999 | 141 (83.9%) | 27 (16.1%) |
| $50,000 to $74,999 | 103 (92.8%) | 8 (7.2%) |
| $75,000 to $99,999 | 147 (72.8%) | 55 (27.2%) |
| $100,000 and over | 346 (99.4%) | 2 (0.6%) |
Public vs Private Health Insurance Coverage by Age in Millerton
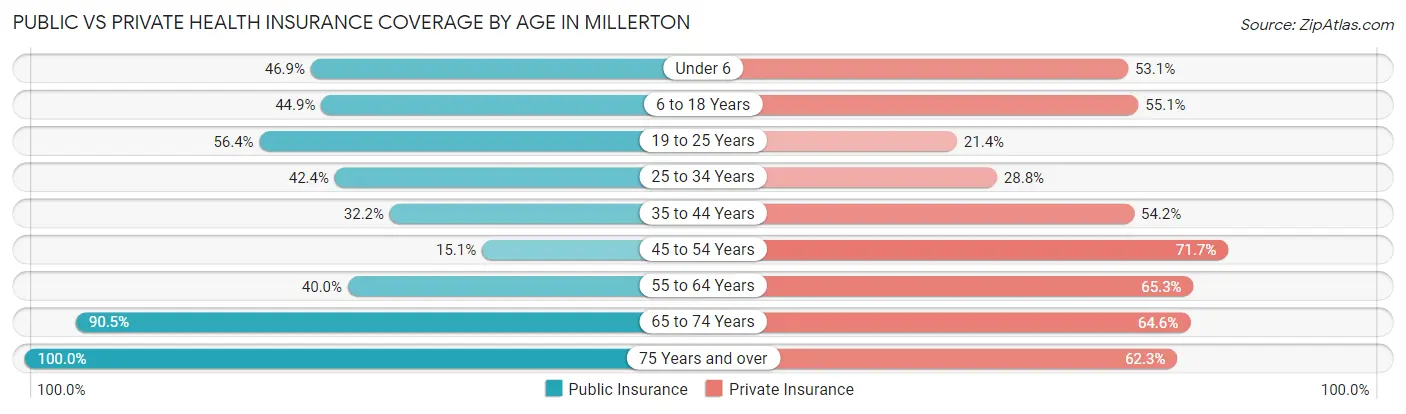
| Age Bracket | Public Insurance | Private Insurance |
| Under 6 | 30 (46.9%) | 34 (53.1%) |
| 6 to 18 Years | 40 (44.9%) | 49 (55.1%) |
| 19 to 25 Years | 66 (56.4%) | 25 (21.4%) |
| 25 to 34 Years | 56 (42.4%) | 38 (28.8%) |
| 35 to 44 Years | 19 (32.2%) | 32 (54.2%) |
| 45 to 54 Years | 16 (15.1%) | 76 (71.7%) |
| 55 to 64 Years | 38 (40.0%) | 62 (65.3%) |
| 65 to 74 Years | 133 (90.5%) | 95 (64.6%) |
| 75 Years and over | 53 (100.0%) | 33 (62.3%) |
| Total | 451 (52.3%) | 444 (51.5%) |
Disability Status by Sex by Age in Millerton
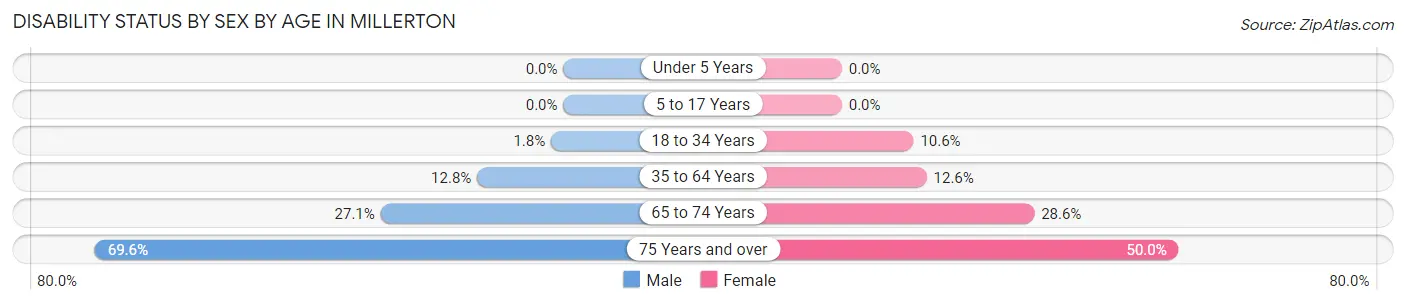
| Age Bracket | Male | Female |
| Under 5 Years | 0 (0.0%) | 0 (0.0%) |
| 5 to 17 Years | 0 (0.0%) | 0 (0.0%) |
| 18 to 34 Years | 3 (1.8%) | 10 (10.6%) |
| 35 to 64 Years | 16 (12.8%) | 17 (12.6%) |
| 65 to 74 Years | 19 (27.1%) | 22 (28.6%) |
| 75 Years and over | 16 (69.6%) | 15 (50.0%) |
Disability Class by Sex by Age in Millerton
Disability Class: Hearing Difficulty
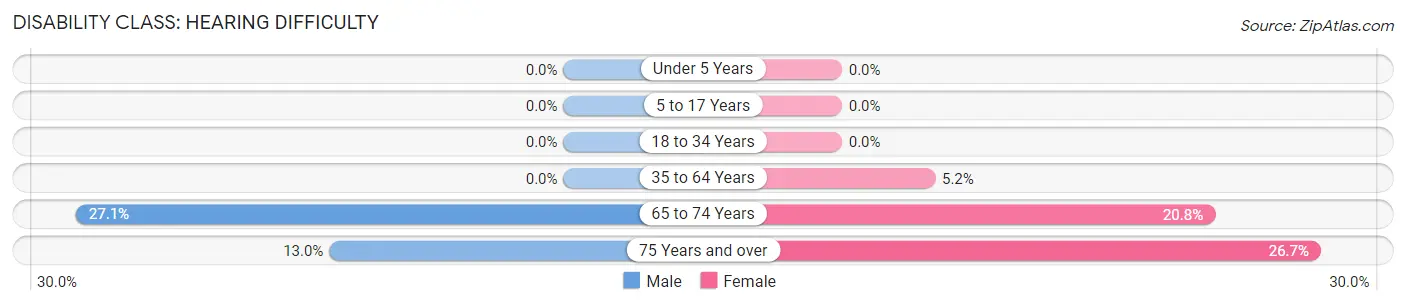
| Age Bracket | Male | Female |
| Under 5 Years | 0 (0.0%) | 0 (0.0%) |
| 5 to 17 Years | 0 (0.0%) | 0 (0.0%) |
| 18 to 34 Years | 0 (0.0%) | 0 (0.0%) |
| 35 to 64 Years | 0 (0.0%) | 7 (5.2%) |
| 65 to 74 Years | 19 (27.1%) | 16 (20.8%) |
| 75 Years and over | 3 (13.0%) | 8 (26.7%) |
Disability Class: Vision Difficulty
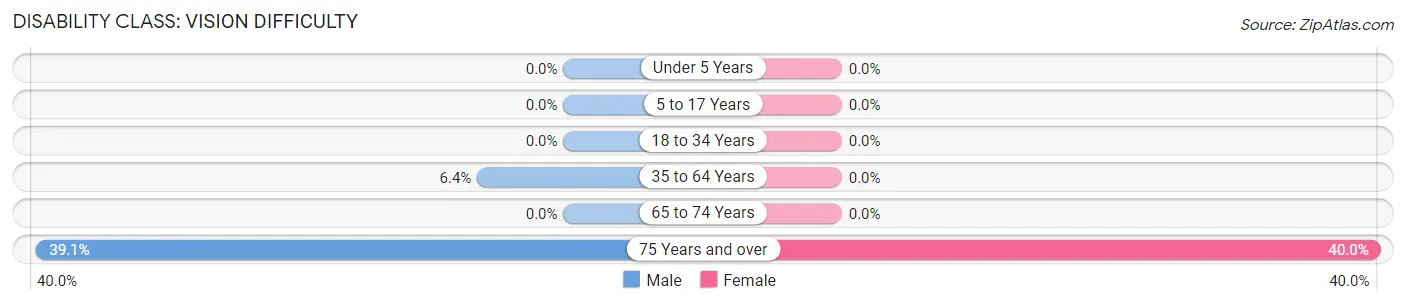
| Age Bracket | Male | Female |
| Under 5 Years | 0 (0.0%) | 0 (0.0%) |
| 5 to 17 Years | 0 (0.0%) | 0 (0.0%) |
| 18 to 34 Years | 0 (0.0%) | 0 (0.0%) |
| 35 to 64 Years | 8 (6.4%) | 0 (0.0%) |
| 65 to 74 Years | 0 (0.0%) | 0 (0.0%) |
| 75 Years and over | 9 (39.1%) | 12 (40.0%) |
Disability Class: Cognitive Difficulty
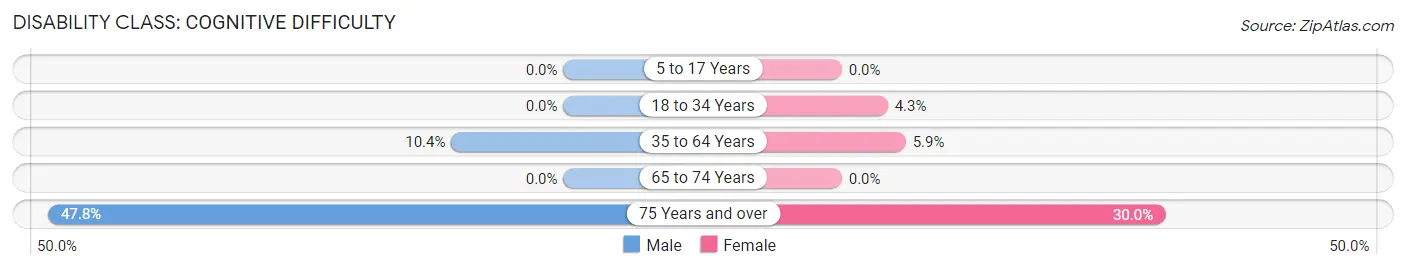
| Age Bracket | Male | Female |
| 5 to 17 Years | 0 (0.0%) | 0 (0.0%) |
| 18 to 34 Years | 0 (0.0%) | 4 (4.3%) |
| 35 to 64 Years | 13 (10.4%) | 8 (5.9%) |
| 65 to 74 Years | 0 (0.0%) | 0 (0.0%) |
| 75 Years and over | 11 (47.8%) | 9 (30.0%) |
Disability Class: Ambulatory Difficulty
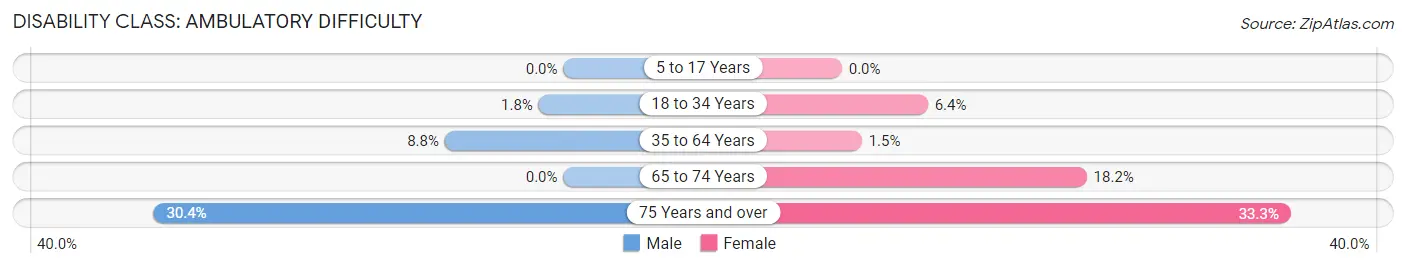
| Age Bracket | Male | Female |
| 5 to 17 Years | 0 (0.0%) | 0 (0.0%) |
| 18 to 34 Years | 3 (1.8%) | 6 (6.4%) |
| 35 to 64 Years | 11 (8.8%) | 2 (1.5%) |
| 65 to 74 Years | 0 (0.0%) | 14 (18.2%) |
| 75 Years and over | 7 (30.4%) | 10 (33.3%) |
Disability Class: Self-Care Difficulty
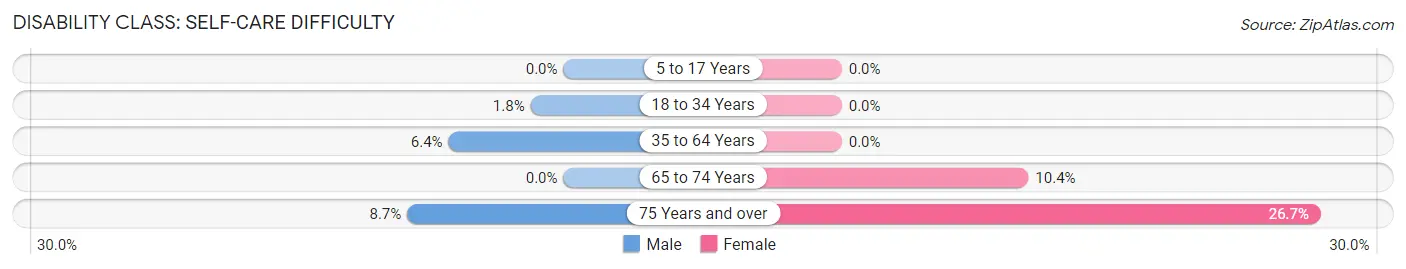
| Age Bracket | Male | Female |
| 5 to 17 Years | 0 (0.0%) | 0 (0.0%) |
| 18 to 34 Years | 3 (1.8%) | 0 (0.0%) |
| 35 to 64 Years | 8 (6.4%) | 0 (0.0%) |
| 65 to 74 Years | 0 (0.0%) | 8 (10.4%) |
| 75 Years and over | 2 (8.7%) | 8 (26.7%) |
Technology Access in Millerton
Computing Device Access in Millerton
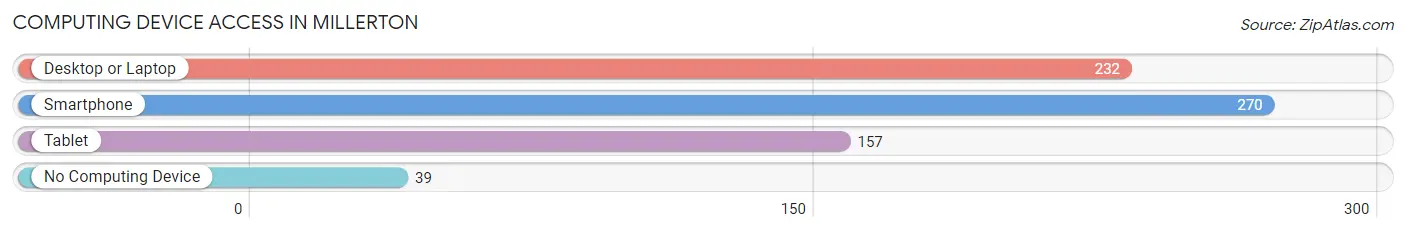
| Device Type | # Households | % Households |
| Desktop or Laptop | 232 | 72.1% |
| Smartphone | 270 | 83.9% |
| Tablet | 157 | 48.8% |
| No Computing Device | 39 | 12.1% |
| Total | 322 | 100.0% |
Internet Access in Millerton
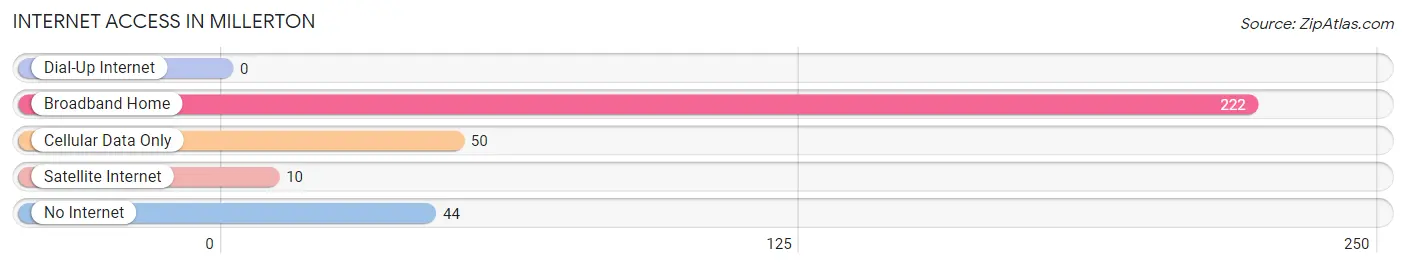
| Internet Type | # Households | % Households |
| Dial-Up Internet | 0 | 0.0% |
| Broadband Home | 222 | 68.9% |
| Cellular Data Only | 50 | 15.5% |
| Satellite Internet | 10 | 3.1% |
| No Internet | 44 | 13.7% |
| Total | 322 | 100.0% |
Millerton Summary
Millerton is a small village located in the town of North East in Dutchess County, New York. It is situated on the east bank of the Hudson River, about halfway between the cities of Poughkeepsie and Albany. The village is part of the Hudson Valley region and is a popular destination for tourists and outdoor enthusiasts.
History
Millerton was first settled in 1760 by a group of Dutch settlers led by Johannes Van Buren. The village was originally known as “Van Buren’s Mills” and was a center for milling grain and lumber. In 1821, the village was renamed Millerton in honor of the local miller, John Miller.
In the mid-1800s, Millerton was a thriving industrial center, with several factories producing textiles, paper, and other goods. The village was also home to a number of hotels and inns, which catered to travelers and tourists.
In the late 19th century, Millerton began to decline as the industrial economy shifted away from the village. By the early 20th century, the village had become a quiet rural community.
Geography
Millerton is located in the Hudson Valley region of New York, about halfway between the cities of Poughkeepsie and Albany. The village is situated on the east bank of the Hudson River, and is surrounded by rolling hills and farmland. The village is located in the town of North East, which is part of Dutchess County.
The village is served by the Millerton-North East train station, which is part of the Metro-North Railroad system. The village is also served by several bus lines, including the Dutchess County Loop Bus.
Economy
Millerton’s economy is largely based on tourism and outdoor recreation. The village is home to several small businesses, including restaurants, shops, and galleries. The village is also home to several wineries and breweries, which attract visitors from all over the region.
The village is also home to several small manufacturing companies, which produce a variety of products, including furniture, textiles, and paper products.
Demographics
As of the 2010 census, the population of Millerton was 1,711. The racial makeup of the village was 94.2% White, 1.2% African American, 0.3% Native American, 0.7% Asian, 0.1% Pacific Islander, 1.3% from other races, and 2.3% from two or more races. Hispanic or Latino of any race were 4.2% of the population.
The median household income in Millerton was $50,938, and the median family income was $60,938. The per capita income for the village was $25,938. About 8.2% of families and 10.2% of the population were below the poverty line, including 14.2% of those under age 18 and 5.2% of those age 65 or over.
Common Questions
What is Per Capita Income in Millerton?
Per Capita income in Millerton is $38,253.
What is the Median Family Income in Millerton?
Median Family Income in Millerton is $88,194.
What is the Median Household income in Millerton?
Median Household Income in Millerton is $78,953.
What is Income or Wage Gap in Millerton?
Income or Wage Gap in Millerton is 2.3%.
Women in Millerton earn 97.7 cents for every dollar earned by a man.
What is Inequality or Gini Index in Millerton?
Inequality or Gini Index in Millerton is 0.34.
What is the Total Population of Millerton?
Total Population of Millerton is 862.
What is the Total Male Population of Millerton?
Total Male Population of Millerton is 425.
What is the Total Female Population of Millerton?
Total Female Population of Millerton is 437.
What is the Ratio of Males per 100 Females in Millerton?
There are 97.25 Males per 100 Females in Millerton.
What is the Ratio of Females per 100 Males in Millerton?
There are 102.82 Females per 100 Males in Millerton.
What is the Median Population Age in Millerton?
Median Population Age in Millerton is 43.2 Years.
What is the Average Family Size in Millerton
Average Family Size in Millerton is 3.3 People.
What is the Average Household Size in Millerton
Average Household Size in Millerton is 2.6 People.
How Large is the Labor Force in Millerton?
There are 505 People in the Labor Forcein in Millerton.
What is the Percentage of People in the Labor Force in Millerton?
69.0% of People are in the Labor Force in Millerton.
What is the Unemployment Rate in Millerton?
Unemployment Rate in Millerton is 2.8%.