East Aurora, NY Map & Demographics
East Aurora Map
East Aurora Overview
$50,396
PER CAPITA INCOME
$122,833
AVG FAMILY INCOME
$95,216
AVG HOUSEHOLD INCOME
42.9%
WAGE / INCOME GAP [ % ]
57.1¢/ $1
WAGE / INCOME GAP [ $ ]
0.38
INEQUALITY / GINI INDEX
5,996
TOTAL POPULATION
3,103
MALE POPULATION
2,893
FEMALE POPULATION
107.26
MALES / 100 FEMALES
93.23
FEMALES / 100 MALES
49.7
MEDIAN AGE
2.9
AVG FAMILY SIZE
2.3
AVG HOUSEHOLD SIZE
3,007
LABOR FORCE [ PEOPLE ]
61.0%
PERCENT IN LABOR FORCE
3.9%
UNEMPLOYMENT RATE
East Aurora Zip Codes
Income in East Aurora
Income Overview in East Aurora
Per Capita Income in East Aurora is $50,396, while median incomes of families and households are $122,833 and $95,216 respectively.
| Characteristic | Number | Measure |
| Per Capita Income | 5,996 | $50,396 |
| Median Family Income | 1,624 | $122,833 |
| Mean Family Income | 1,624 | $140,532 |
| Median Household Income | 2,387 | $95,216 |
| Mean Household Income | 2,387 | $119,647 |
| Income Deficit | 1,624 | $0 |
| Wage / Income Gap (%) | 5,996 | 42.89% |
| Wage / Income Gap ($) | 5,996 | 57.11¢ per $1 |
| Gini / Inequality Index | 5,996 | 0.38 |
Earnings by Sex in East Aurora
Average Earnings in East Aurora are $57,111, $80,321 for men and $45,875 for women, a difference of 42.9%.
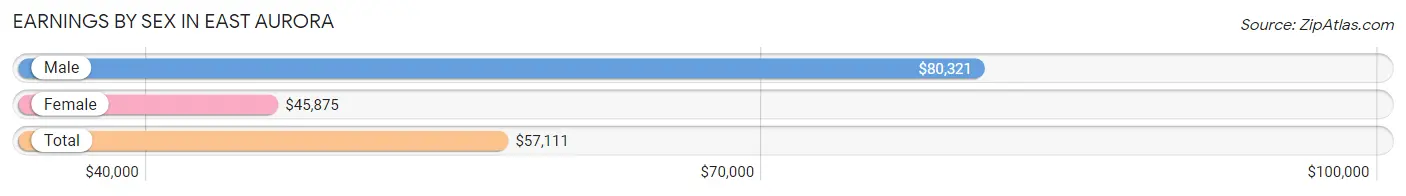
| Sex | Number | Average Earnings |
| Male | 1,705 (54.0%) | $80,321 |
| Female | 1,455 (46.0%) | $45,875 |
| Total | 3,160 (100.0%) | $57,111 |
Earnings by Sex by Income Bracket in East Aurora
The most common earnings brackets in East Aurora are $100,000+ for men (651 | 38.2%) and $100,000+ for women (228 | 15.7%).
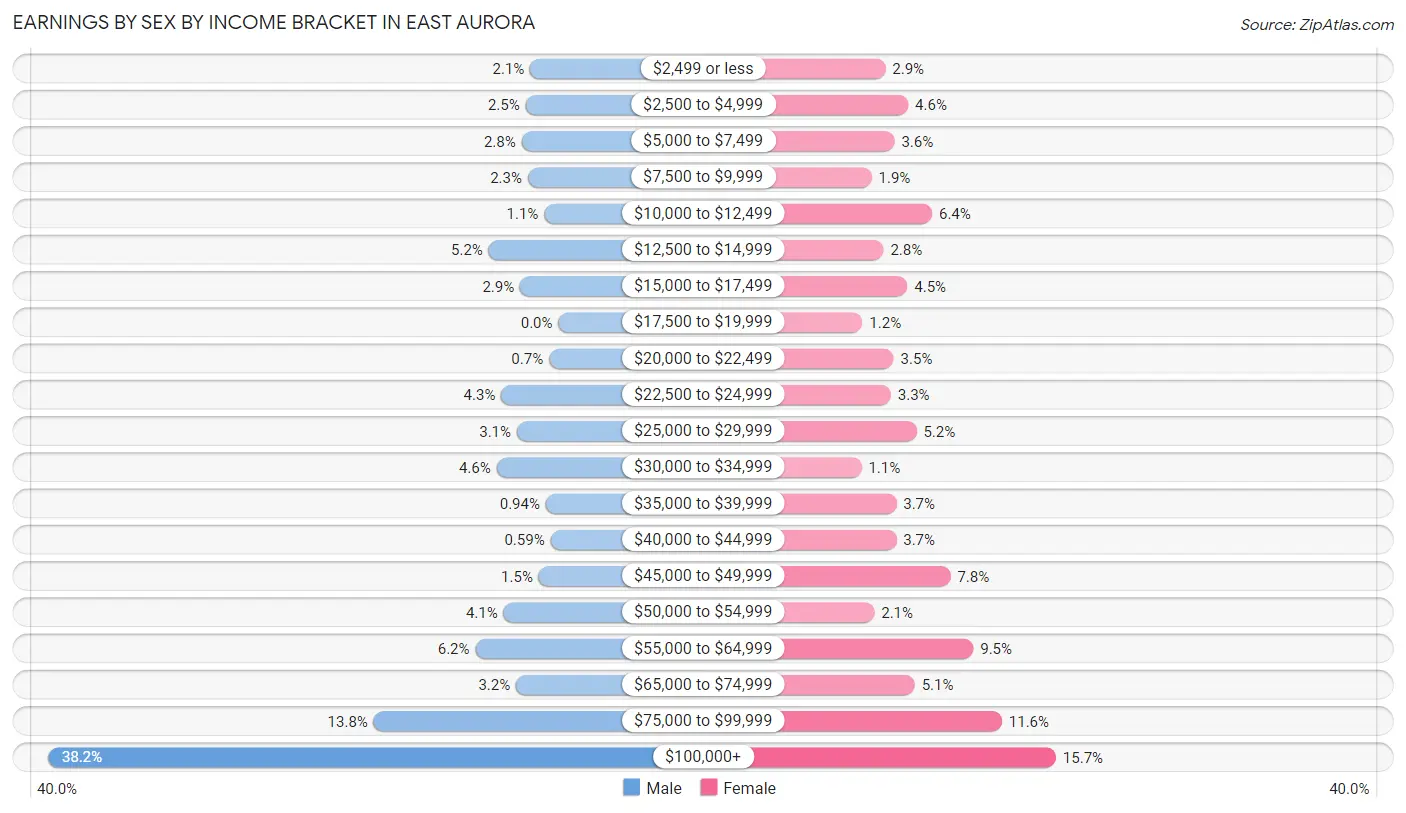
| Income | Male | Female |
| $2,499 or less | 36 (2.1%) | 42 (2.9%) |
| $2,500 to $4,999 | 42 (2.5%) | 67 (4.6%) |
| $5,000 to $7,499 | 47 (2.8%) | 52 (3.6%) |
| $7,500 to $9,999 | 39 (2.3%) | 27 (1.9%) |
| $10,000 to $12,499 | 18 (1.1%) | 93 (6.4%) |
| $12,500 to $14,999 | 89 (5.2%) | 40 (2.8%) |
| $15,000 to $17,499 | 49 (2.9%) | 66 (4.5%) |
| $17,500 to $19,999 | 0 (0.0%) | 17 (1.2%) |
| $20,000 to $22,499 | 12 (0.7%) | 51 (3.5%) |
| $22,500 to $24,999 | 73 (4.3%) | 48 (3.3%) |
| $25,000 to $29,999 | 53 (3.1%) | 76 (5.2%) |
| $30,000 to $34,999 | 79 (4.6%) | 16 (1.1%) |
| $35,000 to $39,999 | 16 (0.9%) | 54 (3.7%) |
| $40,000 to $44,999 | 10 (0.6%) | 54 (3.7%) |
| $45,000 to $49,999 | 25 (1.5%) | 113 (7.8%) |
| $50,000 to $54,999 | 70 (4.1%) | 30 (2.1%) |
| $55,000 to $64,999 | 106 (6.2%) | 138 (9.5%) |
| $65,000 to $74,999 | 54 (3.2%) | 74 (5.1%) |
| $75,000 to $99,999 | 236 (13.8%) | 169 (11.6%) |
| $100,000+ | 651 (38.2%) | 228 (15.7%) |
| Total | 1,705 (100.0%) | 1,455 (100.0%) |
Earnings by Sex by Educational Attainment in East Aurora
Average earnings in East Aurora are $88,403 for men and $48,198 for women, a difference of 45.5%. Men with an educational attainment of bachelor's degree enjoy the highest average annual earnings of $116,080, while those with high school diploma education earn the least with $35,625. Women with an educational attainment of graduate degree earn the most with the average annual earnings of $80,938, while those with college or associate's degree education have the smallest earnings of $24,773.
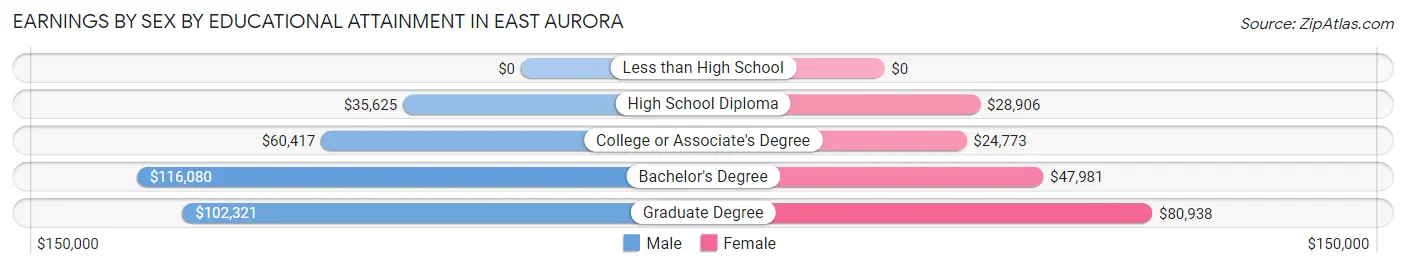
| Educational Attainment | Male Income | Female Income |
| Less than High School | - | - |
| High School Diploma | $35,625 | $28,906 |
| College or Associate's Degree | $60,417 | $24,773 |
| Bachelor's Degree | $116,080 | $47,981 |
| Graduate Degree | $102,321 | $80,938 |
| Total | $88,403 | $48,198 |
Family Income in East Aurora
Family Income Brackets in East Aurora
According to the East Aurora family income data, there are 390 families falling into the $200,000+ income range, which is the most common income bracket and makes up 24.0% of all families.
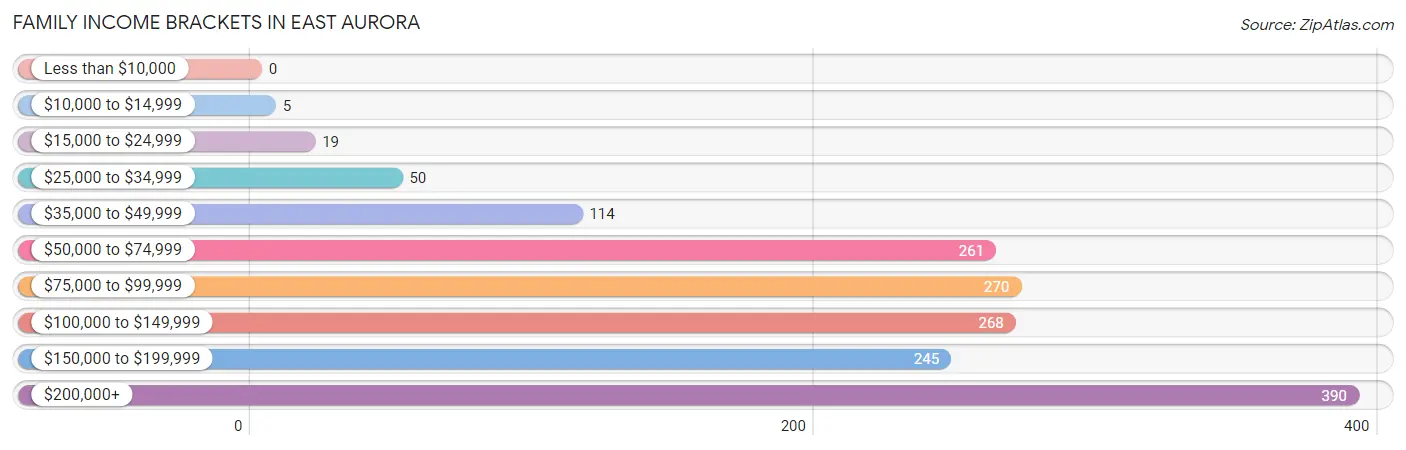
| Income Bracket | # Families | % Families |
| Less than $10,000 | 0 | 0.0% |
| $10,000 to $14,999 | 5 | 0.3% |
| $15,000 to $24,999 | 19 | 1.2% |
| $25,000 to $34,999 | 50 | 3.1% |
| $35,000 to $49,999 | 114 | 7.0% |
| $50,000 to $74,999 | 261 | 16.1% |
| $75,000 to $99,999 | 270 | 16.6% |
| $100,000 to $149,999 | 268 | 16.5% |
| $150,000 to $199,999 | 245 | 15.1% |
| $200,000+ | 390 | 24.0% |
Family Income by Famaliy Size in East Aurora
5-person families (128 | 7.9%) account for the highest median family income in East Aurora with $211,176 per family, while 3-person families (397 | 24.4%) have the highest median income of $47,560 per family member.
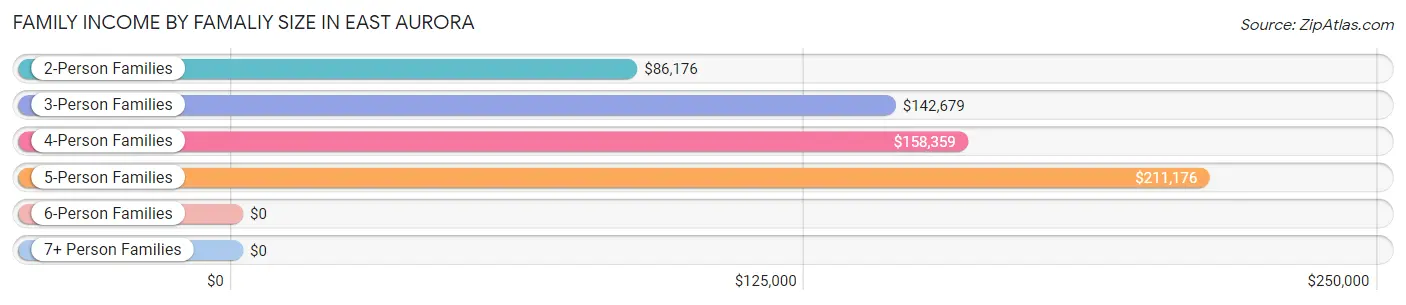
| Income Bracket | # Families | Median Income |
| 2-Person Families | 842 (51.8%) | $86,176 |
| 3-Person Families | 397 (24.4%) | $142,679 |
| 4-Person Families | 233 (14.3%) | $158,359 |
| 5-Person Families | 128 (7.9%) | $211,176 |
| 6-Person Families | 19 (1.2%) | $0 |
| 7+ Person Families | 5 (0.3%) | $0 |
| Total | 1,624 (100.0%) | $122,833 |
Family Income by Number of Earners in East Aurora
The median family income in East Aurora is $122,833, with families comprising 3+ earners (201) having the highest median family income of $196,875, while families with 1 earner (500) have the lowest median family income of $74,500, accounting for 12.4% and 30.8% of families, respectively.
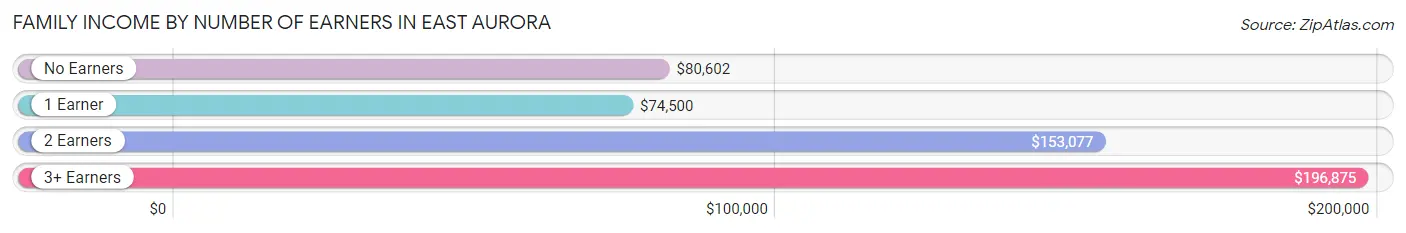
| Number of Earners | # Families | Median Income |
| No Earners | 253 (15.6%) | $80,602 |
| 1 Earner | 500 (30.8%) | $74,500 |
| 2 Earners | 670 (41.3%) | $153,077 |
| 3+ Earners | 201 (12.4%) | $196,875 |
| Total | 1,624 (100.0%) | $122,833 |
Household Income in East Aurora
Household Income Brackets in East Aurora
With 432 households falling in the category, the $50,000 to $74,999 income range is the most frequent in East Aurora, accounting for 18.1% of all households. In contrast, only 17 households (0.7%) fall into the less than $10,000 income bracket, making it the least populous group.
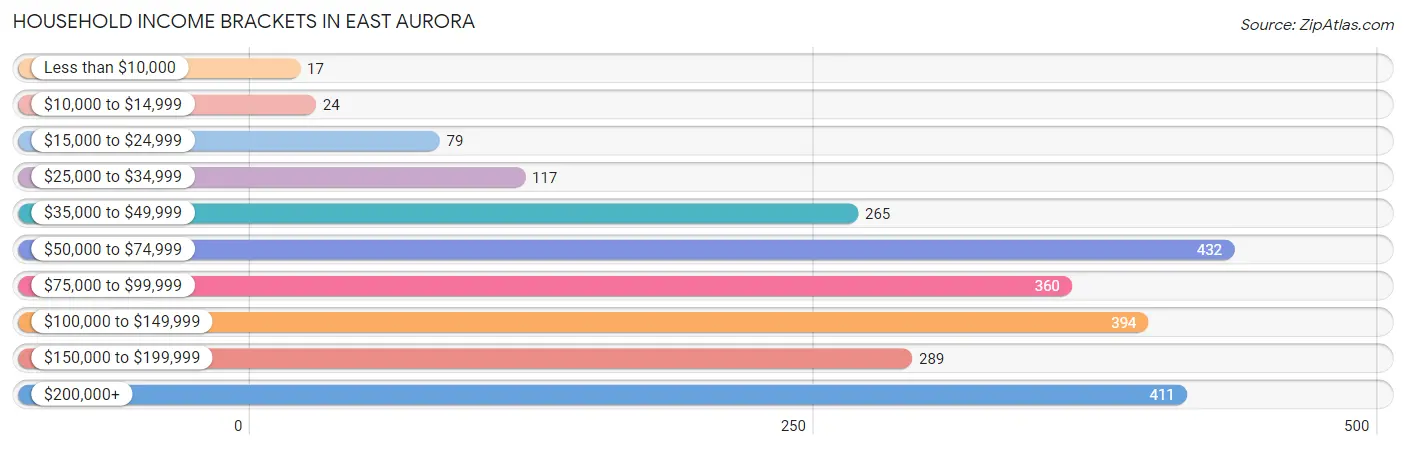
| Income Bracket | # Households | % Households |
| Less than $10,000 | 17 | 0.7% |
| $10,000 to $14,999 | 24 | 1.0% |
| $15,000 to $24,999 | 79 | 3.3% |
| $25,000 to $34,999 | 117 | 4.9% |
| $35,000 to $49,999 | 265 | 11.1% |
| $50,000 to $74,999 | 432 | 18.1% |
| $75,000 to $99,999 | 360 | 15.1% |
| $100,000 to $149,999 | 394 | 16.5% |
| $150,000 to $199,999 | 289 | 12.1% |
| $200,000+ | 411 | 17.2% |
Household Income by Householder Age in East Aurora
The median household income in East Aurora is $95,216, with the highest median household income of $135,242 found in the 45 to 64 years age bracket for the primary householder. A total of 1,028 households (43.1%) fall into this category.
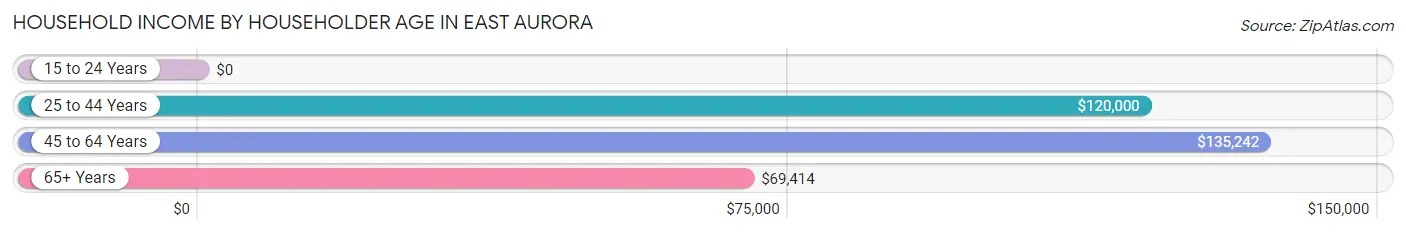
| Income Bracket | # Households | Median Income |
| 15 to 24 Years | 0 (0.0%) | $0 |
| 25 to 44 Years | 636 (26.6%) | $120,000 |
| 45 to 64 Years | 1,028 (43.1%) | $135,242 |
| 65+ Years | 723 (30.3%) | $69,414 |
| Total | 2,387 (100.0%) | $95,216 |
Poverty in East Aurora
Income Below Poverty by Sex and Age in East Aurora
With 1.3% poverty level for males and 2.9% for females among the residents of East Aurora, 5 year old males and 45 to 54 year old females are the most vulnerable to poverty, with 7 males (12.5%) and 34 females (9.5%) in their respective age groups living below the poverty level.
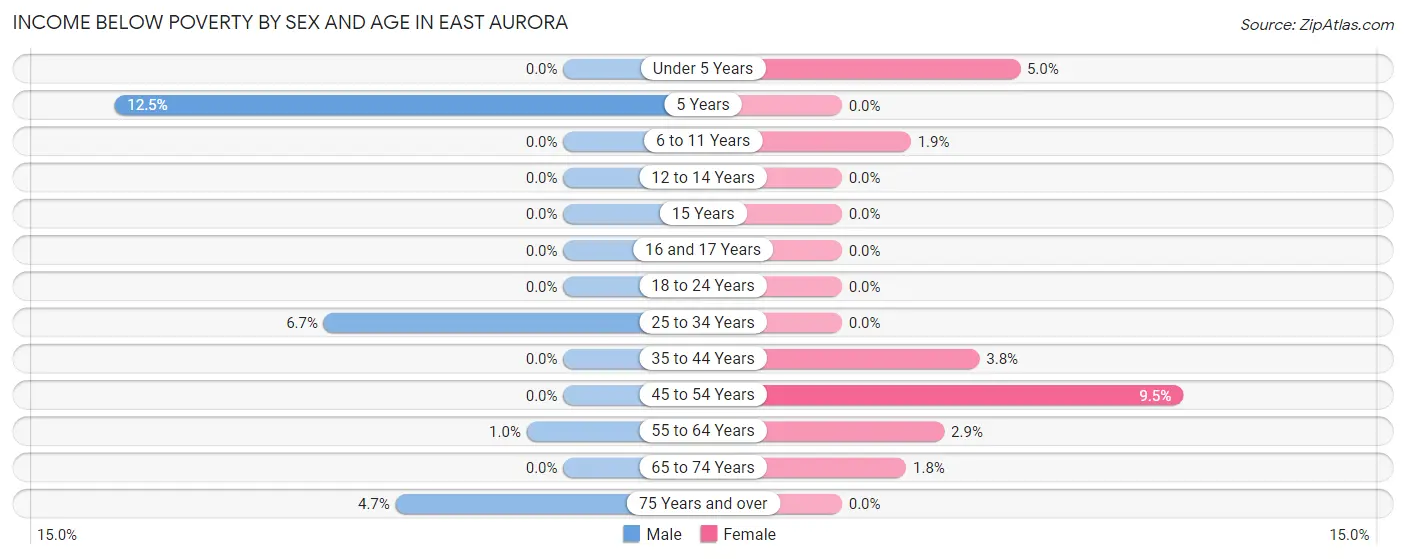
| Age Bracket | Male | Female |
| Under 5 Years | 0 (0.0%) | 7 (5.0%) |
| 5 Years | 7 (12.5%) | 0 (0.0%) |
| 6 to 11 Years | 0 (0.0%) | 3 (1.9%) |
| 12 to 14 Years | 0 (0.0%) | 0 (0.0%) |
| 15 Years | 0 (0.0%) | 0 (0.0%) |
| 16 and 17 Years | 0 (0.0%) | 0 (0.0%) |
| 18 to 24 Years | 0 (0.0%) | 0 (0.0%) |
| 25 to 34 Years | 20 (6.7%) | 0 (0.0%) |
| 35 to 44 Years | 0 (0.0%) | 12 (3.8%) |
| 45 to 54 Years | 0 (0.0%) | 34 (9.5%) |
| 55 to 64 Years | 5 (1.0%) | 15 (2.9%) |
| 65 to 74 Years | 0 (0.0%) | 7 (1.8%) |
| 75 Years and over | 7 (4.7%) | 0 (0.0%) |
| Total | 39 (1.3%) | 78 (2.9%) |
Income Above Poverty by Sex and Age in East Aurora
According to the poverty statistics in East Aurora, males aged under 5 years and females aged 5 years are the age groups that are most secure financially, with 100.0% of males and 100.0% of females in these age groups living above the poverty line.
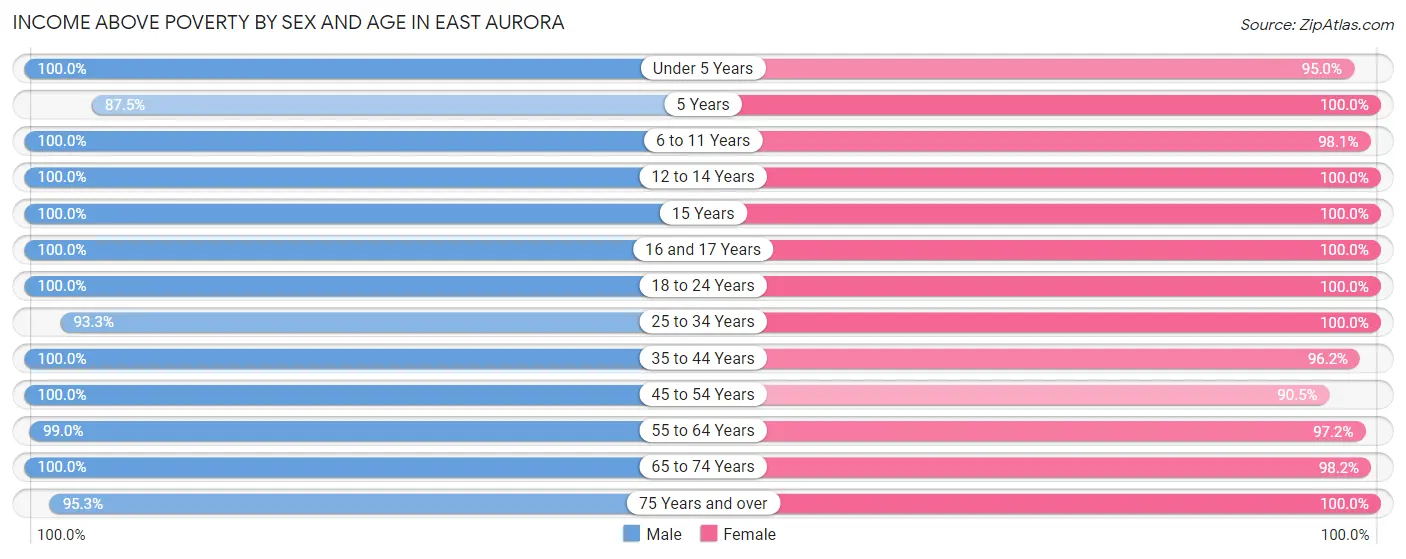
| Age Bracket | Male | Female |
| Under 5 Years | 106 (100.0%) | 134 (95.0%) |
| 5 Years | 49 (87.5%) | 29 (100.0%) |
| 6 to 11 Years | 253 (100.0%) | 153 (98.1%) |
| 12 to 14 Years | 149 (100.0%) | 81 (100.0%) |
| 15 Years | 49 (100.0%) | 37 (100.0%) |
| 16 and 17 Years | 53 (100.0%) | 95 (100.0%) |
| 18 to 24 Years | 140 (100.0%) | 81 (100.0%) |
| 25 to 34 Years | 280 (93.3%) | 289 (100.0%) |
| 35 to 44 Years | 322 (100.0%) | 301 (96.2%) |
| 45 to 54 Years | 373 (100.0%) | 324 (90.5%) |
| 55 to 64 Years | 487 (99.0%) | 512 (97.2%) |
| 65 to 74 Years | 452 (100.0%) | 384 (98.2%) |
| 75 Years and over | 143 (95.3%) | 177 (100.0%) |
| Total | 2,856 (98.7%) | 2,597 (97.1%) |
Income Below Poverty Among Married-Couple Families in East Aurora
The poverty statistics for married-couple families in East Aurora show that 0.4% or 5 of the total 1,348 families live below the poverty line. Families with no children have the highest poverty rate of 0.6%, comprising of 5 families. On the other hand, families with 1 or 2 children have the lowest poverty rate of 0.0%, which includes 0 families.
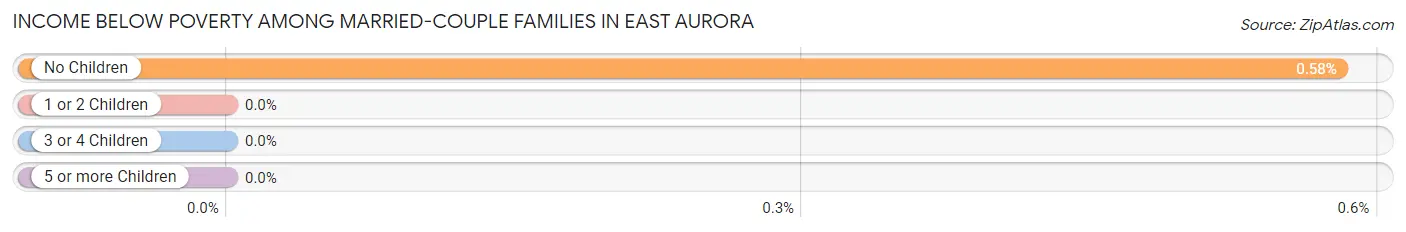
| Children | Above Poverty | Below Poverty |
| No Children | 861 (99.4%) | 5 (0.6%) |
| 1 or 2 Children | 335 (100.0%) | 0 (0.0%) |
| 3 or 4 Children | 142 (100.0%) | 0 (0.0%) |
| 5 or more Children | 5 (100.0%) | 0 (0.0%) |
| Total | 1,343 (99.6%) | 5 (0.4%) |
Income Below Poverty Among Single-Parent Households in East Aurora
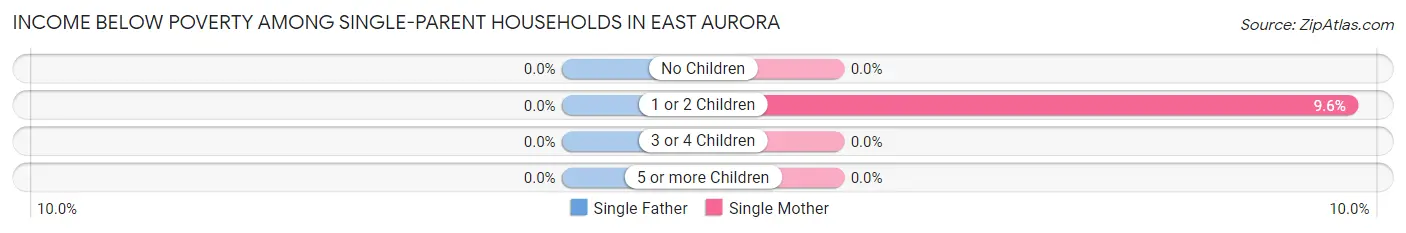
| Children | Single Father | Single Mother |
| No Children | 0 (0.0%) | 0 (0.0%) |
| 1 or 2 Children | 0 (0.0%) | 11 (9.6%) |
| 3 or 4 Children | 0 (0.0%) | 0 (0.0%) |
| 5 or more Children | 0 (0.0%) | 0 (0.0%) |
| Total | 0 (0.0%) | 11 (6.8%) |
Income Below Poverty Among Married-Couple vs Single-Parent Households in East Aurora
The poverty data for East Aurora shows that 5 of the married-couple family households (0.4%) and 11 of the single-parent households (4.0%) are living below the poverty level. Within the married-couple family households, those with no children have the highest poverty rate, with 5 households (0.6%) falling below the poverty line. Among the single-parent households, those with 1 or 2 children have the highest poverty rate, with 11 household (5.4%) living below poverty.
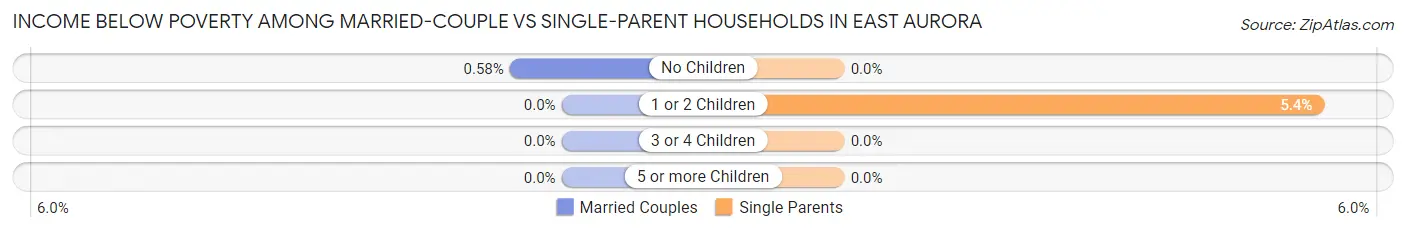
| Children | Married-Couple Families | Single-Parent Households |
| No Children | 5 (0.6%) | 0 (0.0%) |
| 1 or 2 Children | 0 (0.0%) | 11 (5.4%) |
| 3 or 4 Children | 0 (0.0%) | 0 (0.0%) |
| 5 or more Children | 0 (0.0%) | 0 (0.0%) |
| Total | 5 (0.4%) | 11 (4.0%) |
Race in East Aurora
The most populous races in East Aurora are White / Caucasian (5,769 | 96.2%), Two or more Races (137 | 2.3%), and Hispanic or Latino (111 | 1.8%).
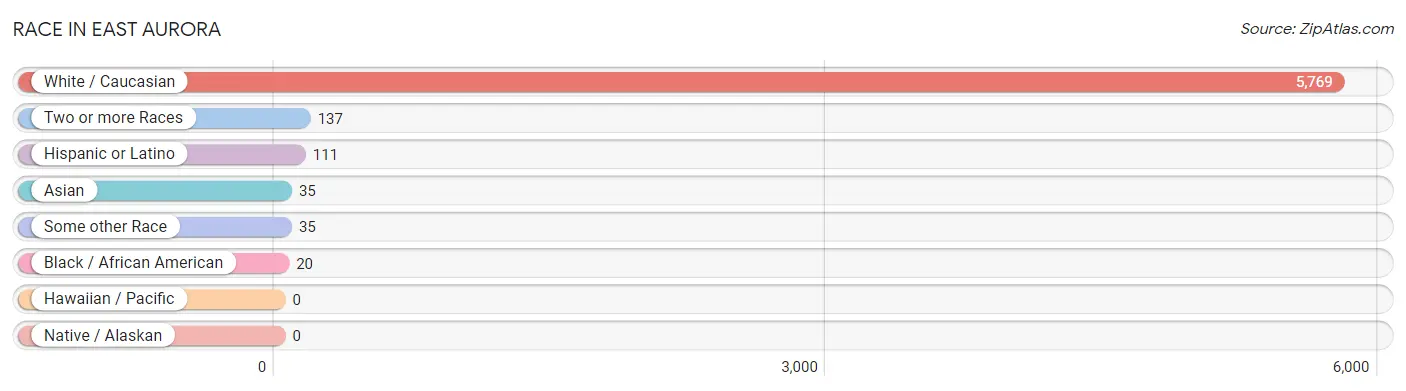
| Race | # Population | % Population |
| Asian | 35 | 0.6% |
| Black / African American | 20 | 0.3% |
| Hawaiian / Pacific | 0 | 0.0% |
| Hispanic or Latino | 111 | 1.8% |
| Native / Alaskan | 0 | 0.0% |
| White / Caucasian | 5,769 | 96.2% |
| Two or more Races | 137 | 2.3% |
| Some other Race | 35 | 0.6% |
| Total | 5,996 | 100.0% |
Ancestry in East Aurora
The most populous ancestries reported in East Aurora are German (1,818 | 30.3%), Irish (1,324 | 22.1%), English (914 | 15.2%), Polish (780 | 13.0%), and Italian (603 | 10.1%), together accounting for 90.7% of all East Aurora residents.
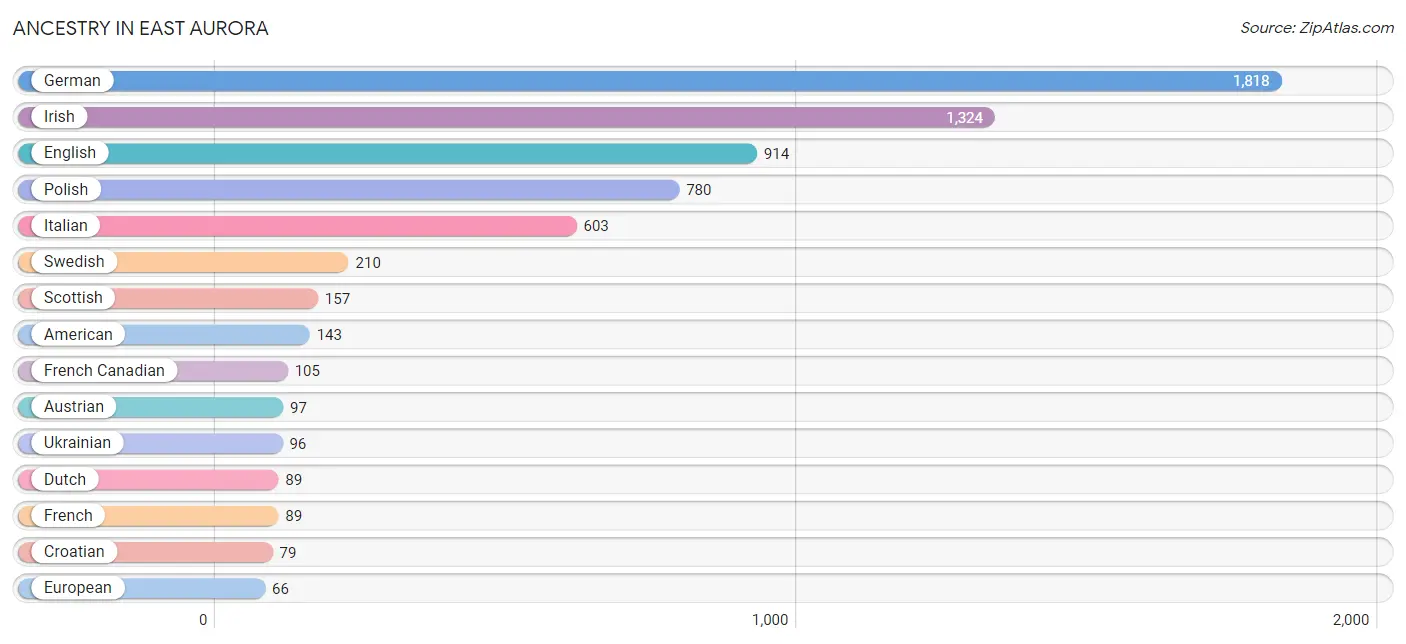
| Ancestry | # Population | % Population |
| American | 143 | 2.4% |
| Arab | 19 | 0.3% |
| Austrian | 97 | 1.6% |
| Blackfeet | 7 | 0.1% |
| Brazilian | 21 | 0.4% |
| British | 21 | 0.4% |
| Bulgarian | 6 | 0.1% |
| Burmese | 32 | 0.5% |
| Canadian | 25 | 0.4% |
| Central American | 17 | 0.3% |
| Croatian | 79 | 1.3% |
| Cuban | 13 | 0.2% |
| Czech | 15 | 0.3% |
| Danish | 63 | 1.1% |
| Dominican | 22 | 0.4% |
| Dutch | 89 | 1.5% |
| Eastern European | 18 | 0.3% |
| English | 914 | 15.2% |
| European | 66 | 1.1% |
| Finnish | 17 | 0.3% |
| French | 89 | 1.5% |
| French Canadian | 105 | 1.8% |
| German | 1,818 | 30.3% |
| Greek | 45 | 0.7% |
| Guatemalan | 17 | 0.3% |
| Hungarian | 45 | 0.7% |
| Indian (Asian) | 16 | 0.3% |
| Irish | 1,324 | 22.1% |
| Italian | 603 | 10.1% |
| Korean | 7 | 0.1% |
| Latvian | 4 | 0.1% |
| Lebanese | 13 | 0.2% |
| Lithuanian | 48 | 0.8% |
| Mexican | 19 | 0.3% |
| Northern European | 11 | 0.2% |
| Norwegian | 41 | 0.7% |
| Pakistani | 11 | 0.2% |
| Polish | 780 | 13.0% |
| Portuguese | 14 | 0.2% |
| Puerto Rican | 11 | 0.2% |
| Russian | 38 | 0.6% |
| Scotch-Irish | 14 | 0.2% |
| Scottish | 157 | 2.6% |
| Slovak | 21 | 0.4% |
| Slovene | 4 | 0.1% |
| Spaniard | 23 | 0.4% |
| Swedish | 210 | 3.5% |
| Swiss | 6 | 0.1% |
| Thai | 5 | 0.1% |
| Tlingit-Haida | 2 | 0.0% |
| Turkish | 10 | 0.2% |
| Ukrainian | 96 | 1.6% |
| Welsh | 61 | 1.0% | View All 53 Rows |
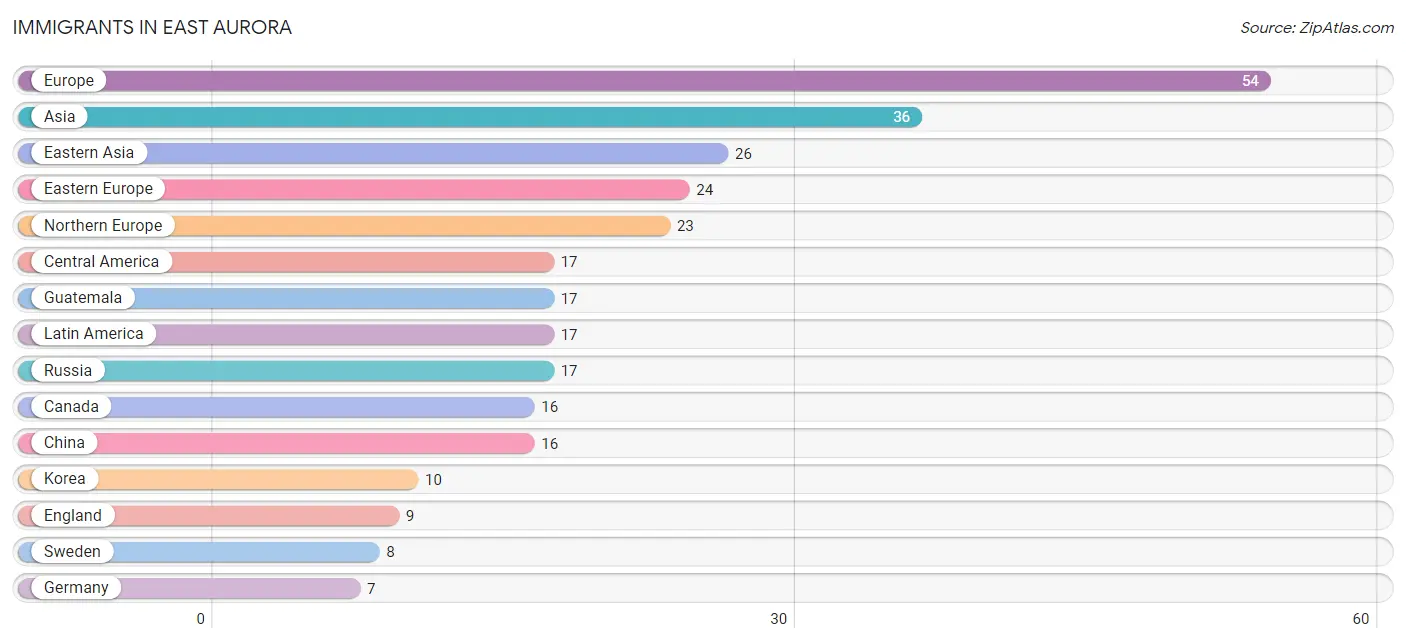
Immigrants in East Aurora
The most numerous immigrant groups reported in East Aurora came from Europe (54 | 0.9%), Asia (36 | 0.6%), Eastern Asia (26 | 0.4%), Eastern Europe (24 | 0.4%), and Northern Europe (23 | 0.4%), together accounting for 2.7% of all East Aurora residents.
| Immigration Origin | # Population | % Population |
| Africa | 6 | 0.1% |
| Asia | 36 | 0.6% |
| Canada | 16 | 0.3% |
| Central America | 17 | 0.3% |
| China | 16 | 0.3% |
| Eastern Asia | 26 | 0.4% |
| Eastern Europe | 24 | 0.4% |
| England | 9 | 0.2% |
| Europe | 54 | 0.9% |
| Germany | 7 | 0.1% |
| Guatemala | 17 | 0.3% |
| Hungary | 7 | 0.1% |
| Korea | 10 | 0.2% |
| Kuwait | 6 | 0.1% |
| Latin America | 17 | 0.3% |
| Northern Africa | 6 | 0.1% |
| Northern Europe | 23 | 0.4% |
| Philippines | 4 | 0.1% |
| Russia | 17 | 0.3% |
| South Eastern Asia | 4 | 0.1% |
| Sweden | 8 | 0.1% |
| Western Asia | 6 | 0.1% |
| Western Europe | 7 | 0.1% | View All 23 Rows |
Sex and Age in East Aurora
Sex and Age in East Aurora
The most populous age groups in East Aurora are 55 to 59 Years (309 | 10.0%) for men and 55 to 59 Years (312 | 10.8%) for women.
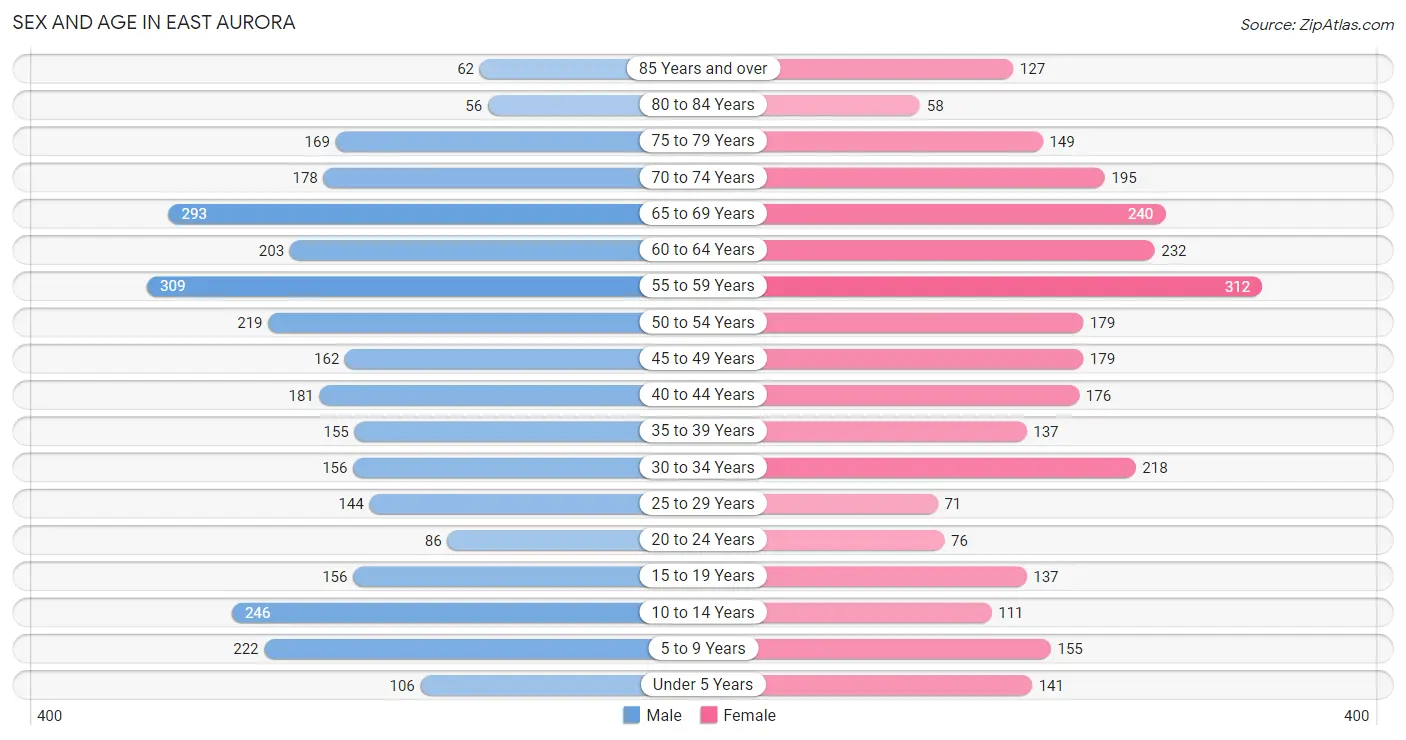
| Age Bracket | Male | Female |
| Under 5 Years | 106 (3.4%) | 141 (4.9%) |
| 5 to 9 Years | 222 (7.1%) | 155 (5.4%) |
| 10 to 14 Years | 246 (7.9%) | 111 (3.8%) |
| 15 to 19 Years | 156 (5.0%) | 137 (4.7%) |
| 20 to 24 Years | 86 (2.8%) | 76 (2.6%) |
| 25 to 29 Years | 144 (4.6%) | 71 (2.5%) |
| 30 to 34 Years | 156 (5.0%) | 218 (7.5%) |
| 35 to 39 Years | 155 (5.0%) | 137 (4.7%) |
| 40 to 44 Years | 181 (5.8%) | 176 (6.1%) |
| 45 to 49 Years | 162 (5.2%) | 179 (6.2%) |
| 50 to 54 Years | 219 (7.1%) | 179 (6.2%) |
| 55 to 59 Years | 309 (10.0%) | 312 (10.8%) |
| 60 to 64 Years | 203 (6.5%) | 232 (8.0%) |
| 65 to 69 Years | 293 (9.4%) | 240 (8.3%) |
| 70 to 74 Years | 178 (5.7%) | 195 (6.7%) |
| 75 to 79 Years | 169 (5.4%) | 149 (5.1%) |
| 80 to 84 Years | 56 (1.8%) | 58 (2.0%) |
| 85 Years and over | 62 (2.0%) | 127 (4.4%) |
| Total | 3,103 (100.0%) | 2,893 (100.0%) |
Families and Households in East Aurora
Median Family Size in East Aurora
The median family size in East Aurora is 2.86 persons per family, with married-couple families (1,348 | 83.0%) accounting for the largest median family size of 2.94 persons per family. On the other hand, single female/mother families (163 | 10.0%) represent the smallest median family size with 2.34 persons per family.
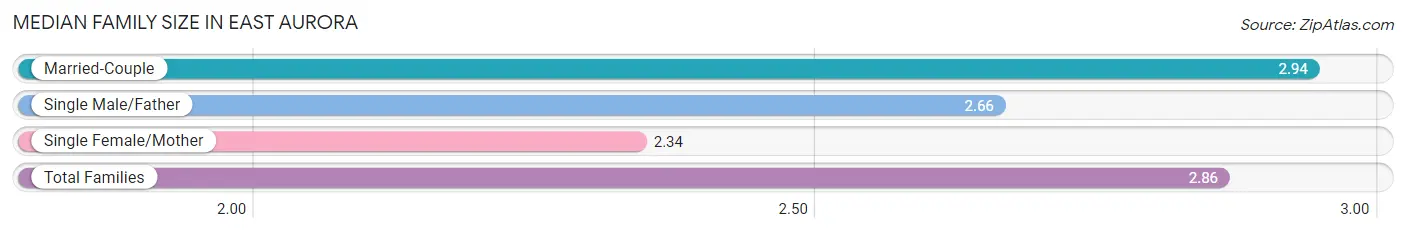
| Family Type | # Families | Family Size |
| Married-Couple | 1,348 (83.0%) | 2.94 |
| Single Male/Father | 113 (7.0%) | 2.66 |
| Single Female/Mother | 163 (10.0%) | 2.34 |
| Total Families | 1,624 (100.0%) | 2.86 |
Median Household Size in East Aurora
The median household size in East Aurora is 2.32 persons per household, with married-couple households (1,348 | 56.5%) accounting for the largest median household size of 2.94 persons per household. non-family households (763 | 32.0%) represent the smallest median household size with 1.11 persons per household.
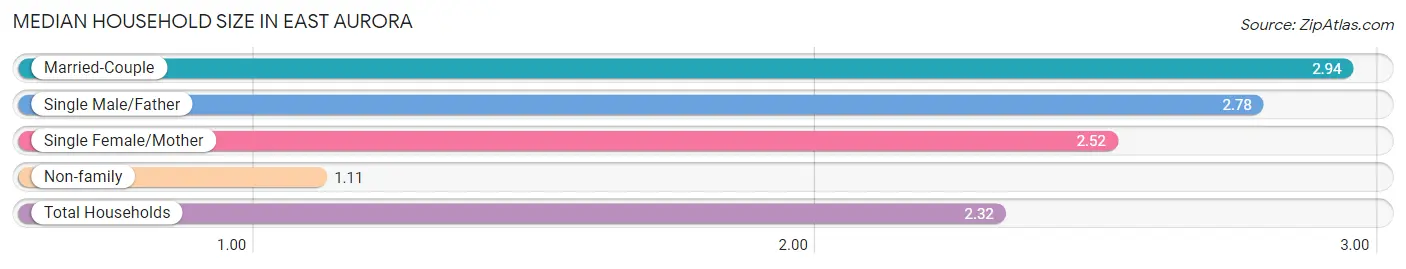
| Household Type | # Households | Household Size |
| Married-Couple | 1,348 (56.5%) | 2.94 |
| Single Male/Father | 113 (4.7%) | 2.78 |
| Single Female/Mother | 163 (6.8%) | 2.52 |
| Non-family | 763 (32.0%) | 1.11 |
| Total Households | 2,387 (100.0%) | 2.32 |
Household Size by Marriage Status in East Aurora
Out of a total of 2,387 households in East Aurora, 1,624 (68.0%) are family households, while 763 (32.0%) are nonfamily households. The most numerous type of family households are 2-person households, comprising 826, and the most common type of nonfamily households are 1-person households, comprising 684.
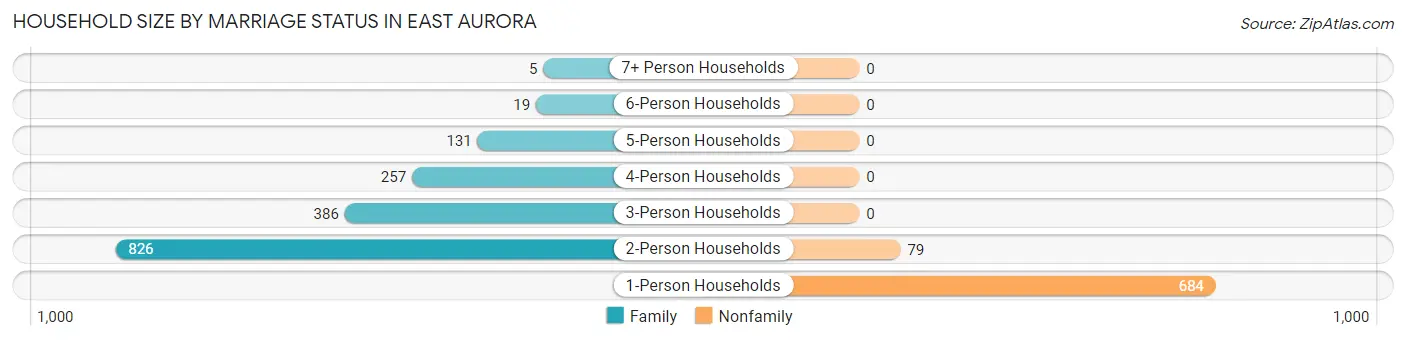
| Household Size | Family Households | Nonfamily Households |
| 1-Person Households | - | 684 (28.7%) |
| 2-Person Households | 826 (34.6%) | 79 (3.3%) |
| 3-Person Households | 386 (16.2%) | 0 (0.0%) |
| 4-Person Households | 257 (10.8%) | 0 (0.0%) |
| 5-Person Households | 131 (5.5%) | 0 (0.0%) |
| 6-Person Households | 19 (0.8%) | 0 (0.0%) |
| 7+ Person Households | 5 (0.2%) | 0 (0.0%) |
| Total | 1,624 (68.0%) | 763 (32.0%) |
Female Fertility in East Aurora
Fertility by Age in East Aurora
Average fertility rate in East Aurora is 93.0 births per 1,000 women. Women in the age bracket of 20 to 34 years have the highest fertility rate with 118.0 births per 1,000 women. Women in the age bracket of 35 to 50 years acount for 54.3% of all women with births.
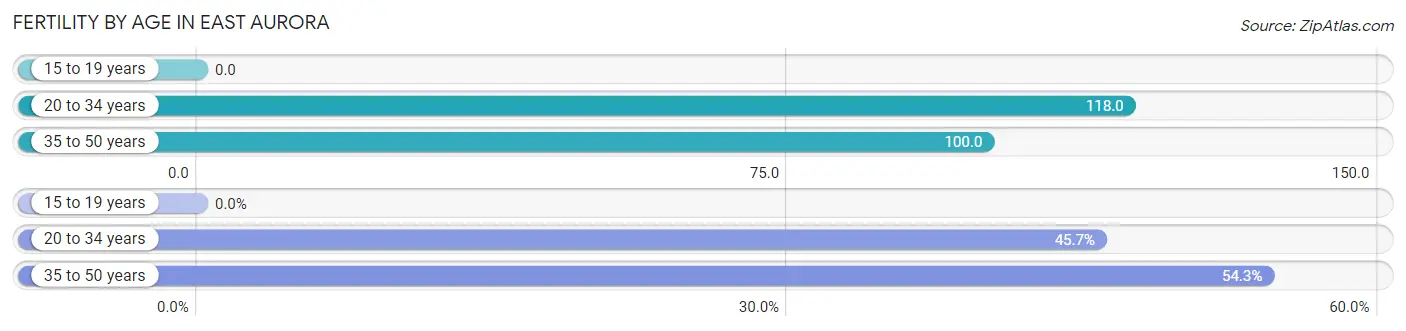
| Age Bracket | Women with Births | Births / 1,000 Women |
| 15 to 19 years | 0 (0.0%) | 0.0 |
| 20 to 34 years | 43 (45.7%) | 118.0 |
| 35 to 50 years | 51 (54.3%) | 100.0 |
| Total | 94 (100.0%) | 93.0 |
Fertility by Age by Marriage Status in East Aurora
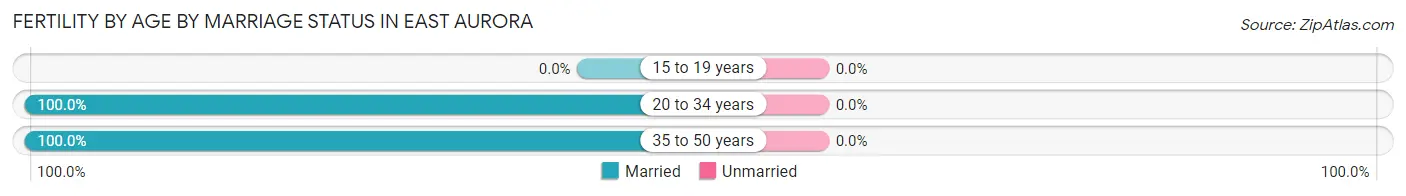
| Age Bracket | Married | Unmarried |
| 15 to 19 years | 0 (0.0%) | 0 (0.0%) |
| 20 to 34 years | 43 (100.0%) | 0 (0.0%) |
| 35 to 50 years | 51 (100.0%) | 0 (0.0%) |
| Total | 94 (100.0%) | 0 (0.0%) |
Fertility by Education in East Aurora
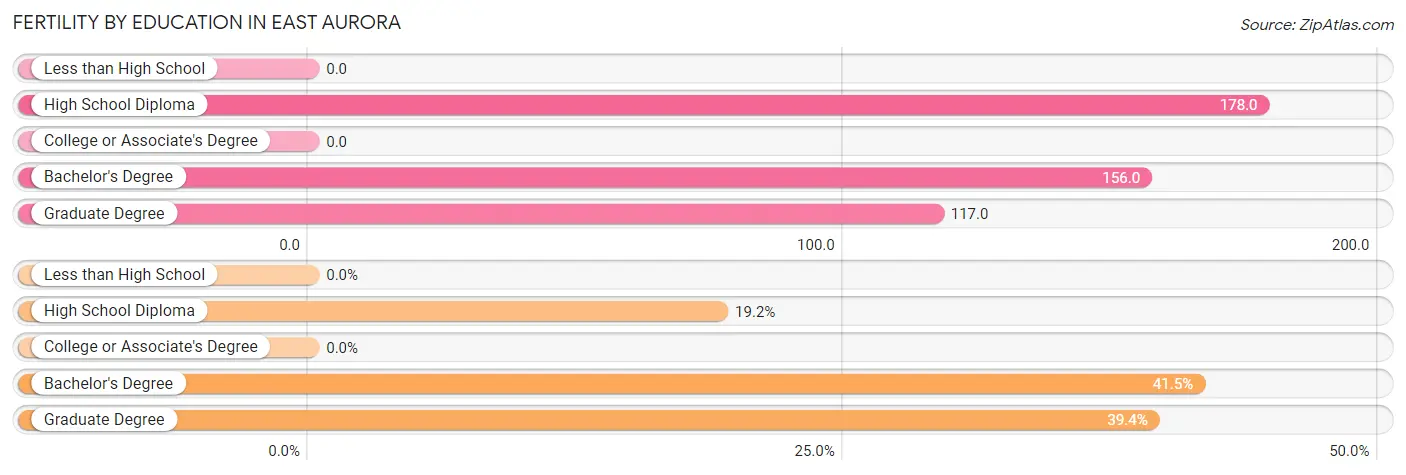
| Educational Attainment | Women with Births | Births / 1,000 Women |
| Less than High School | 0 (0.0%) | 0.0 |
| High School Diploma | 18 (19.2%) | 178.0 |
| College or Associate's Degree | 0 (0.0%) | 0.0 |
| Bachelor's Degree | 39 (41.5%) | 156.0 |
| Graduate Degree | 37 (39.4%) | 117.0 |
| Total | 94 (100.0%) | 93.0 |
Fertility by Education by Marriage Status in East Aurora
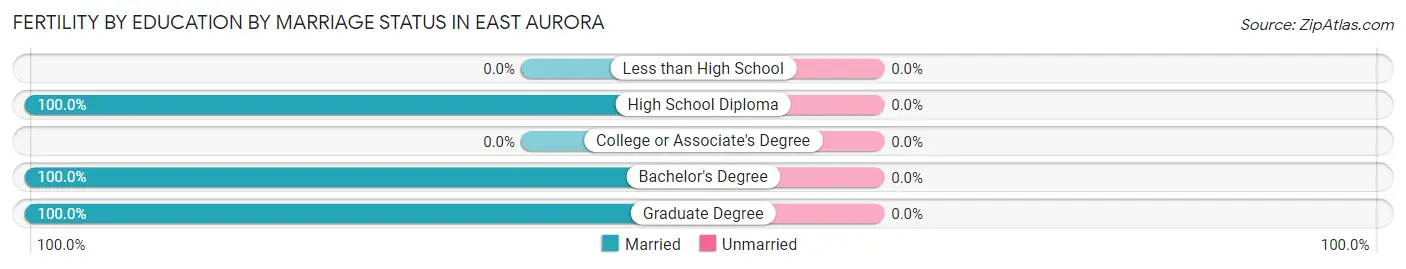
| Educational Attainment | Married | Unmarried |
| Less than High School | 0 (0.0%) | 0 (0.0%) |
| High School Diploma | 18 (100.0%) | 0 (0.0%) |
| College or Associate's Degree | 0 (0.0%) | 0 (0.0%) |
| Bachelor's Degree | 39 (100.0%) | 0 (0.0%) |
| Graduate Degree | 37 (100.0%) | 0 (0.0%) |
| Total | 94 (100.0%) | 0 (0.0%) |
Employment Characteristics in East Aurora
Employment by Class of Employer in East Aurora
Among the 2,815 employed individuals in East Aurora, private company employees (1,415 | 50.3%), local government employees (423 | 15.0%), and not-for-profit organizations (422 | 15.0%) make up the most common classes of employment.
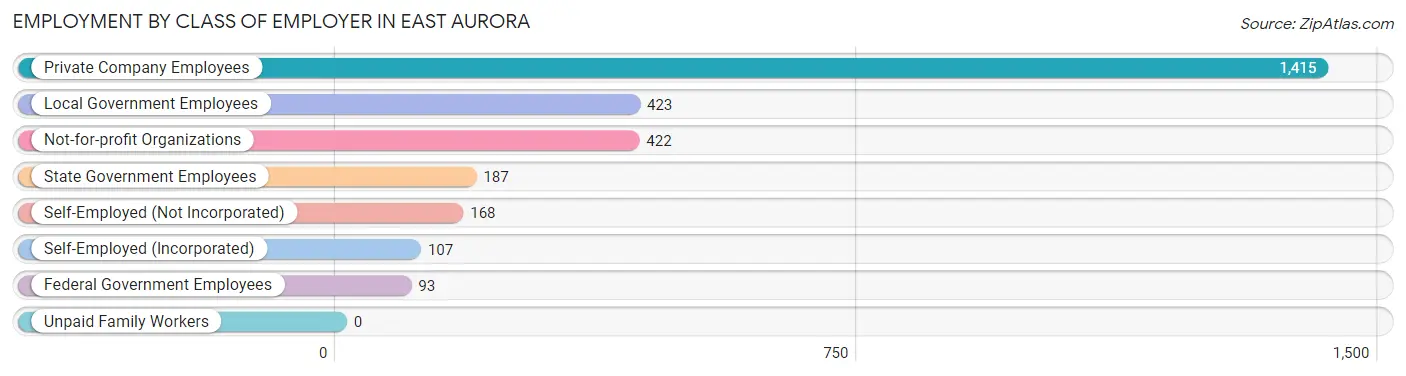
| Employer Class | # Employees | % Employees |
| Private Company Employees | 1,415 | 50.3% |
| Self-Employed (Incorporated) | 107 | 3.8% |
| Self-Employed (Not Incorporated) | 168 | 6.0% |
| Not-for-profit Organizations | 422 | 15.0% |
| Local Government Employees | 423 | 15.0% |
| State Government Employees | 187 | 6.6% |
| Federal Government Employees | 93 | 3.3% |
| Unpaid Family Workers | 0 | 0.0% |
| Total | 2,815 | 100.0% |
Employment Status by Age in East Aurora
According to the labor force statistics for East Aurora, out of the total population over 16 years of age (4,929), 61.0% or 3,007 individuals are in the labor force, with 3.9% or 117 of them unemployed. The age group with the highest labor force participation rate is 30 to 34 years, with 100.0% or 374 individuals in the labor force. Within the labor force, the 16 to 19 years age range has the highest percentage of unemployed individuals, with 29.5% or 18 of them being unemployed.
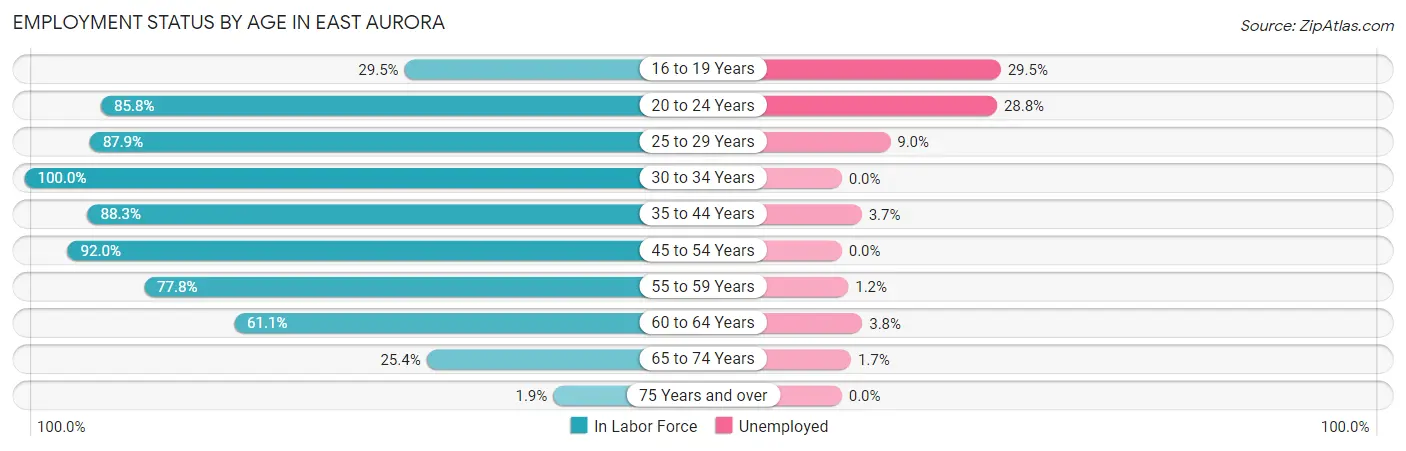
| Age Bracket | In Labor Force | Unemployed |
| 16 to 19 Years | 61 (29.5%) | 18 (29.5%) |
| 20 to 24 Years | 139 (85.8%) | 40 (28.8%) |
| 25 to 29 Years | 189 (87.9%) | 17 (9.0%) |
| 30 to 34 Years | 374 (100.0%) | 0 (0.0%) |
| 35 to 44 Years | 573 (88.3%) | 21 (3.7%) |
| 45 to 54 Years | 680 (92.0%) | 0 (0.0%) |
| 55 to 59 Years | 483 (77.8%) | 6 (1.2%) |
| 60 to 64 Years | 266 (61.1%) | 10 (3.8%) |
| 65 to 74 Years | 230 (25.4%) | 4 (1.7%) |
| 75 Years and over | 12 (1.9%) | 0 (0.0%) |
| Total | 3,007 (61.0%) | 117 (3.9%) |
Employment Status by Educational Attainment in East Aurora
According to labor force statistics for East Aurora, 84.6% of individuals (2,566) out of the total population between 25 and 64 years of age (3,033) are in the labor force, with 2.1% or 54 of them being unemployed. The group with the highest labor force participation rate are those with the educational attainment of bachelor's degree or higher, with 90.3% or 1,760 individuals in the labor force. Within the labor force, individuals with high school diploma education have the highest percentage of unemployment, with 4.0% or 14 of them being unemployed.
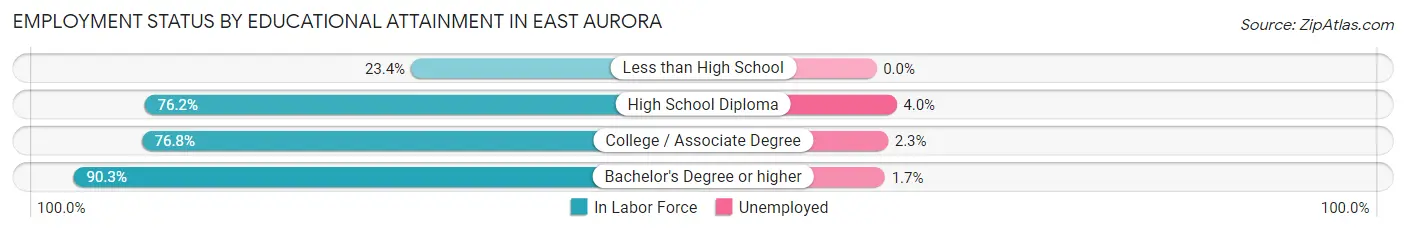
| Educational Attainment | In Labor Force | Unemployed |
| Less than High School | 11 (23.4%) | 0 (0.0%) |
| High School Diploma | 353 (76.2%) | 19 (4.0%) |
| College / Associate Degree | 441 (76.8%) | 13 (2.3%) |
| Bachelor's Degree or higher | 1,760 (90.3%) | 33 (1.7%) |
| Total | 2,566 (84.6%) | 64 (2.1%) |
Employment Occupations by Sex in East Aurora
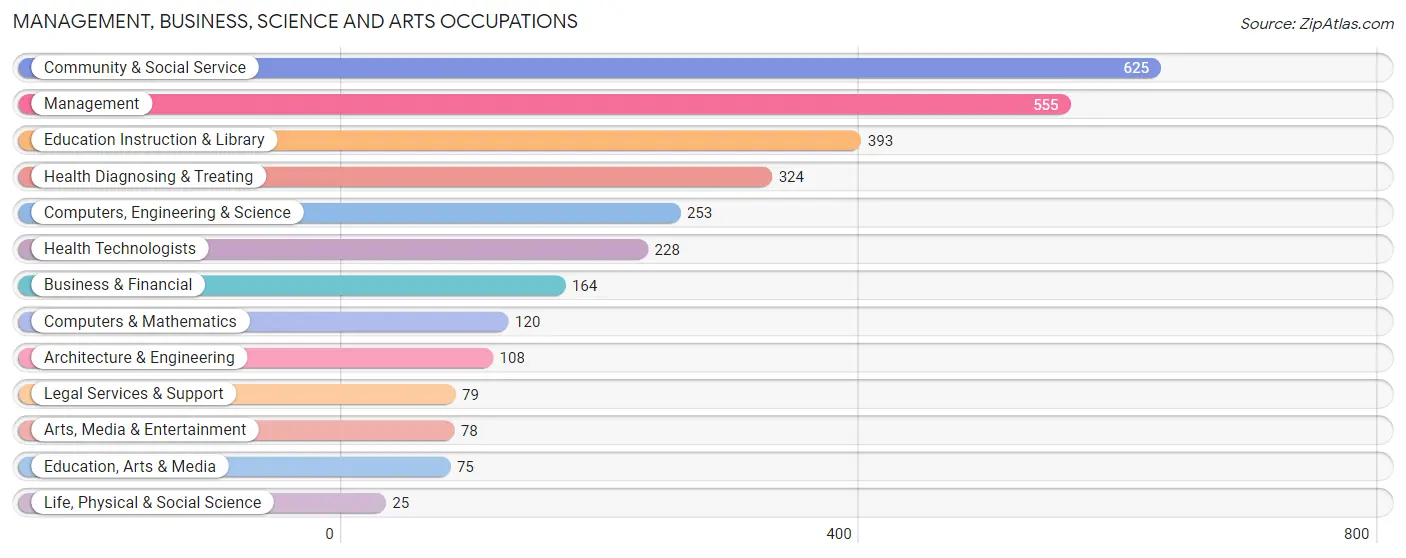
Management, Business, Science and Arts Occupations
The most common Management, Business, Science and Arts occupations in East Aurora are Community & Social Service (625 | 21.6%), Management (555 | 19.2%), Education Instruction & Library (393 | 13.6%), Health Diagnosing & Treating (324 | 11.2%), and Computers, Engineering & Science (253 | 8.7%).
Management, Business, Science and Arts Occupations by Sex
Within the Management, Business, Science and Arts occupations in East Aurora, the most male-oriented occupations are Architecture & Engineering (82.4%), Legal Services & Support (74.7%), and Computers, Engineering & Science (71.2%), while the most female-oriented occupations are Health Technologists (78.5%), Life, Physical & Social Science (76.0%), and Health Diagnosing & Treating (72.2%).
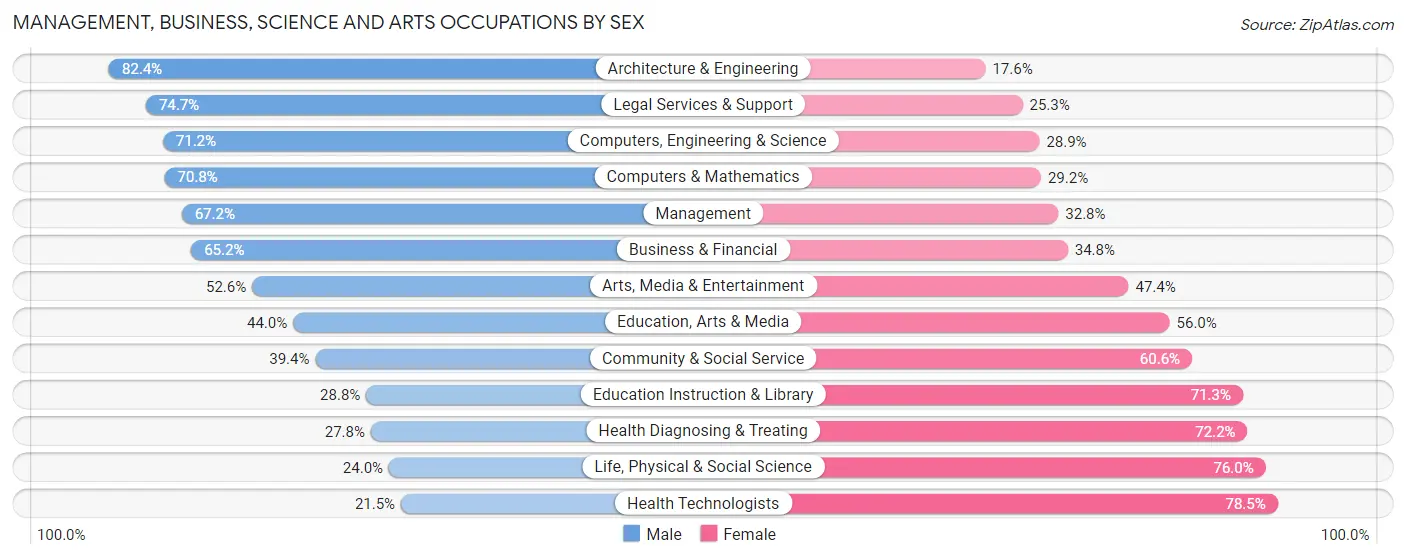
| Occupation | Male | Female |
| Management | 373 (67.2%) | 182 (32.8%) |
| Business & Financial | 107 (65.2%) | 57 (34.8%) |
| Computers, Engineering & Science | 180 (71.2%) | 73 (28.8%) |
| Computers & Mathematics | 85 (70.8%) | 35 (29.2%) |
| Architecture & Engineering | 89 (82.4%) | 19 (17.6%) |
| Life, Physical & Social Science | 6 (24.0%) | 19 (76.0%) |
| Community & Social Service | 246 (39.4%) | 379 (60.6%) |
| Education, Arts & Media | 33 (44.0%) | 42 (56.0%) |
| Legal Services & Support | 59 (74.7%) | 20 (25.3%) |
| Education Instruction & Library | 113 (28.7%) | 280 (71.3%) |
| Arts, Media & Entertainment | 41 (52.6%) | 37 (47.4%) |
| Health Diagnosing & Treating | 90 (27.8%) | 234 (72.2%) |
| Health Technologists | 49 (21.5%) | 179 (78.5%) |
| Total (Category) | 996 (51.8%) | 925 (48.1%) |
| Total (Overall) | 1,552 (53.7%) | 1,339 (46.3%) |
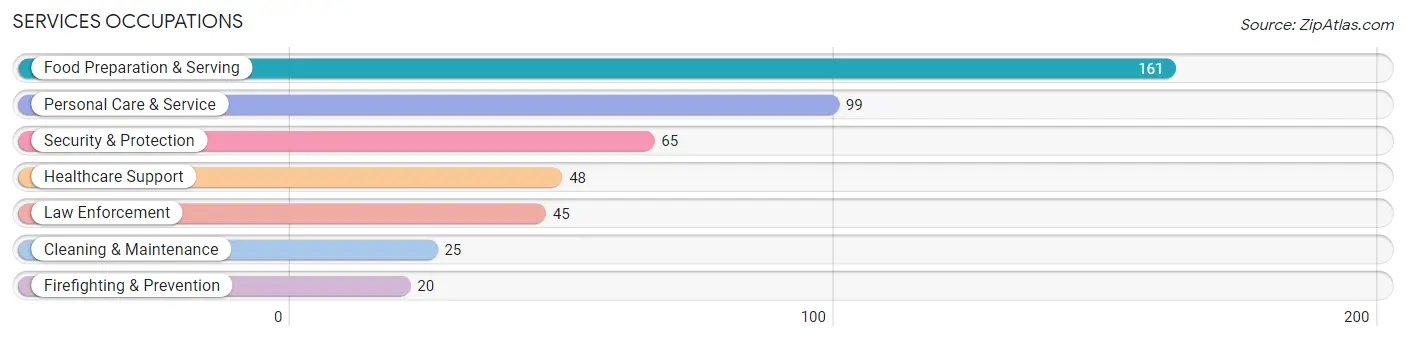
Services Occupations
The most common Services occupations in East Aurora are Food Preparation & Serving (161 | 5.6%), Personal Care & Service (99 | 3.4%), Security & Protection (65 | 2.2%), Healthcare Support (48 | 1.7%), and Law Enforcement (45 | 1.6%).
Services Occupations by Sex
Within the Services occupations in East Aurora, the most male-oriented occupations are Law Enforcement (100.0%), Cleaning & Maintenance (100.0%), and Security & Protection (78.5%), while the most female-oriented occupations are Personal Care & Service (78.8%), Firefighting & Prevention (70.0%), and Food Preparation & Serving (61.5%).
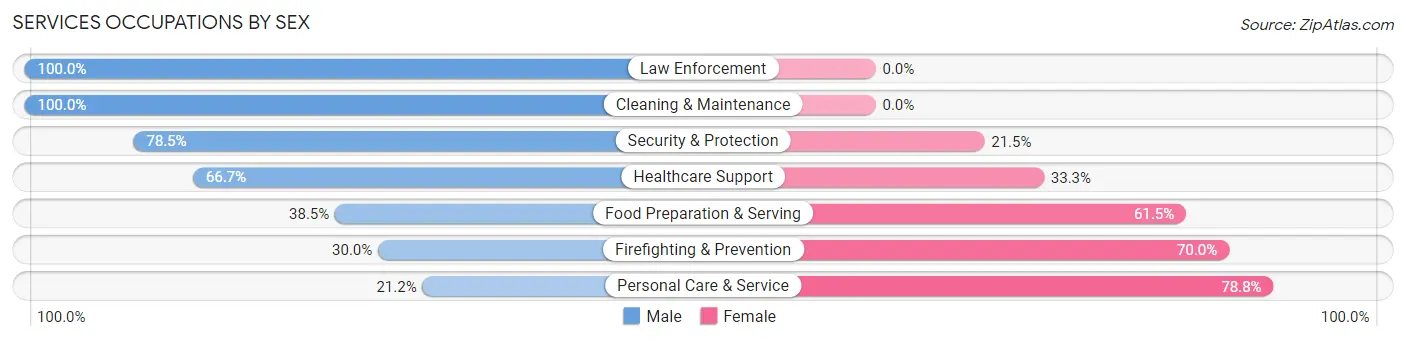
| Occupation | Male | Female |
| Healthcare Support | 32 (66.7%) | 16 (33.3%) |
| Security & Protection | 51 (78.5%) | 14 (21.5%) |
| Firefighting & Prevention | 6 (30.0%) | 14 (70.0%) |
| Law Enforcement | 45 (100.0%) | 0 (0.0%) |
| Food Preparation & Serving | 62 (38.5%) | 99 (61.5%) |
| Cleaning & Maintenance | 25 (100.0%) | 0 (0.0%) |
| Personal Care & Service | 21 (21.2%) | 78 (78.8%) |
| Total (Category) | 191 (48.0%) | 207 (52.0%) |
| Total (Overall) | 1,552 (53.7%) | 1,339 (46.3%) |
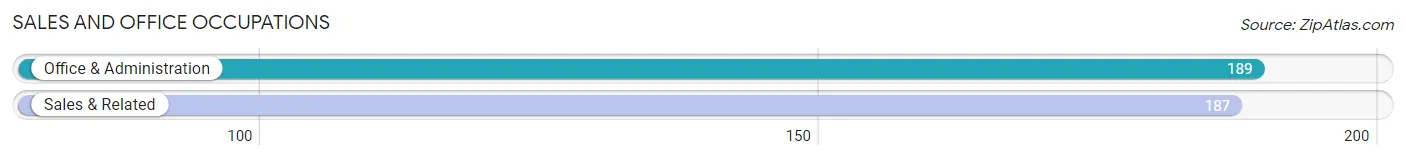
Sales and Office Occupations
The most common Sales and Office occupations in East Aurora are Office & Administration (189 | 6.5%), and Sales & Related (187 | 6.5%).
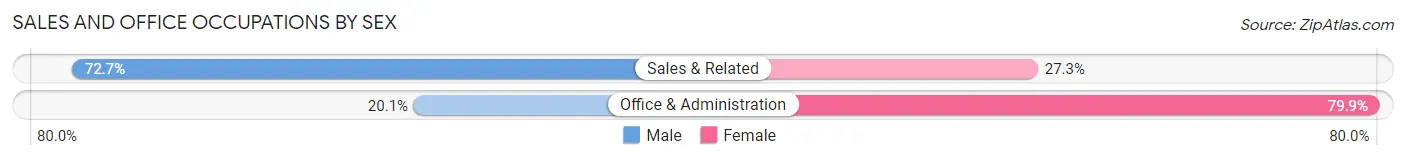
Sales and Office Occupations by Sex
| Occupation | Male | Female |
| Sales & Related | 136 (72.7%) | 51 (27.3%) |
| Office & Administration | 38 (20.1%) | 151 (79.9%) |
| Total (Category) | 174 (46.3%) | 202 (53.7%) |
| Total (Overall) | 1,552 (53.7%) | 1,339 (46.3%) |
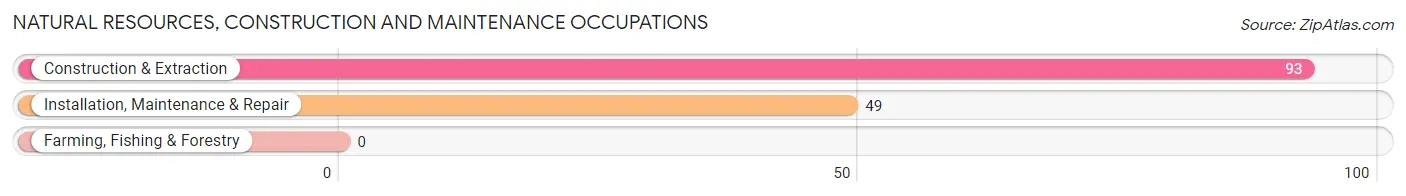
Natural Resources, Construction and Maintenance Occupations
The most common Natural Resources, Construction and Maintenance occupations in East Aurora are Construction & Extraction (93 | 3.2%), and Installation, Maintenance & Repair (49 | 1.7%).
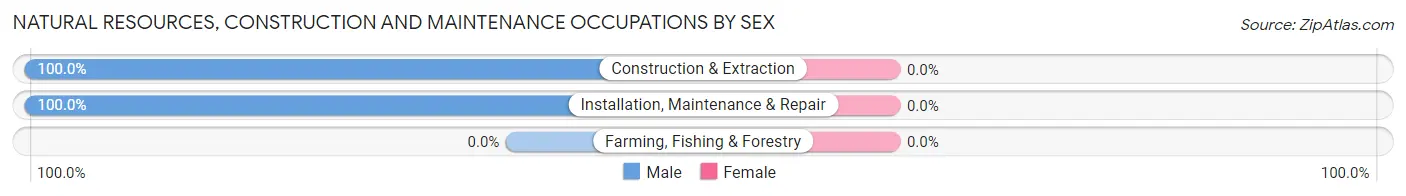
Natural Resources, Construction and Maintenance Occupations by Sex
| Occupation | Male | Female |
| Farming, Fishing & Forestry | 0 (0.0%) | 0 (0.0%) |
| Construction & Extraction | 93 (100.0%) | 0 (0.0%) |
| Installation, Maintenance & Repair | 49 (100.0%) | 0 (0.0%) |
| Total (Category) | 142 (100.0%) | 0 (0.0%) |
| Total (Overall) | 1,552 (53.7%) | 1,339 (46.3%) |
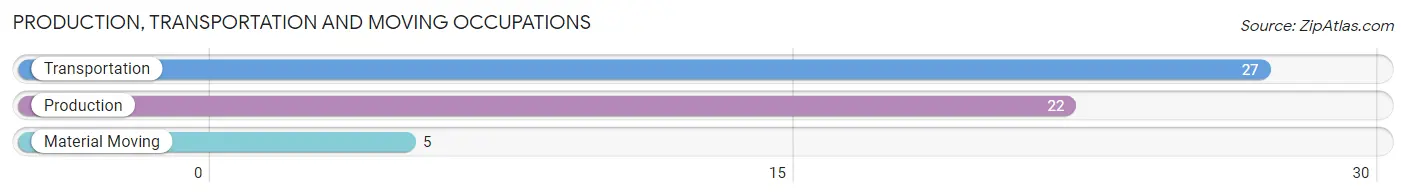
Production, Transportation and Moving Occupations
The most common Production, Transportation and Moving occupations in East Aurora are Transportation (27 | 0.9%), Production (22 | 0.8%), and Material Moving (5 | 0.2%).
Production, Transportation and Moving Occupations by Sex
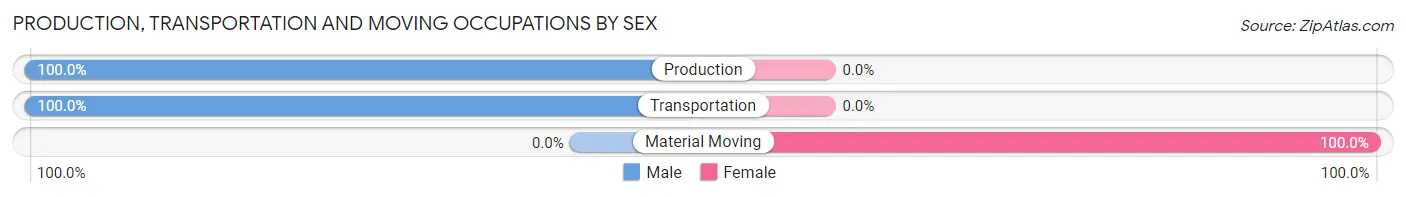
| Occupation | Male | Female |
| Production | 22 (100.0%) | 0 (0.0%) |
| Transportation | 27 (100.0%) | 0 (0.0%) |
| Material Moving | 0 (0.0%) | 5 (100.0%) |
| Total (Category) | 49 (90.7%) | 5 (9.3%) |
| Total (Overall) | 1,552 (53.7%) | 1,339 (46.3%) |
Employment Industries by Sex in East Aurora
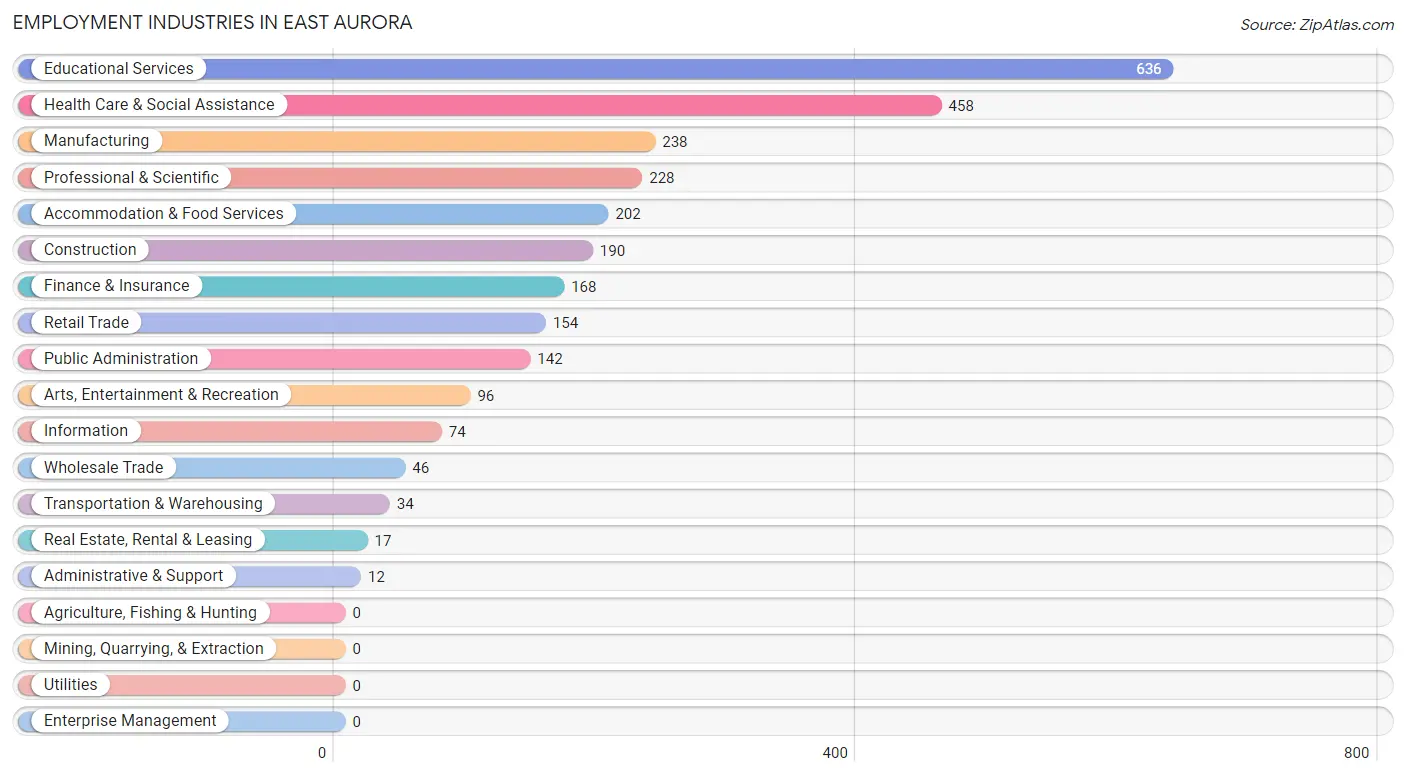
Employment Industries in East Aurora
The major employment industries in East Aurora include Educational Services (636 | 22.0%), Health Care & Social Assistance (458 | 15.8%), Manufacturing (238 | 8.2%), Professional & Scientific (228 | 7.9%), and Accommodation & Food Services (202 | 7.0%).
Employment Industries by Sex in East Aurora
The East Aurora industries that see more men than women are Construction (85.8%), Manufacturing (85.7%), and Real Estate, Rental & Leasing (82.4%), whereas the industries that tend to have a higher number of women are Administrative & Support (100.0%), Health Care & Social Assistance (70.7%), and Arts, Entertainment & Recreation (63.5%).
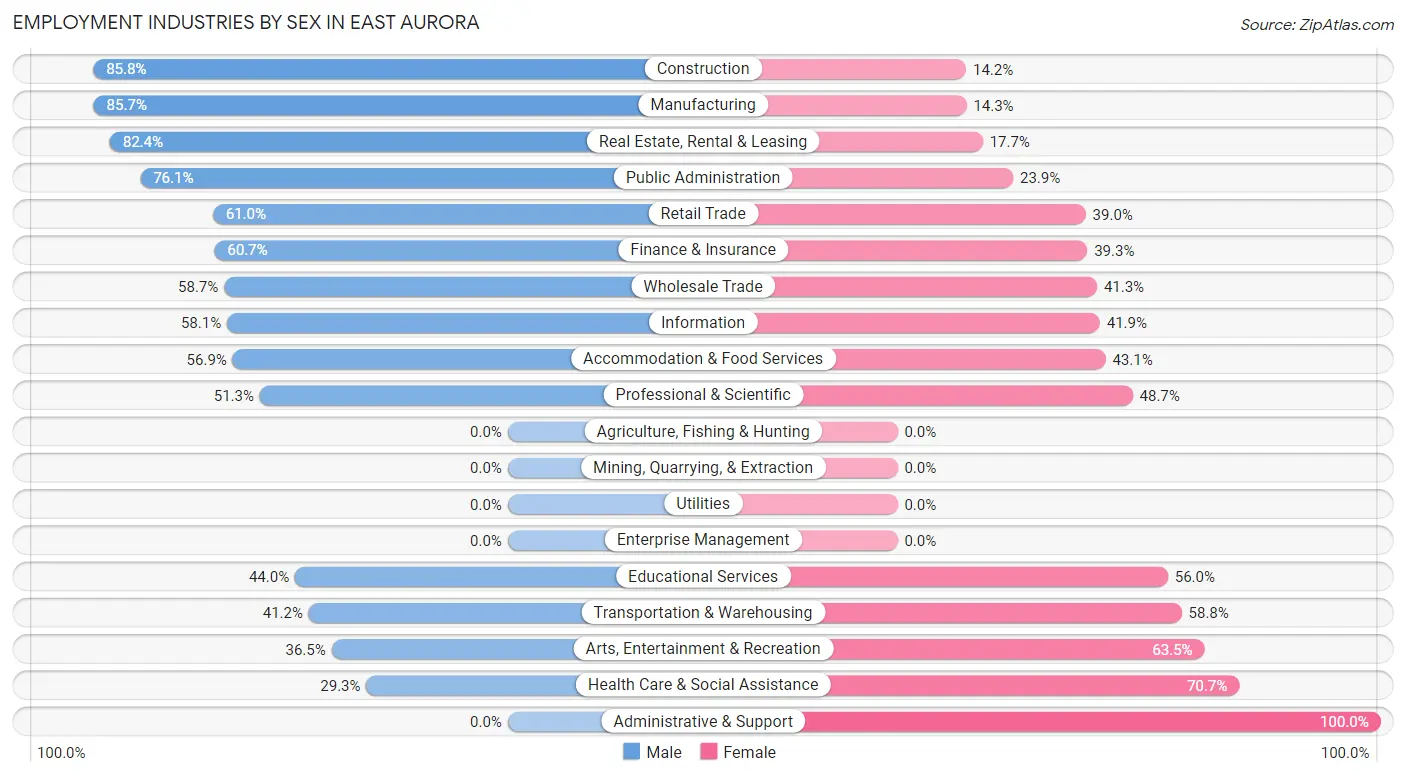
| Industry | Male | Female |
| Agriculture, Fishing & Hunting | 0 (0.0%) | 0 (0.0%) |
| Mining, Quarrying, & Extraction | 0 (0.0%) | 0 (0.0%) |
| Construction | 163 (85.8%) | 27 (14.2%) |
| Manufacturing | 204 (85.7%) | 34 (14.3%) |
| Wholesale Trade | 27 (58.7%) | 19 (41.3%) |
| Retail Trade | 94 (61.0%) | 60 (39.0%) |
| Transportation & Warehousing | 14 (41.2%) | 20 (58.8%) |
| Utilities | 0 (0.0%) | 0 (0.0%) |
| Information | 43 (58.1%) | 31 (41.9%) |
| Finance & Insurance | 102 (60.7%) | 66 (39.3%) |
| Real Estate, Rental & Leasing | 14 (82.4%) | 3 (17.6%) |
| Professional & Scientific | 117 (51.3%) | 111 (48.7%) |
| Enterprise Management | 0 (0.0%) | 0 (0.0%) |
| Administrative & Support | 0 (0.0%) | 12 (100.0%) |
| Educational Services | 280 (44.0%) | 356 (56.0%) |
| Health Care & Social Assistance | 134 (29.3%) | 324 (70.7%) |
| Arts, Entertainment & Recreation | 35 (36.5%) | 61 (63.5%) |
| Accommodation & Food Services | 115 (56.9%) | 87 (43.1%) |
| Public Administration | 108 (76.1%) | 34 (23.9%) |
| Total | 1,552 (53.7%) | 1,339 (46.3%) |
Education in East Aurora
School Enrollment in East Aurora
The most common levels of schooling among the 1,162 students in East Aurora are middle school (288 | 24.8%), high school (278 | 23.9%), and elementary school (262 | 22.6%).
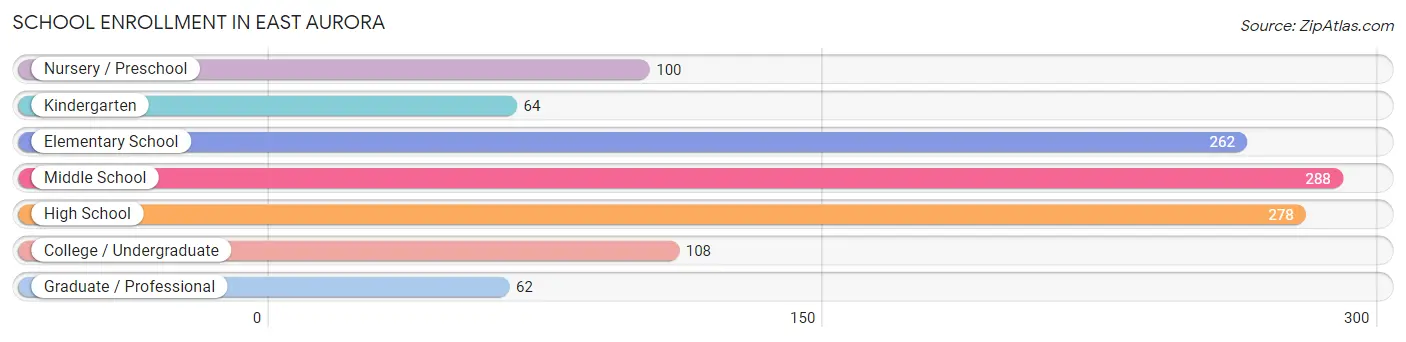
| School Level | # Students | % Students |
| Nursery / Preschool | 100 | 8.6% |
| Kindergarten | 64 | 5.5% |
| Elementary School | 262 | 22.6% |
| Middle School | 288 | 24.8% |
| High School | 278 | 23.9% |
| College / Undergraduate | 108 | 9.3% |
| Graduate / Professional | 62 | 5.3% |
| Total | 1,162 | 100.0% |
School Enrollment by Age by Funding Source in East Aurora
Out of a total of 1,162 students who are enrolled in schools in East Aurora, 263 (22.6%) attend a private institution, while the remaining 899 (77.4%) are enrolled in public schools. The age group of 3 to 4 year olds has the highest likelihood of being enrolled in private schools, with 49 (72.1% in the age bracket) enrolled. Conversely, the age group of 10 to 14 year olds has the lowest likelihood of being enrolled in a private school, with 326 (92.9% in the age bracket) attending a public institution.
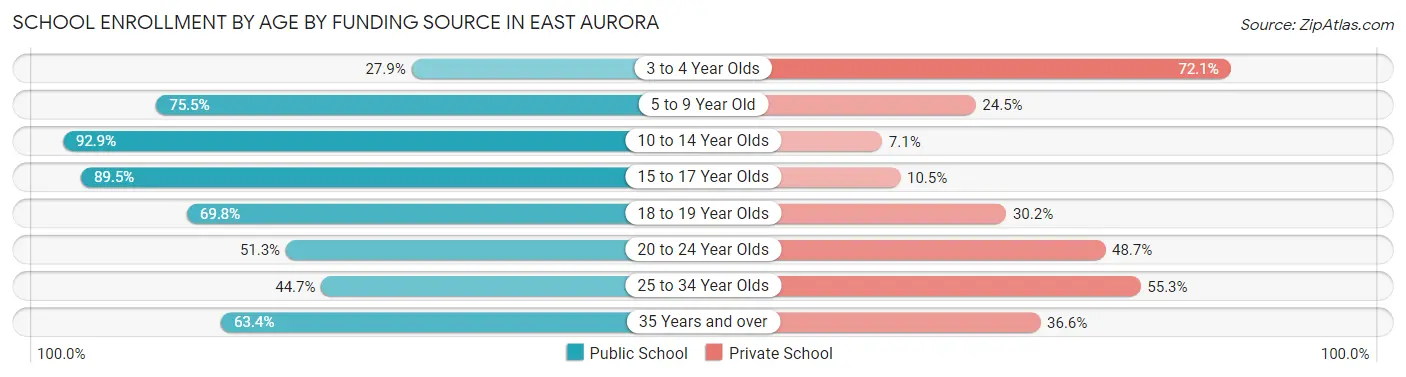
| Age Bracket | Public School | Private School |
| 3 to 4 Year Olds | 19 (27.9%) | 49 (72.1%) |
| 5 to 9 Year Old | 246 (75.5%) | 80 (24.5%) |
| 10 to 14 Year Olds | 326 (92.9%) | 25 (7.1%) |
| 15 to 17 Year Olds | 196 (89.5%) | 23 (10.5%) |
| 18 to 19 Year Olds | 30 (69.8%) | 13 (30.2%) |
| 20 to 24 Year Olds | 39 (51.3%) | 37 (48.7%) |
| 25 to 34 Year Olds | 17 (44.7%) | 21 (55.3%) |
| 35 Years and over | 26 (63.4%) | 15 (36.6%) |
| Total | 899 (77.4%) | 263 (22.6%) |
Educational Attainment by Field of Study in East Aurora
Business (381 | 13.6%), education (354 | 12.7%), science & technology (282 | 10.1%), arts & humanities (262 | 9.4%), and social sciences (231 | 8.3%) are the most common fields of study among 2,795 individuals in East Aurora who have obtained a bachelor's degree or higher.
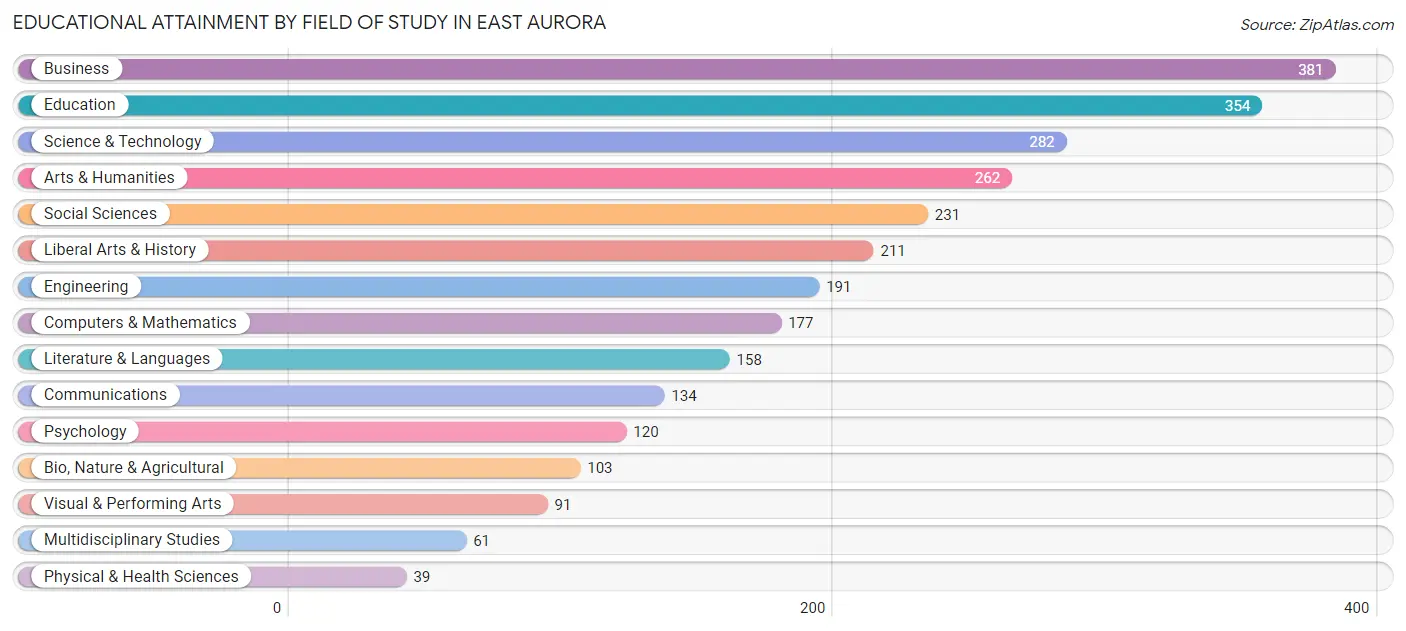
| Field of Study | # Graduates | % Graduates |
| Computers & Mathematics | 177 | 6.3% |
| Bio, Nature & Agricultural | 103 | 3.7% |
| Physical & Health Sciences | 39 | 1.4% |
| Psychology | 120 | 4.3% |
| Social Sciences | 231 | 8.3% |
| Engineering | 191 | 6.8% |
| Multidisciplinary Studies | 61 | 2.2% |
| Science & Technology | 282 | 10.1% |
| Business | 381 | 13.6% |
| Education | 354 | 12.7% |
| Literature & Languages | 158 | 5.7% |
| Liberal Arts & History | 211 | 7.5% |
| Visual & Performing Arts | 91 | 3.3% |
| Communications | 134 | 4.8% |
| Arts & Humanities | 262 | 9.4% |
| Total | 2,795 | 100.0% |
Transportation & Commute in East Aurora
Vehicle Availability by Sex in East Aurora
The most prevalent vehicle ownership categories in East Aurora are males with 2 vehicles (736, accounting for 49.1%) and females with 2 vehicles (704, making up 56.1%).
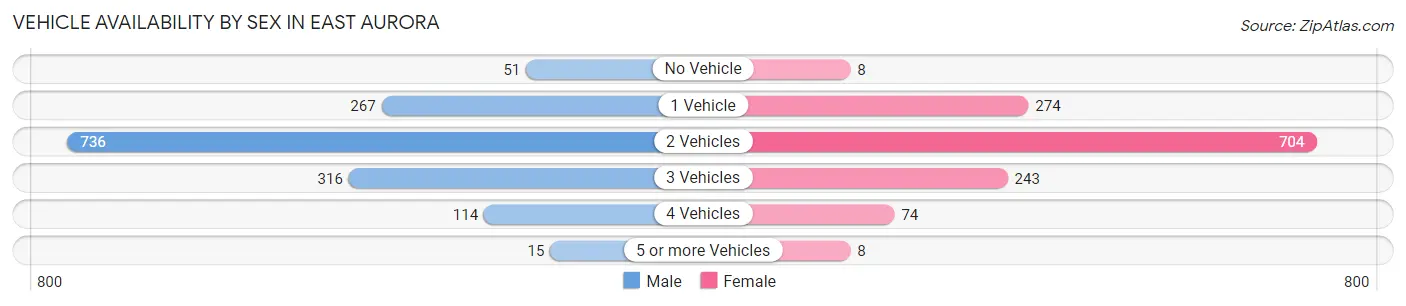
| Vehicles Available | Male | Female |
| No Vehicle | 51 (3.4%) | 8 (0.6%) |
| 1 Vehicle | 267 (17.8%) | 274 (20.9%) |
| 2 Vehicles | 736 (49.1%) | 704 (53.7%) |
| 3 Vehicles | 316 (21.1%) | 243 (18.5%) |
| 4 Vehicles | 114 (7.6%) | 74 (5.6%) |
| 5 or more Vehicles | 15 (1.0%) | 8 (0.6%) |
| Total | 1,499 (100.0%) | 1,311 (100.0%) |
Commute Time in East Aurora
The most frequently occuring commute durations in East Aurora are 30 to 34 minutes (488 commuters, 21.1%), 5 to 9 minutes (366 commuters, 15.9%), and 10 to 14 minutes (289 commuters, 12.5%).
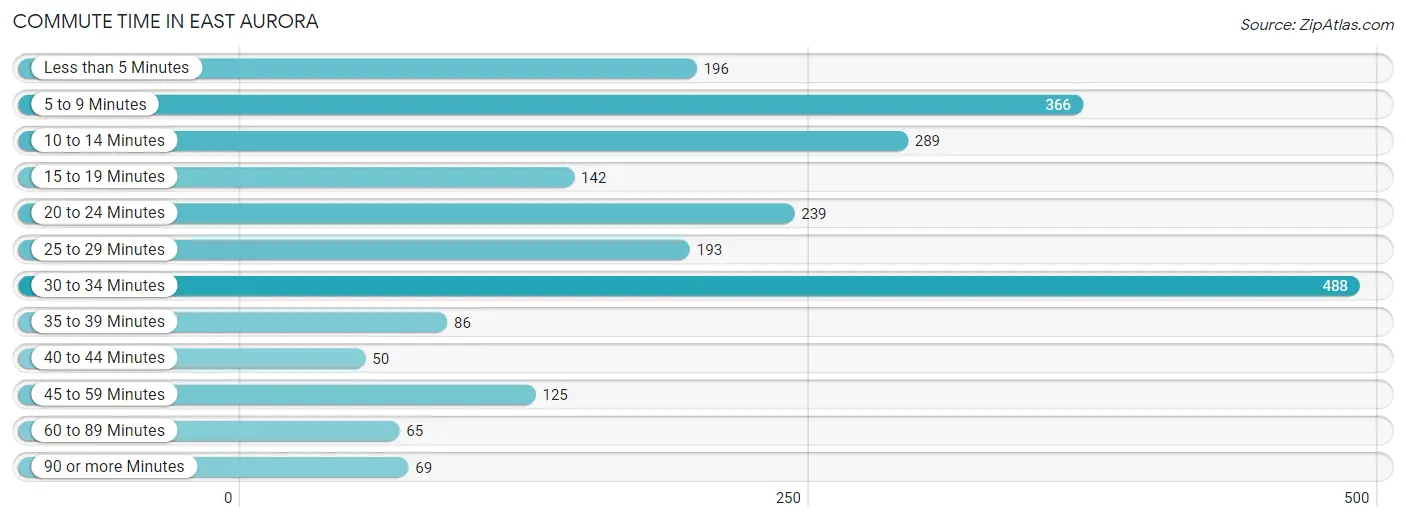
| Commute Time | # Commuters | % Commuters |
| Less than 5 Minutes | 196 | 8.5% |
| 5 to 9 Minutes | 366 | 15.9% |
| 10 to 14 Minutes | 289 | 12.5% |
| 15 to 19 Minutes | 142 | 6.1% |
| 20 to 24 Minutes | 239 | 10.4% |
| 25 to 29 Minutes | 193 | 8.4% |
| 30 to 34 Minutes | 488 | 21.1% |
| 35 to 39 Minutes | 86 | 3.7% |
| 40 to 44 Minutes | 50 | 2.2% |
| 45 to 59 Minutes | 125 | 5.4% |
| 60 to 89 Minutes | 65 | 2.8% |
| 90 or more Minutes | 69 | 3.0% |
Commute Time by Sex in East Aurora
The most common commute times in East Aurora are 30 to 34 minutes (266 commuters, 21.6%) for males and 30 to 34 minutes (222 commuters, 20.6%) for females.
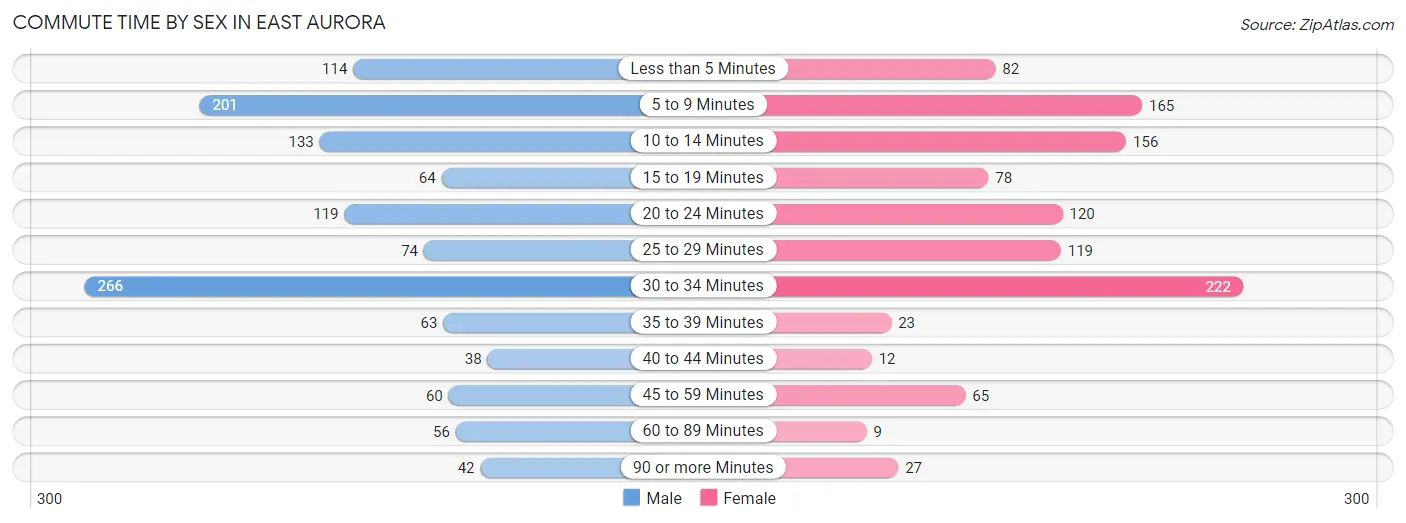
| Commute Time | Male | Female |
| Less than 5 Minutes | 114 (9.3%) | 82 (7.6%) |
| 5 to 9 Minutes | 201 (16.3%) | 165 (15.3%) |
| 10 to 14 Minutes | 133 (10.8%) | 156 (14.5%) |
| 15 to 19 Minutes | 64 (5.2%) | 78 (7.2%) |
| 20 to 24 Minutes | 119 (9.7%) | 120 (11.1%) |
| 25 to 29 Minutes | 74 (6.0%) | 119 (11.0%) |
| 30 to 34 Minutes | 266 (21.6%) | 222 (20.6%) |
| 35 to 39 Minutes | 63 (5.1%) | 23 (2.1%) |
| 40 to 44 Minutes | 38 (3.1%) | 12 (1.1%) |
| 45 to 59 Minutes | 60 (4.9%) | 65 (6.0%) |
| 60 to 89 Minutes | 56 (4.5%) | 9 (0.8%) |
| 90 or more Minutes | 42 (3.4%) | 27 (2.5%) |
Time of Departure to Work by Sex in East Aurora
The most frequent times of departure to work in East Aurora are 7:00 AM to 7:29 AM (225, 18.3%) for males and 7:30 AM to 7:59 AM (244, 22.6%) for females.
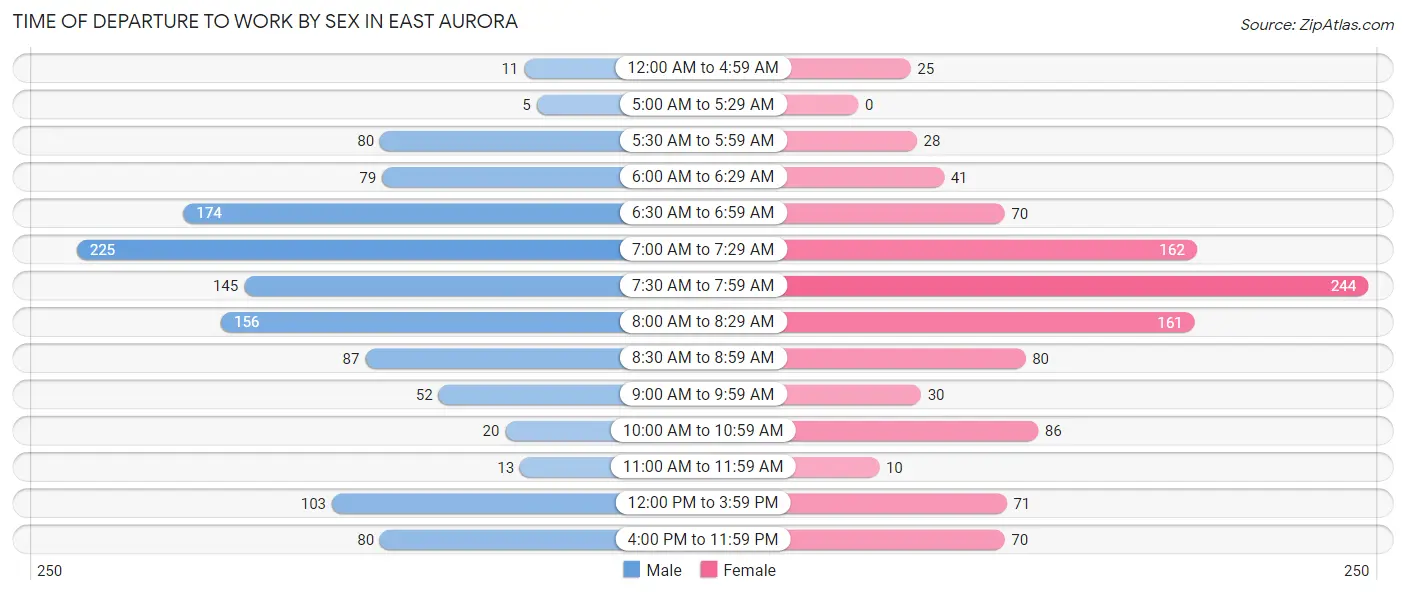
| Time of Departure | Male | Female |
| 12:00 AM to 4:59 AM | 11 (0.9%) | 25 (2.3%) |
| 5:00 AM to 5:29 AM | 5 (0.4%) | 0 (0.0%) |
| 5:30 AM to 5:59 AM | 80 (6.5%) | 28 (2.6%) |
| 6:00 AM to 6:29 AM | 79 (6.4%) | 41 (3.8%) |
| 6:30 AM to 6:59 AM | 174 (14.1%) | 70 (6.5%) |
| 7:00 AM to 7:29 AM | 225 (18.3%) | 162 (15.0%) |
| 7:30 AM to 7:59 AM | 145 (11.8%) | 244 (22.6%) |
| 8:00 AM to 8:29 AM | 156 (12.7%) | 161 (14.9%) |
| 8:30 AM to 8:59 AM | 87 (7.1%) | 80 (7.4%) |
| 9:00 AM to 9:59 AM | 52 (4.2%) | 30 (2.8%) |
| 10:00 AM to 10:59 AM | 20 (1.6%) | 86 (8.0%) |
| 11:00 AM to 11:59 AM | 13 (1.1%) | 10 (0.9%) |
| 12:00 PM to 3:59 PM | 103 (8.4%) | 71 (6.6%) |
| 4:00 PM to 11:59 PM | 80 (6.5%) | 70 (6.5%) |
| Total | 1,230 (100.0%) | 1,078 (100.0%) |
Housing Occupancy in East Aurora
Occupancy by Ownership in East Aurora
Of the total 2,387 dwellings in East Aurora, owner-occupied units account for 1,678 (70.3%), while renter-occupied units make up 709 (29.7%).
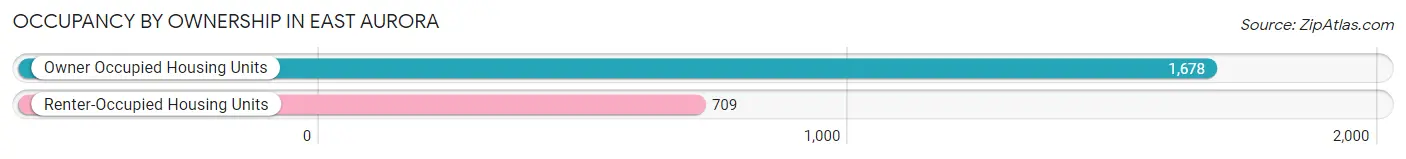
| Occupancy | # Housing Units | % Housing Units |
| Owner Occupied Housing Units | 1,678 | 70.3% |
| Renter-Occupied Housing Units | 709 | 29.7% |
| Total Occupied Housing Units | 2,387 | 100.0% |
Occupancy by Household Size in East Aurora
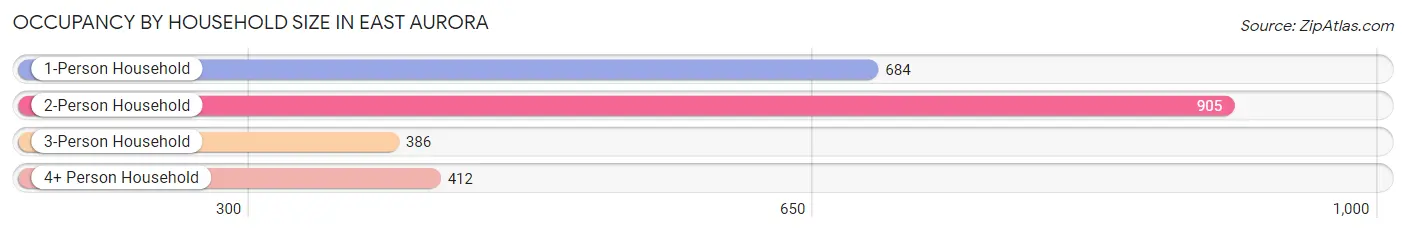
| Household Size | # Housing Units | % Housing Units |
| 1-Person Household | 684 | 28.7% |
| 2-Person Household | 905 | 37.9% |
| 3-Person Household | 386 | 16.2% |
| 4+ Person Household | 412 | 17.3% |
| Total Housing Units | 2,387 | 100.0% |
Occupancy by Ownership by Household Size in East Aurora
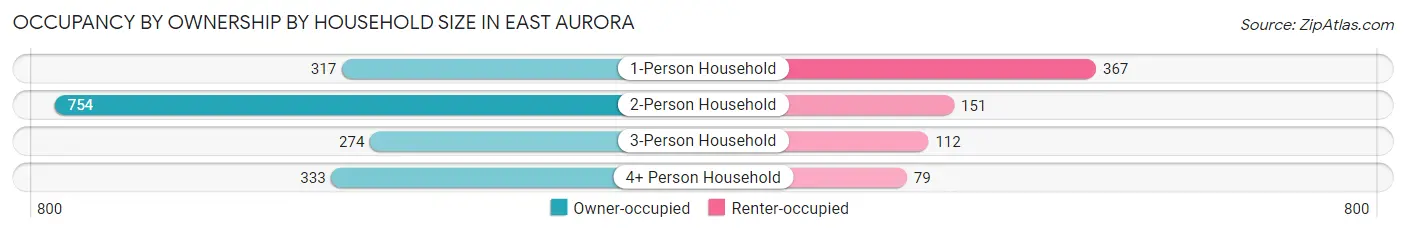
| Household Size | Owner-occupied | Renter-occupied |
| 1-Person Household | 317 (46.4%) | 367 (53.6%) |
| 2-Person Household | 754 (83.3%) | 151 (16.7%) |
| 3-Person Household | 274 (71.0%) | 112 (29.0%) |
| 4+ Person Household | 333 (80.8%) | 79 (19.2%) |
| Total Housing Units | 1,678 (70.3%) | 709 (29.7%) |
Occupancy by Educational Attainment in East Aurora
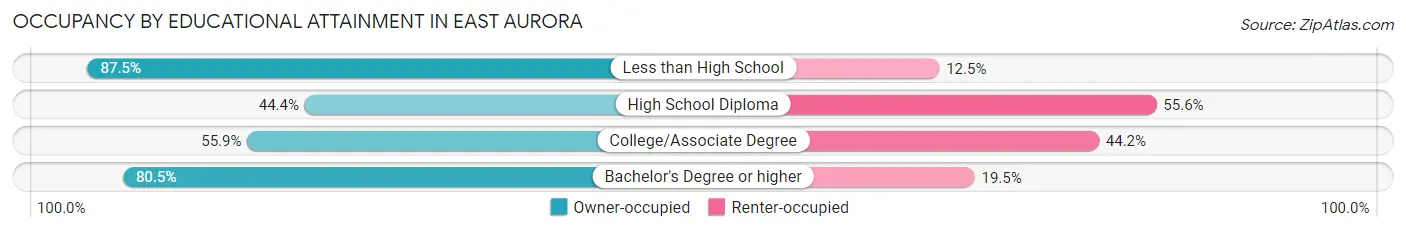
| Household Size | Owner-occupied | Renter-occupied |
| Less than High School | 28 (87.5%) | 4 (12.5%) |
| High School Diploma | 152 (44.4%) | 190 (55.6%) |
| College/Associate Degree | 277 (55.8%) | 219 (44.2%) |
| Bachelor's Degree or higher | 1,221 (80.5%) | 296 (19.5%) |
Occupancy by Age of Householder in East Aurora
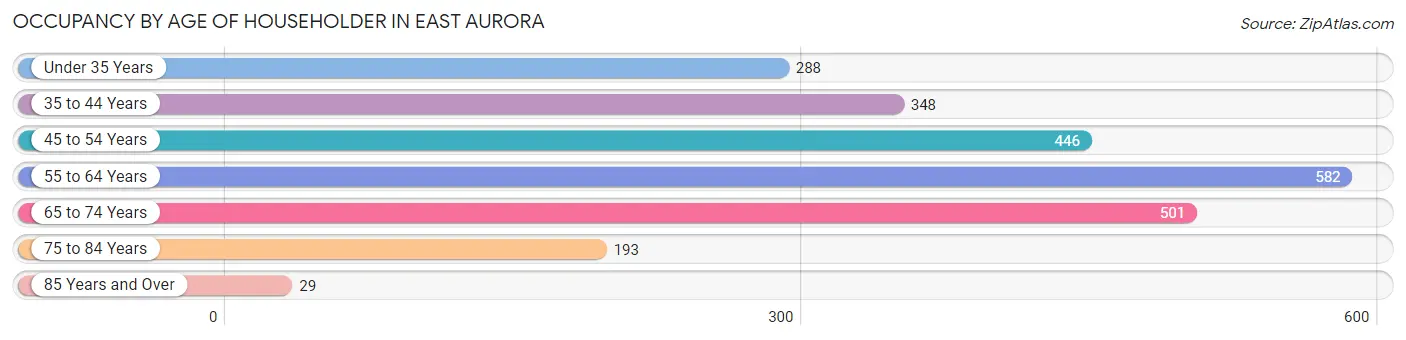
| Age Bracket | # Households | % Households |
| Under 35 Years | 288 | 12.1% |
| 35 to 44 Years | 348 | 14.6% |
| 45 to 54 Years | 446 | 18.7% |
| 55 to 64 Years | 582 | 24.4% |
| 65 to 74 Years | 501 | 21.0% |
| 75 to 84 Years | 193 | 8.1% |
| 85 Years and Over | 29 | 1.2% |
| Total | 2,387 | 100.0% |
Housing Finances in East Aurora
Median Income by Occupancy in East Aurora
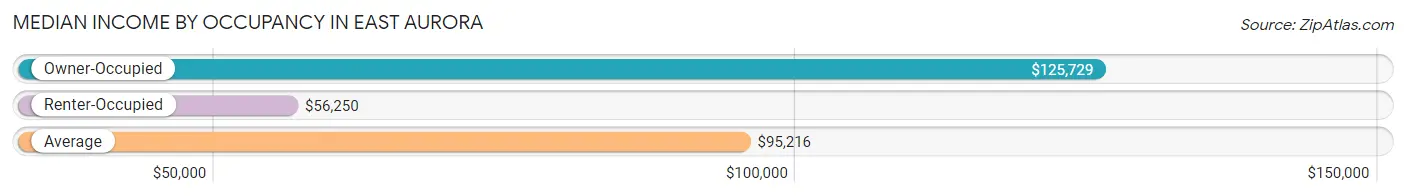
| Occupancy Type | # Households | Median Income |
| Owner-Occupied | 1,678 (70.3%) | $125,729 |
| Renter-Occupied | 709 (29.7%) | $56,250 |
| Average | 2,387 (100.0%) | $95,216 |
Occupancy by Householder Income Bracket in East Aurora
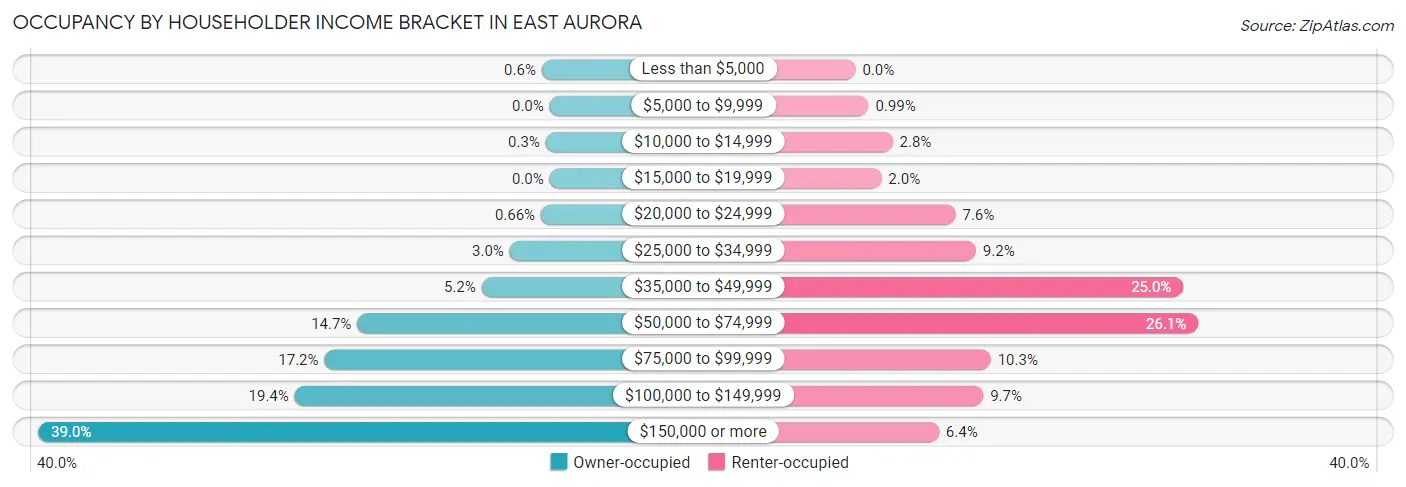
| Income Bracket | Owner-occupied | Renter-occupied |
| Less than $5,000 | 10 (0.6%) | 0 (0.0%) |
| $5,000 to $9,999 | 0 (0.0%) | 7 (1.0%) |
| $10,000 to $14,999 | 5 (0.3%) | 20 (2.8%) |
| $15,000 to $19,999 | 0 (0.0%) | 14 (2.0%) |
| $20,000 to $24,999 | 11 (0.7%) | 54 (7.6%) |
| $25,000 to $34,999 | 51 (3.0%) | 65 (9.2%) |
| $35,000 to $49,999 | 87 (5.2%) | 177 (25.0%) |
| $50,000 to $74,999 | 246 (14.7%) | 185 (26.1%) |
| $75,000 to $99,999 | 288 (17.2%) | 73 (10.3%) |
| $100,000 to $149,999 | 326 (19.4%) | 69 (9.7%) |
| $150,000 or more | 654 (39.0%) | 45 (6.4%) |
| Total | 1,678 (100.0%) | 709 (100.0%) |
Monthly Housing Cost Tiers in East Aurora
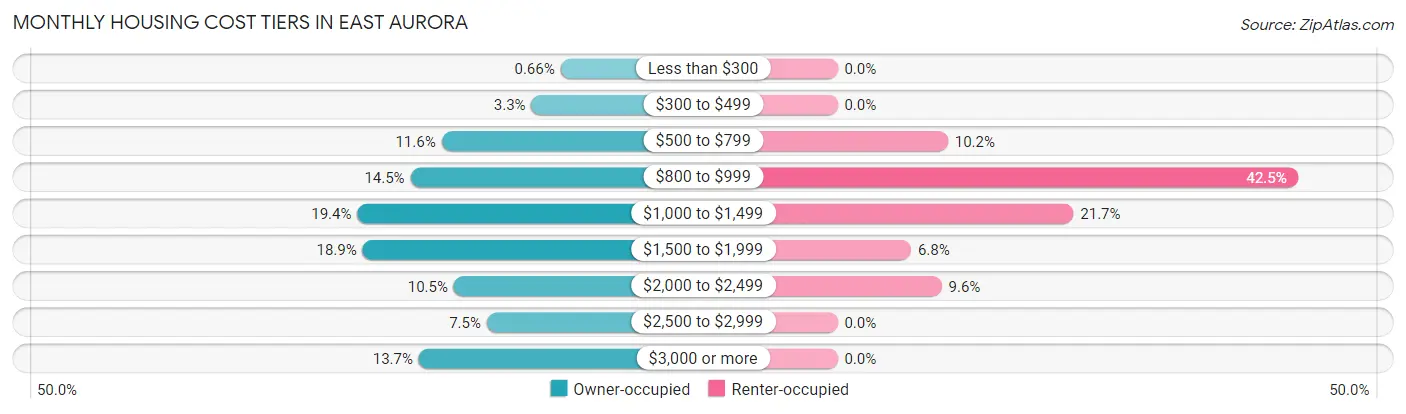
| Monthly Cost | Owner-occupied | Renter-occupied |
| Less than $300 | 11 (0.7%) | 0 (0.0%) |
| $300 to $499 | 56 (3.3%) | 0 (0.0%) |
| $500 to $799 | 195 (11.6%) | 72 (10.2%) |
| $800 to $999 | 243 (14.5%) | 301 (42.4%) |
| $1,000 to $1,499 | 325 (19.4%) | 154 (21.7%) |
| $1,500 to $1,999 | 317 (18.9%) | 48 (6.8%) |
| $2,000 to $2,499 | 176 (10.5%) | 68 (9.6%) |
| $2,500 to $2,999 | 125 (7.4%) | 0 (0.0%) |
| $3,000 or more | 230 (13.7%) | 0 (0.0%) |
| Total | 1,678 (100.0%) | 709 (100.0%) |
Physical Housing Characteristics in East Aurora
Housing Structures in East Aurora
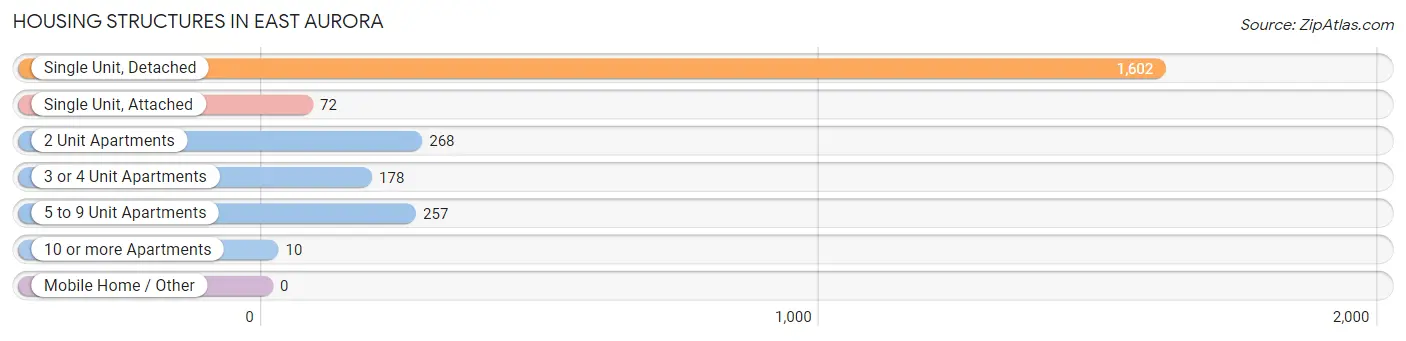
| Structure Type | # Housing Units | % Housing Units |
| Single Unit, Detached | 1,602 | 67.1% |
| Single Unit, Attached | 72 | 3.0% |
| 2 Unit Apartments | 268 | 11.2% |
| 3 or 4 Unit Apartments | 178 | 7.5% |
| 5 to 9 Unit Apartments | 257 | 10.8% |
| 10 or more Apartments | 10 | 0.4% |
| Mobile Home / Other | 0 | 0.0% |
| Total | 2,387 | 100.0% |
Housing Structures by Occupancy in East Aurora
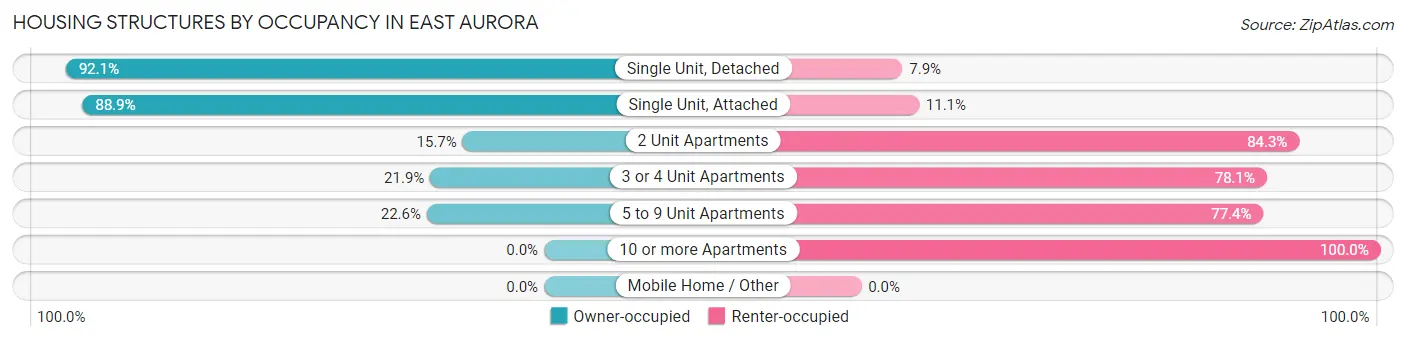
| Structure Type | Owner-occupied | Renter-occupied |
| Single Unit, Detached | 1,475 (92.1%) | 127 (7.9%) |
| Single Unit, Attached | 64 (88.9%) | 8 (11.1%) |
| 2 Unit Apartments | 42 (15.7%) | 226 (84.3%) |
| 3 or 4 Unit Apartments | 39 (21.9%) | 139 (78.1%) |
| 5 to 9 Unit Apartments | 58 (22.6%) | 199 (77.4%) |
| 10 or more Apartments | 0 (0.0%) | 10 (100.0%) |
| Mobile Home / Other | 0 (0.0%) | 0 (0.0%) |
| Total | 1,678 (70.3%) | 709 (29.7%) |
Housing Structures by Number of Rooms in East Aurora
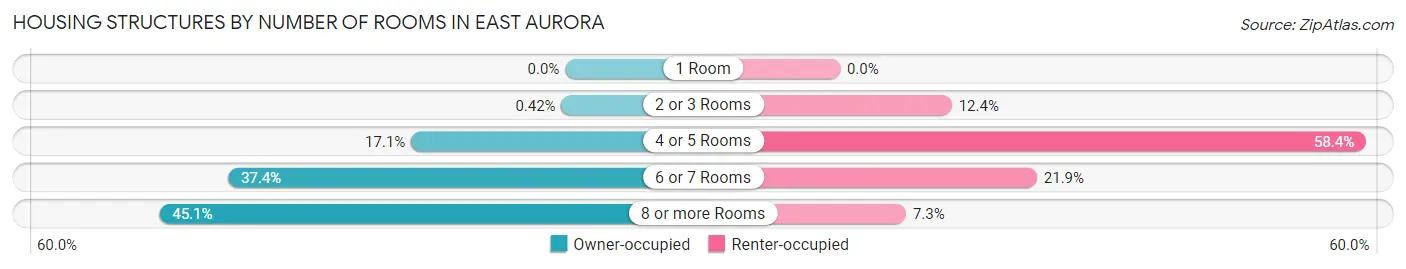
| Number of Rooms | Owner-occupied | Renter-occupied |
| 1 Room | 0 (0.0%) | 0 (0.0%) |
| 2 or 3 Rooms | 7 (0.4%) | 88 (12.4%) |
| 4 or 5 Rooms | 287 (17.1%) | 414 (58.4%) |
| 6 or 7 Rooms | 628 (37.4%) | 155 (21.9%) |
| 8 or more Rooms | 756 (45.1%) | 52 (7.3%) |
| Total | 1,678 (100.0%) | 709 (100.0%) |
Housing Structure by Heating Type in East Aurora
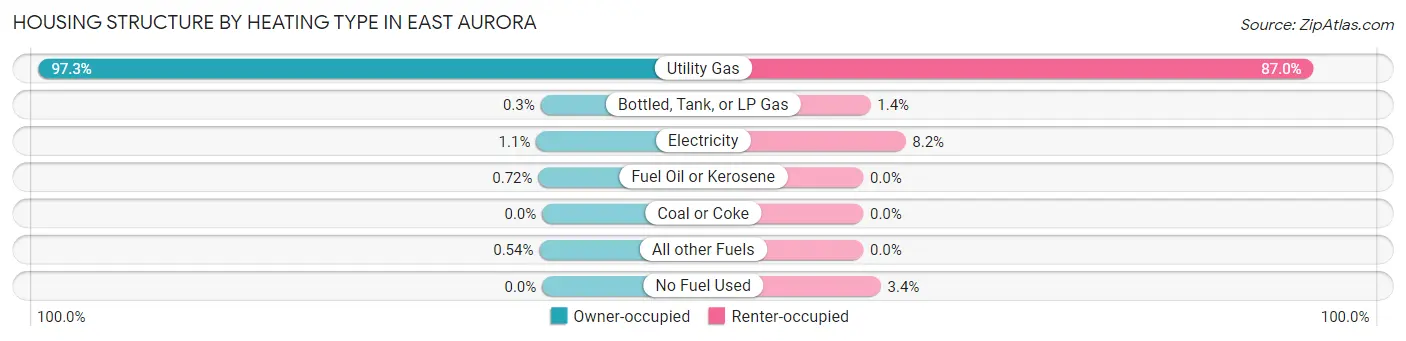
| Heating Type | Owner-occupied | Renter-occupied |
| Utility Gas | 1,633 (97.3%) | 617 (87.0%) |
| Bottled, Tank, or LP Gas | 5 (0.3%) | 10 (1.4%) |
| Electricity | 19 (1.1%) | 58 (8.2%) |
| Fuel Oil or Kerosene | 12 (0.7%) | 0 (0.0%) |
| Coal or Coke | 0 (0.0%) | 0 (0.0%) |
| All other Fuels | 9 (0.5%) | 0 (0.0%) |
| No Fuel Used | 0 (0.0%) | 24 (3.4%) |
| Total | 1,678 (100.0%) | 709 (100.0%) |
Household Vehicle Usage in East Aurora
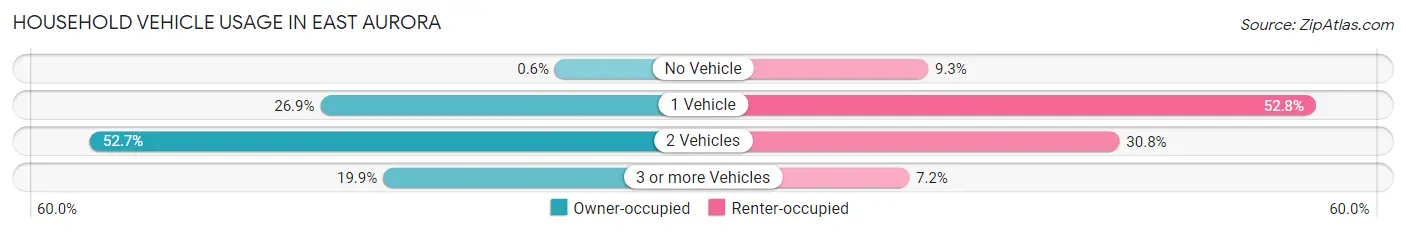
| Vehicles per Household | Owner-occupied | Renter-occupied |
| No Vehicle | 10 (0.6%) | 66 (9.3%) |
| 1 Vehicle | 451 (26.9%) | 374 (52.7%) |
| 2 Vehicles | 884 (52.7%) | 218 (30.7%) |
| 3 or more Vehicles | 333 (19.9%) | 51 (7.2%) |
| Total | 1,678 (100.0%) | 709 (100.0%) |
Real Estate & Mortgages in East Aurora
Real Estate and Mortgage Overview in East Aurora
| Characteristic | Without Mortgage | With Mortgage |
| Housing Units | 661 | 1,017 |
| Median Property Value | $298,500 | $327,500 |
| Median Household Income | $81,349 | $527 |
| Monthly Housing Costs | $858 | $224 |
| Real Estate Taxes | $6,049 | $18 |
Property Value by Mortgage Status in East Aurora
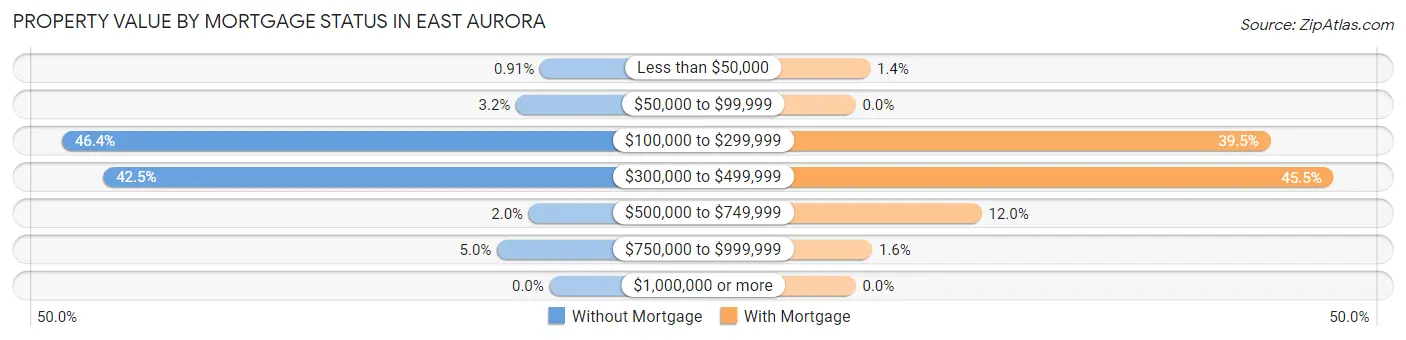
| Property Value | Without Mortgage | With Mortgage |
| Less than $50,000 | 6 (0.9%) | 14 (1.4%) |
| $50,000 to $99,999 | 21 (3.2%) | 0 (0.0%) |
| $100,000 to $299,999 | 307 (46.4%) | 402 (39.5%) |
| $300,000 to $499,999 | 281 (42.5%) | 463 (45.5%) |
| $500,000 to $749,999 | 13 (2.0%) | 122 (12.0%) |
| $750,000 to $999,999 | 33 (5.0%) | 16 (1.6%) |
| $1,000,000 or more | 0 (0.0%) | 0 (0.0%) |
| Total | 661 (100.0%) | 1,017 (100.0%) |
Household Income by Mortgage Status in East Aurora
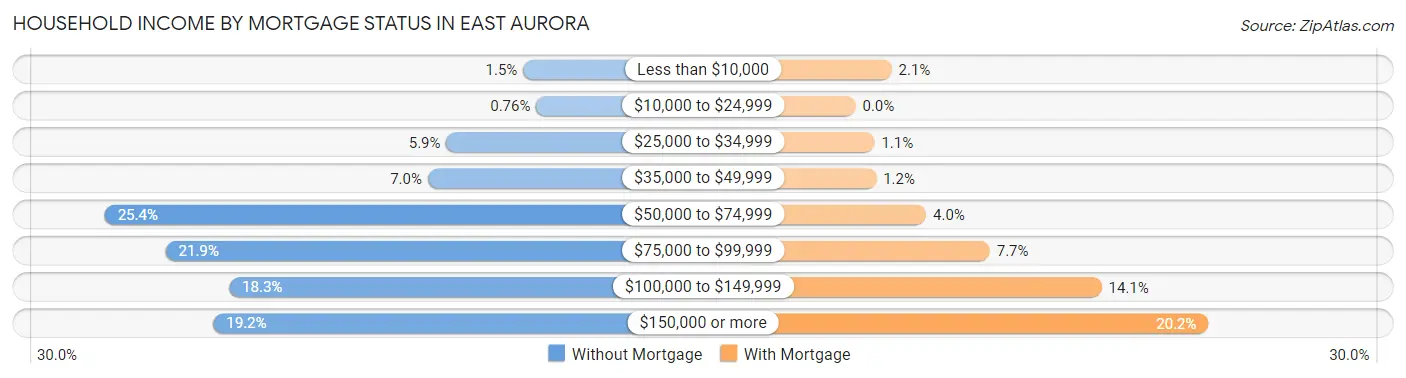
| Household Income | Without Mortgage | With Mortgage |
| Less than $10,000 | 10 (1.5%) | 21 (2.1%) |
| $10,000 to $24,999 | 5 (0.8%) | 0 (0.0%) |
| $25,000 to $34,999 | 39 (5.9%) | 11 (1.1%) |
| $35,000 to $49,999 | 46 (7.0%) | 12 (1.2%) |
| $50,000 to $74,999 | 168 (25.4%) | 41 (4.0%) |
| $75,000 to $99,999 | 145 (21.9%) | 78 (7.7%) |
| $100,000 to $149,999 | 121 (18.3%) | 143 (14.1%) |
| $150,000 or more | 127 (19.2%) | 205 (20.2%) |
| Total | 661 (100.0%) | 1,017 (100.0%) |
Property Value to Household Income Ratio in East Aurora
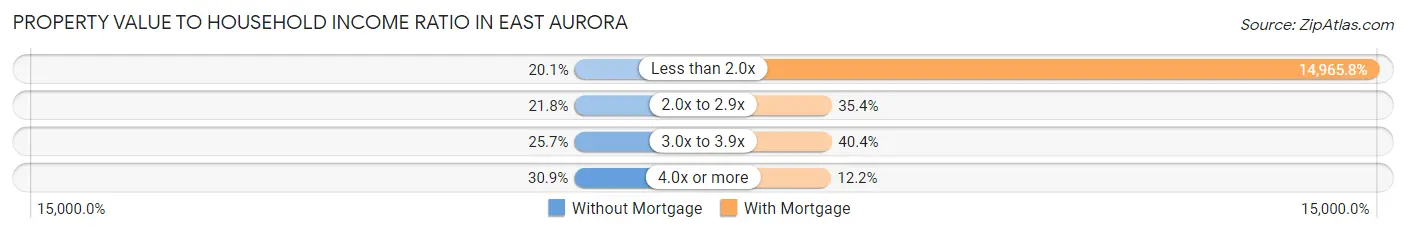
| Value-to-Income Ratio | Without Mortgage | With Mortgage |
| Less than 2.0x | 133 (20.1%) | 152,202 (14,965.8%) |
| 2.0x to 2.9x | 144 (21.8%) | 360 (35.4%) |
| 3.0x to 3.9x | 170 (25.7%) | 411 (40.4%) |
| 4.0x or more | 204 (30.9%) | 124 (12.2%) |
| Total | 661 (100.0%) | 1,017 (100.0%) |
Real Estate Taxes by Mortgage Status in East Aurora
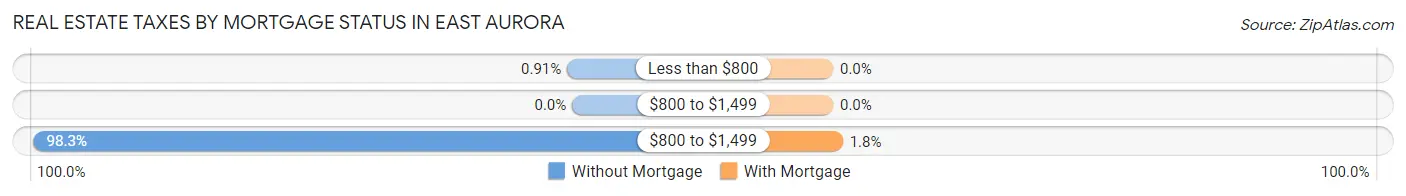
| Property Taxes | Without Mortgage | With Mortgage |
| Less than $800 | 6 (0.9%) | 0 (0.0%) |
| $800 to $1,499 | 0 (0.0%) | 0 (0.0%) |
| $800 to $1,499 | 650 (98.3%) | 18 (1.8%) |
| Total | 661 (100.0%) | 1,017 (100.0%) |
Health & Disability in East Aurora
Health Insurance Coverage by Age in East Aurora
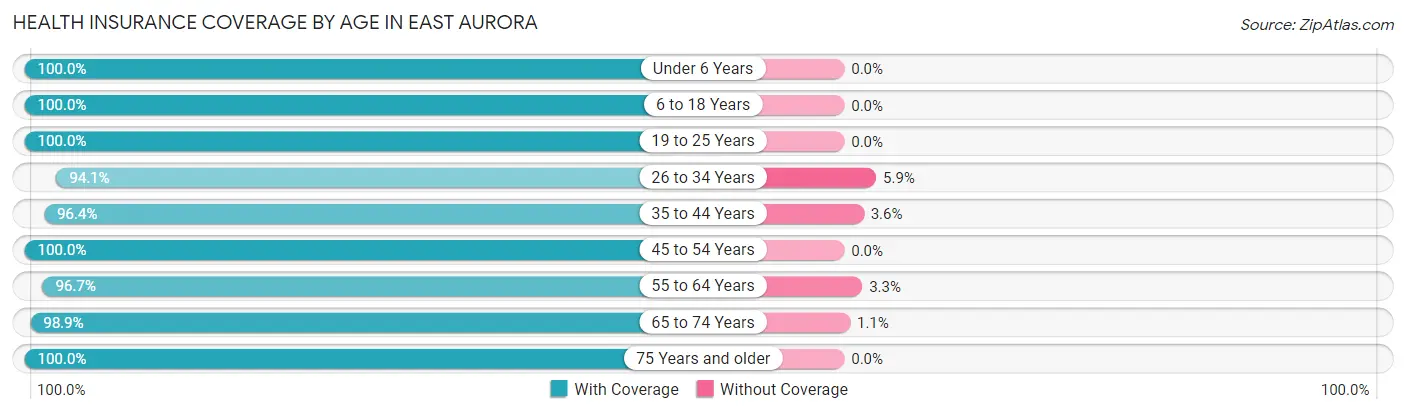
| Age Bracket | With Coverage | Without Coverage |
| Under 6 Years | 332 (100.0%) | 0 (0.0%) |
| 6 to 18 Years | 916 (100.0%) | 0 (0.0%) |
| 19 to 25 Years | 204 (100.0%) | 0 (0.0%) |
| 26 to 34 Years | 539 (94.1%) | 34 (5.9%) |
| 35 to 44 Years | 612 (96.4%) | 23 (3.6%) |
| 45 to 54 Years | 731 (100.0%) | 0 (0.0%) |
| 55 to 64 Years | 985 (96.7%) | 34 (3.3%) |
| 65 to 74 Years | 834 (98.9%) | 9 (1.1%) |
| 75 Years and older | 327 (100.0%) | 0 (0.0%) |
| Total | 5,480 (98.2%) | 100 (1.8%) |
Health Insurance Coverage by Citizenship Status in East Aurora
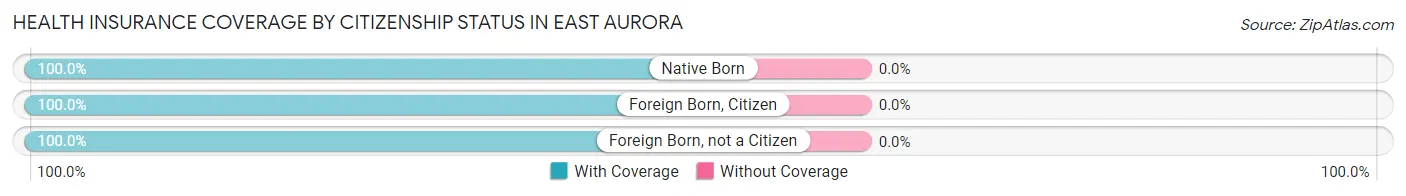
| Citizenship Status | With Coverage | Without Coverage |
| Native Born | 332 (100.0%) | 0 (0.0%) |
| Foreign Born, Citizen | 916 (100.0%) | 0 (0.0%) |
| Foreign Born, not a Citizen | 204 (100.0%) | 0 (0.0%) |
Health Insurance Coverage by Household Income in East Aurora
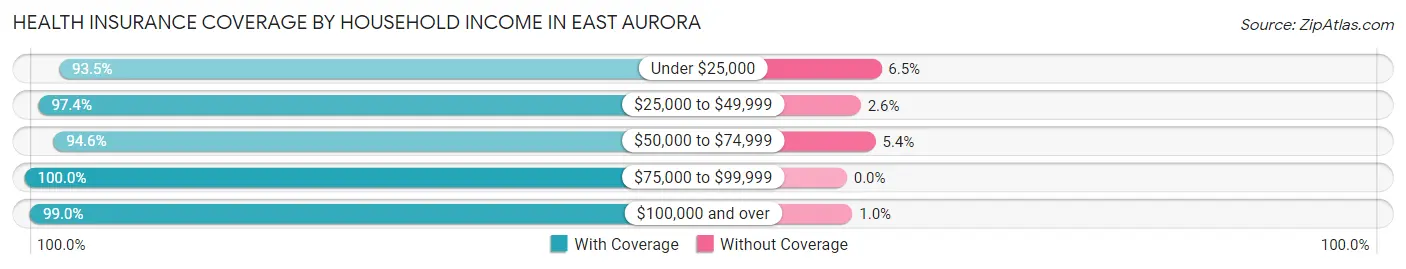
| Household Income | With Coverage | Without Coverage |
| Under $25,000 | 130 (93.5%) | 9 (6.5%) |
| $25,000 to $49,999 | 598 (97.4%) | 16 (2.6%) |
| $50,000 to $74,999 | 756 (94.6%) | 43 (5.4%) |
| $75,000 to $99,999 | 903 (100.0%) | 0 (0.0%) |
| $100,000 and over | 3,051 (99.0%) | 32 (1.0%) |
Public vs Private Health Insurance Coverage by Age in East Aurora
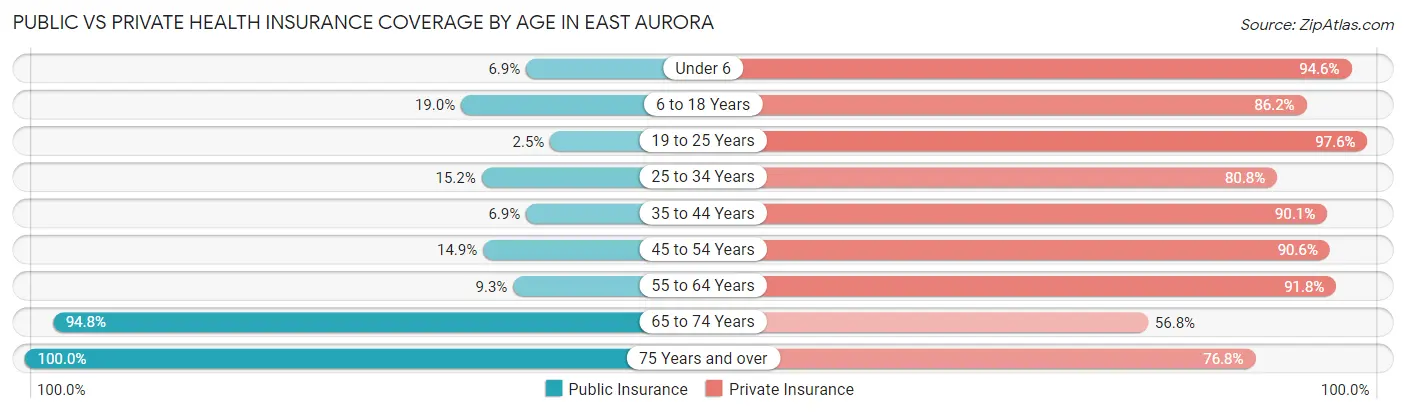
| Age Bracket | Public Insurance | Private Insurance |
| Under 6 | 23 (6.9%) | 314 (94.6%) |
| 6 to 18 Years | 174 (19.0%) | 790 (86.2%) |
| 19 to 25 Years | 5 (2.5%) | 199 (97.6%) |
| 25 to 34 Years | 87 (15.2%) | 463 (80.8%) |
| 35 to 44 Years | 44 (6.9%) | 572 (90.1%) |
| 45 to 54 Years | 109 (14.9%) | 662 (90.6%) |
| 55 to 64 Years | 95 (9.3%) | 935 (91.8%) |
| 65 to 74 Years | 799 (94.8%) | 479 (56.8%) |
| 75 Years and over | 327 (100.0%) | 251 (76.8%) |
| Total | 1,663 (29.8%) | 4,665 (83.6%) |
Disability Status by Sex by Age in East Aurora
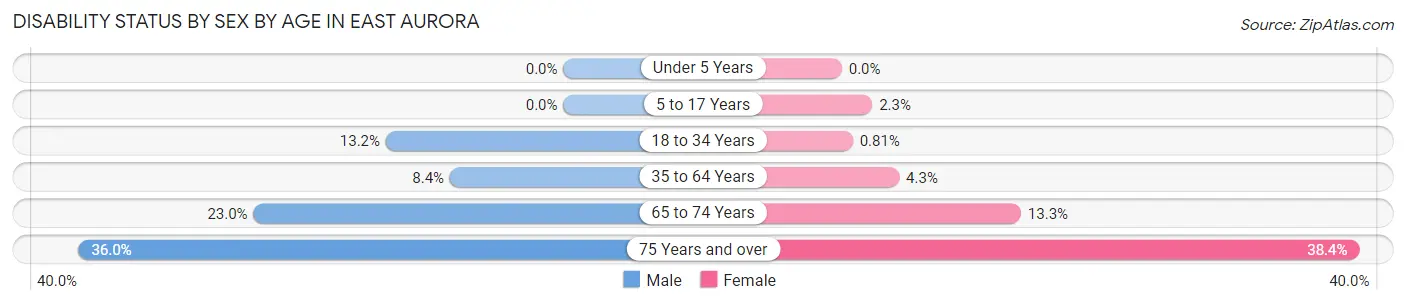
| Age Bracket | Male | Female |
| Under 5 Years | 0 (0.0%) | 0 (0.0%) |
| 5 to 17 Years | 0 (0.0%) | 9 (2.3%) |
| 18 to 34 Years | 58 (13.2%) | 3 (0.8%) |
| 35 to 64 Years | 100 (8.4%) | 51 (4.3%) |
| 65 to 74 Years | 104 (23.0%) | 52 (13.3%) |
| 75 Years and over | 54 (36.0%) | 68 (38.4%) |
Disability Class by Sex by Age in East Aurora
Disability Class: Hearing Difficulty
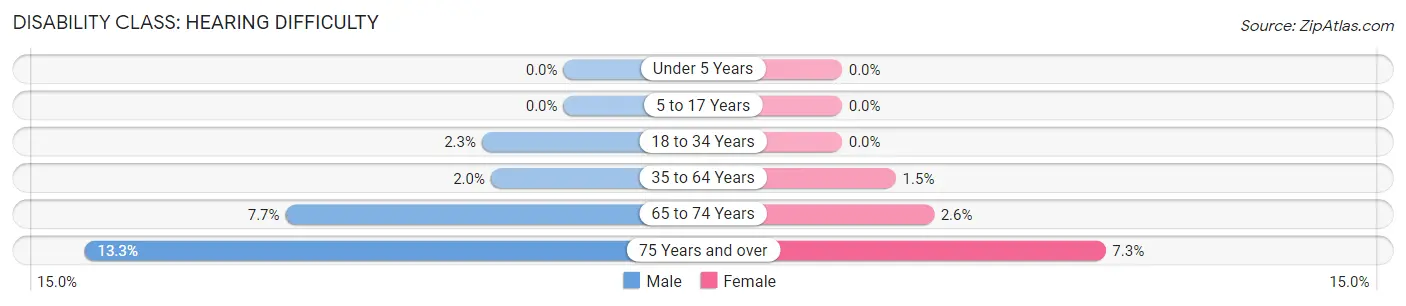
| Age Bracket | Male | Female |
| Under 5 Years | 0 (0.0%) | 0 (0.0%) |
| 5 to 17 Years | 0 (0.0%) | 0 (0.0%) |
| 18 to 34 Years | 10 (2.3%) | 0 (0.0%) |
| 35 to 64 Years | 24 (2.0%) | 18 (1.5%) |
| 65 to 74 Years | 35 (7.7%) | 10 (2.6%) |
| 75 Years and over | 20 (13.3%) | 13 (7.3%) |
Disability Class: Vision Difficulty
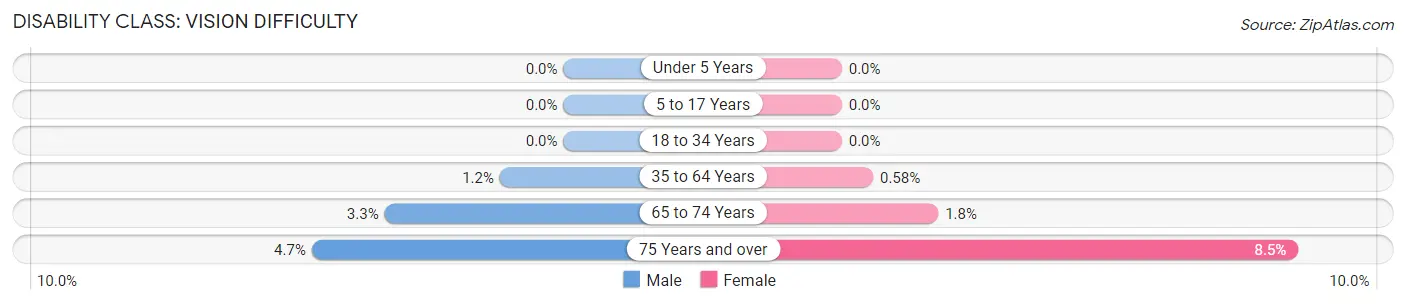
| Age Bracket | Male | Female |
| Under 5 Years | 0 (0.0%) | 0 (0.0%) |
| 5 to 17 Years | 0 (0.0%) | 0 (0.0%) |
| 18 to 34 Years | 0 (0.0%) | 0 (0.0%) |
| 35 to 64 Years | 14 (1.2%) | 7 (0.6%) |
| 65 to 74 Years | 15 (3.3%) | 7 (1.8%) |
| 75 Years and over | 7 (4.7%) | 15 (8.5%) |
Disability Class: Cognitive Difficulty
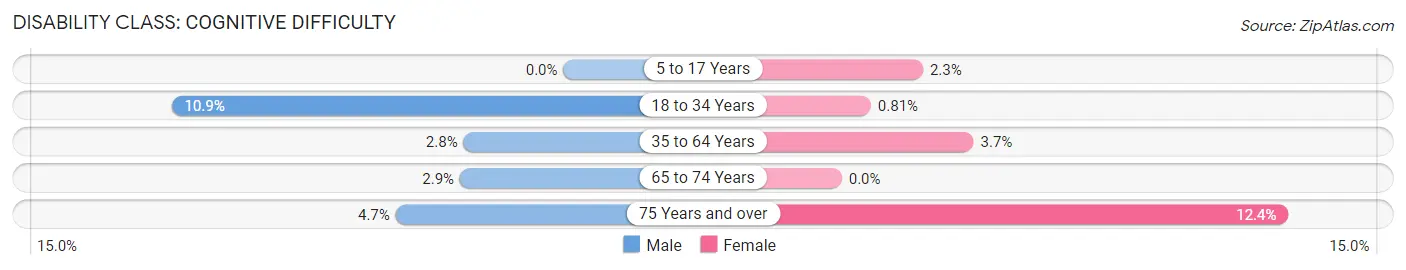
| Age Bracket | Male | Female |
| 5 to 17 Years | 0 (0.0%) | 9 (2.3%) |
| 18 to 34 Years | 48 (10.9%) | 3 (0.8%) |
| 35 to 64 Years | 33 (2.8%) | 44 (3.7%) |
| 65 to 74 Years | 13 (2.9%) | 0 (0.0%) |
| 75 Years and over | 7 (4.7%) | 22 (12.4%) |
Disability Class: Ambulatory Difficulty
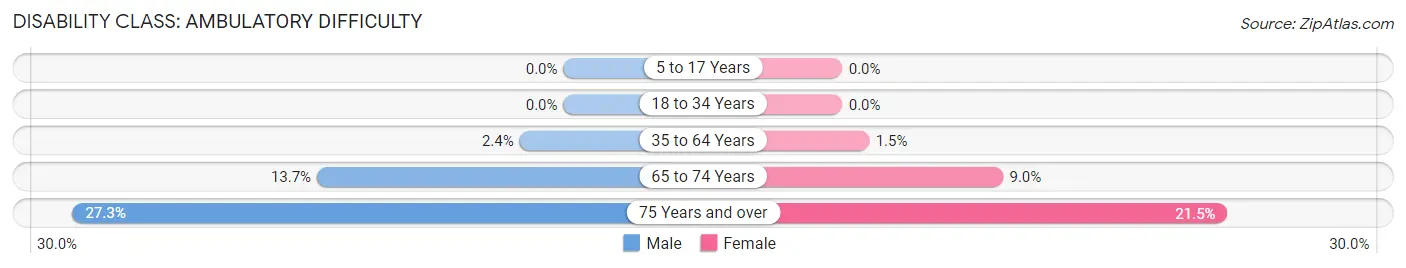
| Age Bracket | Male | Female |
| 5 to 17 Years | 0 (0.0%) | 0 (0.0%) |
| 18 to 34 Years | 0 (0.0%) | 0 (0.0%) |
| 35 to 64 Years | 29 (2.4%) | 18 (1.5%) |
| 65 to 74 Years | 62 (13.7%) | 35 (8.9%) |
| 75 Years and over | 41 (27.3%) | 38 (21.5%) |
Disability Class: Self-Care Difficulty
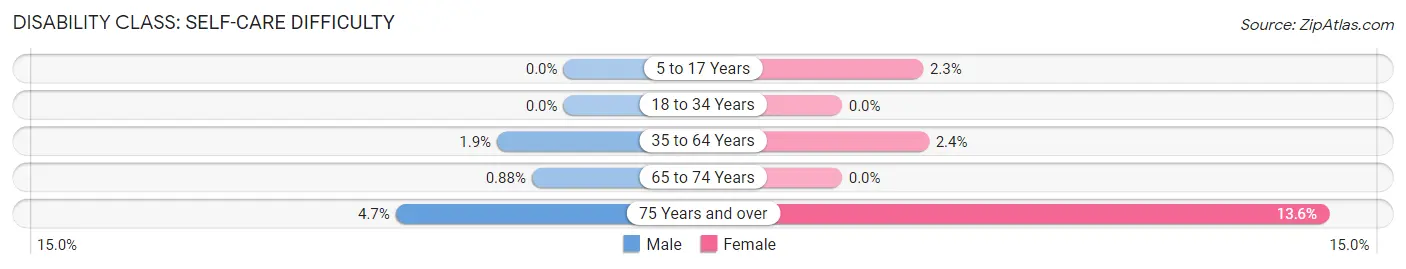
| Age Bracket | Male | Female |
| 5 to 17 Years | 0 (0.0%) | 9 (2.3%) |
| 18 to 34 Years | 0 (0.0%) | 0 (0.0%) |
| 35 to 64 Years | 22 (1.8%) | 29 (2.4%) |
| 65 to 74 Years | 4 (0.9%) | 0 (0.0%) |
| 75 Years and over | 7 (4.7%) | 24 (13.6%) |
Technology Access in East Aurora
Computing Device Access in East Aurora
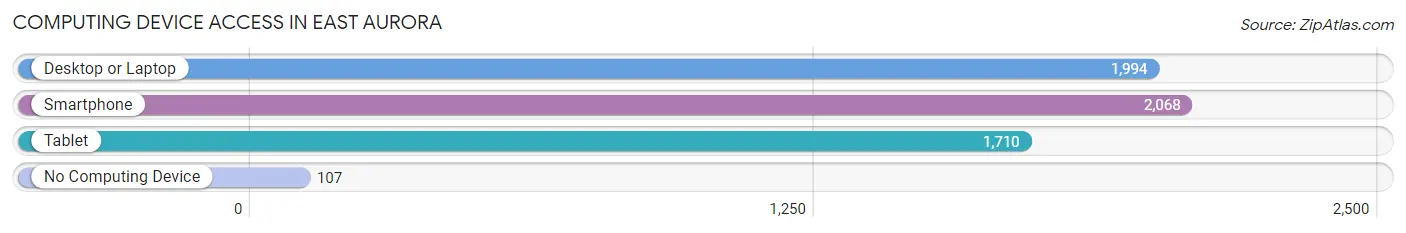
| Device Type | # Households | % Households |
| Desktop or Laptop | 1,994 | 83.5% |
| Smartphone | 2,068 | 86.6% |
| Tablet | 1,710 | 71.6% |
| No Computing Device | 107 | 4.5% |
| Total | 2,387 | 100.0% |
Internet Access in East Aurora
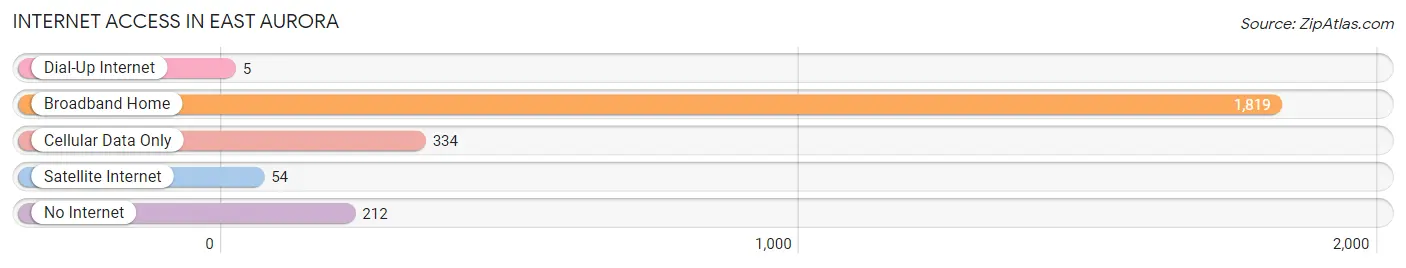
| Internet Type | # Households | % Households |
| Dial-Up Internet | 5 | 0.2% |
| Broadband Home | 1,819 | 76.2% |
| Cellular Data Only | 334 | 14.0% |
| Satellite Internet | 54 | 2.3% |
| No Internet | 212 | 8.9% |
| Total | 2,387 | 100.0% |
East Aurora Summary
History
East Aurora, New York is a small village located in the town of Aurora, in Erie County, New York. The village is located about 20 miles southeast of Buffalo, and is part of the Buffalo-Niagara Falls metropolitan area. The village was founded in 1804 by Joseph Ellicott, a surveyor for the Holland Land Company. Ellicott named the village after Aurora, the Roman goddess of the dawn.
The village was originally a farming community, but in the late 19th century, it began to develop into an industrial center. The first industry to locate in East Aurora was the Aurora Iron Works, which opened in 1851. The iron works was followed by a number of other factories, including the Aurora Knitting Mill, the Aurora Chair Company, and the Aurora Carriage Works.
In the early 20th century, East Aurora became a popular tourist destination. The village was home to a number of resorts, including the Aurora Inn, the Hotel East Aurora, and the Hotel Aurora. The village also became a popular destination for artists, writers, and musicians, including the famous painter Georgia O’Keeffe, who lived in East Aurora for a time.
In the late 20th century, East Aurora began to experience a decline in its industrial base. Many of the factories that had been the backbone of the village’s economy closed, and the village’s population began to decline. In recent years, however, the village has experienced a resurgence, as new businesses have moved into the area and the village has become a popular destination for tourists and artists.
Geography
East Aurora is located in the town of Aurora, in Erie County, New York. The village is located about 20 miles southeast of Buffalo, and is part of the Buffalo-Niagara Falls metropolitan area. The village is situated on the eastern edge of the Niagara Escarpment, a ridge of land that runs from the Niagara River to Lake Ontario.
The village is bordered to the north by the town of Elma, to the east by the town of Wales, to the south by the town of Holland, and to the west by the town of Orchard Park. The village is located on the banks of Cazenovia Creek, which flows through the village and empties into Cazenovia Lake.
Economy
East Aurora’s economy is largely based on tourism and retail. The village is home to a number of popular tourist attractions, including the Roycroft Campus, a National Historic Landmark that was once home to a community of artisans and craftsmen. The village is also home to the Aurora Historical Society, which operates a museum and library dedicated to the history of the village.
The village is also home to a number of retail stores, including the East Aurora Co-op, a grocery store that has been in operation since 1891. The village is also home to a number of restaurants, cafes, and bars, as well as a number of art galleries and antique shops.
Demographics
As of the 2010 census, the village of East Aurora had a population of 6,236. The population was spread out, with 25.3% under the age of 18, 8.2% from 18 to 24, 28.2% from 25 to 44, 24.2% from 45 to 64, and 14.1% who were 65 years of age or older. The median age was 38.7 years.
The median income for a household in the village was $50,945, and the median income for a family was $62,917. The per capita income for the village was $25,945. About 6.2% of families and 8.3% of the population were below the poverty line, including 10.2% of those under age 18 and 4.2% of those age 65 or over.
Common Questions
What is Per Capita Income in East Aurora?
Per Capita income in East Aurora is $50,396.
What is the Median Family Income in East Aurora?
Median Family Income in East Aurora is $122,833.
What is the Median Household income in East Aurora?
Median Household Income in East Aurora is $95,216.
What is Income or Wage Gap in East Aurora?
Income or Wage Gap in East Aurora is 42.9%.
Women in East Aurora earn 57.1 cents for every dollar earned by a man.
What is Inequality or Gini Index in East Aurora?
Inequality or Gini Index in East Aurora is 0.38.
What is the Total Population of East Aurora?
Total Population of East Aurora is 5,996.
What is the Total Male Population of East Aurora?
Total Male Population of East Aurora is 3,103.
What is the Total Female Population of East Aurora?
Total Female Population of East Aurora is 2,893.
What is the Ratio of Males per 100 Females in East Aurora?
There are 107.26 Males per 100 Females in East Aurora.
What is the Ratio of Females per 100 Males in East Aurora?
There are 93.23 Females per 100 Males in East Aurora.
What is the Median Population Age in East Aurora?
Median Population Age in East Aurora is 49.7 Years.
What is the Average Family Size in East Aurora
Average Family Size in East Aurora is 2.9 People.
What is the Average Household Size in East Aurora
Average Household Size in East Aurora is 2.3 People.
How Large is the Labor Force in East Aurora?
There are 3,007 People in the Labor Forcein in East Aurora.
What is the Percentage of People in the Labor Force in East Aurora?
61.0% of People are in the Labor Force in East Aurora.
What is the Unemployment Rate in East Aurora?
Unemployment Rate in East Aurora is 3.9%.