Trumansburg, NY Map & Demographics
Trumansburg Map
Trumansburg Overview
$44,209
PER CAPITA INCOME
$93,438
AVG FAMILY INCOME
$68,309
AVG HOUSEHOLD INCOME
14.9%
WAGE / INCOME GAP [ % ]
85.1¢/ $1
WAGE / INCOME GAP [ $ ]
0.43
INEQUALITY / GINI INDEX
1,485
TOTAL POPULATION
614
MALE POPULATION
871
FEMALE POPULATION
70.49
MALES / 100 FEMALES
141.86
FEMALES / 100 MALES
50.7
MEDIAN AGE
2.6
AVG FAMILY SIZE
2.0
AVG HOUSEHOLD SIZE
659
LABOR FORCE [ PEOPLE ]
53.8%
PERCENT IN LABOR FORCE
3.6%
UNEMPLOYMENT RATE
Trumansburg Zip Codes
Trumansburg Area Codes
Income in Trumansburg
Income Overview in Trumansburg
Per Capita Income in Trumansburg is $44,209, while median incomes of families and households are $93,438 and $68,309 respectively.
| Characteristic | Number | Measure |
| Per Capita Income | 1,485 | $44,209 |
| Median Family Income | 426 | $93,438 |
| Mean Family Income | 426 | $113,116 |
| Median Household Income | 737 | $68,309 |
| Mean Household Income | 737 | $90,833 |
| Income Deficit | 426 | $0 |
| Wage / Income Gap (%) | 1,485 | 14.86% |
| Wage / Income Gap ($) | 1,485 | 85.14¢ per $1 |
| Gini / Inequality Index | 1,485 | 0.43 |
Earnings by Sex in Trumansburg
Average Earnings in Trumansburg are $47,467, $41,354 for men and $48,571 for women, a difference of 14.9%.
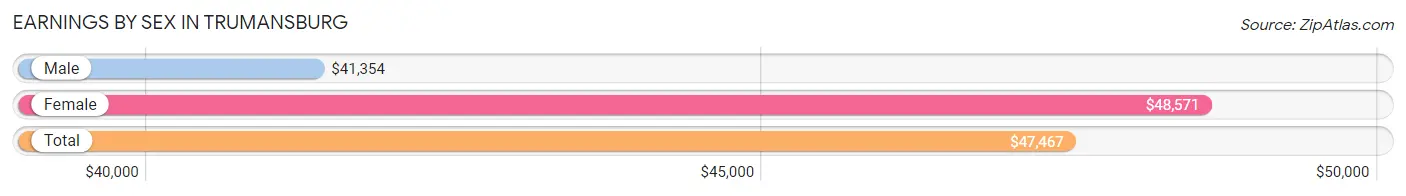
| Sex | Number | Average Earnings |
| Male | 343 (47.0%) | $41,354 |
| Female | 386 (52.9%) | $48,571 |
| Total | 729 (100.0%) | $47,467 |
Earnings by Sex by Income Bracket in Trumansburg
The most common earnings brackets in Trumansburg are $100,000+ for men (62 | 18.1%) and $75,000 to $99,999 for women (52 | 13.5%).
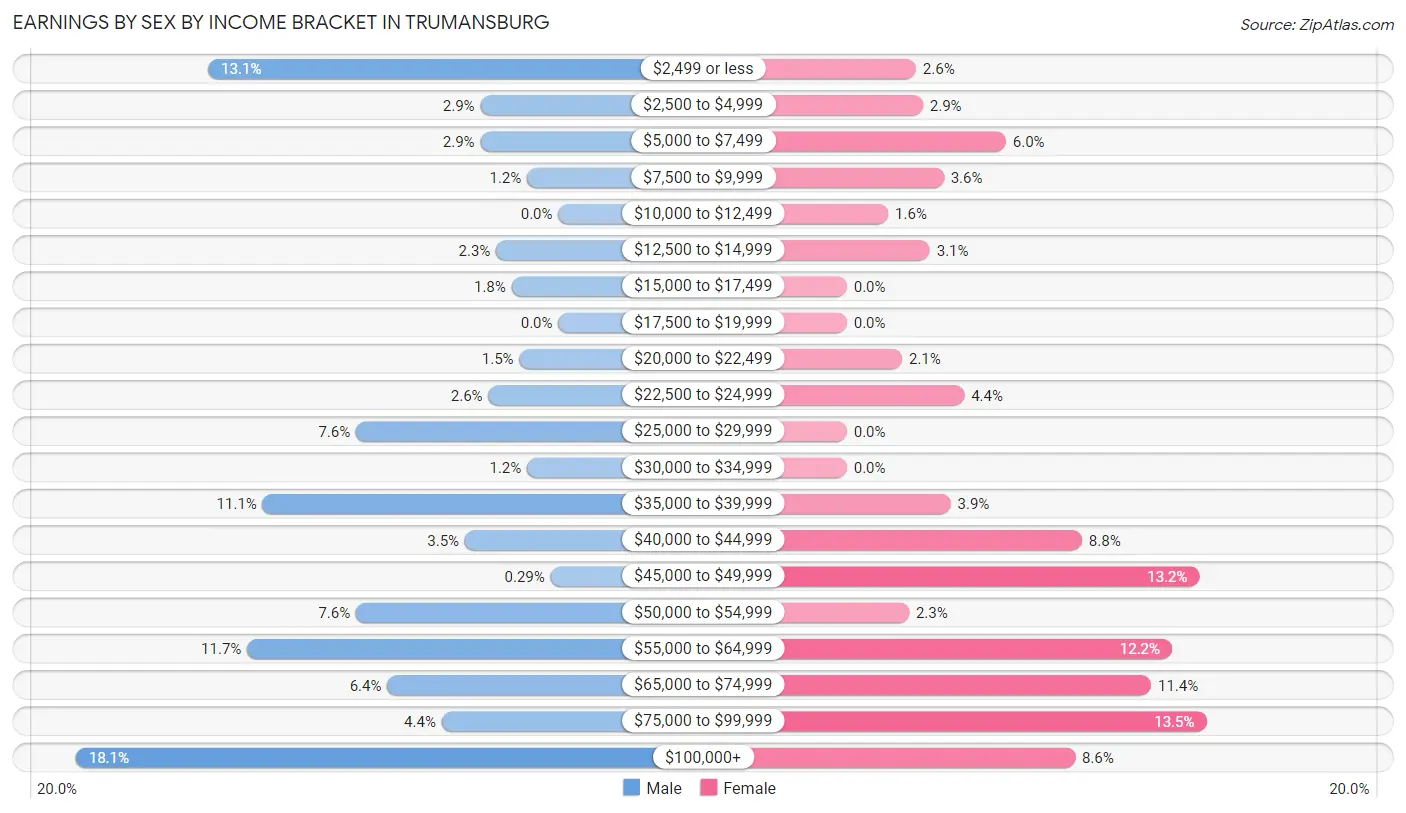
| Income | Male | Female |
| $2,499 or less | 45 (13.1%) | 10 (2.6%) |
| $2,500 to $4,999 | 10 (2.9%) | 11 (2.9%) |
| $5,000 to $7,499 | 10 (2.9%) | 23 (6.0%) |
| $7,500 to $9,999 | 4 (1.2%) | 14 (3.6%) |
| $10,000 to $12,499 | 0 (0.0%) | 6 (1.5%) |
| $12,500 to $14,999 | 8 (2.3%) | 12 (3.1%) |
| $15,000 to $17,499 | 6 (1.8%) | 0 (0.0%) |
| $17,500 to $19,999 | 0 (0.0%) | 0 (0.0%) |
| $20,000 to $22,499 | 5 (1.5%) | 8 (2.1%) |
| $22,500 to $24,999 | 9 (2.6%) | 17 (4.4%) |
| $25,000 to $29,999 | 26 (7.6%) | 0 (0.0%) |
| $30,000 to $34,999 | 4 (1.2%) | 0 (0.0%) |
| $35,000 to $39,999 | 38 (11.1%) | 15 (3.9%) |
| $40,000 to $44,999 | 12 (3.5%) | 34 (8.8%) |
| $45,000 to $49,999 | 1 (0.3%) | 51 (13.2%) |
| $50,000 to $54,999 | 26 (7.6%) | 9 (2.3%) |
| $55,000 to $64,999 | 40 (11.7%) | 47 (12.2%) |
| $65,000 to $74,999 | 22 (6.4%) | 44 (11.4%) |
| $75,000 to $99,999 | 15 (4.4%) | 52 (13.5%) |
| $100,000+ | 62 (18.1%) | 33 (8.6%) |
| Total | 343 (100.0%) | 386 (100.0%) |
Earnings by Sex by Educational Attainment in Trumansburg
Average earnings in Trumansburg are $55,000 for men and $49,018 for women, a difference of 10.9%. Men with an educational attainment of bachelor's degree enjoy the highest average annual earnings of $61,250, while those with high school diploma education earn the least with $35,000. Women with an educational attainment of graduate degree earn the most with the average annual earnings of $62,574, while those with high school diploma education have the smallest earnings of $38,654.
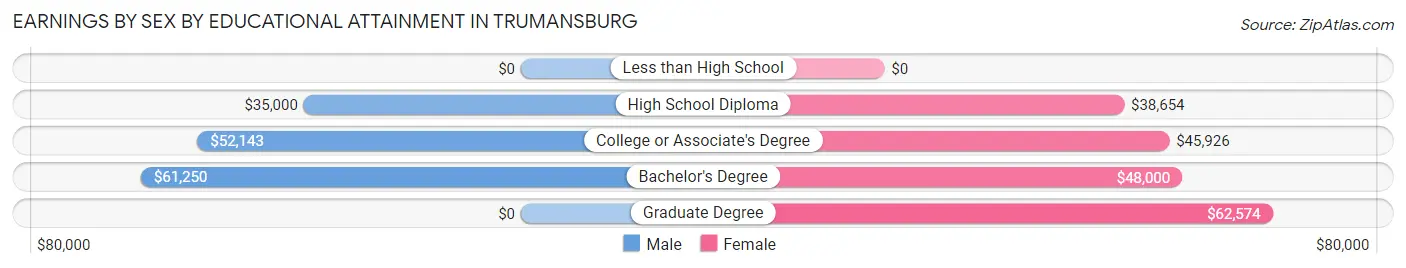
| Educational Attainment | Male Income | Female Income |
| Less than High School | - | - |
| High School Diploma | $35,000 | $38,654 |
| College or Associate's Degree | $52,143 | $45,926 |
| Bachelor's Degree | $61,250 | $48,000 |
| Graduate Degree | - | - |
| Total | $55,000 | $49,018 |
Family Income in Trumansburg
Family Income Brackets in Trumansburg
According to the Trumansburg family income data, there are 106 families falling into the $50,000 to $74,999 income range, which is the most common income bracket and makes up 24.9% of all families.
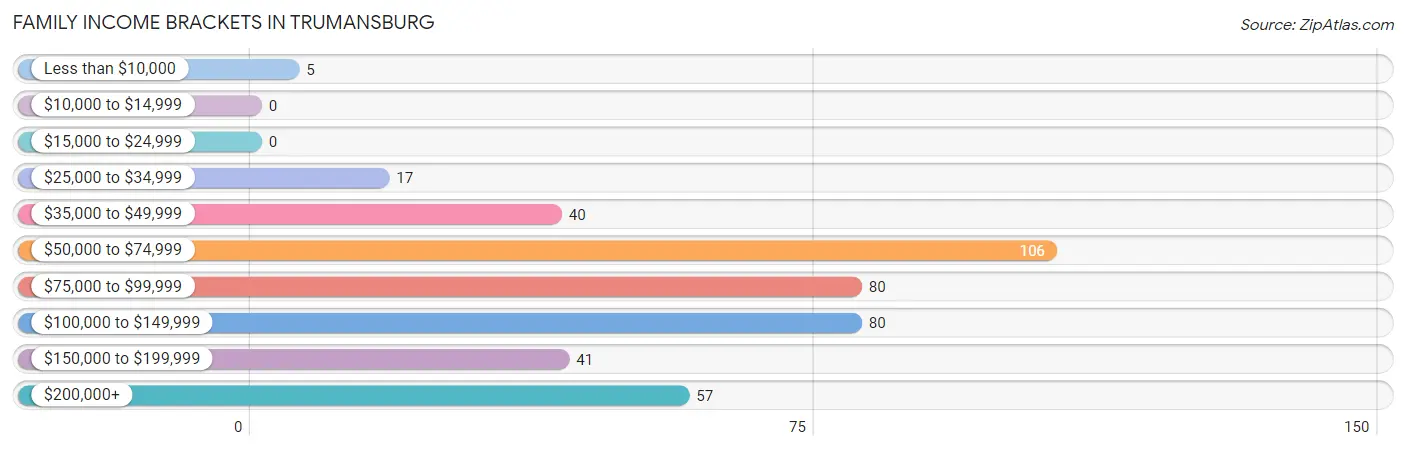
| Income Bracket | # Families | % Families |
| Less than $10,000 | 5 | 1.2% |
| $10,000 to $14,999 | 0 | 0.0% |
| $15,000 to $24,999 | 0 | 0.0% |
| $25,000 to $34,999 | 17 | 4.0% |
| $35,000 to $49,999 | 40 | 9.4% |
| $50,000 to $74,999 | 106 | 24.9% |
| $75,000 to $99,999 | 80 | 18.8% |
| $100,000 to $149,999 | 80 | 18.8% |
| $150,000 to $199,999 | 41 | 9.6% |
| $200,000+ | 57 | 13.4% |
Family Income by Famaliy Size in Trumansburg
5-person families (47 | 11.0%) account for the highest median family income in Trumansburg with $214,519 per family, while 5-person families (47 | 11.0%) have the highest median income of $42,904 per family member.
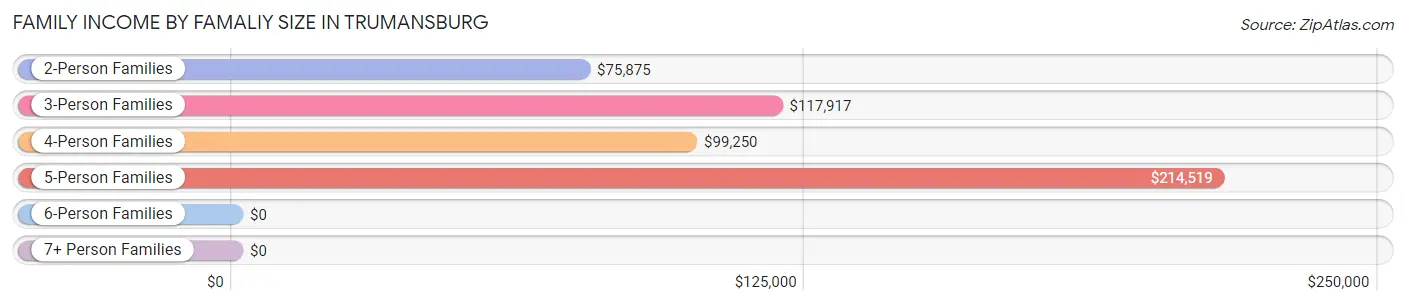
| Income Bracket | # Families | Median Income |
| 2-Person Families | 253 (59.4%) | $75,875 |
| 3-Person Families | 73 (17.1%) | $117,917 |
| 4-Person Families | 53 (12.4%) | $99,250 |
| 5-Person Families | 47 (11.0%) | $214,519 |
| 6-Person Families | 0 (0.0%) | $0 |
| 7+ Person Families | 0 (0.0%) | $0 |
| Total | 426 (100.0%) | $93,438 |
Family Income by Number of Earners in Trumansburg
The median family income in Trumansburg is $93,438, with families comprising 3+ earners (34) having the highest median family income of $160,000, while families with 1 earner (130) have the lowest median family income of $63,088, accounting for 8.0% and 30.5% of families, respectively.
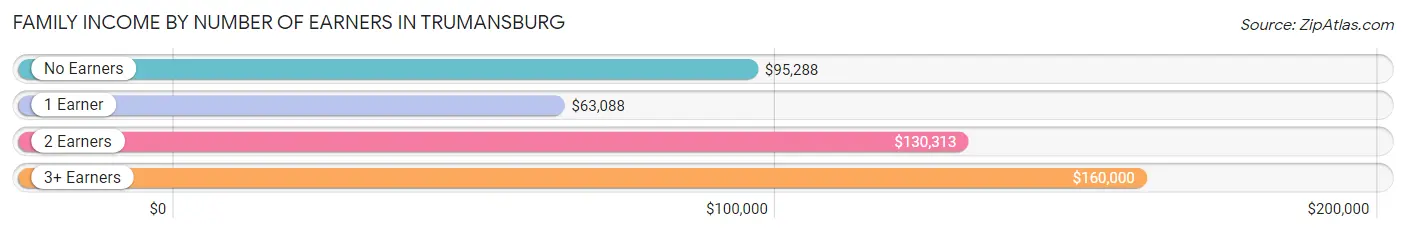
| Number of Earners | # Families | Median Income |
| No Earners | 99 (23.2%) | $95,288 |
| 1 Earner | 130 (30.5%) | $63,088 |
| 2 Earners | 163 (38.3%) | $130,313 |
| 3+ Earners | 34 (8.0%) | $160,000 |
| Total | 426 (100.0%) | $93,438 |
Household Income in Trumansburg
Household Income Brackets in Trumansburg
With 138 households falling in the category, the $50,000 to $74,999 income range is the most frequent in Trumansburg, accounting for 18.7% of all households. In contrast, only 35 households (4.8%) fall into the $15,000 to $24,999 income bracket, making it the least populous group.
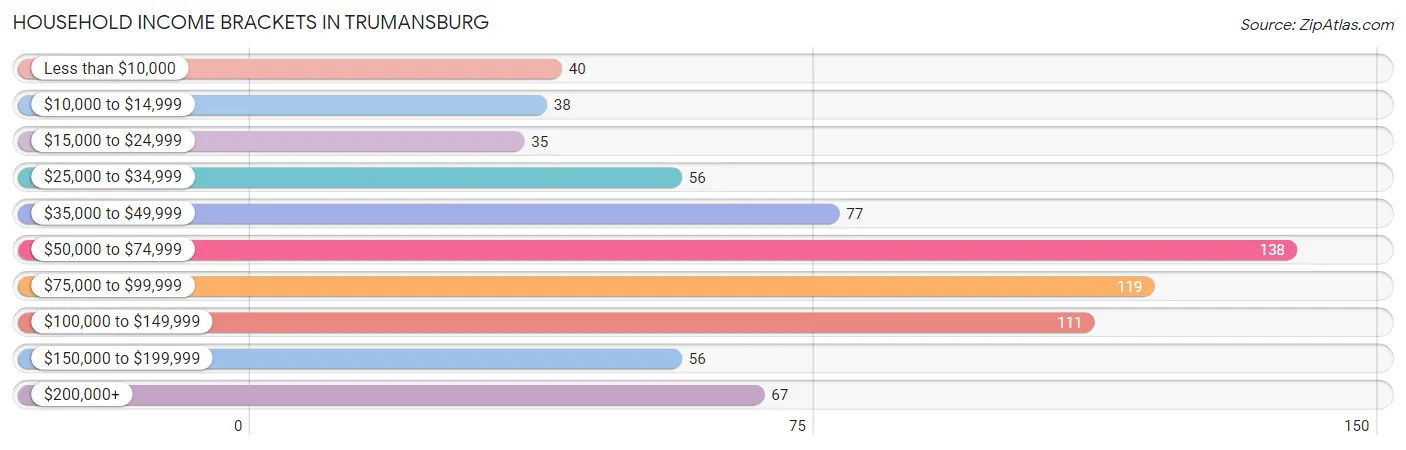
| Income Bracket | # Households | % Households |
| Less than $10,000 | 40 | 5.4% |
| $10,000 to $14,999 | 38 | 5.2% |
| $15,000 to $24,999 | 35 | 4.7% |
| $25,000 to $34,999 | 56 | 7.6% |
| $35,000 to $49,999 | 77 | 10.4% |
| $50,000 to $74,999 | 138 | 18.7% |
| $75,000 to $99,999 | 119 | 16.1% |
| $100,000 to $149,999 | 111 | 15.1% |
| $150,000 to $199,999 | 56 | 7.6% |
| $200,000+ | 67 | 9.1% |
Household Income by Householder Age in Trumansburg
The median household income in Trumansburg is $68,309, with the highest median household income of $83,250 found in the 25 to 44 years age bracket for the primary householder. A total of 121 households (16.4%) fall into this category. Meanwhile, the 15 to 24 years age bracket for the primary householder has the lowest median household income of $0, with 10 households (1.4%) in this group.
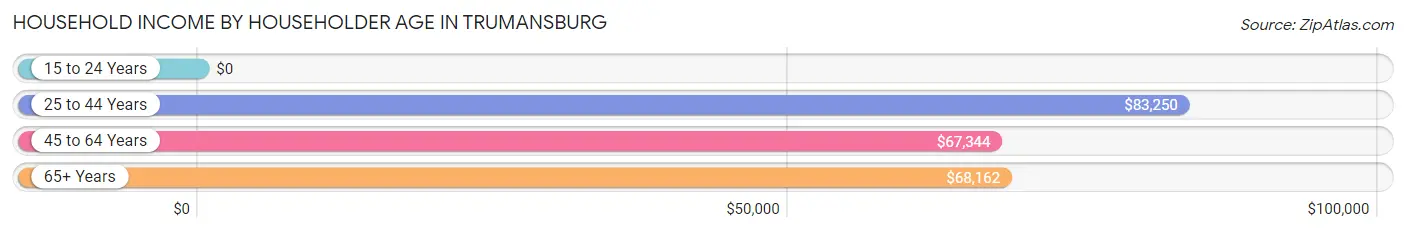
| Income Bracket | # Households | Median Income |
| 15 to 24 Years | 10 (1.4%) | $0 |
| 25 to 44 Years | 121 (16.4%) | $83,250 |
| 45 to 64 Years | 273 (37.0%) | $67,344 |
| 65+ Years | 333 (45.2%) | $68,162 |
| Total | 737 (100.0%) | $68,309 |
Poverty in Trumansburg
Income Below Poverty by Sex and Age in Trumansburg
With 7.2% poverty level for males and 10.0% for females among the residents of Trumansburg, 12 to 14 year old males and 25 to 34 year old females are the most vulnerable to poverty, with 6 males (75.0%) and 6 females (24.0%) in their respective age groups living below the poverty level.
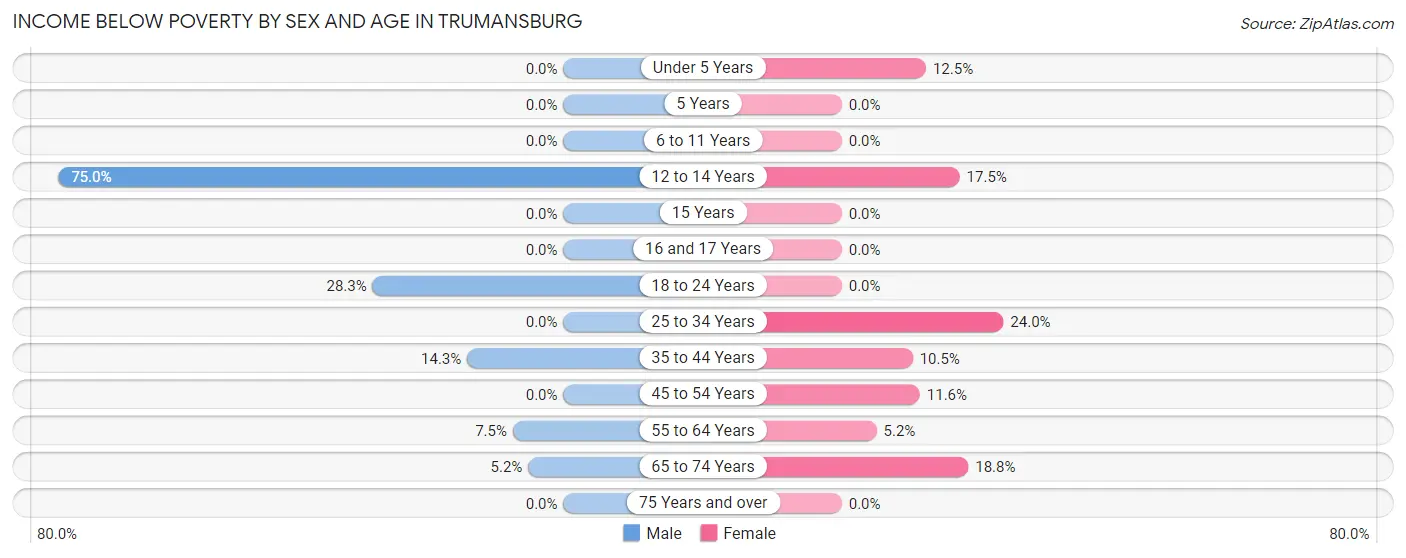
| Age Bracket | Male | Female |
| Under 5 Years | 0 (0.0%) | 6 (12.5%) |
| 5 Years | 0 (0.0%) | 0 (0.0%) |
| 6 to 11 Years | 0 (0.0%) | 0 (0.0%) |
| 12 to 14 Years | 6 (75.0%) | 7 (17.5%) |
| 15 Years | 0 (0.0%) | 0 (0.0%) |
| 16 and 17 Years | 0 (0.0%) | 0 (0.0%) |
| 18 to 24 Years | 17 (28.3%) | 0 (0.0%) |
| 25 to 34 Years | 0 (0.0%) | 6 (24.0%) |
| 35 to 44 Years | 8 (14.3%) | 12 (10.5%) |
| 45 to 54 Years | 0 (0.0%) | 16 (11.6%) |
| 55 to 64 Years | 6 (7.5%) | 6 (5.2%) |
| 65 to 74 Years | 7 (5.2%) | 34 (18.8%) |
| 75 Years and over | 0 (0.0%) | 0 (0.0%) |
| Total | 44 (7.2%) | 87 (10.0%) |
Income Above Poverty by Sex and Age in Trumansburg
According to the poverty statistics in Trumansburg, males aged under 5 years and females aged 5 years are the age groups that are most secure financially, with 100.0% of males and 100.0% of females in these age groups living above the poverty line.
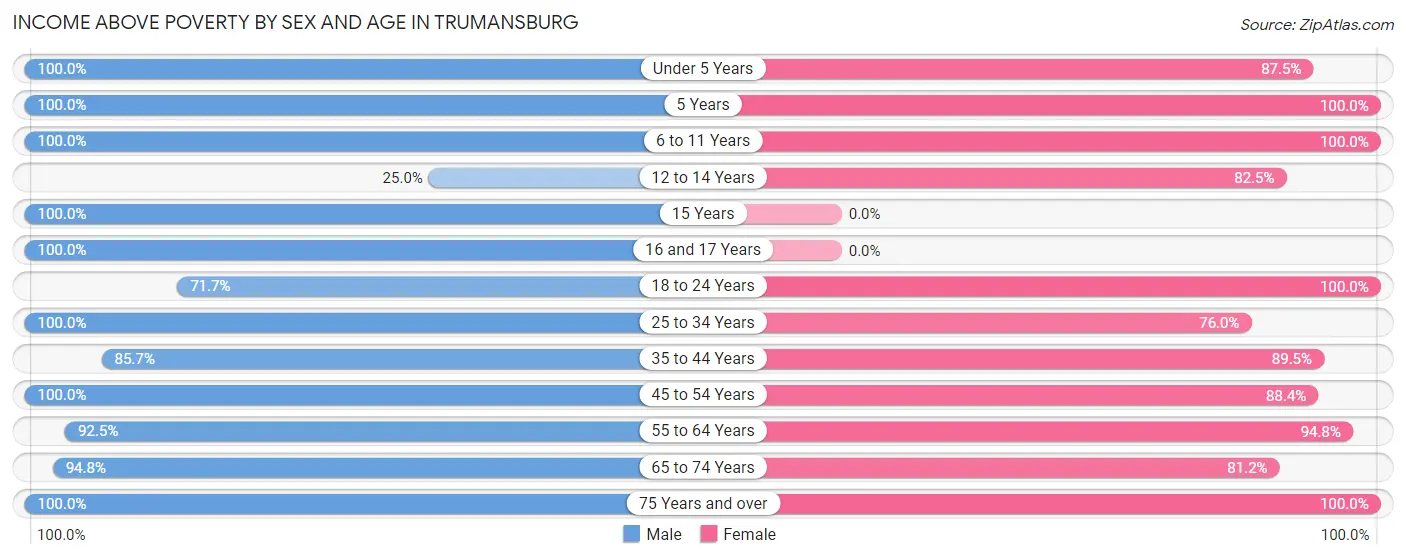
| Age Bracket | Male | Female |
| Under 5 Years | 11 (100.0%) | 42 (87.5%) |
| 5 Years | 14 (100.0%) | 6 (100.0%) |
| 6 to 11 Years | 55 (100.0%) | 74 (100.0%) |
| 12 to 14 Years | 2 (25.0%) | 33 (82.5%) |
| 15 Years | 4 (100.0%) | 0 (0.0%) |
| 16 and 17 Years | 8 (100.0%) | 0 (0.0%) |
| 18 to 24 Years | 43 (71.7%) | 18 (100.0%) |
| 25 to 34 Years | 29 (100.0%) | 19 (76.0%) |
| 35 to 44 Years | 48 (85.7%) | 102 (89.5%) |
| 45 to 54 Years | 111 (100.0%) | 122 (88.4%) |
| 55 to 64 Years | 74 (92.5%) | 110 (94.8%) |
| 65 to 74 Years | 127 (94.8%) | 147 (81.2%) |
| 75 Years and over | 44 (100.0%) | 111 (100.0%) |
| Total | 570 (92.8%) | 784 (90.0%) |
Income Below Poverty Among Married-Couple Families in Trumansburg
The poverty statistics for married-couple families in Trumansburg show that 2.2% or 7 of the total 312 families live below the poverty line. Families with 3 or 4 children have the highest poverty rate of 29.2%, comprising of 7 families. On the other hand, families with no children have the lowest poverty rate of 0.0%, which includes 0 families.
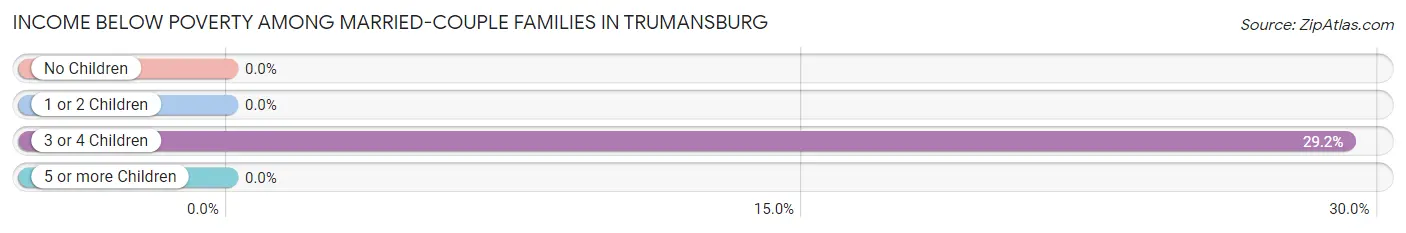
| Children | Above Poverty | Below Poverty |
| No Children | 180 (100.0%) | 0 (0.0%) |
| 1 or 2 Children | 108 (100.0%) | 0 (0.0%) |
| 3 or 4 Children | 17 (70.8%) | 7 (29.2%) |
| 5 or more Children | 0 (0.0%) | 0 (0.0%) |
| Total | 305 (97.8%) | 7 (2.2%) |
Income Below Poverty Among Single-Parent Households in Trumansburg
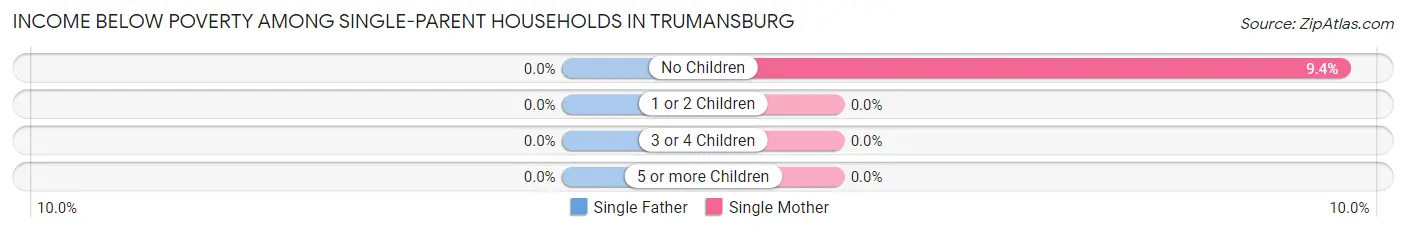
| Children | Single Father | Single Mother |
| No Children | 0 (0.0%) | 5 (9.4%) |
| 1 or 2 Children | 0 (0.0%) | 0 (0.0%) |
| 3 or 4 Children | 0 (0.0%) | 0 (0.0%) |
| 5 or more Children | 0 (0.0%) | 0 (0.0%) |
| Total | 0 (0.0%) | 5 (4.8%) |
Income Below Poverty Among Married-Couple vs Single-Parent Households in Trumansburg
The poverty data for Trumansburg shows that 7 of the married-couple family households (2.2%) and 5 of the single-parent households (4.4%) are living below the poverty level. Within the married-couple family households, those with 3 or 4 children have the highest poverty rate, with 7 households (29.2%) falling below the poverty line. Among the single-parent households, those with no children have the highest poverty rate, with 5 household (9.4%) living below poverty.
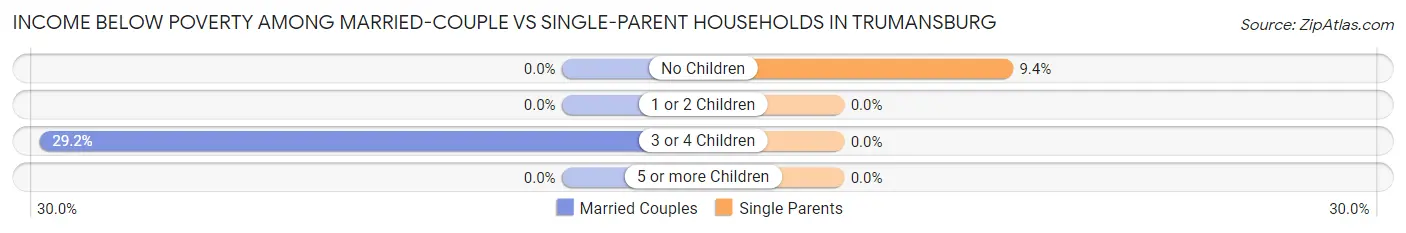
| Children | Married-Couple Families | Single-Parent Households |
| No Children | 0 (0.0%) | 5 (9.4%) |
| 1 or 2 Children | 0 (0.0%) | 0 (0.0%) |
| 3 or 4 Children | 7 (29.2%) | 0 (0.0%) |
| 5 or more Children | 0 (0.0%) | 0 (0.0%) |
| Total | 7 (2.2%) | 5 (4.4%) |
Race in Trumansburg
The most populous races in Trumansburg are White / Caucasian (1,433 | 96.5%), Two or more Races (22 | 1.5%), and Black / African American (17 | 1.1%).
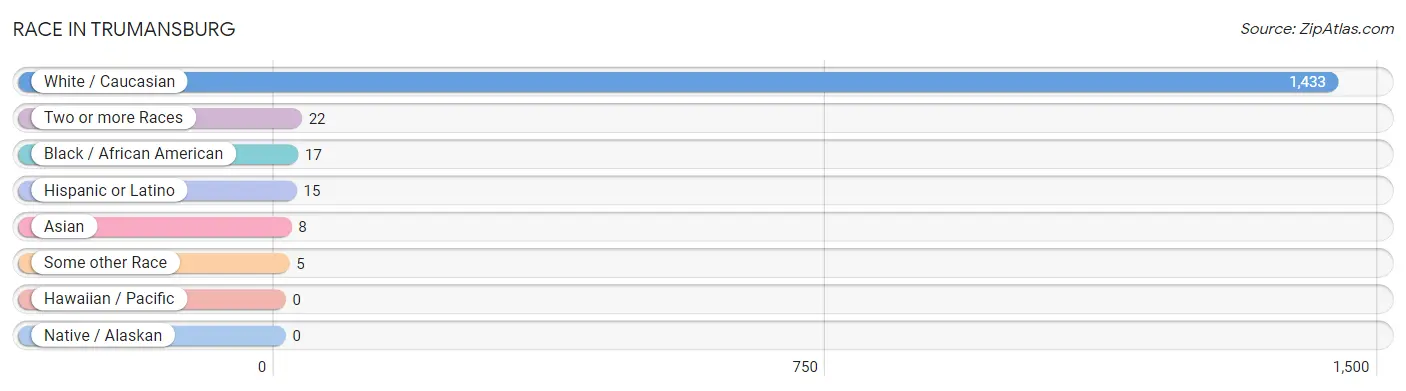
| Race | # Population | % Population |
| Asian | 8 | 0.5% |
| Black / African American | 17 | 1.1% |
| Hawaiian / Pacific | 0 | 0.0% |
| Hispanic or Latino | 15 | 1.0% |
| Native / Alaskan | 0 | 0.0% |
| White / Caucasian | 1,433 | 96.5% |
| Two or more Races | 22 | 1.5% |
| Some other Race | 5 | 0.3% |
| Total | 1,485 | 100.0% |
Ancestry in Trumansburg
The most populous ancestries reported in Trumansburg are Irish (346 | 23.3%), German (292 | 19.7%), English (271 | 18.2%), Italian (202 | 13.6%), and Scottish (116 | 7.8%), together accounting for 82.6% of all Trumansburg residents.
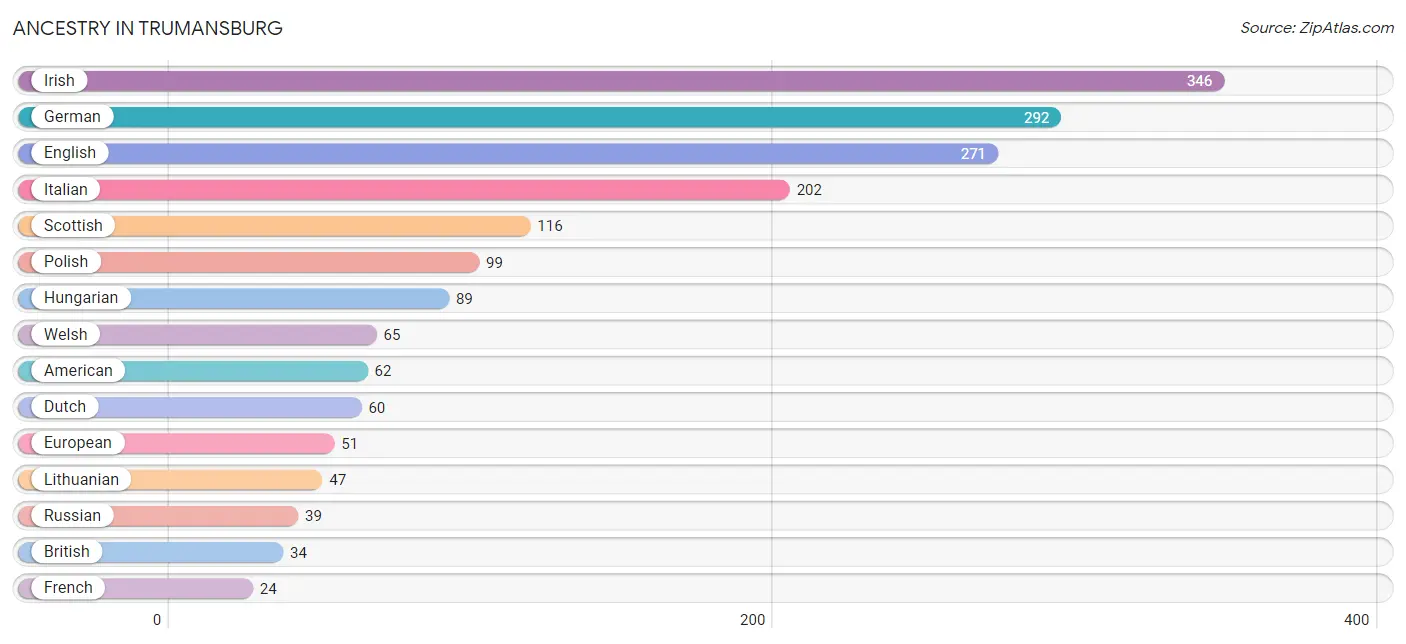
| Ancestry | # Population | % Population |
| African | 1 | 0.1% |
| American | 62 | 4.2% |
| Arab | 1 | 0.1% |
| Austrian | 8 | 0.5% |
| British | 34 | 2.3% |
| Carpatho Rusyn | 4 | 0.3% |
| Cherokee | 4 | 0.3% |
| Croatian | 5 | 0.3% |
| Czech | 11 | 0.7% |
| Czechoslovakian | 5 | 0.3% |
| Danish | 14 | 0.9% |
| Dutch | 60 | 4.0% |
| Eastern European | 9 | 0.6% |
| English | 271 | 18.2% |
| Estonian | 4 | 0.3% |
| European | 51 | 3.4% |
| Filipino | 8 | 0.5% |
| French | 24 | 1.6% |
| French Canadian | 8 | 0.5% |
| German | 292 | 19.7% |
| Hungarian | 89 | 6.0% |
| Irish | 346 | 23.3% |
| Italian | 202 | 13.6% |
| Lithuanian | 47 | 3.2% |
| Mexican | 15 | 1.0% |
| Northern European | 7 | 0.5% |
| Polish | 99 | 6.7% |
| Portuguese | 4 | 0.3% |
| Russian | 39 | 2.6% |
| Scottish | 116 | 7.8% |
| Slovak | 7 | 0.5% |
| Slovene | 5 | 0.3% |
| Subsaharan African | 1 | 0.1% |
| Swedish | 5 | 0.3% |
| Syrian | 1 | 0.1% |
| Ukrainian | 5 | 0.3% |
| Welsh | 65 | 4.4% | View All 37 Rows |
Immigrants in Trumansburg
The most numerous immigrant groups reported in Trumansburg came from Europe (20 | 1.3%), Northern Europe (18 | 1.2%), Asia (8 | 0.5%), China (8 | 0.5%), and Eastern Asia (8 | 0.5%), together accounting for 4.2% of all Trumansburg residents.
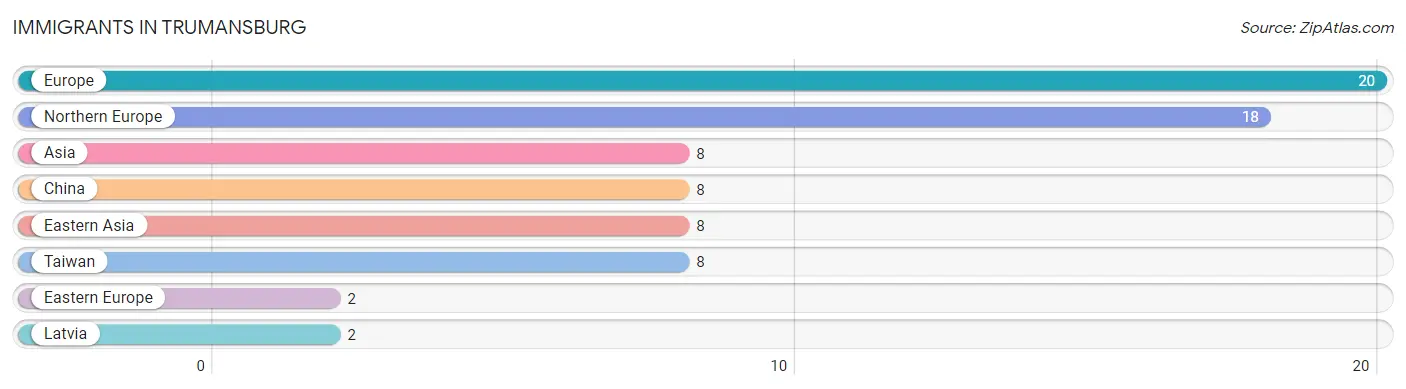
| Immigration Origin | # Population | % Population |
| Asia | 8 | 0.5% |
| China | 8 | 0.5% |
| Eastern Asia | 8 | 0.5% |
| Eastern Europe | 2 | 0.1% |
| Europe | 20 | 1.3% |
| Latvia | 2 | 0.1% |
| Northern Europe | 18 | 1.2% |
| Taiwan | 8 | 0.5% | View All 8 Rows |
Sex and Age in Trumansburg
Sex and Age in Trumansburg
The most populous age groups in Trumansburg are 70 to 74 Years (69 | 11.2%) for men and 65 to 69 Years (126 | 14.5%) for women.
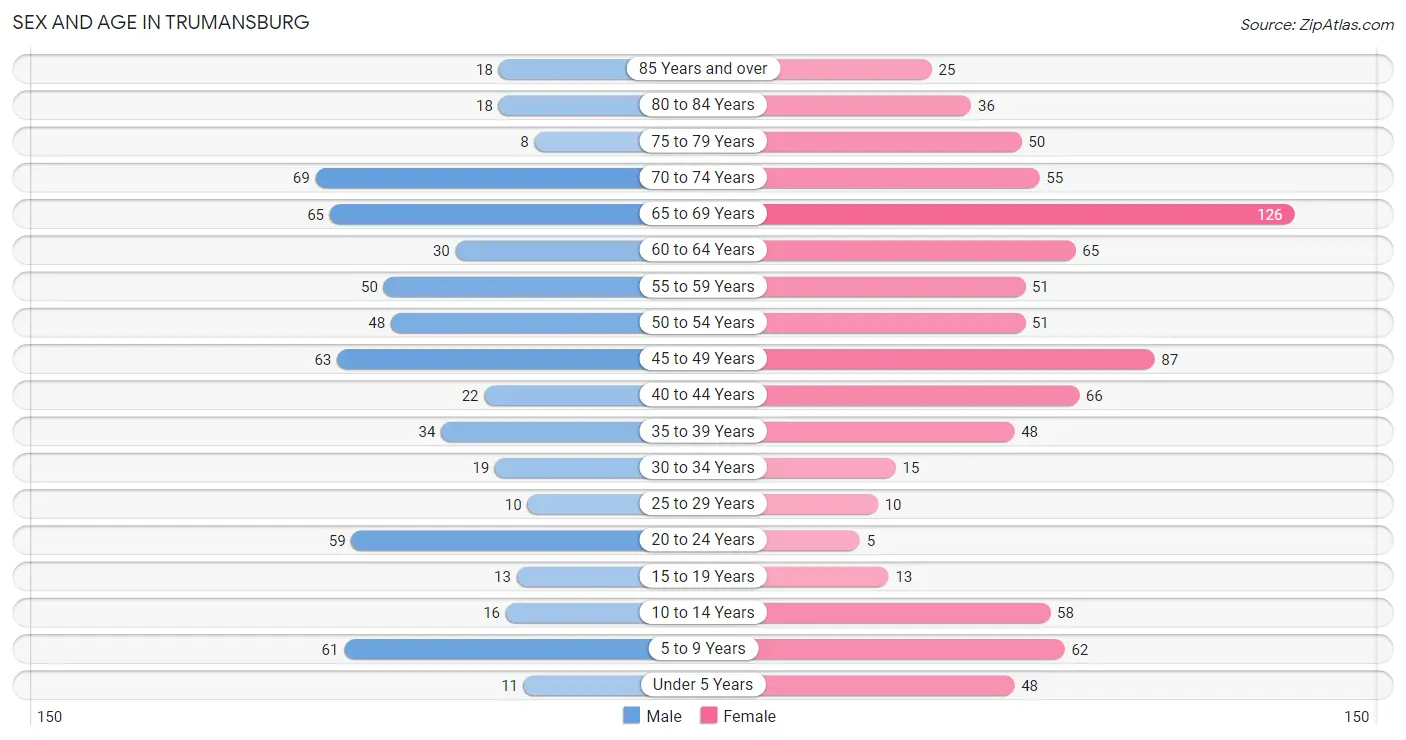
| Age Bracket | Male | Female |
| Under 5 Years | 11 (1.8%) | 48 (5.5%) |
| 5 to 9 Years | 61 (9.9%) | 62 (7.1%) |
| 10 to 14 Years | 16 (2.6%) | 58 (6.7%) |
| 15 to 19 Years | 13 (2.1%) | 13 (1.5%) |
| 20 to 24 Years | 59 (9.6%) | 5 (0.6%) |
| 25 to 29 Years | 10 (1.6%) | 10 (1.1%) |
| 30 to 34 Years | 19 (3.1%) | 15 (1.7%) |
| 35 to 39 Years | 34 (5.5%) | 48 (5.5%) |
| 40 to 44 Years | 22 (3.6%) | 66 (7.6%) |
| 45 to 49 Years | 63 (10.3%) | 87 (10.0%) |
| 50 to 54 Years | 48 (7.8%) | 51 (5.9%) |
| 55 to 59 Years | 50 (8.1%) | 51 (5.9%) |
| 60 to 64 Years | 30 (4.9%) | 65 (7.5%) |
| 65 to 69 Years | 65 (10.6%) | 126 (14.5%) |
| 70 to 74 Years | 69 (11.2%) | 55 (6.3%) |
| 75 to 79 Years | 8 (1.3%) | 50 (5.7%) |
| 80 to 84 Years | 18 (2.9%) | 36 (4.1%) |
| 85 Years and over | 18 (2.9%) | 25 (2.9%) |
| Total | 614 (100.0%) | 871 (100.0%) |
Families and Households in Trumansburg
Median Family Size in Trumansburg
The median family size in Trumansburg is 2.63 persons per family, with single male/father families (9 | 2.1%) accounting for the largest median family size of 3.22 persons per family. On the other hand, single female/mother families (105 | 24.6%) represent the smallest median family size with 2.26 persons per family.
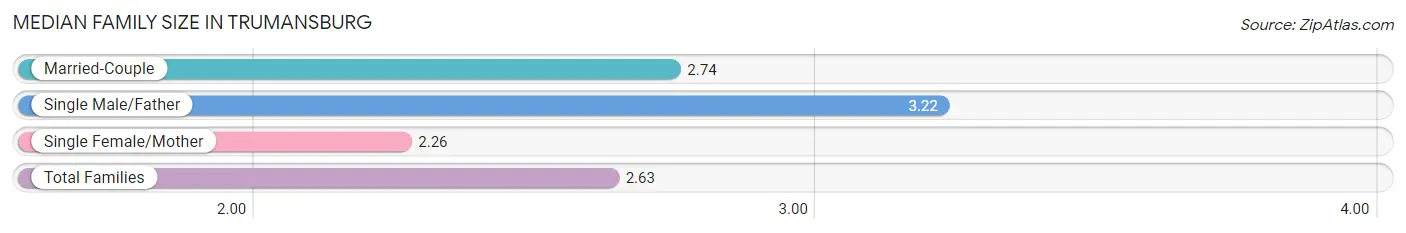
| Family Type | # Families | Family Size |
| Married-Couple | 312 (73.2%) | 2.74 |
| Single Male/Father | 9 (2.1%) | 3.22 |
| Single Female/Mother | 105 (24.6%) | 2.26 |
| Total Families | 426 (100.0%) | 2.63 |
Median Household Size in Trumansburg
The median household size in Trumansburg is 2.01 persons per household, with single male/father households (9 | 1.2%) accounting for the largest median household size of 3.22 persons per household. non-family households (311 | 42.2%) represent the smallest median household size with 1.13 persons per household.
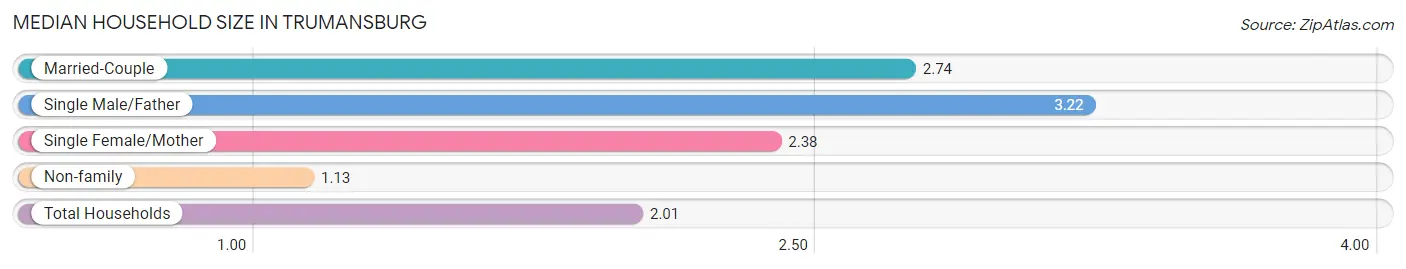
| Household Type | # Households | Household Size |
| Married-Couple | 312 (42.3%) | 2.74 |
| Single Male/Father | 9 (1.2%) | 3.22 |
| Single Female/Mother | 105 (14.2%) | 2.38 |
| Non-family | 311 (42.2%) | 1.13 |
| Total Households | 737 (100.0%) | 2.01 |
Household Size by Marriage Status in Trumansburg
Out of a total of 737 households in Trumansburg, 426 (57.8%) are family households, while 311 (42.2%) are nonfamily households. The most numerous type of family households are 2-person households, comprising 236, and the most common type of nonfamily households are 1-person households, comprising 263.
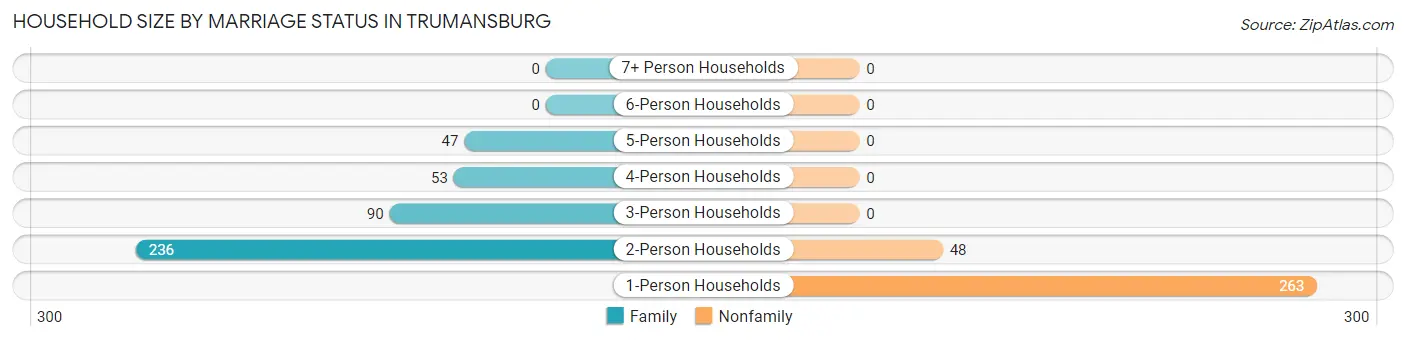
| Household Size | Family Households | Nonfamily Households |
| 1-Person Households | - | 263 (35.7%) |
| 2-Person Households | 236 (32.0%) | 48 (6.5%) |
| 3-Person Households | 90 (12.2%) | 0 (0.0%) |
| 4-Person Households | 53 (7.2%) | 0 (0.0%) |
| 5-Person Households | 47 (6.4%) | 0 (0.0%) |
| 6-Person Households | 0 (0.0%) | 0 (0.0%) |
| 7+ Person Households | 0 (0.0%) | 0 (0.0%) |
| Total | 426 (57.8%) | 311 (42.2%) |
Female Fertility in Trumansburg
Fertility by Age in Trumansburg
Average fertility rate in Trumansburg is 45.0 births per 1,000 women. Women in the age bracket of 20 to 34 years have the highest fertility rate with 167.0 births per 1,000 women. Women in the age bracket of 35 to 50 years acount for 58.3% of all women with births.
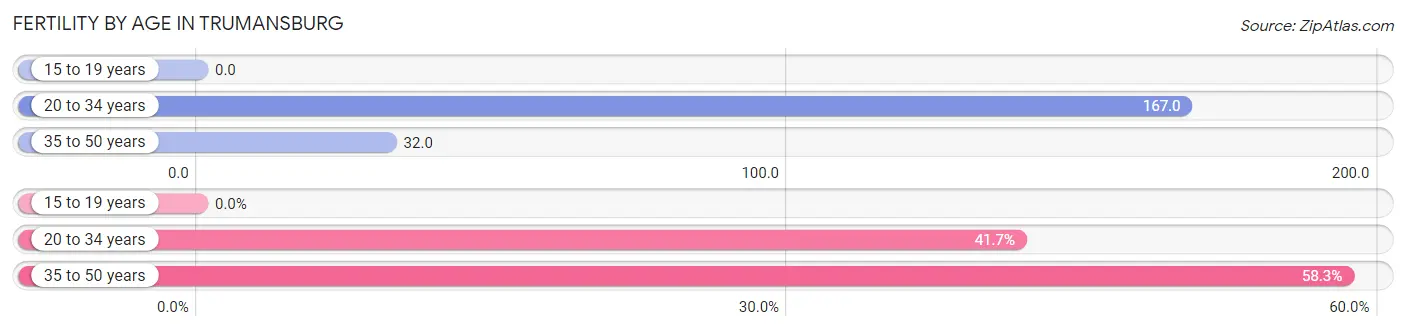
| Age Bracket | Women with Births | Births / 1,000 Women |
| 15 to 19 years | 0 (0.0%) | 0.0 |
| 20 to 34 years | 5 (41.7%) | 167.0 |
| 35 to 50 years | 7 (58.3%) | 32.0 |
| Total | 12 (100.0%) | 45.0 |
Fertility by Age by Marriage Status in Trumansburg
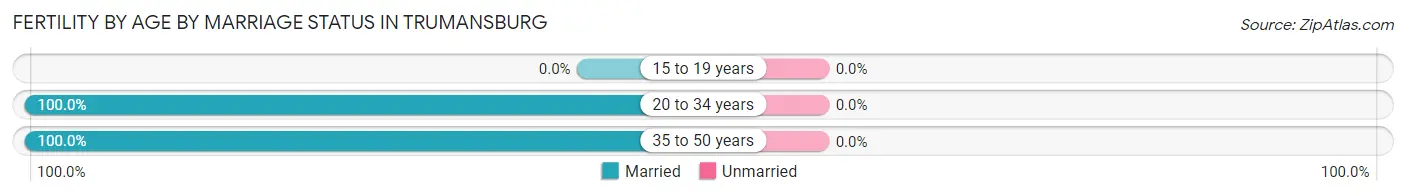
| Age Bracket | Married | Unmarried |
| 15 to 19 years | 0 (0.0%) | 0 (0.0%) |
| 20 to 34 years | 5 (100.0%) | 0 (0.0%) |
| 35 to 50 years | 7 (100.0%) | 0 (0.0%) |
| Total | 12 (100.0%) | 0 (0.0%) |
Fertility by Education in Trumansburg
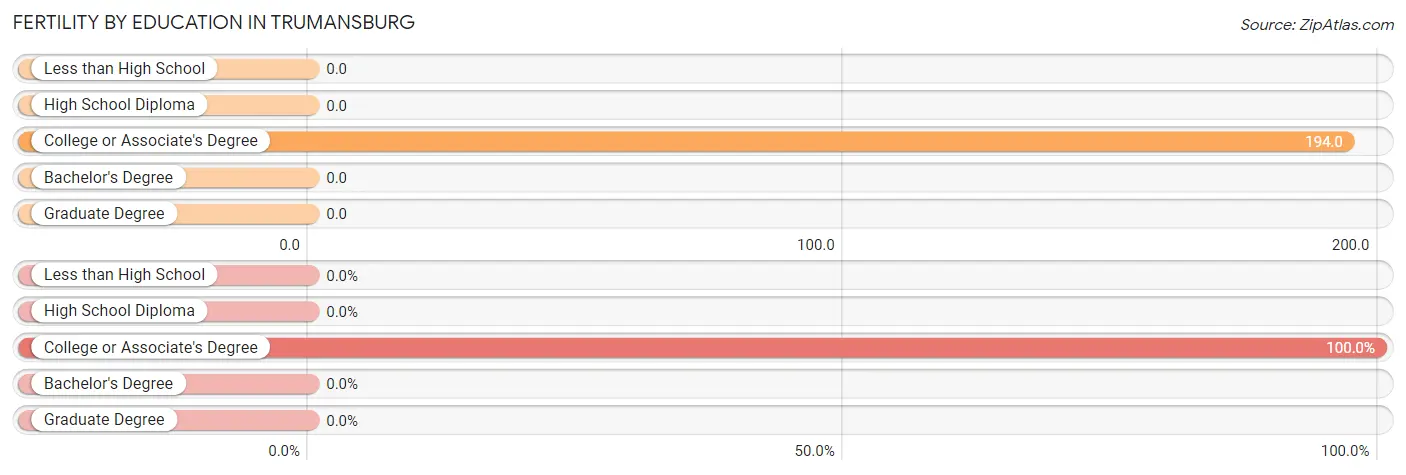
| Educational Attainment | Women with Births | Births / 1,000 Women |
| Less than High School | 0 (0.0%) | 0.0 |
| High School Diploma | 0 (0.0%) | 0.0 |
| College or Associate's Degree | 12 (100.0%) | 194.0 |
| Bachelor's Degree | 0 (0.0%) | 0.0 |
| Graduate Degree | 0 (0.0%) | 0.0 |
| Total | 12 (100.0%) | 45.0 |
Fertility by Education by Marriage Status in Trumansburg
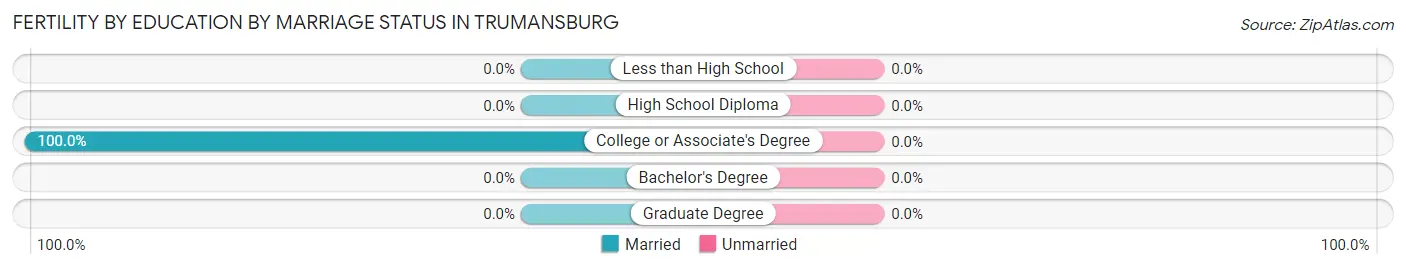
| Educational Attainment | Married | Unmarried |
| Less than High School | 0 (0.0%) | 0 (0.0%) |
| High School Diploma | 0 (0.0%) | 0 (0.0%) |
| College or Associate's Degree | 12 (100.0%) | 0 (0.0%) |
| Bachelor's Degree | 0 (0.0%) | 0 (0.0%) |
| Graduate Degree | 0 (0.0%) | 0 (0.0%) |
| Total | 12 (100.0%) | 0 (0.0%) |
Employment Characteristics in Trumansburg
Employment by Class of Employer in Trumansburg
Among the 626 employed individuals in Trumansburg, private company employees (224 | 35.8%), not-for-profit organizations (129 | 20.6%), and self-employed (not incorporated) (124 | 19.8%) make up the most common classes of employment.
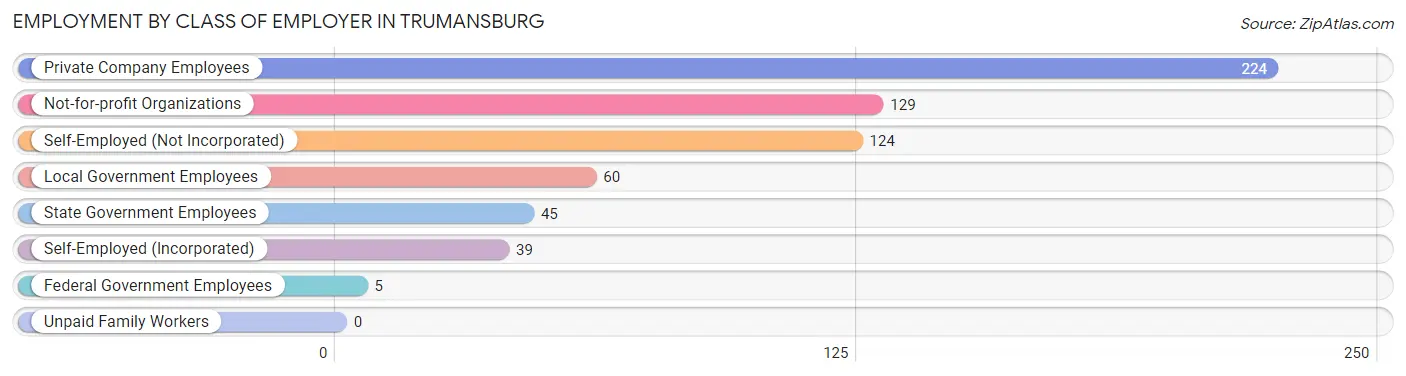
| Employer Class | # Employees | % Employees |
| Private Company Employees | 224 | 35.8% |
| Self-Employed (Incorporated) | 39 | 6.2% |
| Self-Employed (Not Incorporated) | 124 | 19.8% |
| Not-for-profit Organizations | 129 | 20.6% |
| Local Government Employees | 60 | 9.6% |
| State Government Employees | 45 | 7.2% |
| Federal Government Employees | 5 | 0.8% |
| Unpaid Family Workers | 0 | 0.0% |
| Total | 626 | 100.0% |
Employment Status by Age in Trumansburg
According to the labor force statistics for Trumansburg, out of the total population over 16 years of age (1,225), 53.8% or 659 individuals are in the labor force, with 3.6% or 24 of them unemployed. The age group with the highest labor force participation rate is 30 to 34 years, with 100.0% or 34 individuals in the labor force. Within the labor force, the 25 to 29 years age range has the highest percentage of unemployed individuals, with 25.0% or 4 of them being unemployed.
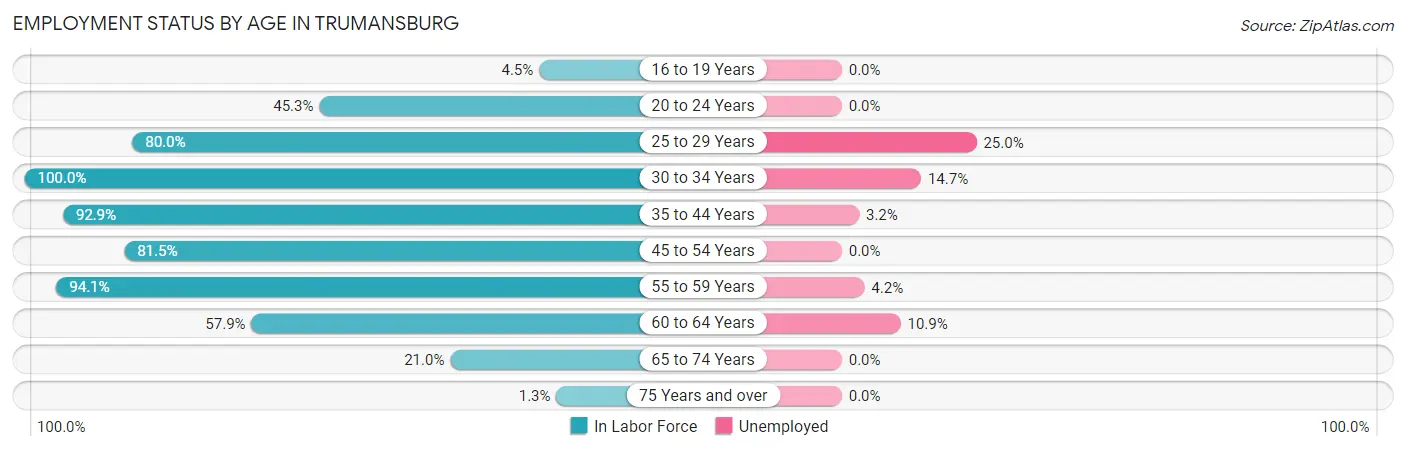
| Age Bracket | In Labor Force | Unemployed |
| 16 to 19 Years | 1 (4.5%) | 0 (0.0%) |
| 20 to 24 Years | 29 (45.3%) | 0 (0.0%) |
| 25 to 29 Years | 16 (80.0%) | 4 (25.0%) |
| 30 to 34 Years | 34 (100.0%) | 5 (14.7%) |
| 35 to 44 Years | 158 (92.9%) | 5 (3.2%) |
| 45 to 54 Years | 203 (81.5%) | 0 (0.0%) |
| 55 to 59 Years | 95 (94.1%) | 4 (4.2%) |
| 60 to 64 Years | 55 (57.9%) | 6 (10.9%) |
| 65 to 74 Years | 66 (21.0%) | 0 (0.0%) |
| 75 Years and over | 2 (1.3%) | 0 (0.0%) |
| Total | 659 (53.8%) | 24 (3.6%) |
Employment Status by Educational Attainment in Trumansburg
According to labor force statistics for Trumansburg, 83.9% of individuals (561) out of the total population between 25 and 64 years of age (669) are in the labor force, with 4.3% or 24 of them being unemployed. The group with the highest labor force participation rate are those with the educational attainment of bachelor's degree or higher, with 90.8% or 326 individuals in the labor force. Within the labor force, individuals with college / associate degree education have the highest percentage of unemployment, with 10.0% or 16 of them being unemployed.
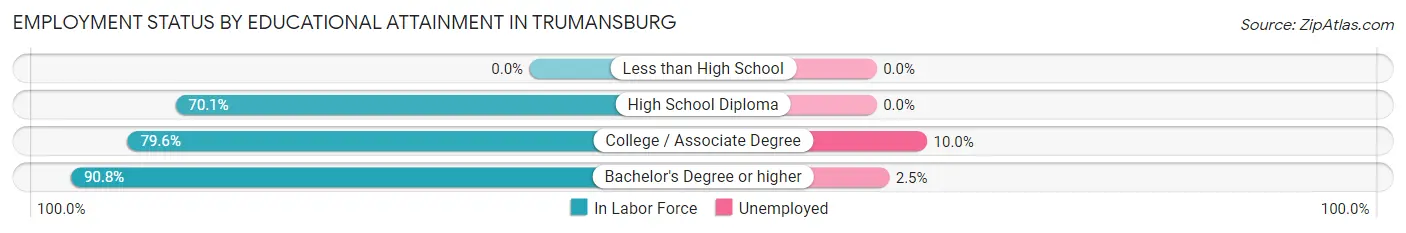
| Educational Attainment | In Labor Force | Unemployed |
| Less than High School | 0 (0.0%) | 0 (0.0%) |
| High School Diploma | 75 (70.1%) | 0 (0.0%) |
| College / Associate Degree | 160 (79.6%) | 20 (10.0%) |
| Bachelor's Degree or higher | 326 (90.8%) | 9 (2.5%) |
| Total | 561 (83.9%) | 29 (4.3%) |
Employment Occupations by Sex in Trumansburg
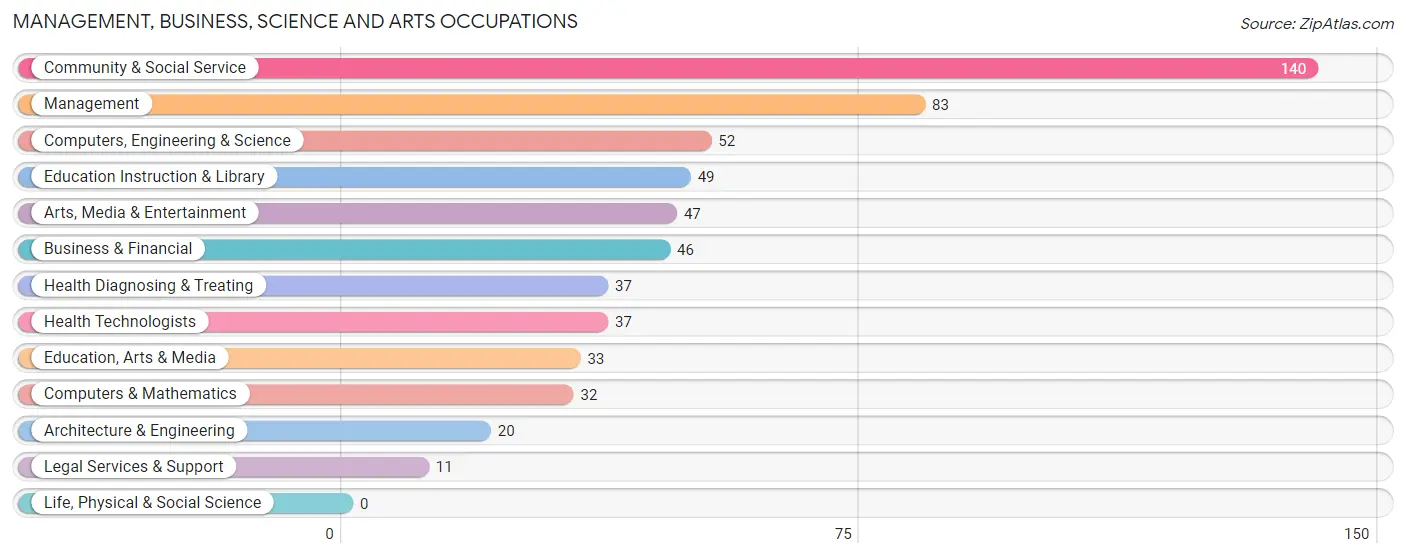
Management, Business, Science and Arts Occupations
The most common Management, Business, Science and Arts occupations in Trumansburg are Community & Social Service (140 | 22.1%), Management (83 | 13.1%), Computers, Engineering & Science (52 | 8.2%), Education Instruction & Library (49 | 7.7%), and Arts, Media & Entertainment (47 | 7.4%).
Management, Business, Science and Arts Occupations by Sex
Within the Management, Business, Science and Arts occupations in Trumansburg, the most male-oriented occupations are Architecture & Engineering (100.0%), Legal Services & Support (100.0%), and Arts, Media & Entertainment (72.3%), while the most female-oriented occupations are Business & Financial (100.0%), Health Diagnosing & Treating (100.0%), and Health Technologists (100.0%).
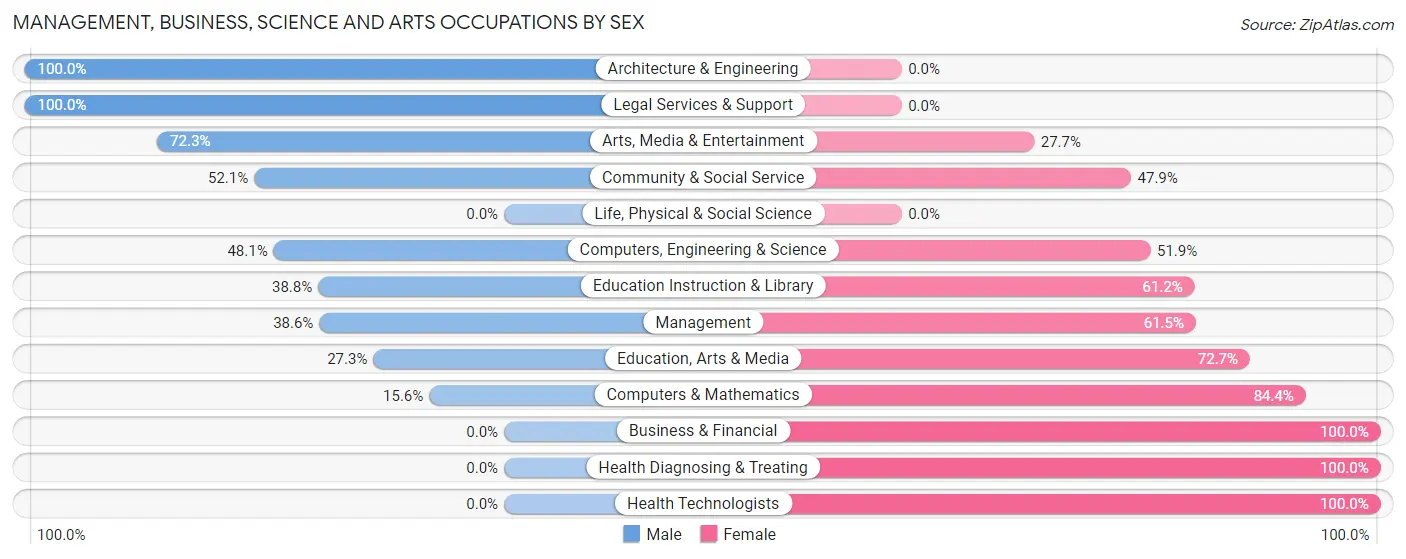
| Occupation | Male | Female |
| Management | 32 (38.6%) | 51 (61.5%) |
| Business & Financial | 0 (0.0%) | 46 (100.0%) |
| Computers, Engineering & Science | 25 (48.1%) | 27 (51.9%) |
| Computers & Mathematics | 5 (15.6%) | 27 (84.4%) |
| Architecture & Engineering | 20 (100.0%) | 0 (0.0%) |
| Life, Physical & Social Science | 0 (0.0%) | 0 (0.0%) |
| Community & Social Service | 73 (52.1%) | 67 (47.9%) |
| Education, Arts & Media | 9 (27.3%) | 24 (72.7%) |
| Legal Services & Support | 11 (100.0%) | 0 (0.0%) |
| Education Instruction & Library | 19 (38.8%) | 30 (61.2%) |
| Arts, Media & Entertainment | 34 (72.3%) | 13 (27.7%) |
| Health Diagnosing & Treating | 0 (0.0%) | 37 (100.0%) |
| Health Technologists | 0 (0.0%) | 37 (100.0%) |
| Total (Category) | 130 (36.3%) | 228 (63.7%) |
| Total (Overall) | 289 (45.5%) | 346 (54.5%) |
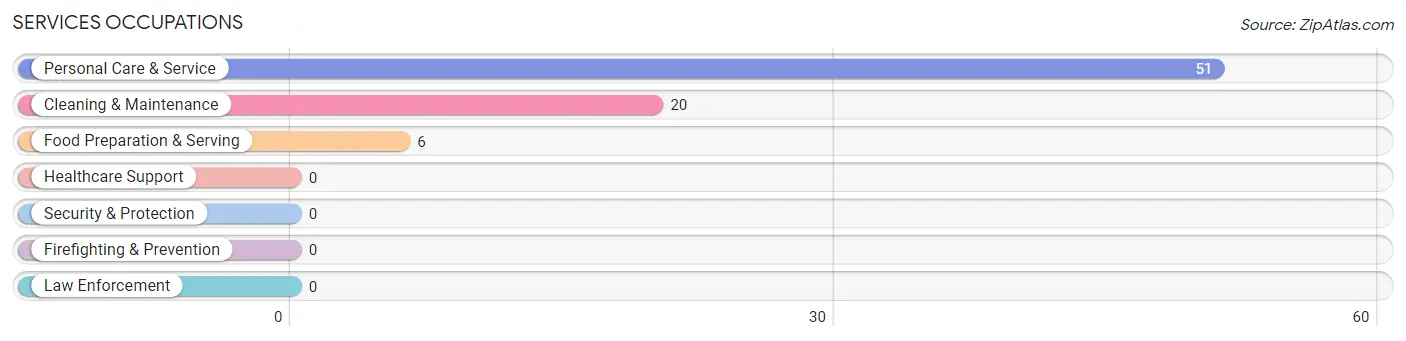
Services Occupations
The most common Services occupations in Trumansburg are Personal Care & Service (51 | 8.0%), Cleaning & Maintenance (20 | 3.2%), and Food Preparation & Serving (6 | 0.9%).
Services Occupations by Sex
Within the Services occupations in Trumansburg, the most male-oriented occupations are Cleaning & Maintenance (100.0%), Food Preparation & Serving (33.3%), and Personal Care & Service (25.5%), while the most female-oriented occupations are Personal Care & Service (74.5%), and Food Preparation & Serving (66.7%).
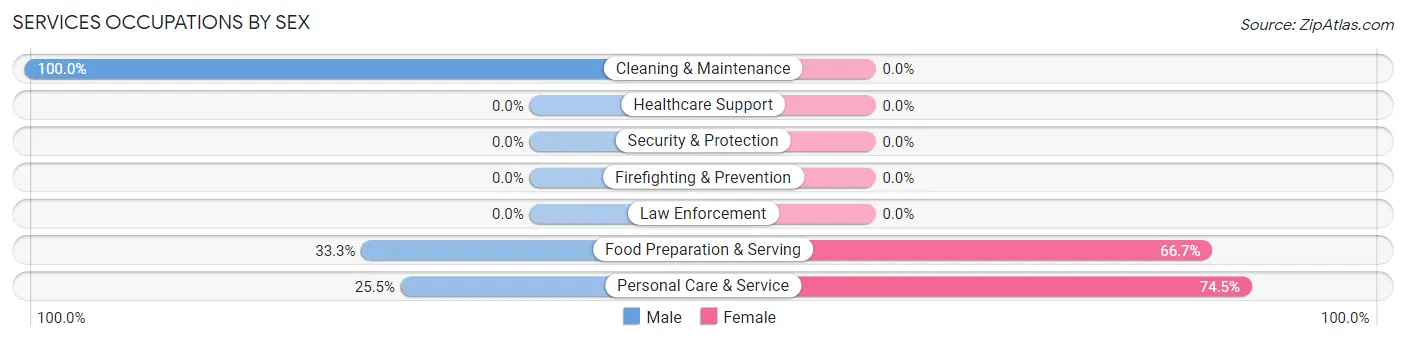
| Occupation | Male | Female |
| Healthcare Support | 0 (0.0%) | 0 (0.0%) |
| Security & Protection | 0 (0.0%) | 0 (0.0%) |
| Firefighting & Prevention | 0 (0.0%) | 0 (0.0%) |
| Law Enforcement | 0 (0.0%) | 0 (0.0%) |
| Food Preparation & Serving | 2 (33.3%) | 4 (66.7%) |
| Cleaning & Maintenance | 20 (100.0%) | 0 (0.0%) |
| Personal Care & Service | 13 (25.5%) | 38 (74.5%) |
| Total (Category) | 35 (45.5%) | 42 (54.5%) |
| Total (Overall) | 289 (45.5%) | 346 (54.5%) |
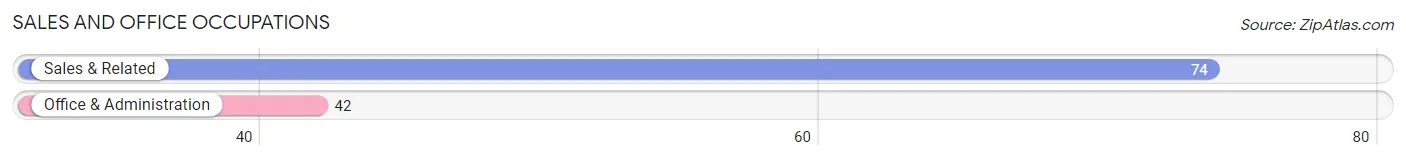
Sales and Office Occupations
The most common Sales and Office occupations in Trumansburg are Sales & Related (74 | 11.7%), and Office & Administration (42 | 6.6%).
Sales and Office Occupations by Sex
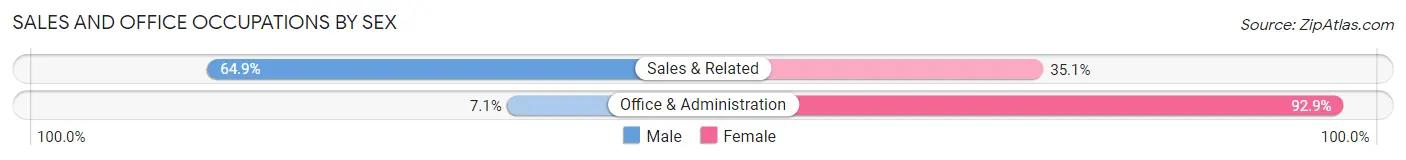
| Occupation | Male | Female |
| Sales & Related | 48 (64.9%) | 26 (35.1%) |
| Office & Administration | 3 (7.1%) | 39 (92.9%) |
| Total (Category) | 51 (44.0%) | 65 (56.0%) |
| Total (Overall) | 289 (45.5%) | 346 (54.5%) |
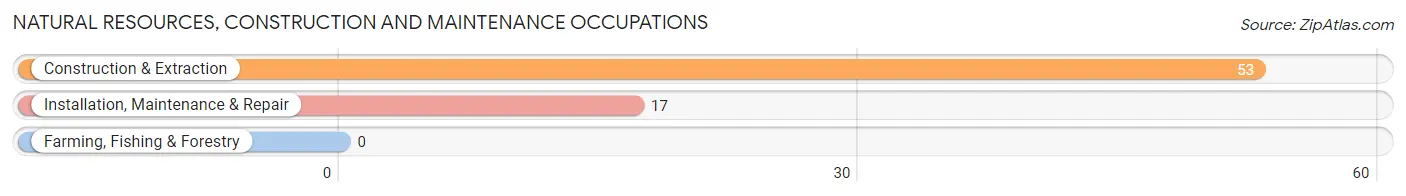
Natural Resources, Construction and Maintenance Occupations
The most common Natural Resources, Construction and Maintenance occupations in Trumansburg are Construction & Extraction (53 | 8.4%), and Installation, Maintenance & Repair (17 | 2.7%).
Natural Resources, Construction and Maintenance Occupations by Sex
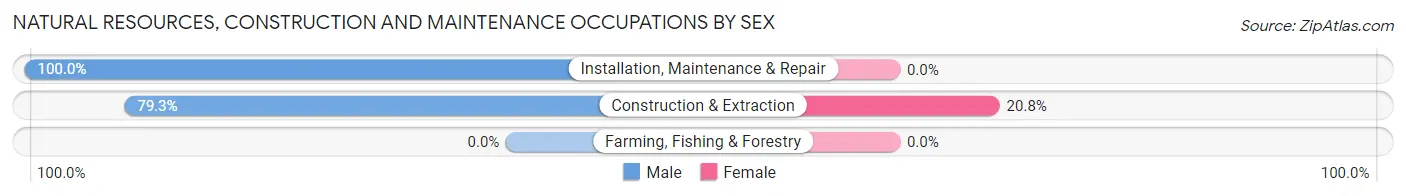
| Occupation | Male | Female |
| Farming, Fishing & Forestry | 0 (0.0%) | 0 (0.0%) |
| Construction & Extraction | 42 (79.2%) | 11 (20.7%) |
| Installation, Maintenance & Repair | 17 (100.0%) | 0 (0.0%) |
| Total (Category) | 59 (84.3%) | 11 (15.7%) |
| Total (Overall) | 289 (45.5%) | 346 (54.5%) |
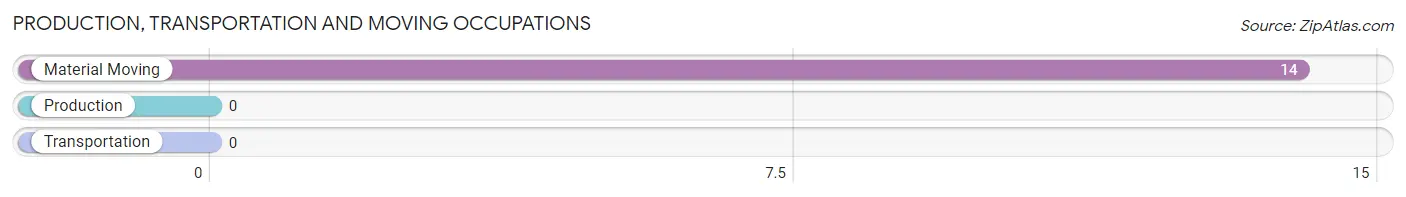
Production, Transportation and Moving Occupations
The most common Production, Transportation and Moving occupations in Trumansburg are , and Material Moving (14 | 2.2%).
Production, Transportation and Moving Occupations by Sex
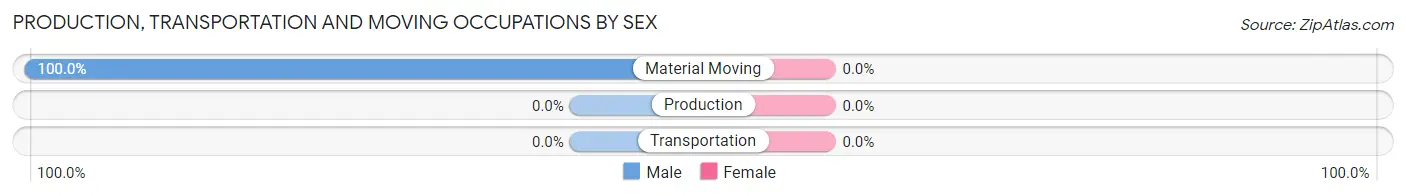
| Occupation | Male | Female |
| Production | 0 (0.0%) | 0 (0.0%) |
| Transportation | 0 (0.0%) | 0 (0.0%) |
| Material Moving | 14 (100.0%) | 0 (0.0%) |
| Total (Category) | 14 (100.0%) | 0 (0.0%) |
| Total (Overall) | 289 (45.5%) | 346 (54.5%) |
Employment Industries by Sex in Trumansburg
Employment Industries in Trumansburg
The major employment industries in Trumansburg include Educational Services (141 | 22.2%), Health Care & Social Assistance (95 | 15.0%), Professional & Scientific (73 | 11.5%), Retail Trade (70 | 11.0%), and Construction (53 | 8.4%).
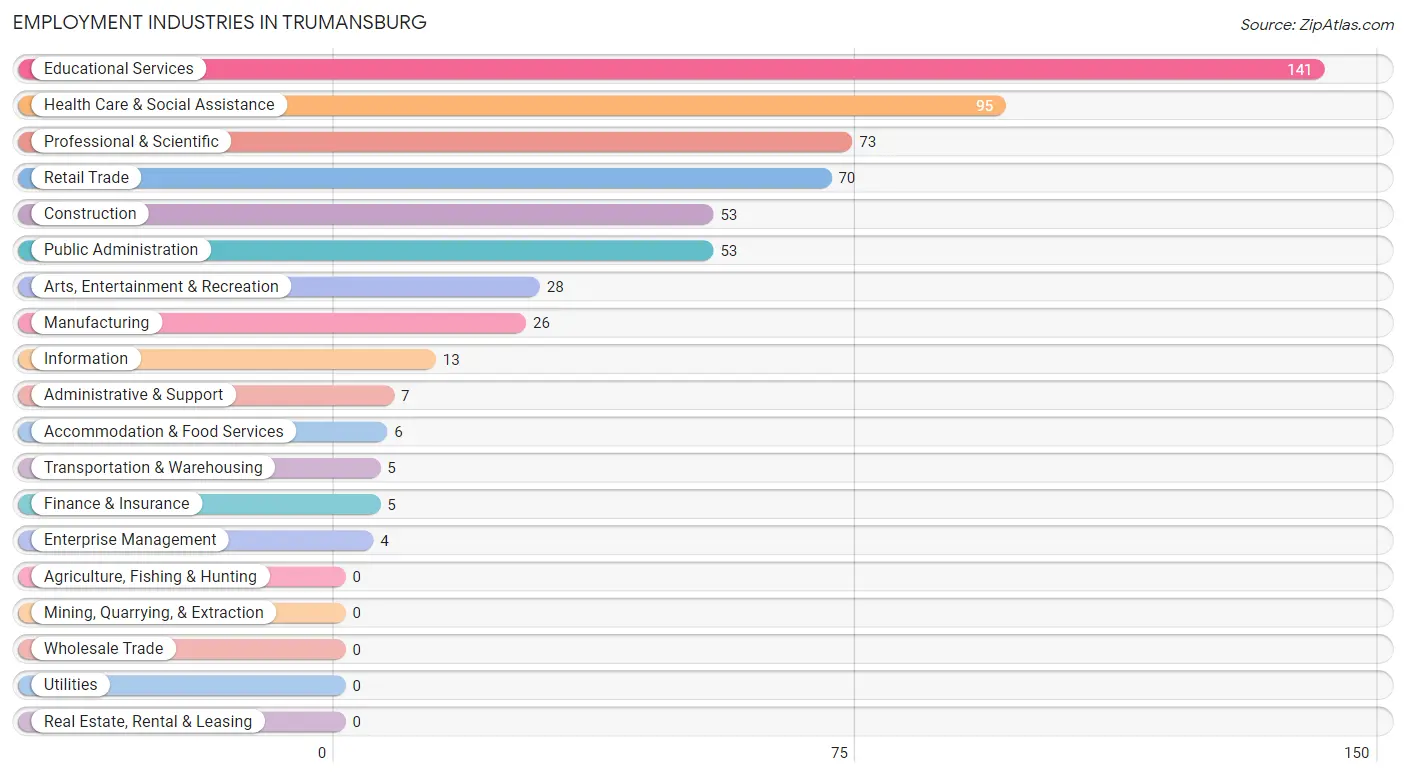
Employment Industries by Sex in Trumansburg
The Trumansburg industries that see more men than women are Manufacturing (100.0%), Finance & Insurance (100.0%), and Administrative & Support (100.0%), whereas the industries that tend to have a higher number of women are Transportation & Warehousing (100.0%), Enterprise Management (100.0%), and Health Care & Social Assistance (86.3%).
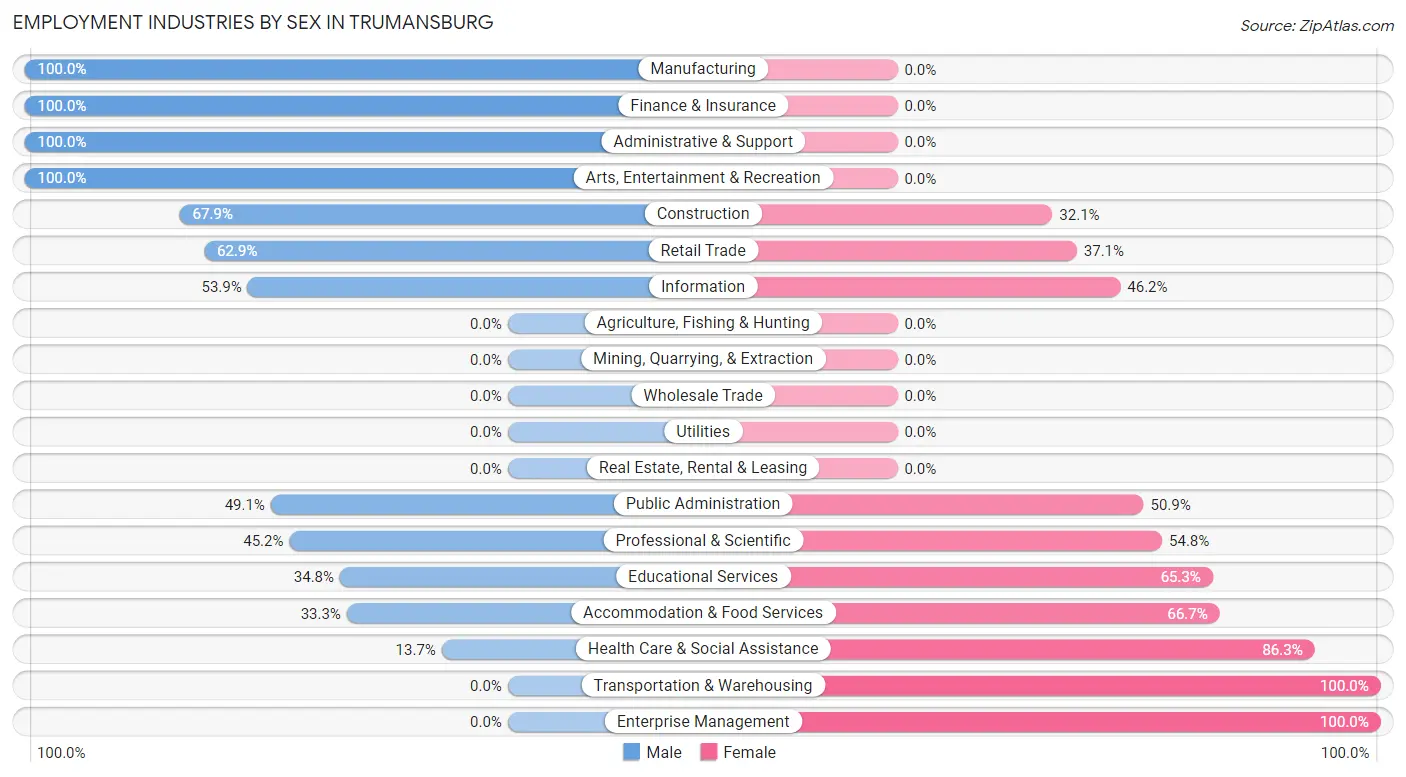
| Industry | Male | Female |
| Agriculture, Fishing & Hunting | 0 (0.0%) | 0 (0.0%) |
| Mining, Quarrying, & Extraction | 0 (0.0%) | 0 (0.0%) |
| Construction | 36 (67.9%) | 17 (32.1%) |
| Manufacturing | 26 (100.0%) | 0 (0.0%) |
| Wholesale Trade | 0 (0.0%) | 0 (0.0%) |
| Retail Trade | 44 (62.9%) | 26 (37.1%) |
| Transportation & Warehousing | 0 (0.0%) | 5 (100.0%) |
| Utilities | 0 (0.0%) | 0 (0.0%) |
| Information | 7 (53.8%) | 6 (46.2%) |
| Finance & Insurance | 5 (100.0%) | 0 (0.0%) |
| Real Estate, Rental & Leasing | 0 (0.0%) | 0 (0.0%) |
| Professional & Scientific | 33 (45.2%) | 40 (54.8%) |
| Enterprise Management | 0 (0.0%) | 4 (100.0%) |
| Administrative & Support | 7 (100.0%) | 0 (0.0%) |
| Educational Services | 49 (34.7%) | 92 (65.2%) |
| Health Care & Social Assistance | 13 (13.7%) | 82 (86.3%) |
| Arts, Entertainment & Recreation | 28 (100.0%) | 0 (0.0%) |
| Accommodation & Food Services | 2 (33.3%) | 4 (66.7%) |
| Public Administration | 26 (49.1%) | 27 (50.9%) |
| Total | 289 (45.5%) | 346 (54.5%) |
Education in Trumansburg
School Enrollment in Trumansburg
The most common levels of schooling among the 332 students in Trumansburg are elementary school (93 | 28.0%), middle school (61 | 18.4%), and college / undergraduate (54 | 16.3%).
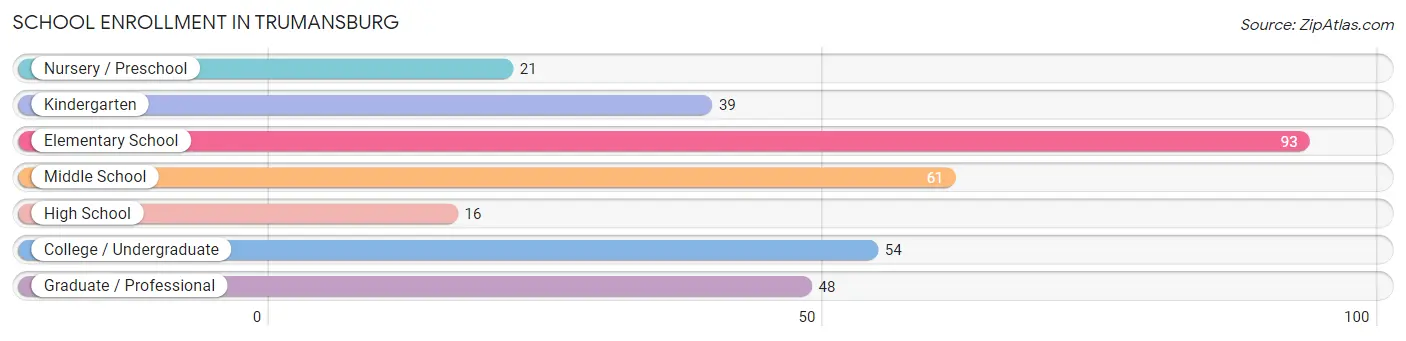
| School Level | # Students | % Students |
| Nursery / Preschool | 21 | 6.3% |
| Kindergarten | 39 | 11.7% |
| Elementary School | 93 | 28.0% |
| Middle School | 61 | 18.4% |
| High School | 16 | 4.8% |
| College / Undergraduate | 54 | 16.3% |
| Graduate / Professional | 48 | 14.5% |
| Total | 332 | 100.0% |
School Enrollment by Age by Funding Source in Trumansburg
Out of a total of 332 students who are enrolled in schools in Trumansburg, 60 (18.1%) attend a private institution, while the remaining 272 (81.9%) are enrolled in public schools. The age group of 18 to 19 year olds has the highest likelihood of being enrolled in private schools, with 13 (100.0% in the age bracket) enrolled. Conversely, the age group of 10 to 14 year olds has the lowest likelihood of being enrolled in a private school, with 74 (100.0% in the age bracket) attending a public institution.
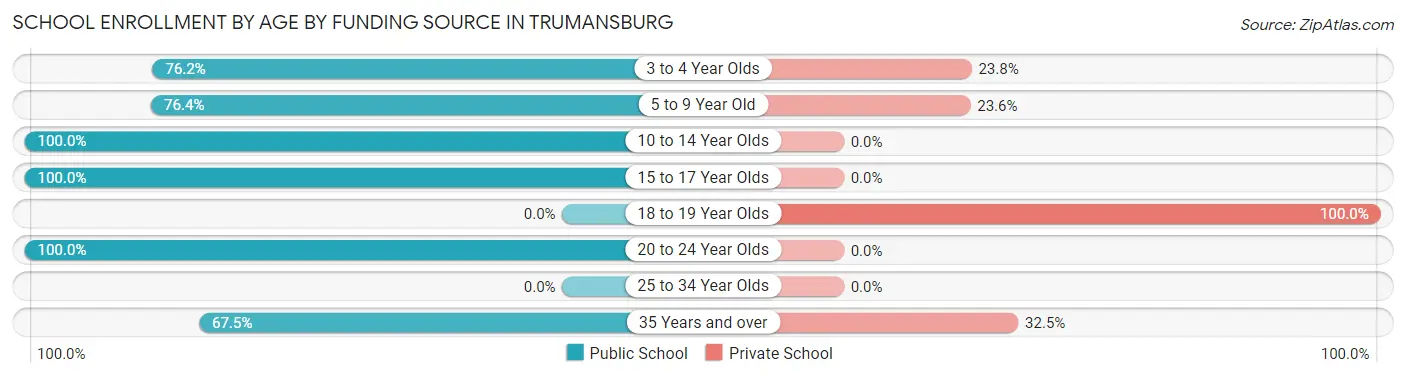
| Age Bracket | Public School | Private School |
| 3 to 4 Year Olds | 16 (76.2%) | 5 (23.8%) |
| 5 to 9 Year Old | 94 (76.4%) | 29 (23.6%) |
| 10 to 14 Year Olds | 74 (100.0%) | 0 (0.0%) |
| 15 to 17 Year Olds | 12 (100.0%) | 0 (0.0%) |
| 18 to 19 Year Olds | 0 (0.0%) | 13 (100.0%) |
| 20 to 24 Year Olds | 49 (100.0%) | 0 (0.0%) |
| 25 to 34 Year Olds | 0 (0.0%) | 0 (0.0%) |
| 35 Years and over | 27 (67.5%) | 13 (32.5%) |
| Total | 272 (81.9%) | 60 (18.1%) |
Educational Attainment by Field of Study in Trumansburg
Literature & languages (91 | 13.8%), social sciences (87 | 13.2%), visual & performing arts (82 | 12.4%), education (66 | 10.0%), and business (59 | 8.9%) are the most common fields of study among 660 individuals in Trumansburg who have obtained a bachelor's degree or higher.
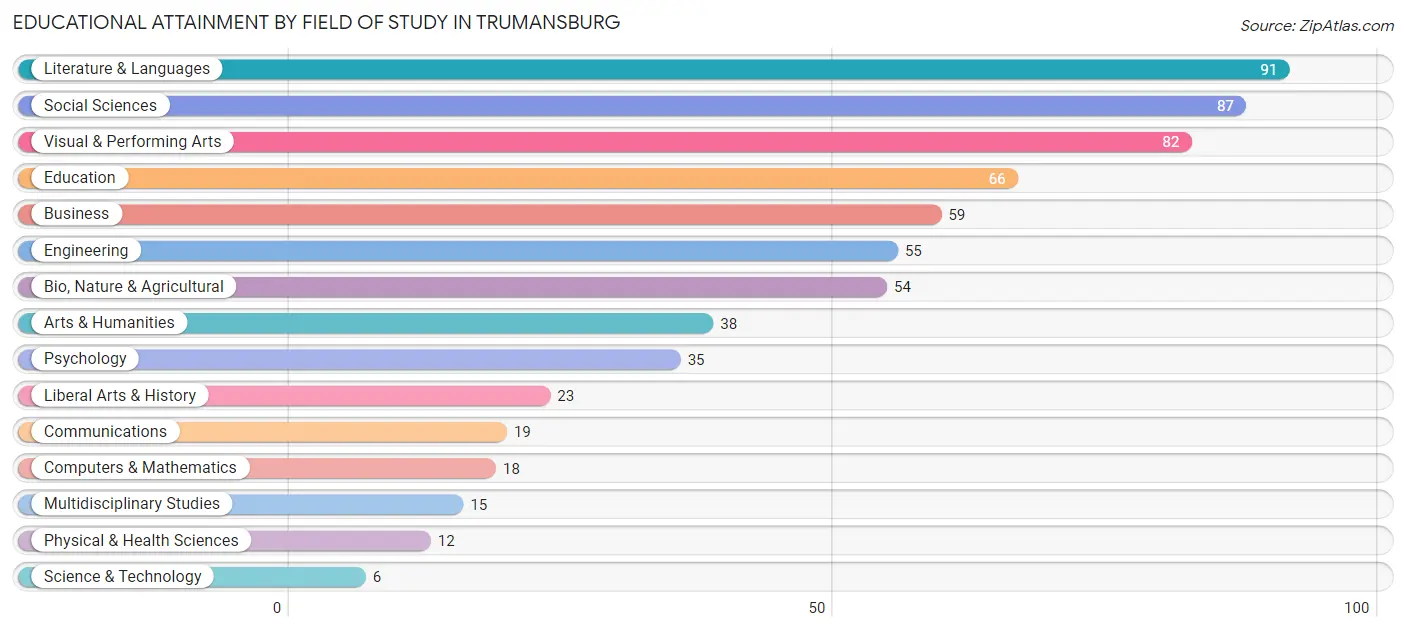
| Field of Study | # Graduates | % Graduates |
| Computers & Mathematics | 18 | 2.7% |
| Bio, Nature & Agricultural | 54 | 8.2% |
| Physical & Health Sciences | 12 | 1.8% |
| Psychology | 35 | 5.3% |
| Social Sciences | 87 | 13.2% |
| Engineering | 55 | 8.3% |
| Multidisciplinary Studies | 15 | 2.3% |
| Science & Technology | 6 | 0.9% |
| Business | 59 | 8.9% |
| Education | 66 | 10.0% |
| Literature & Languages | 91 | 13.8% |
| Liberal Arts & History | 23 | 3.5% |
| Visual & Performing Arts | 82 | 12.4% |
| Communications | 19 | 2.9% |
| Arts & Humanities | 38 | 5.8% |
| Total | 660 | 100.0% |
Transportation & Commute in Trumansburg
Vehicle Availability by Sex in Trumansburg
The most prevalent vehicle ownership categories in Trumansburg are males with 2 vehicles (175, accounting for 60.6%) and females with 2 vehicles (187, making up 51.9%).
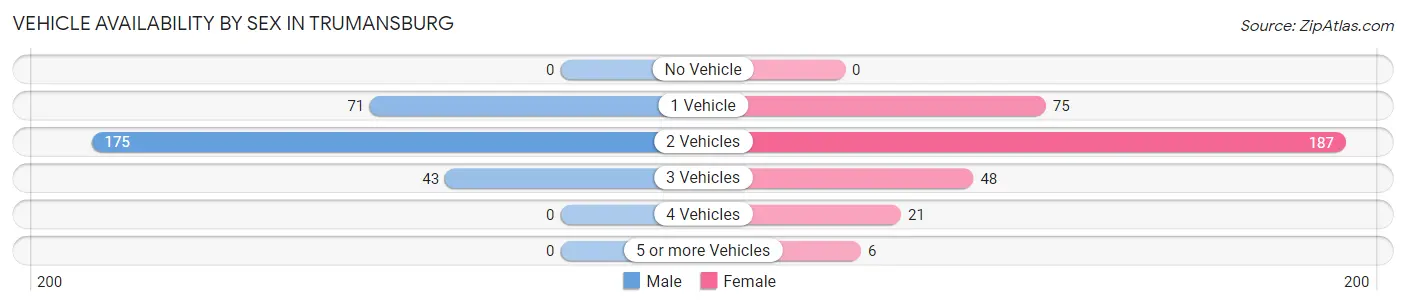
| Vehicles Available | Male | Female |
| No Vehicle | 0 (0.0%) | 0 (0.0%) |
| 1 Vehicle | 71 (24.6%) | 75 (22.3%) |
| 2 Vehicles | 175 (60.6%) | 187 (55.5%) |
| 3 Vehicles | 43 (14.9%) | 48 (14.2%) |
| 4 Vehicles | 0 (0.0%) | 21 (6.2%) |
| 5 or more Vehicles | 0 (0.0%) | 6 (1.8%) |
| Total | 289 (100.0%) | 337 (100.0%) |
Commute Time in Trumansburg
The most frequently occuring commute durations in Trumansburg are 20 to 24 minutes (109 commuters, 22.1%), 25 to 29 minutes (80 commuters, 16.2%), and 30 to 34 minutes (76 commuters, 15.4%).
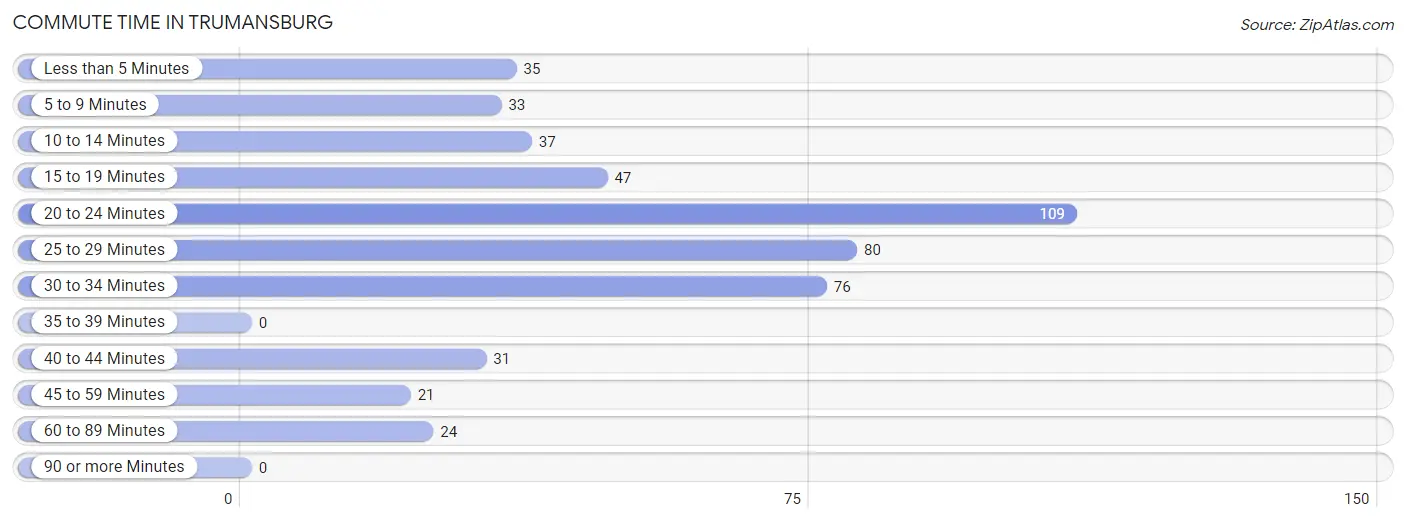
| Commute Time | # Commuters | % Commuters |
| Less than 5 Minutes | 35 | 7.1% |
| 5 to 9 Minutes | 33 | 6.7% |
| 10 to 14 Minutes | 37 | 7.5% |
| 15 to 19 Minutes | 47 | 9.5% |
| 20 to 24 Minutes | 109 | 22.1% |
| 25 to 29 Minutes | 80 | 16.2% |
| 30 to 34 Minutes | 76 | 15.4% |
| 35 to 39 Minutes | 0 | 0.0% |
| 40 to 44 Minutes | 31 | 6.3% |
| 45 to 59 Minutes | 21 | 4.3% |
| 60 to 89 Minutes | 24 | 4.9% |
| 90 or more Minutes | 0 | 0.0% |
Commute Time by Sex in Trumansburg
The most common commute times in Trumansburg are 20 to 24 minutes (57 commuters, 24.7%) for males and 25 to 29 minutes (54 commuters, 20.6%) for females.
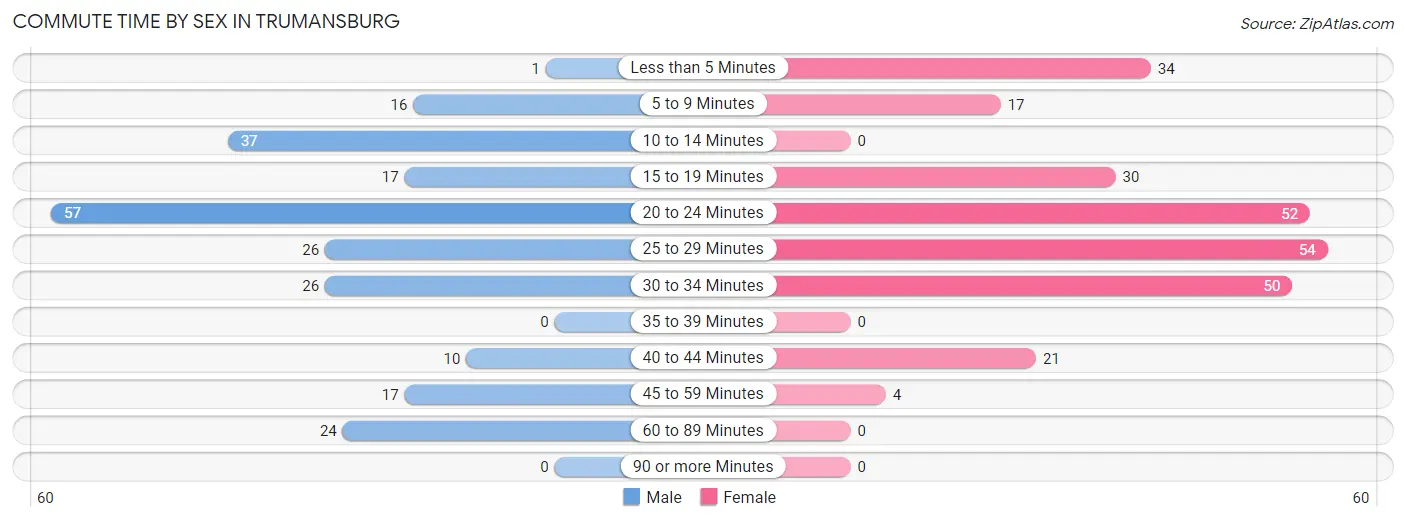
| Commute Time | Male | Female |
| Less than 5 Minutes | 1 (0.4%) | 34 (13.0%) |
| 5 to 9 Minutes | 16 (6.9%) | 17 (6.5%) |
| 10 to 14 Minutes | 37 (16.0%) | 0 (0.0%) |
| 15 to 19 Minutes | 17 (7.4%) | 30 (11.5%) |
| 20 to 24 Minutes | 57 (24.7%) | 52 (19.9%) |
| 25 to 29 Minutes | 26 (11.3%) | 54 (20.6%) |
| 30 to 34 Minutes | 26 (11.3%) | 50 (19.1%) |
| 35 to 39 Minutes | 0 (0.0%) | 0 (0.0%) |
| 40 to 44 Minutes | 10 (4.3%) | 21 (8.0%) |
| 45 to 59 Minutes | 17 (7.4%) | 4 (1.5%) |
| 60 to 89 Minutes | 24 (10.4%) | 0 (0.0%) |
| 90 or more Minutes | 0 (0.0%) | 0 (0.0%) |
Time of Departure to Work by Sex in Trumansburg
The most frequent times of departure to work in Trumansburg are 8:00 AM to 8:29 AM (57, 24.7%) for males and 7:00 AM to 7:29 AM (74, 28.2%) for females.
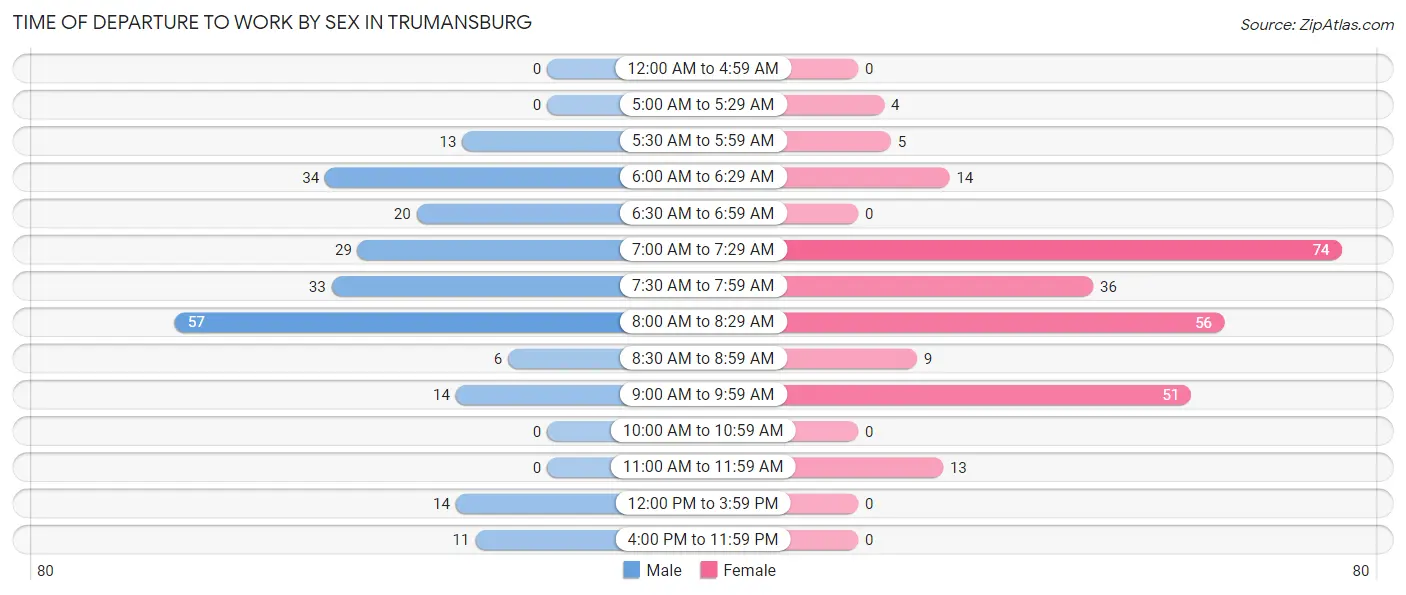
| Time of Departure | Male | Female |
| 12:00 AM to 4:59 AM | 0 (0.0%) | 0 (0.0%) |
| 5:00 AM to 5:29 AM | 0 (0.0%) | 4 (1.5%) |
| 5:30 AM to 5:59 AM | 13 (5.6%) | 5 (1.9%) |
| 6:00 AM to 6:29 AM | 34 (14.7%) | 14 (5.3%) |
| 6:30 AM to 6:59 AM | 20 (8.7%) | 0 (0.0%) |
| 7:00 AM to 7:29 AM | 29 (12.6%) | 74 (28.2%) |
| 7:30 AM to 7:59 AM | 33 (14.3%) | 36 (13.7%) |
| 8:00 AM to 8:29 AM | 57 (24.7%) | 56 (21.4%) |
| 8:30 AM to 8:59 AM | 6 (2.6%) | 9 (3.4%) |
| 9:00 AM to 9:59 AM | 14 (6.1%) | 51 (19.5%) |
| 10:00 AM to 10:59 AM | 0 (0.0%) | 0 (0.0%) |
| 11:00 AM to 11:59 AM | 0 (0.0%) | 13 (5.0%) |
| 12:00 PM to 3:59 PM | 14 (6.1%) | 0 (0.0%) |
| 4:00 PM to 11:59 PM | 11 (4.8%) | 0 (0.0%) |
| Total | 231 (100.0%) | 262 (100.0%) |
Housing Occupancy in Trumansburg
Occupancy by Ownership in Trumansburg
Of the total 737 dwellings in Trumansburg, owner-occupied units account for 447 (60.7%), while renter-occupied units make up 290 (39.4%).
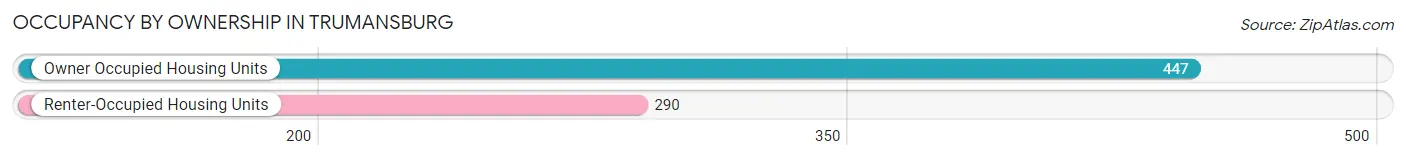
| Occupancy | # Housing Units | % Housing Units |
| Owner Occupied Housing Units | 447 | 60.7% |
| Renter-Occupied Housing Units | 290 | 39.4% |
| Total Occupied Housing Units | 737 | 100.0% |
Occupancy by Household Size in Trumansburg
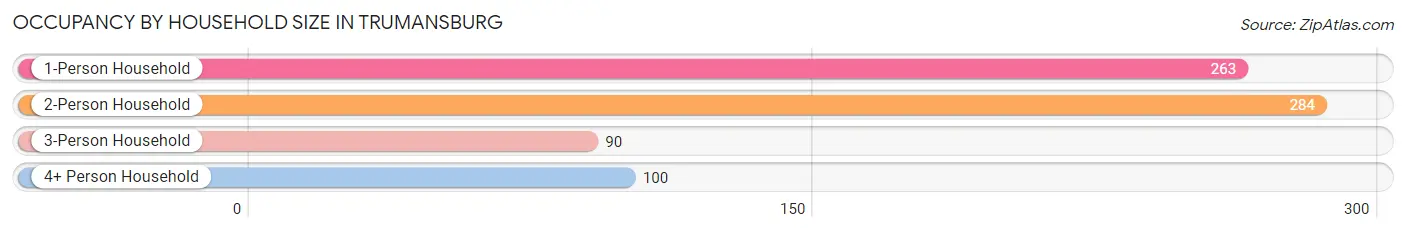
| Household Size | # Housing Units | % Housing Units |
| 1-Person Household | 263 | 35.7% |
| 2-Person Household | 284 | 38.5% |
| 3-Person Household | 90 | 12.2% |
| 4+ Person Household | 100 | 13.6% |
| Total Housing Units | 737 | 100.0% |
Occupancy by Ownership by Household Size in Trumansburg
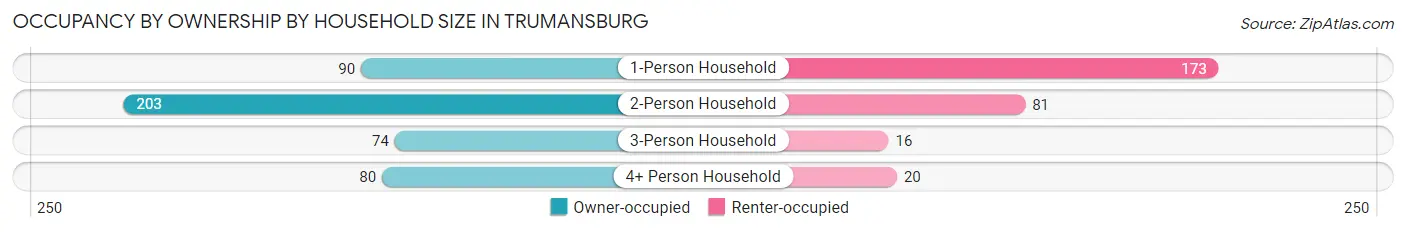
| Household Size | Owner-occupied | Renter-occupied |
| 1-Person Household | 90 (34.2%) | 173 (65.8%) |
| 2-Person Household | 203 (71.5%) | 81 (28.5%) |
| 3-Person Household | 74 (82.2%) | 16 (17.8%) |
| 4+ Person Household | 80 (80.0%) | 20 (20.0%) |
| Total Housing Units | 447 (60.7%) | 290 (39.4%) |
Occupancy by Educational Attainment in Trumansburg
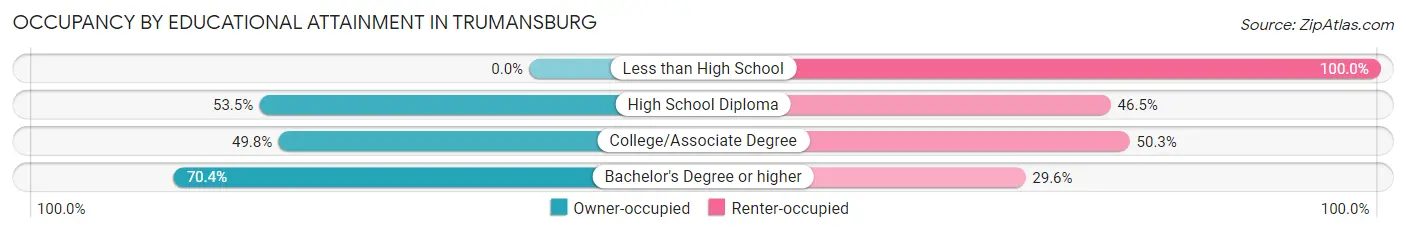
| Household Size | Owner-occupied | Renter-occupied |
| Less than High School | 0 (0.0%) | 17 (100.0%) |
| High School Diploma | 61 (53.5%) | 53 (46.5%) |
| College/Associate Degree | 98 (49.7%) | 99 (50.2%) |
| Bachelor's Degree or higher | 288 (70.4%) | 121 (29.6%) |
Occupancy by Age of Householder in Trumansburg
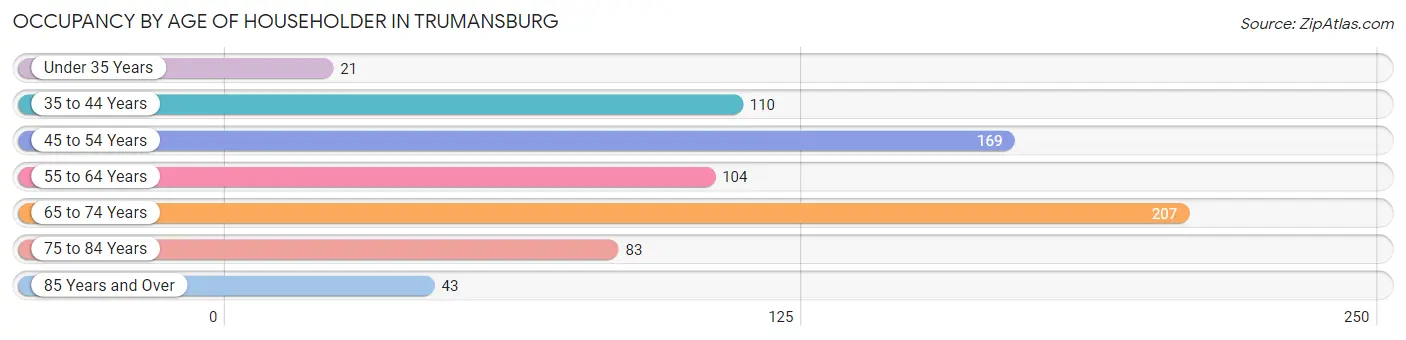
| Age Bracket | # Households | % Households |
| Under 35 Years | 21 | 2.9% |
| 35 to 44 Years | 110 | 14.9% |
| 45 to 54 Years | 169 | 22.9% |
| 55 to 64 Years | 104 | 14.1% |
| 65 to 74 Years | 207 | 28.1% |
| 75 to 84 Years | 83 | 11.3% |
| 85 Years and Over | 43 | 5.8% |
| Total | 737 | 100.0% |
Housing Finances in Trumansburg
Median Income by Occupancy in Trumansburg
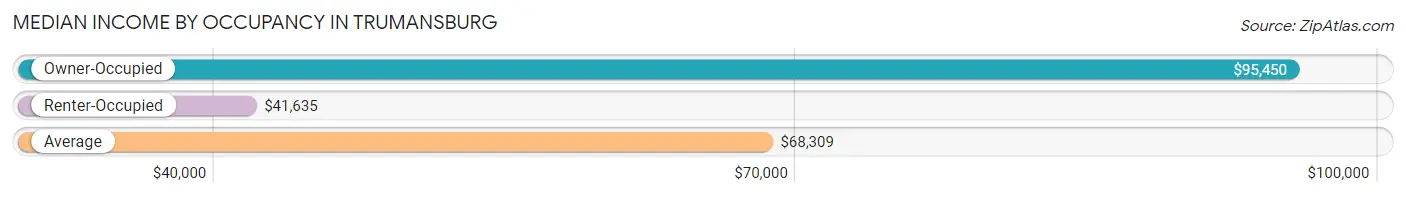
| Occupancy Type | # Households | Median Income |
| Owner-Occupied | 447 (60.7%) | $95,450 |
| Renter-Occupied | 290 (39.4%) | $41,635 |
| Average | 737 (100.0%) | $68,309 |
Occupancy by Householder Income Bracket in Trumansburg
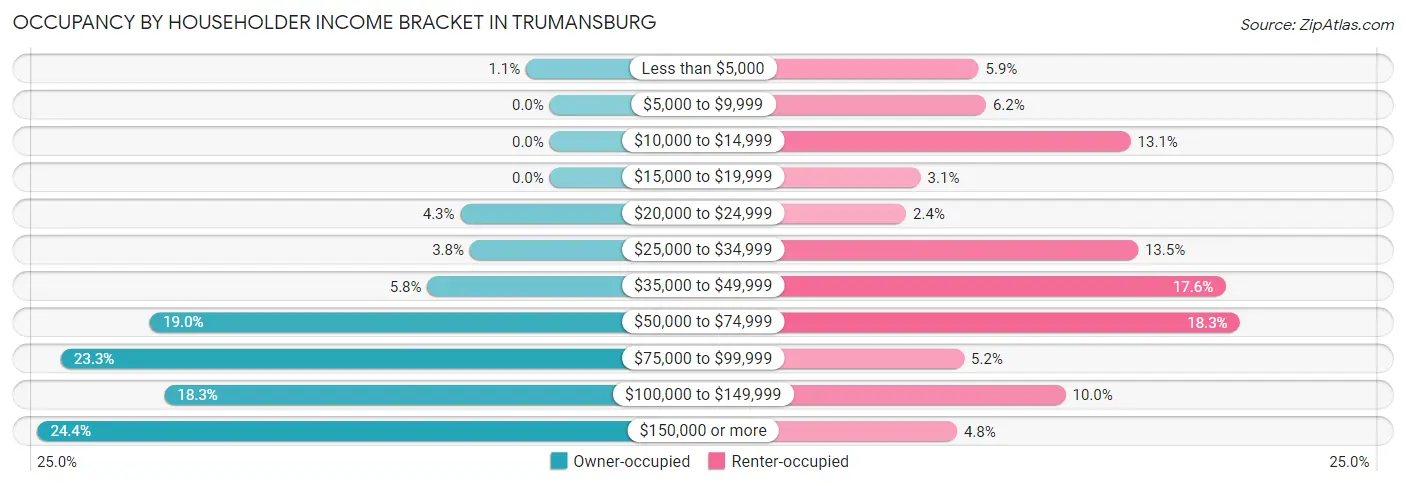
| Income Bracket | Owner-occupied | Renter-occupied |
| Less than $5,000 | 5 (1.1%) | 17 (5.9%) |
| $5,000 to $9,999 | 0 (0.0%) | 18 (6.2%) |
| $10,000 to $14,999 | 0 (0.0%) | 38 (13.1%) |
| $15,000 to $19,999 | 0 (0.0%) | 9 (3.1%) |
| $20,000 to $24,999 | 19 (4.3%) | 7 (2.4%) |
| $25,000 to $34,999 | 17 (3.8%) | 39 (13.5%) |
| $35,000 to $49,999 | 26 (5.8%) | 51 (17.6%) |
| $50,000 to $74,999 | 85 (19.0%) | 53 (18.3%) |
| $75,000 to $99,999 | 104 (23.3%) | 15 (5.2%) |
| $100,000 to $149,999 | 82 (18.3%) | 29 (10.0%) |
| $150,000 or more | 109 (24.4%) | 14 (4.8%) |
| Total | 447 (100.0%) | 290 (100.0%) |
Monthly Housing Cost Tiers in Trumansburg
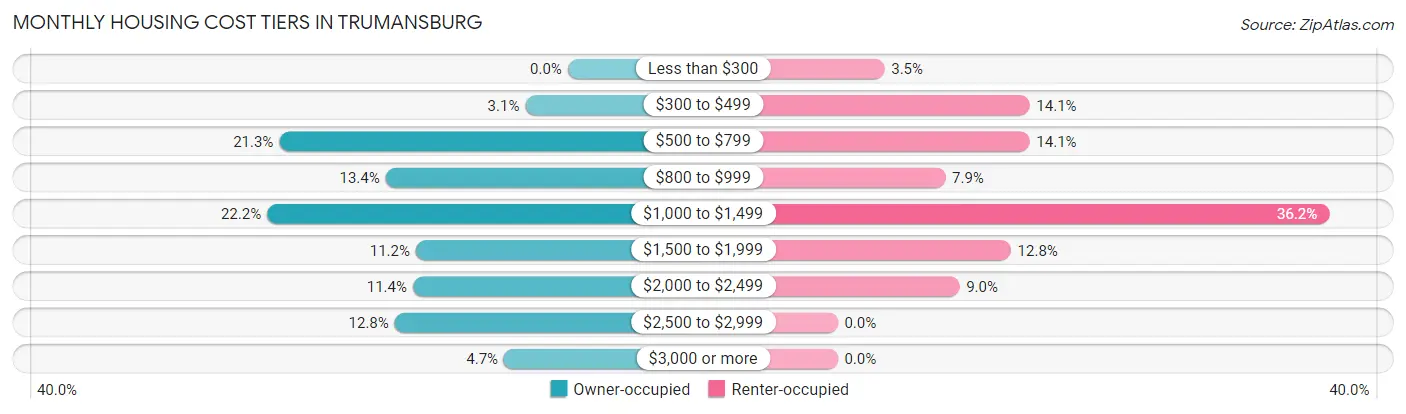
| Monthly Cost | Owner-occupied | Renter-occupied |
| Less than $300 | 0 (0.0%) | 10 (3.5%) |
| $300 to $499 | 14 (3.1%) | 41 (14.1%) |
| $500 to $799 | 95 (21.2%) | 41 (14.1%) |
| $800 to $999 | 60 (13.4%) | 23 (7.9%) |
| $1,000 to $1,499 | 99 (22.2%) | 105 (36.2%) |
| $1,500 to $1,999 | 50 (11.2%) | 37 (12.8%) |
| $2,000 to $2,499 | 51 (11.4%) | 26 (9.0%) |
| $2,500 to $2,999 | 57 (12.8%) | 0 (0.0%) |
| $3,000 or more | 21 (4.7%) | 0 (0.0%) |
| Total | 447 (100.0%) | 290 (100.0%) |
Physical Housing Characteristics in Trumansburg
Housing Structures in Trumansburg
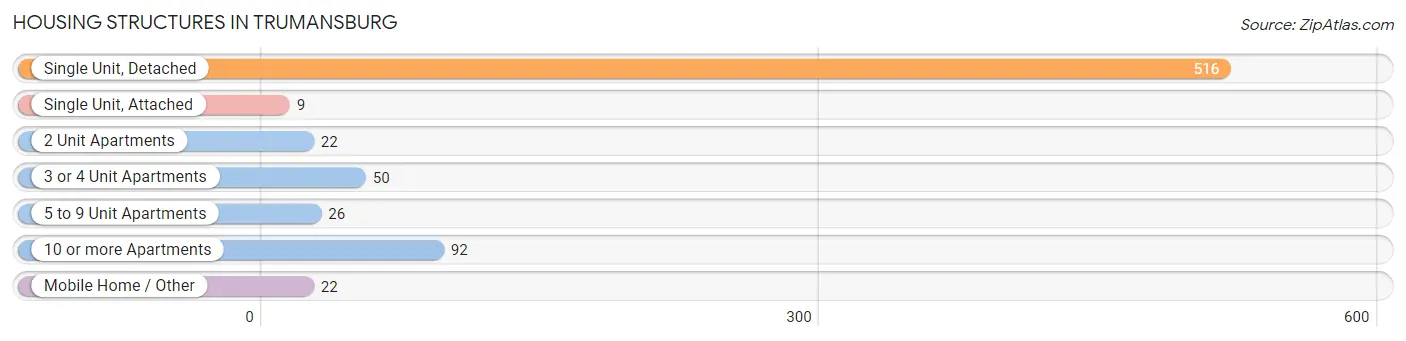
| Structure Type | # Housing Units | % Housing Units |
| Single Unit, Detached | 516 | 70.0% |
| Single Unit, Attached | 9 | 1.2% |
| 2 Unit Apartments | 22 | 3.0% |
| 3 or 4 Unit Apartments | 50 | 6.8% |
| 5 to 9 Unit Apartments | 26 | 3.5% |
| 10 or more Apartments | 92 | 12.5% |
| Mobile Home / Other | 22 | 3.0% |
| Total | 737 | 100.0% |
Housing Structures by Occupancy in Trumansburg
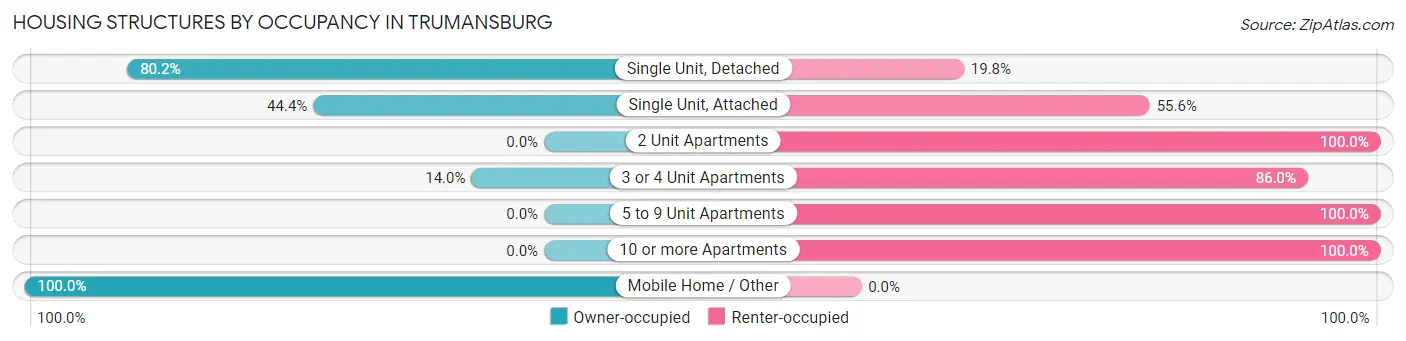
| Structure Type | Owner-occupied | Renter-occupied |
| Single Unit, Detached | 414 (80.2%) | 102 (19.8%) |
| Single Unit, Attached | 4 (44.4%) | 5 (55.6%) |
| 2 Unit Apartments | 0 (0.0%) | 22 (100.0%) |
| 3 or 4 Unit Apartments | 7 (14.0%) | 43 (86.0%) |
| 5 to 9 Unit Apartments | 0 (0.0%) | 26 (100.0%) |
| 10 or more Apartments | 0 (0.0%) | 92 (100.0%) |
| Mobile Home / Other | 22 (100.0%) | 0 (0.0%) |
| Total | 447 (60.7%) | 290 (39.4%) |
Housing Structures by Number of Rooms in Trumansburg
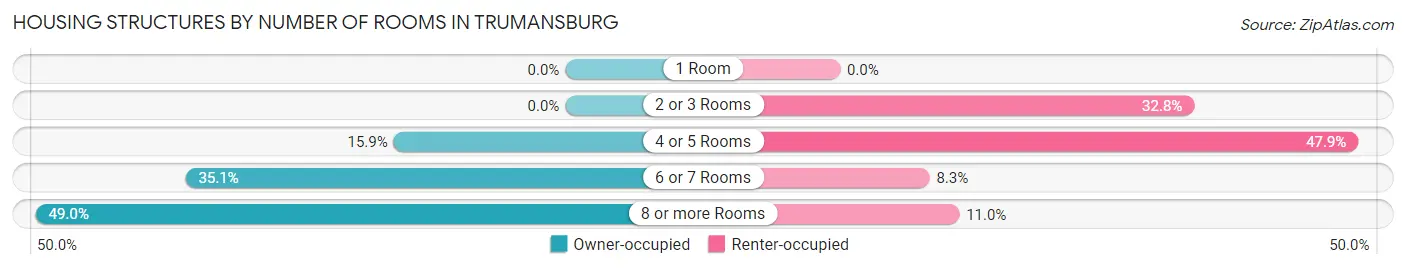
| Number of Rooms | Owner-occupied | Renter-occupied |
| 1 Room | 0 (0.0%) | 0 (0.0%) |
| 2 or 3 Rooms | 0 (0.0%) | 95 (32.8%) |
| 4 or 5 Rooms | 71 (15.9%) | 139 (47.9%) |
| 6 or 7 Rooms | 157 (35.1%) | 24 (8.3%) |
| 8 or more Rooms | 219 (49.0%) | 32 (11.0%) |
| Total | 447 (100.0%) | 290 (100.0%) |
Housing Structure by Heating Type in Trumansburg
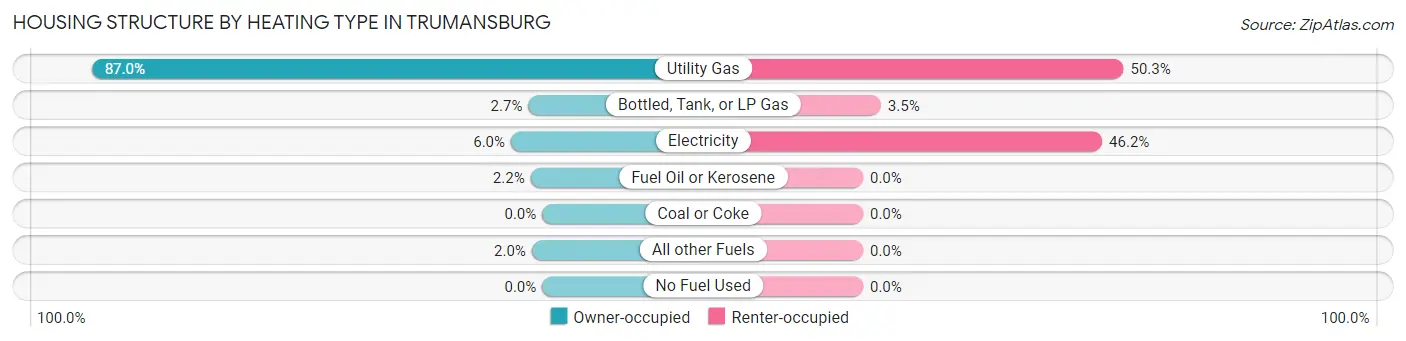
| Heating Type | Owner-occupied | Renter-occupied |
| Utility Gas | 389 (87.0%) | 146 (50.3%) |
| Bottled, Tank, or LP Gas | 12 (2.7%) | 10 (3.5%) |
| Electricity | 27 (6.0%) | 134 (46.2%) |
| Fuel Oil or Kerosene | 10 (2.2%) | 0 (0.0%) |
| Coal or Coke | 0 (0.0%) | 0 (0.0%) |
| All other Fuels | 9 (2.0%) | 0 (0.0%) |
| No Fuel Used | 0 (0.0%) | 0 (0.0%) |
| Total | 447 (100.0%) | 290 (100.0%) |
Household Vehicle Usage in Trumansburg
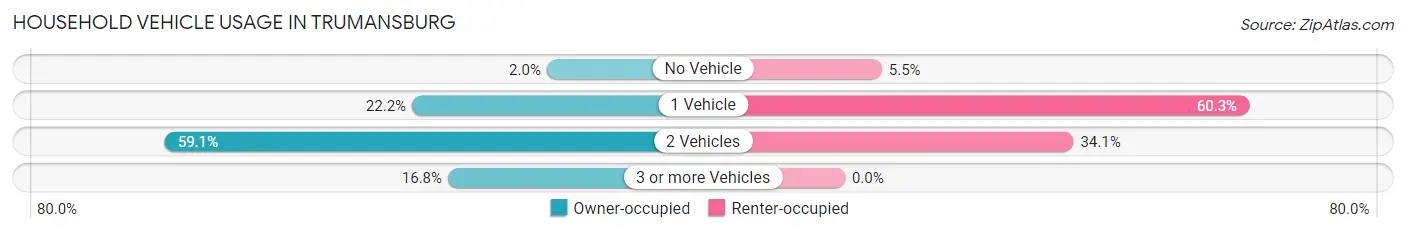
| Vehicles per Household | Owner-occupied | Renter-occupied |
| No Vehicle | 9 (2.0%) | 16 (5.5%) |
| 1 Vehicle | 99 (22.2%) | 175 (60.3%) |
| 2 Vehicles | 264 (59.1%) | 99 (34.1%) |
| 3 or more Vehicles | 75 (16.8%) | 0 (0.0%) |
| Total | 447 (100.0%) | 290 (100.0%) |
Real Estate & Mortgages in Trumansburg
Real Estate and Mortgage Overview in Trumansburg
| Characteristic | Without Mortgage | With Mortgage |
| Housing Units | 209 | 238 |
| Median Property Value | $254,500 | $276,900 |
| Median Household Income | $82,813 | $94 |
| Monthly Housing Costs | $790 | $21 |
| Real Estate Taxes | $6,199 | $0 |
Property Value by Mortgage Status in Trumansburg
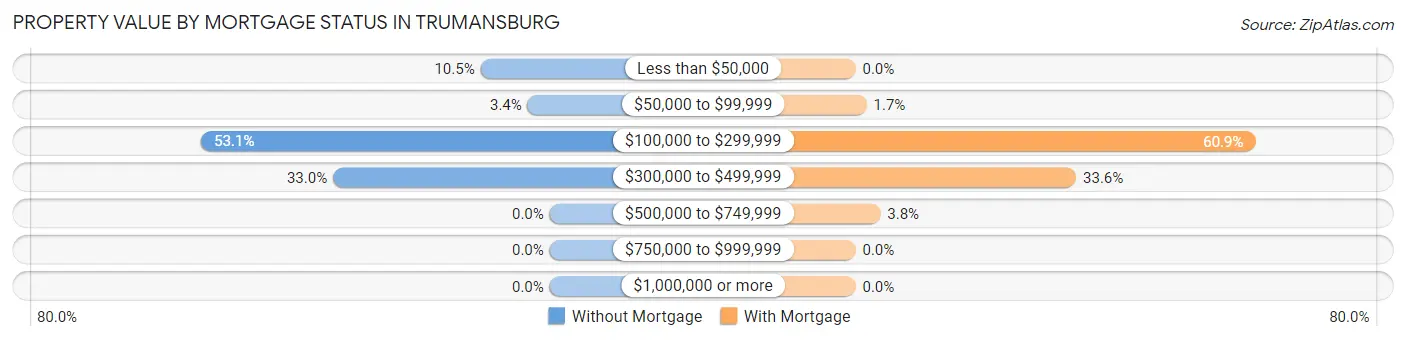
| Property Value | Without Mortgage | With Mortgage |
| Less than $50,000 | 22 (10.5%) | 0 (0.0%) |
| $50,000 to $99,999 | 7 (3.4%) | 4 (1.7%) |
| $100,000 to $299,999 | 111 (53.1%) | 145 (60.9%) |
| $300,000 to $499,999 | 69 (33.0%) | 80 (33.6%) |
| $500,000 to $749,999 | 0 (0.0%) | 9 (3.8%) |
| $750,000 to $999,999 | 0 (0.0%) | 0 (0.0%) |
| $1,000,000 or more | 0 (0.0%) | 0 (0.0%) |
| Total | 209 (100.0%) | 238 (100.0%) |
Household Income by Mortgage Status in Trumansburg
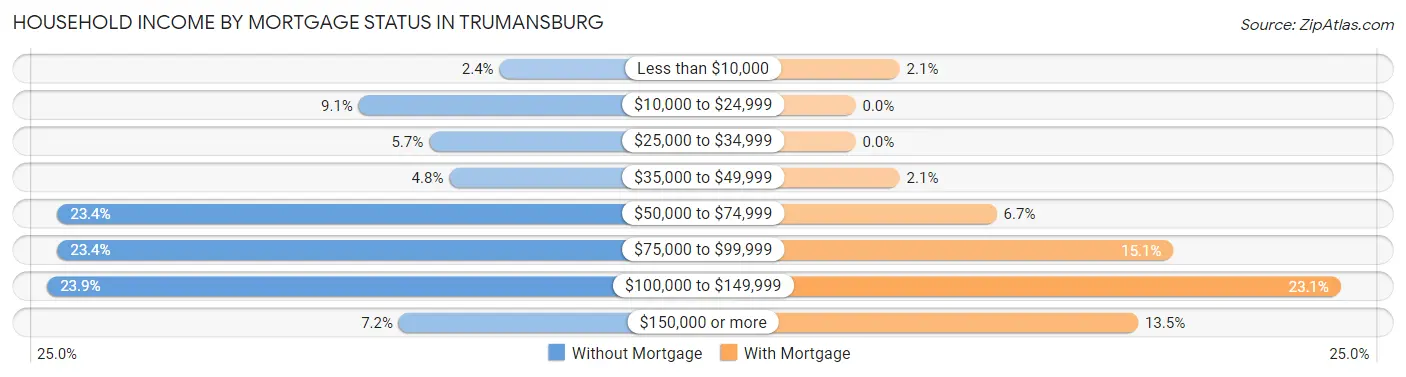
| Household Income | Without Mortgage | With Mortgage |
| Less than $10,000 | 5 (2.4%) | 5 (2.1%) |
| $10,000 to $24,999 | 19 (9.1%) | 0 (0.0%) |
| $25,000 to $34,999 | 12 (5.7%) | 0 (0.0%) |
| $35,000 to $49,999 | 10 (4.8%) | 5 (2.1%) |
| $50,000 to $74,999 | 49 (23.4%) | 16 (6.7%) |
| $75,000 to $99,999 | 49 (23.4%) | 36 (15.1%) |
| $100,000 to $149,999 | 50 (23.9%) | 55 (23.1%) |
| $150,000 or more | 15 (7.2%) | 32 (13.5%) |
| Total | 209 (100.0%) | 238 (100.0%) |
Property Value to Household Income Ratio in Trumansburg
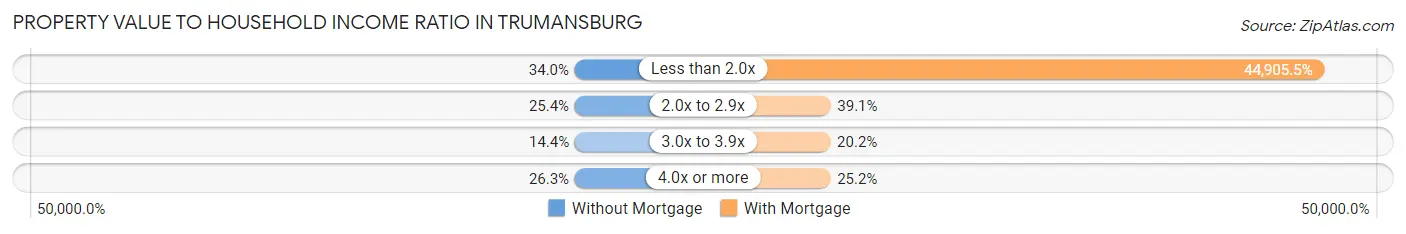
| Value-to-Income Ratio | Without Mortgage | With Mortgage |
| Less than 2.0x | 71 (34.0%) | 106,875 (44,905.5%) |
| 2.0x to 2.9x | 53 (25.4%) | 93 (39.1%) |
| 3.0x to 3.9x | 30 (14.3%) | 48 (20.2%) |
| 4.0x or more | 55 (26.3%) | 60 (25.2%) |
| Total | 209 (100.0%) | 238 (100.0%) |
Real Estate Taxes by Mortgage Status in Trumansburg
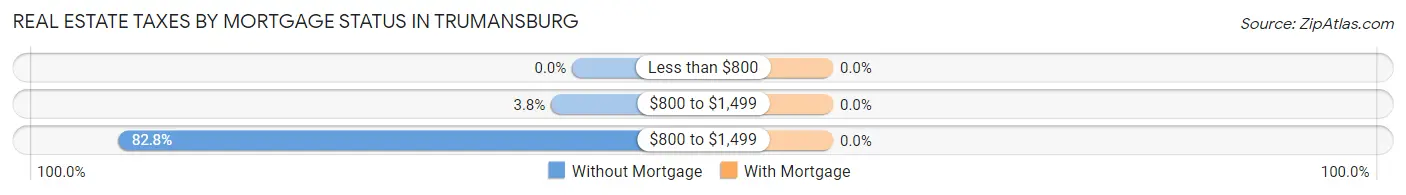
| Property Taxes | Without Mortgage | With Mortgage |
| Less than $800 | 0 (0.0%) | 0 (0.0%) |
| $800 to $1,499 | 8 (3.8%) | 0 (0.0%) |
| $800 to $1,499 | 173 (82.8%) | 0 (0.0%) |
| Total | 209 (100.0%) | 238 (100.0%) |
Health & Disability in Trumansburg
Health Insurance Coverage by Age in Trumansburg
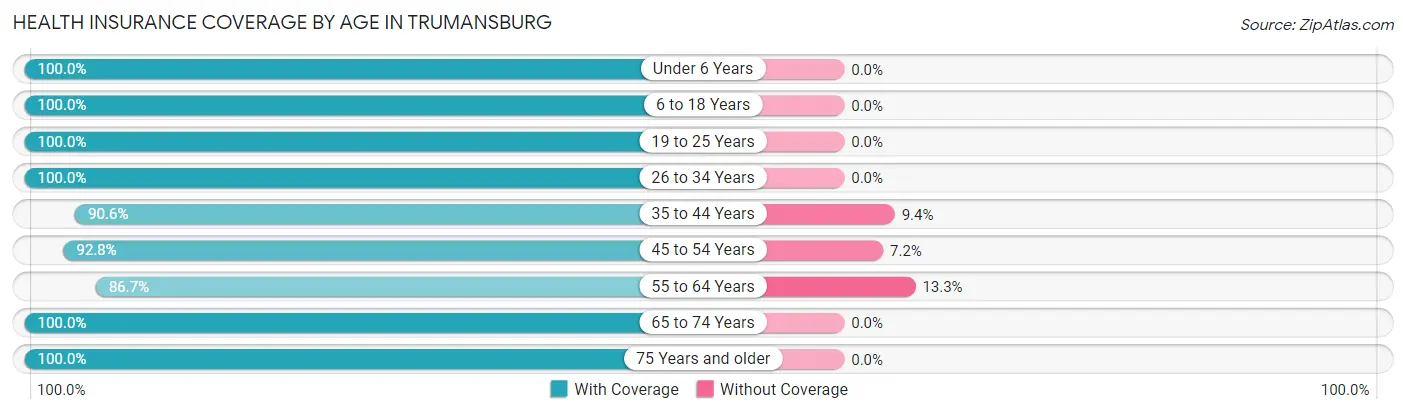
| Age Bracket | With Coverage | Without Coverage |
| Under 6 Years | 79 (100.0%) | 0 (0.0%) |
| 6 to 18 Years | 189 (100.0%) | 0 (0.0%) |
| 19 to 25 Years | 86 (100.0%) | 0 (0.0%) |
| 26 to 34 Years | 46 (100.0%) | 0 (0.0%) |
| 35 to 44 Years | 154 (90.6%) | 16 (9.4%) |
| 45 to 54 Years | 231 (92.8%) | 18 (7.2%) |
| 55 to 64 Years | 170 (86.7%) | 26 (13.3%) |
| 65 to 74 Years | 315 (100.0%) | 0 (0.0%) |
| 75 Years and older | 155 (100.0%) | 0 (0.0%) |
| Total | 1,425 (96.0%) | 60 (4.0%) |
Health Insurance Coverage by Citizenship Status in Trumansburg
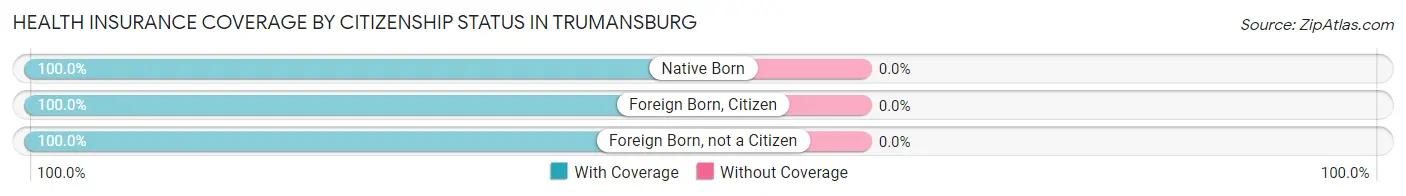
| Citizenship Status | With Coverage | Without Coverage |
| Native Born | 79 (100.0%) | 0 (0.0%) |
| Foreign Born, Citizen | 189 (100.0%) | 0 (0.0%) |
| Foreign Born, not a Citizen | 86 (100.0%) | 0 (0.0%) |
Health Insurance Coverage by Household Income in Trumansburg
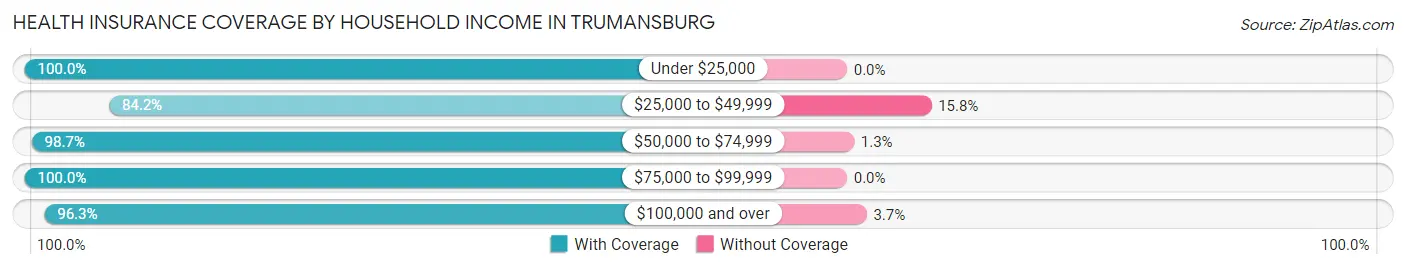
| Household Income | With Coverage | Without Coverage |
| Under $25,000 | 126 (100.0%) | 0 (0.0%) |
| $25,000 to $49,999 | 181 (84.2%) | 34 (15.8%) |
| $50,000 to $74,999 | 298 (98.7%) | 4 (1.3%) |
| $75,000 to $99,999 | 245 (100.0%) | 0 (0.0%) |
| $100,000 and over | 575 (96.3%) | 22 (3.7%) |
Public vs Private Health Insurance Coverage by Age in Trumansburg
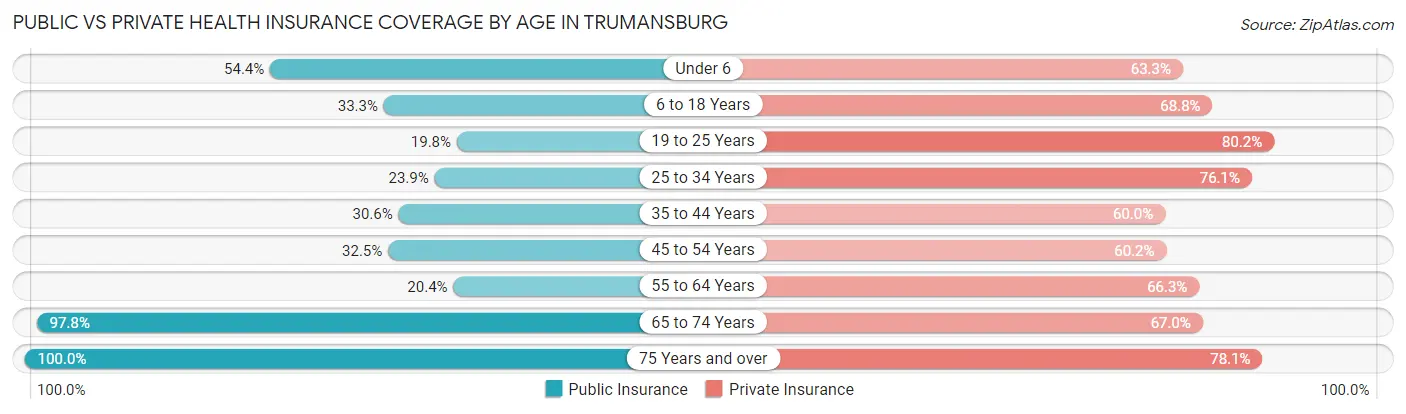
| Age Bracket | Public Insurance | Private Insurance |
| Under 6 | 43 (54.4%) | 50 (63.3%) |
| 6 to 18 Years | 63 (33.3%) | 130 (68.8%) |
| 19 to 25 Years | 17 (19.8%) | 69 (80.2%) |
| 25 to 34 Years | 11 (23.9%) | 35 (76.1%) |
| 35 to 44 Years | 52 (30.6%) | 102 (60.0%) |
| 45 to 54 Years | 81 (32.5%) | 150 (60.2%) |
| 55 to 64 Years | 40 (20.4%) | 130 (66.3%) |
| 65 to 74 Years | 308 (97.8%) | 211 (67.0%) |
| 75 Years and over | 155 (100.0%) | 121 (78.1%) |
| Total | 770 (51.8%) | 998 (67.2%) |
Disability Status by Sex by Age in Trumansburg
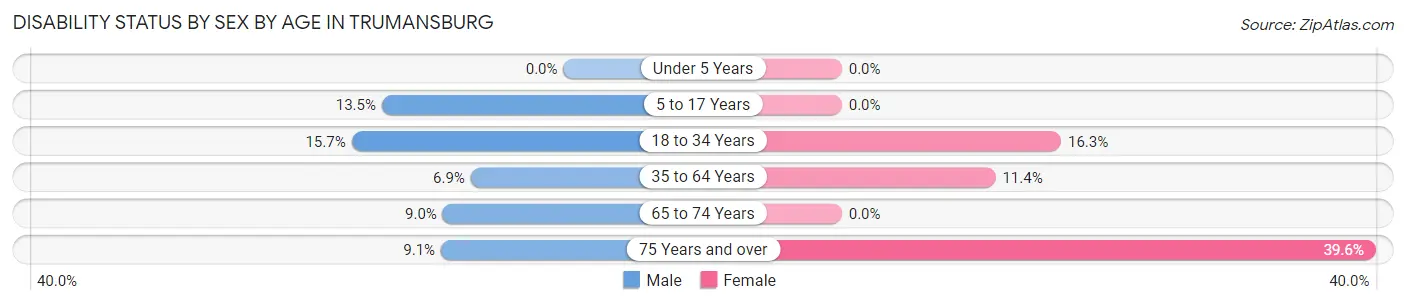
| Age Bracket | Male | Female |
| Under 5 Years | 0 (0.0%) | 0 (0.0%) |
| 5 to 17 Years | 12 (13.5%) | 0 (0.0%) |
| 18 to 34 Years | 14 (15.7%) | 7 (16.3%) |
| 35 to 64 Years | 17 (6.9%) | 42 (11.4%) |
| 65 to 74 Years | 12 (9.0%) | 0 (0.0%) |
| 75 Years and over | 4 (9.1%) | 44 (39.6%) |
Disability Class by Sex by Age in Trumansburg
Disability Class: Hearing Difficulty
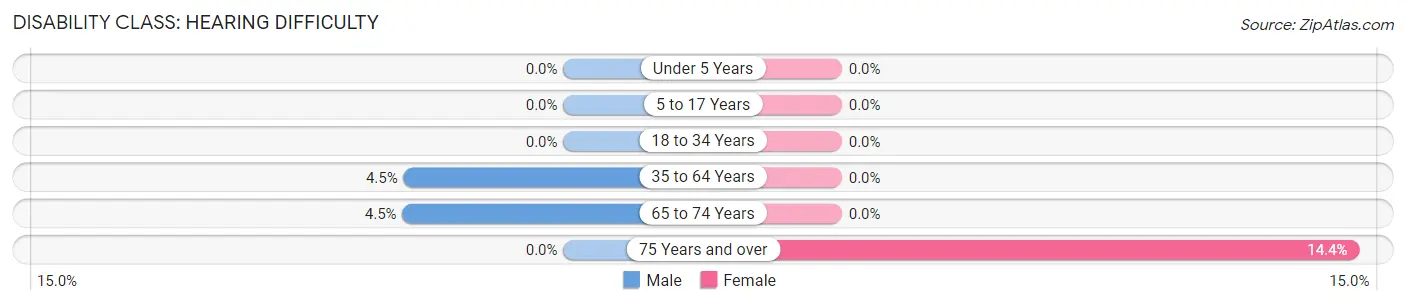
| Age Bracket | Male | Female |
| Under 5 Years | 0 (0.0%) | 0 (0.0%) |
| 5 to 17 Years | 0 (0.0%) | 0 (0.0%) |
| 18 to 34 Years | 0 (0.0%) | 0 (0.0%) |
| 35 to 64 Years | 11 (4.4%) | 0 (0.0%) |
| 65 to 74 Years | 6 (4.5%) | 0 (0.0%) |
| 75 Years and over | 0 (0.0%) | 16 (14.4%) |
Disability Class: Vision Difficulty
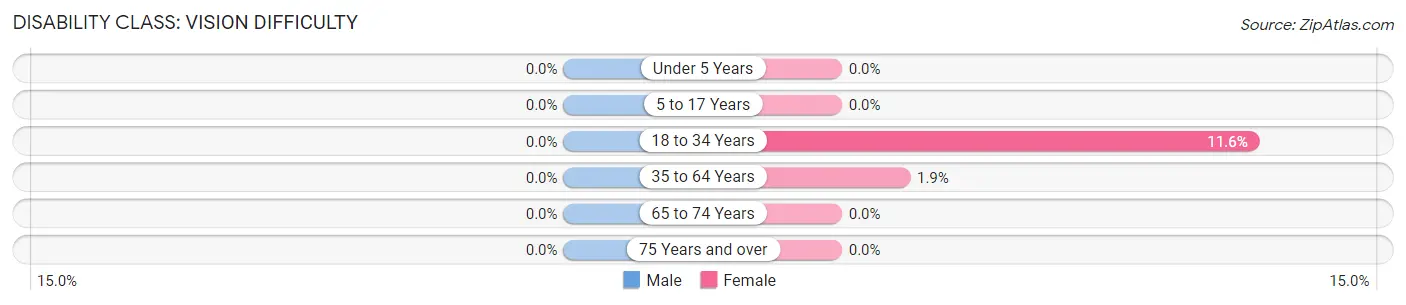
| Age Bracket | Male | Female |
| Under 5 Years | 0 (0.0%) | 0 (0.0%) |
| 5 to 17 Years | 0 (0.0%) | 0 (0.0%) |
| 18 to 34 Years | 0 (0.0%) | 5 (11.6%) |
| 35 to 64 Years | 0 (0.0%) | 7 (1.9%) |
| 65 to 74 Years | 0 (0.0%) | 0 (0.0%) |
| 75 Years and over | 0 (0.0%) | 0 (0.0%) |
Disability Class: Cognitive Difficulty
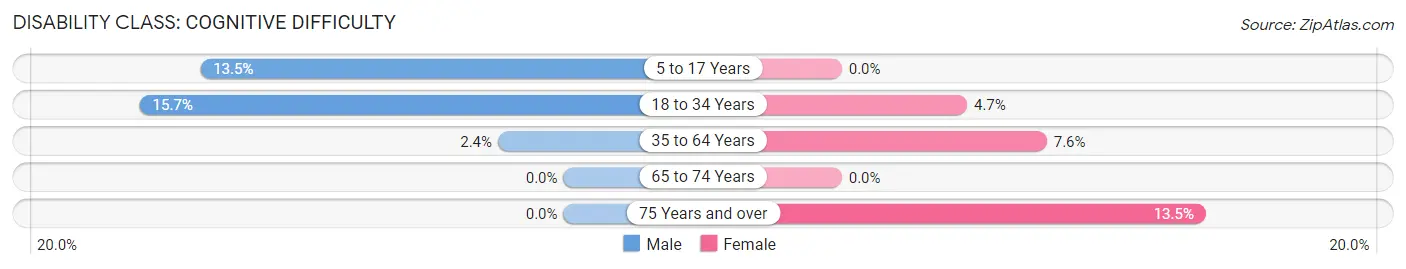
| Age Bracket | Male | Female |
| 5 to 17 Years | 12 (13.5%) | 0 (0.0%) |
| 18 to 34 Years | 14 (15.7%) | 2 (4.6%) |
| 35 to 64 Years | 6 (2.4%) | 28 (7.6%) |
| 65 to 74 Years | 0 (0.0%) | 0 (0.0%) |
| 75 Years and over | 0 (0.0%) | 15 (13.5%) |
Disability Class: Ambulatory Difficulty
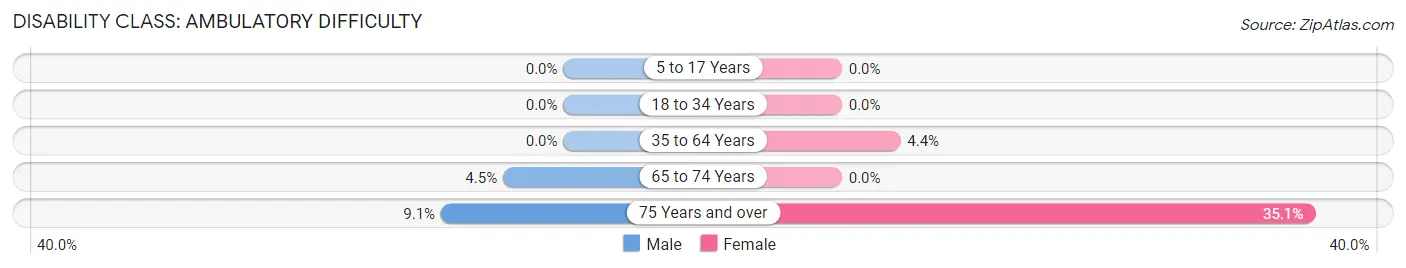
| Age Bracket | Male | Female |
| 5 to 17 Years | 0 (0.0%) | 0 (0.0%) |
| 18 to 34 Years | 0 (0.0%) | 0 (0.0%) |
| 35 to 64 Years | 0 (0.0%) | 16 (4.3%) |
| 65 to 74 Years | 6 (4.5%) | 0 (0.0%) |
| 75 Years and over | 4 (9.1%) | 39 (35.1%) |
Disability Class: Self-Care Difficulty
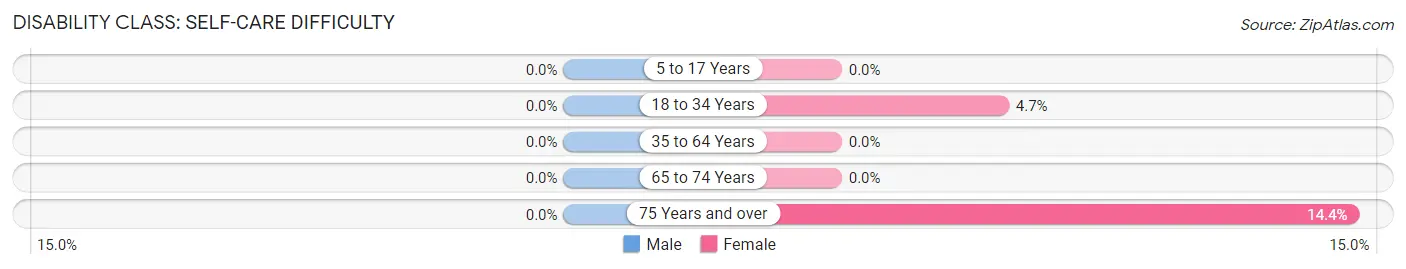
| Age Bracket | Male | Female |
| 5 to 17 Years | 0 (0.0%) | 0 (0.0%) |
| 18 to 34 Years | 0 (0.0%) | 2 (4.6%) |
| 35 to 64 Years | 0 (0.0%) | 0 (0.0%) |
| 65 to 74 Years | 0 (0.0%) | 0 (0.0%) |
| 75 Years and over | 0 (0.0%) | 16 (14.4%) |
Technology Access in Trumansburg
Computing Device Access in Trumansburg
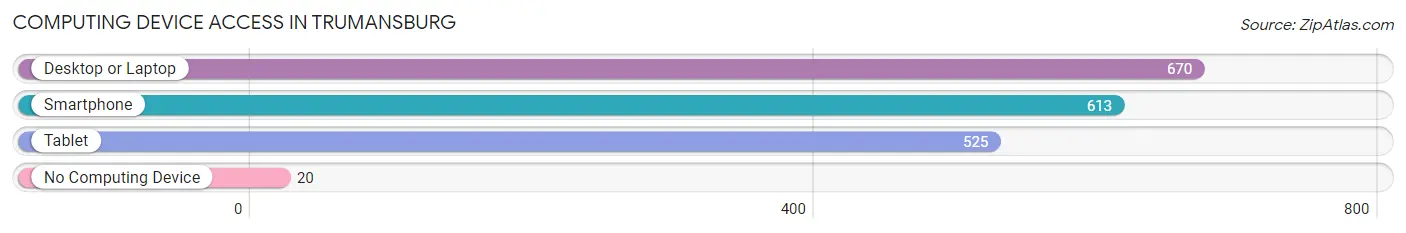
| Device Type | # Households | % Households |
| Desktop or Laptop | 670 | 90.9% |
| Smartphone | 613 | 83.2% |
| Tablet | 525 | 71.2% |
| No Computing Device | 20 | 2.7% |
| Total | 737 | 100.0% |
Internet Access in Trumansburg
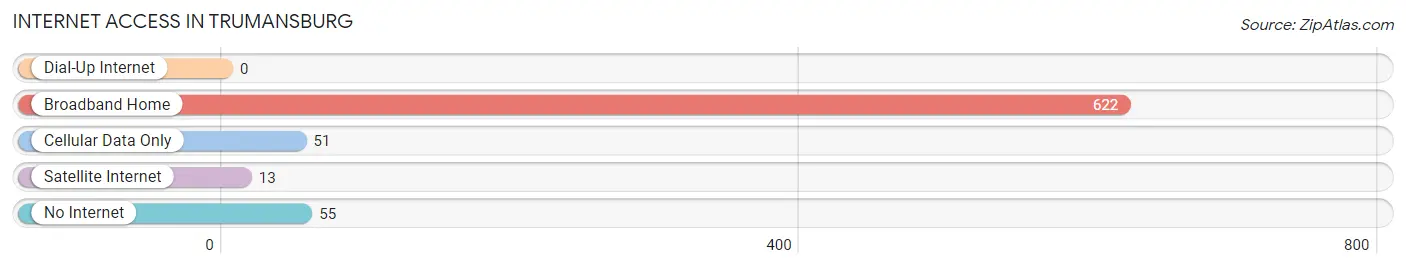
| Internet Type | # Households | % Households |
| Dial-Up Internet | 0 | 0.0% |
| Broadband Home | 622 | 84.4% |
| Cellular Data Only | 51 | 6.9% |
| Satellite Internet | 13 | 1.8% |
| No Internet | 55 | 7.5% |
| Total | 737 | 100.0% |
Trumansburg Summary
Trumansburg, New York is a small village located in Tompkins County, New York. It is situated on the eastern shore of Cayuga Lake, about 10 miles south of Ithaca. The village has a population of about 1,800 people and is part of the Ithaca metropolitan area.
History
Trumansburg was founded in 1791 by John Truman, a Revolutionary War veteran. The village was originally known as “Truman’s Burg” and was later shortened to Trumansburg. The village was incorporated in 1817 and was named after John Truman.
Trumansburg was an important stop on the Underground Railroad, with many of the local residents helping to hide and transport escaped slaves. The village was also home to the first African-American church in Tompkins County, the African Methodist Episcopal Zion Church, which was founded in 1845.
Geography
Trumansburg is located in the Finger Lakes region of New York. The village is situated on the eastern shore of Cayuga Lake, about 10 miles south of Ithaca. The village is surrounded by rolling hills and is located in a rural area. The village is located in the Finger Lakes National Forest, which is a popular destination for outdoor recreation.
The climate in Trumansburg is humid continental, with cold winters and warm summers. The average annual temperature is around 50 degrees Fahrenheit. The average annual precipitation is around 40 inches.
Economy
Trumansburg’s economy is largely based on tourism and agriculture. The village is home to several wineries, breweries, and distilleries, which attract visitors from all over the region. The village is also home to several small businesses, including restaurants, shops, and galleries.
The village is also home to several educational institutions, including the State University of New York at Cortland and Tompkins Cortland Community College. The village is also home to several parks and recreational areas, including the Finger Lakes National Forest and the Robert H. Treman State Park.
Demographics
As of the 2010 census, the population of Trumansburg was 1,819. The racial makeup of the village was 94.3% White, 1.3% African American, 0.3% Native American, 1.2% Asian, 0.1% Pacific Islander, 1.2% from other races, and 1.7% from two or more races. Hispanic or Latino of any race were 3.2% of the population.
The median income for a household in Trumansburg was $45,938, and the median income for a family was $54,844. The per capita income for the village was $22,945. About 8.2% of families and 11.2% of the population were below the poverty line, including 15.2% of those under age 18 and 5.2% of those age 65 or over.
Trumansburg is a small village with a rich history and a vibrant economy. The village is home to several wineries, breweries, and distilleries, as well as educational institutions and recreational areas. The village has a diverse population and a median income that is slightly higher than the national average. Trumansburg is a great place to live and visit, and it is sure to continue to be a popular destination for many years to come.
Common Questions
What is Per Capita Income in Trumansburg?
Per Capita income in Trumansburg is $44,209.
What is the Median Family Income in Trumansburg?
Median Family Income in Trumansburg is $93,438.
What is the Median Household income in Trumansburg?
Median Household Income in Trumansburg is $68,309.
What is Income or Wage Gap in Trumansburg?
Income or Wage Gap in Trumansburg is 14.9%.
Women in Trumansburg earn 85.1 cents for every dollar earned by a man.
What is Inequality or Gini Index in Trumansburg?
Inequality or Gini Index in Trumansburg is 0.43.
What is the Total Population of Trumansburg?
Total Population of Trumansburg is 1,485.
What is the Total Male Population of Trumansburg?
Total Male Population of Trumansburg is 614.
What is the Total Female Population of Trumansburg?
Total Female Population of Trumansburg is 871.
What is the Ratio of Males per 100 Females in Trumansburg?
There are 70.49 Males per 100 Females in Trumansburg.
What is the Ratio of Females per 100 Males in Trumansburg?
There are 141.86 Females per 100 Males in Trumansburg.
What is the Median Population Age in Trumansburg?
Median Population Age in Trumansburg is 50.7 Years.
What is the Average Family Size in Trumansburg
Average Family Size in Trumansburg is 2.6 People.
What is the Average Household Size in Trumansburg
Average Household Size in Trumansburg is 2.0 People.
How Large is the Labor Force in Trumansburg?
There are 659 People in the Labor Forcein in Trumansburg.
What is the Percentage of People in the Labor Force in Trumansburg?
53.8% of People are in the Labor Force in Trumansburg.
What is the Unemployment Rate in Trumansburg?
Unemployment Rate in Trumansburg is 3.6%.