Bronxville, NY Map & Demographics
Bronxville Map
Bronxville Overview
$137,579
PER CAPITA INCOME
$250,001
AVG FAMILY INCOME
$206,850
AVG HOUSEHOLD INCOME
32.5%
WAGE / INCOME GAP [ % ]
67.5¢/ $1
WAGE / INCOME GAP [ $ ]
0.57
INEQUALITY / GINI INDEX
6,570
TOTAL POPULATION
3,141
MALE POPULATION
3,429
FEMALE POPULATION
91.60
MALES / 100 FEMALES
109.17
FEMALES / 100 MALES
37.9
MEDIAN AGE
3.4
AVG FAMILY SIZE
3.0
AVG HOUSEHOLD SIZE
2,872
LABOR FORCE [ PEOPLE ]
59.2%
PERCENT IN LABOR FORCE
3.5%
UNEMPLOYMENT RATE
Bronxville Zip Codes
Bronxville Area Codes
Income in Bronxville
Income Overview in Bronxville
Per Capita Income in Bronxville is $137,579, while median incomes of families and households are $250,001 and $206,850 respectively.
| Characteristic | Number | Measure |
| Per Capita Income | 6,570 | $137,579 |
| Median Family Income | 1,646 | $250,001 |
| Mean Family Income | 1,646 | $488,969 |
| Median Household Income | 2,157 | $206,850 |
| Mean Household Income | 2,157 | $416,514 |
| Income Deficit | 1,646 | $0 |
| Wage / Income Gap (%) | 6,570 | 32.54% |
| Wage / Income Gap ($) | 6,570 | 67.46¢ per $1 |
| Gini / Inequality Index | 6,570 | 0.57 |
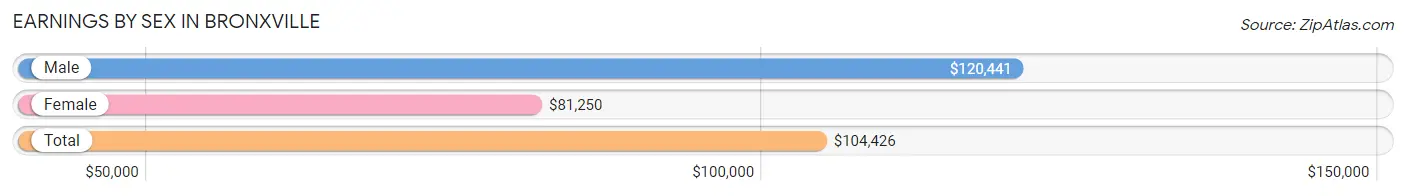
Earnings by Sex in Bronxville
Average Earnings in Bronxville are $104,426, $120,441 for men and $81,250 for women, a difference of 32.5%.
| Sex | Number | Average Earnings |
| Male | 1,788 (58.2%) | $120,441 |
| Female | 1,287 (41.8%) | $81,250 |
| Total | 3,075 (100.0%) | $104,426 |
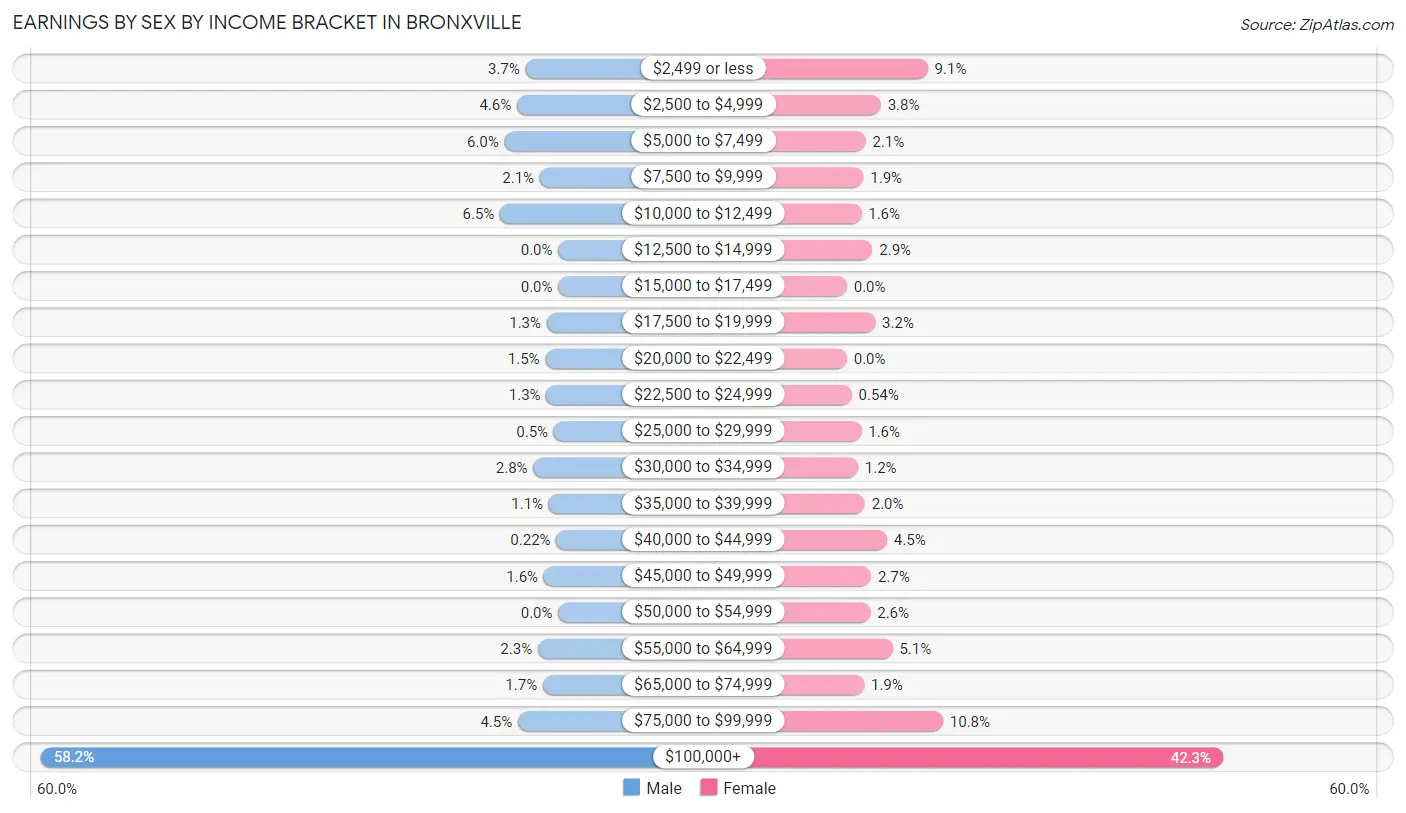
Earnings by Sex by Income Bracket in Bronxville
The most common earnings brackets in Bronxville are $100,000+ for men (1,040 | 58.2%) and $100,000+ for women (544 | 42.3%).
| Income | Male | Female |
| $2,499 or less | 66 (3.7%) | 117 (9.1%) |
| $2,500 to $4,999 | 83 (4.6%) | 49 (3.8%) |
| $5,000 to $7,499 | 108 (6.0%) | 27 (2.1%) |
| $7,500 to $9,999 | 37 (2.1%) | 24 (1.9%) |
| $10,000 to $12,499 | 117 (6.5%) | 21 (1.6%) |
| $12,500 to $14,999 | 0 (0.0%) | 37 (2.9%) |
| $15,000 to $17,499 | 0 (0.0%) | 0 (0.0%) |
| $17,500 to $19,999 | 23 (1.3%) | 41 (3.2%) |
| $20,000 to $22,499 | 26 (1.5%) | 0 (0.0%) |
| $22,500 to $24,999 | 24 (1.3%) | 7 (0.5%) |
| $25,000 to $29,999 | 9 (0.5%) | 21 (1.6%) |
| $30,000 to $34,999 | 50 (2.8%) | 16 (1.2%) |
| $35,000 to $39,999 | 19 (1.1%) | 26 (2.0%) |
| $40,000 to $44,999 | 4 (0.2%) | 58 (4.5%) |
| $45,000 to $49,999 | 29 (1.6%) | 35 (2.7%) |
| $50,000 to $54,999 | 0 (0.0%) | 34 (2.6%) |
| $55,000 to $64,999 | 41 (2.3%) | 66 (5.1%) |
| $65,000 to $74,999 | 31 (1.7%) | 25 (1.9%) |
| $75,000 to $99,999 | 81 (4.5%) | 139 (10.8%) |
| $100,000+ | 1,040 (58.2%) | 544 (42.3%) |
| Total | 1,788 (100.0%) | 1,287 (100.0%) |
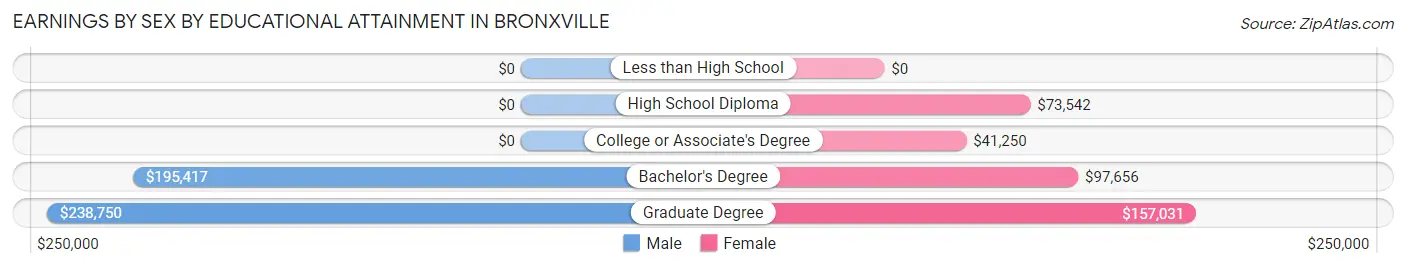
Earnings by Sex by Educational Attainment in Bronxville
Average earnings in Bronxville are $174,157 for men and $103,616 for women, a difference of 40.5%. Men with an educational attainment of graduate degree enjoy the highest average annual earnings of $238,750, while those with bachelor's degree education earn the least with $195,417. Women with an educational attainment of graduate degree earn the most with the average annual earnings of $157,031, while those with college or associate's degree education have the smallest earnings of $41,250.
| Educational Attainment | Male Income | Female Income |
| Less than High School | - | - |
| High School Diploma | - | - |
| College or Associate's Degree | - | - |
| Bachelor's Degree | $195,417 | $97,656 |
| Graduate Degree | $238,750 | $157,031 |
| Total | $174,157 | $103,616 |
Family Income in Bronxville
Family Income Brackets in Bronxville
According to the Bronxville family income data, there are 1,011 families falling into the $200,000+ income range, which is the most common income bracket and makes up 61.4% of all families.
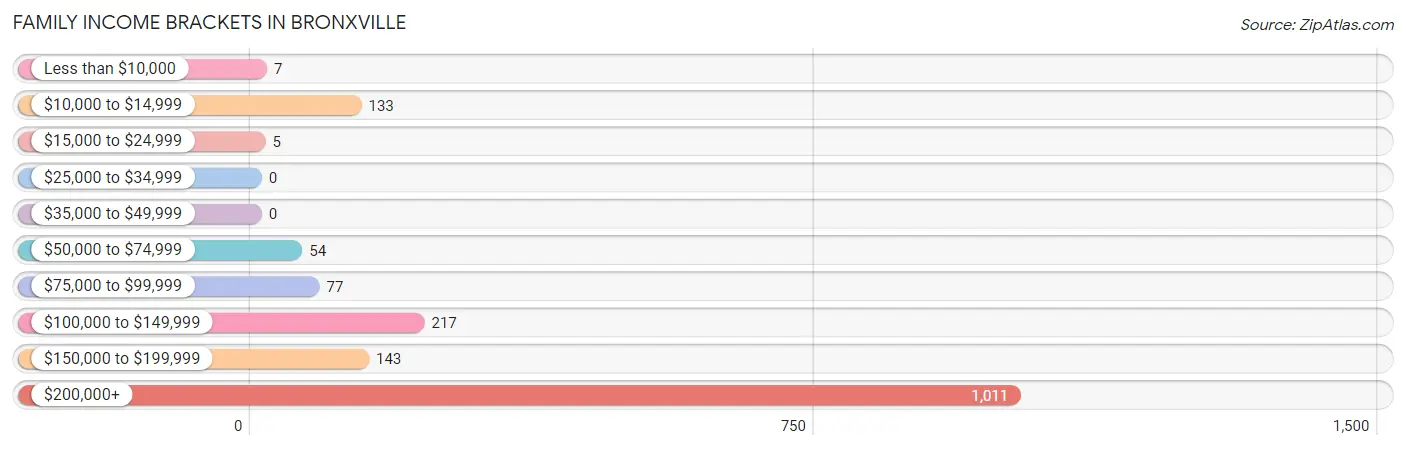
| Income Bracket | # Families | % Families |
| Less than $10,000 | 7 | 0.4% |
| $10,000 to $14,999 | 133 | 8.1% |
| $15,000 to $24,999 | 5 | 0.3% |
| $25,000 to $34,999 | 0 | 0.0% |
| $35,000 to $49,999 | 0 | 0.0% |
| $50,000 to $74,999 | 54 | 3.3% |
| $75,000 to $99,999 | 77 | 4.7% |
| $100,000 to $149,999 | 217 | 13.2% |
| $150,000 to $199,999 | 143 | 8.7% |
| $200,000+ | 1,011 | 61.4% |
Family Income by Famaliy Size in Bronxville
4-person families (373 | 22.7%) account for the highest median family income in Bronxville with $250,001 per family, while 2-person families (641 | 38.9%) have the highest median income of $84,653 per family member.
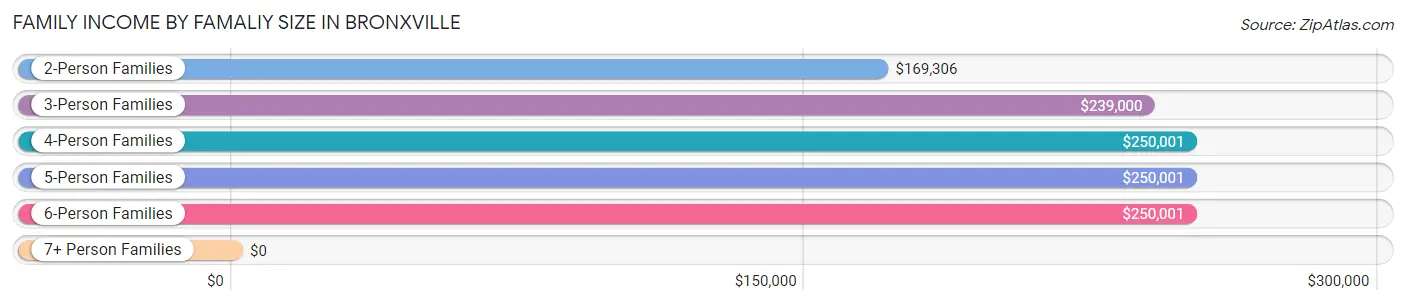
| Income Bracket | # Families | Median Income |
| 2-Person Families | 641 (38.9%) | $169,306 |
| 3-Person Families | 318 (19.3%) | $239,000 |
| 4-Person Families | 373 (22.7%) | $250,001 |
| 5-Person Families | 243 (14.8%) | $250,001 |
| 6-Person Families | 66 (4.0%) | $250,001 |
| 7+ Person Families | 5 (0.3%) | $0 |
| Total | 1,646 (100.0%) | $250,001 |
Family Income by Number of Earners in Bronxville
The median family income in Bronxville is $250,001, with families comprising 2 earners (659) having the highest median family income of $250,001, while families with no earners (170) have the lowest median family income of $131,250, accounting for 40.0% and 10.3% of families, respectively.
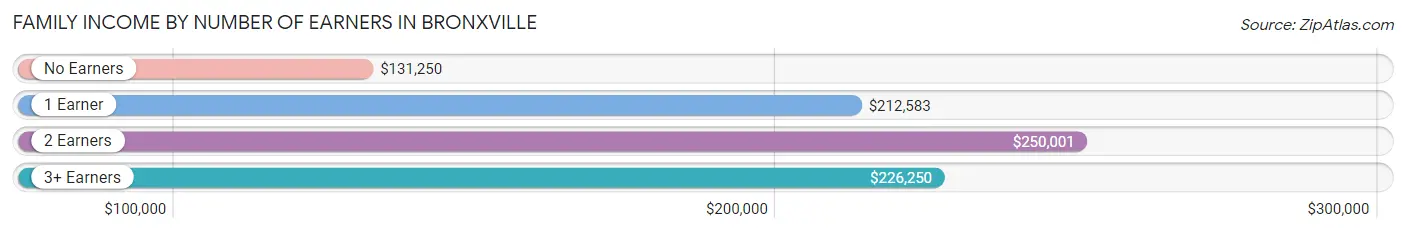
| Number of Earners | # Families | Median Income |
| No Earners | 170 (10.3%) | $131,250 |
| 1 Earner | 673 (40.9%) | $212,583 |
| 2 Earners | 659 (40.0%) | $250,001 |
| 3+ Earners | 144 (8.7%) | $226,250 |
| Total | 1,646 (100.0%) | $250,001 |
Household Income in Bronxville
Household Income Brackets in Bronxville
With 1,122 households falling in the category, the $200,000+ income range is the most frequent in Bronxville, accounting for 52.0% of all households. In contrast, only 6 households (0.3%) fall into the less than $10,000 income bracket, making it the least populous group.
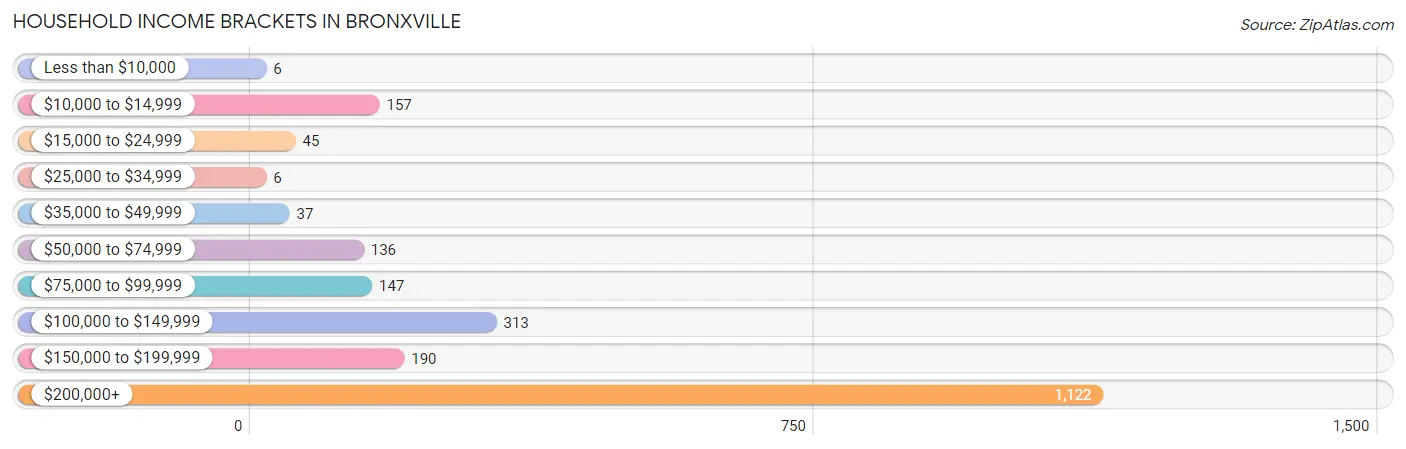
| Income Bracket | # Households | % Households |
| Less than $10,000 | 6 | 0.3% |
| $10,000 to $14,999 | 157 | 7.3% |
| $15,000 to $24,999 | 45 | 2.1% |
| $25,000 to $34,999 | 6 | 0.3% |
| $35,000 to $49,999 | 37 | 1.7% |
| $50,000 to $74,999 | 136 | 6.3% |
| $75,000 to $99,999 | 147 | 6.8% |
| $100,000 to $149,999 | 313 | 14.5% |
| $150,000 to $199,999 | 190 | 8.8% |
| $200,000+ | 1,122 | 52.0% |
Household Income by Householder Age in Bronxville
The median household income in Bronxville is $206,850, with the highest median household income of $250,001 found in the 25 to 44 years age bracket for the primary householder. A total of 425 households (19.7%) fall into this category. Meanwhile, the 15 to 24 years age bracket for the primary householder has the lowest median household income of $0, with 39 households (1.8%) in this group.
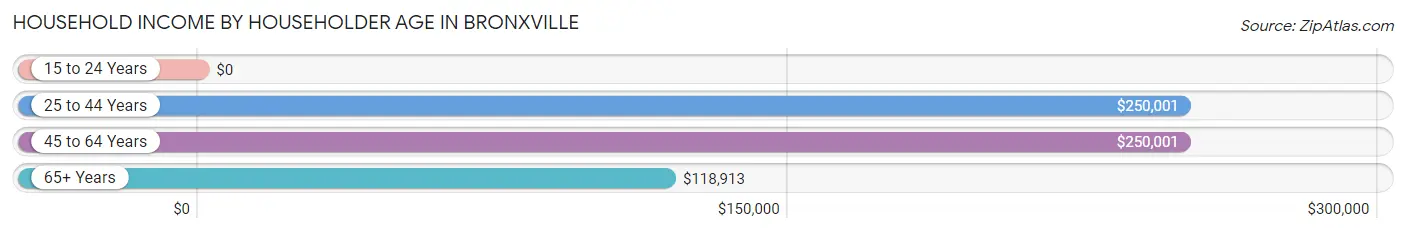
| Income Bracket | # Households | Median Income |
| 15 to 24 Years | 39 (1.8%) | $0 |
| 25 to 44 Years | 425 (19.7%) | $250,001 |
| 45 to 64 Years | 945 (43.8%) | $250,001 |
| 65+ Years | 748 (34.7%) | $118,913 |
| Total | 2,157 (100.0%) | $206,850 |
Poverty in Bronxville
Income Below Poverty by Sex and Age in Bronxville
With 4.8% poverty level for males and 8.1% for females among the residents of Bronxville, 25 to 34 year old males and 18 to 24 year old females are the most vulnerable to poverty, with 100 males (40.3%) and 84 females (30.5%) in their respective age groups living below the poverty level.
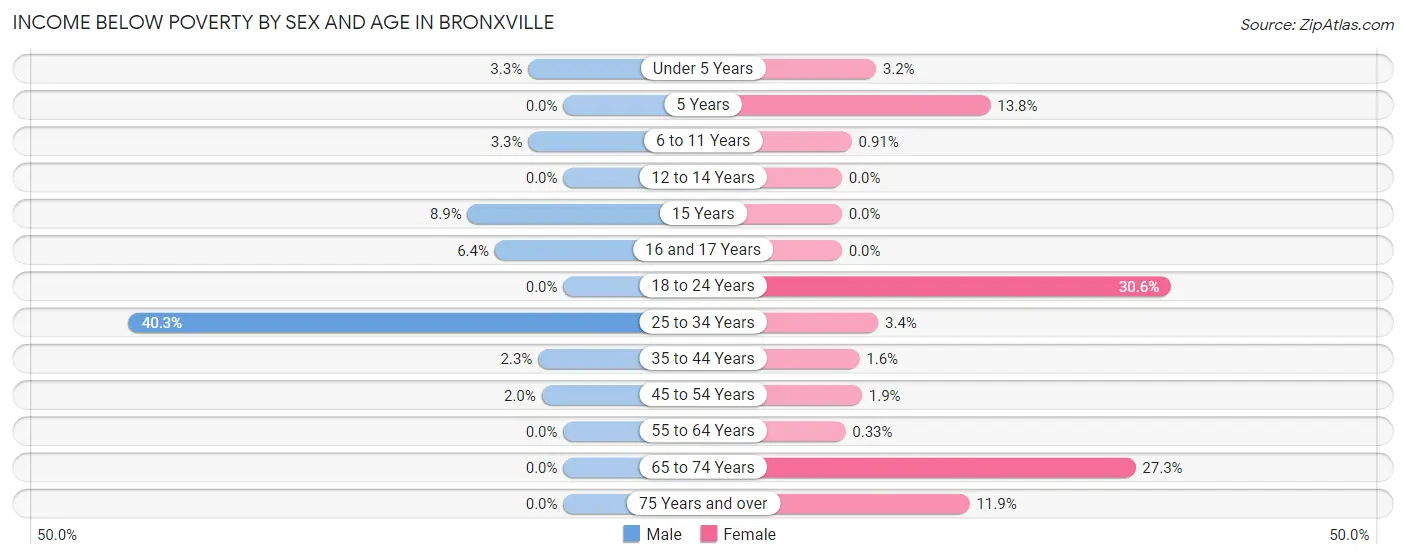
| Age Bracket | Male | Female |
| Under 5 Years | 6 (3.3%) | 6 (3.2%) |
| 5 Years | 0 (0.0%) | 4 (13.8%) |
| 6 to 11 Years | 11 (3.3%) | 4 (0.9%) |
| 12 to 14 Years | 0 (0.0%) | 0 (0.0%) |
| 15 Years | 4 (8.9%) | 0 (0.0%) |
| 16 and 17 Years | 7 (6.4%) | 0 (0.0%) |
| 18 to 24 Years | 0 (0.0%) | 84 (30.5%) |
| 25 to 34 Years | 100 (40.3%) | 7 (3.4%) |
| 35 to 44 Years | 7 (2.3%) | 6 (1.6%) |
| 45 to 54 Years | 11 (2.0%) | 10 (1.9%) |
| 55 to 64 Years | 0 (0.0%) | 1 (0.3%) |
| 65 to 74 Years | 0 (0.0%) | 121 (27.3%) |
| 75 Years and over | 0 (0.0%) | 25 (11.8%) |
| Total | 146 (4.8%) | 268 (8.1%) |
Income Above Poverty by Sex and Age in Bronxville
According to the poverty statistics in Bronxville, males aged 5 years and females aged 12 to 14 years are the age groups that are most secure financially, with 100.0% of males and 100.0% of females in these age groups living above the poverty line.
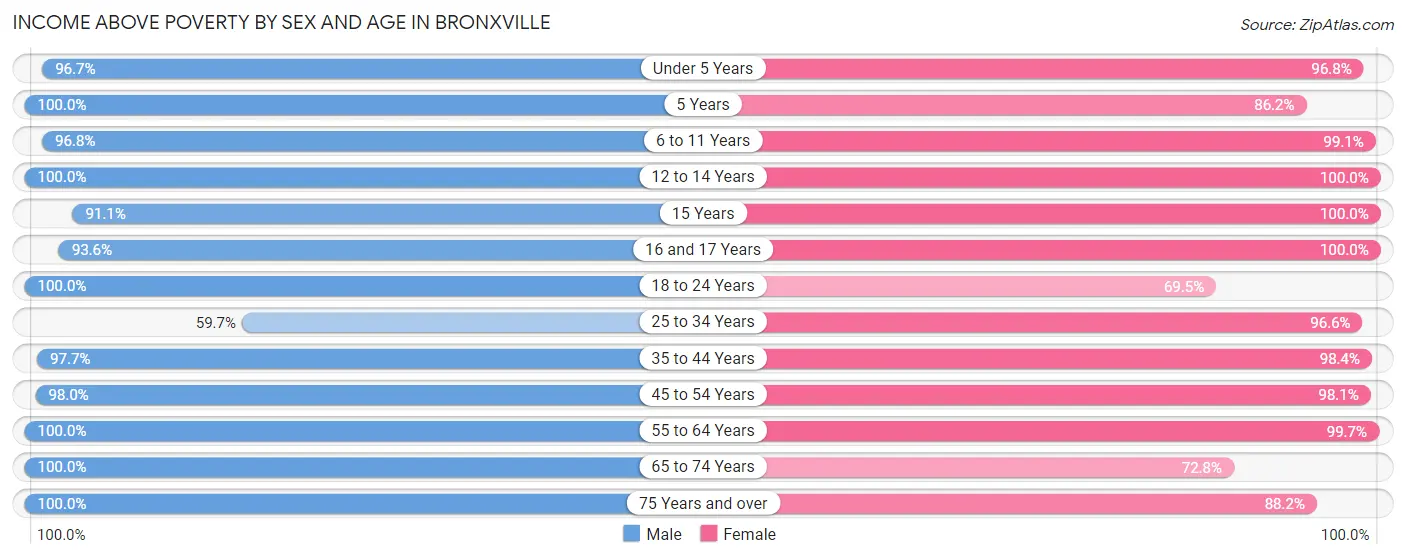
| Age Bracket | Male | Female |
| Under 5 Years | 177 (96.7%) | 184 (96.8%) |
| 5 Years | 11 (100.0%) | 25 (86.2%) |
| 6 to 11 Years | 327 (96.8%) | 434 (99.1%) |
| 12 to 14 Years | 227 (100.0%) | 213 (100.0%) |
| 15 Years | 41 (91.1%) | 21 (100.0%) |
| 16 and 17 Years | 103 (93.6%) | 94 (100.0%) |
| 18 to 24 Years | 254 (100.0%) | 191 (69.5%) |
| 25 to 34 Years | 148 (59.7%) | 201 (96.6%) |
| 35 to 44 Years | 292 (97.7%) | 361 (98.4%) |
| 45 to 54 Years | 533 (98.0%) | 529 (98.1%) |
| 55 to 64 Years | 357 (100.0%) | 298 (99.7%) |
| 65 to 74 Years | 228 (100.0%) | 323 (72.8%) |
| 75 Years and over | 186 (100.0%) | 186 (88.1%) |
| Total | 2,884 (95.2%) | 3,060 (91.9%) |
Income Below Poverty Among Married-Couple Families in Bronxville
The poverty statistics for married-couple families in Bronxville show that 1.4% or 18 of the total 1,281 families live below the poverty line. Families with 3 or 4 children have the highest poverty rate of 4.7%, comprising of 12 families. On the other hand, families with no children have the lowest poverty rate of 0.0%, which includes 0 families.
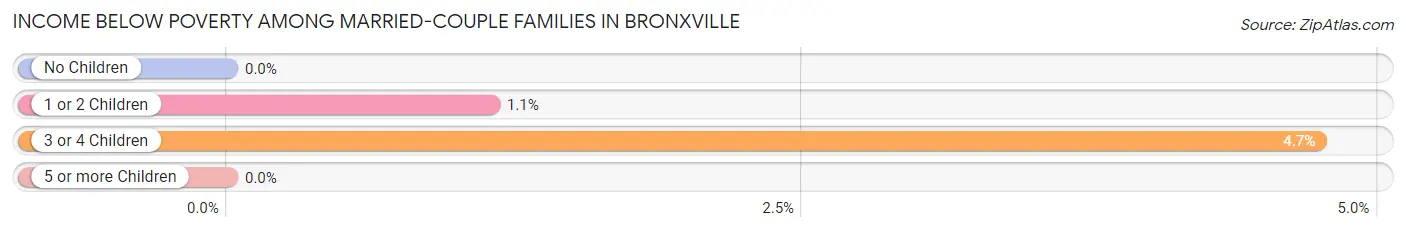
| Children | Above Poverty | Below Poverty |
| No Children | 496 (100.0%) | 0 (0.0%) |
| 1 or 2 Children | 521 (98.9%) | 6 (1.1%) |
| 3 or 4 Children | 241 (95.3%) | 12 (4.7%) |
| 5 or more Children | 5 (100.0%) | 0 (0.0%) |
| Total | 1,263 (98.6%) | 18 (1.4%) |
Income Below Poverty Among Single-Parent Households in Bronxville
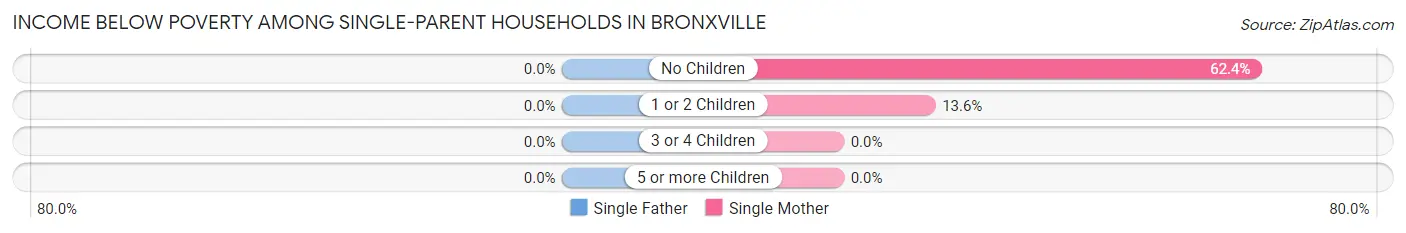
| Children | Single Father | Single Mother |
| No Children | 0 (0.0%) | 121 (62.4%) |
| 1 or 2 Children | 0 (0.0%) | 6 (13.6%) |
| 3 or 4 Children | 0 (0.0%) | 0 (0.0%) |
| 5 or more Children | 0 (0.0%) | 0 (0.0%) |
| Total | 0 (0.0%) | 127 (52.0%) |
Income Below Poverty Among Married-Couple vs Single-Parent Households in Bronxville
The poverty data for Bronxville shows that 18 of the married-couple family households (1.4%) and 127 of the single-parent households (34.8%) are living below the poverty level. Within the married-couple family households, those with 3 or 4 children have the highest poverty rate, with 12 households (4.7%) falling below the poverty line. Among the single-parent households, those with no children have the highest poverty rate, with 121 household (47.3%) living below poverty.
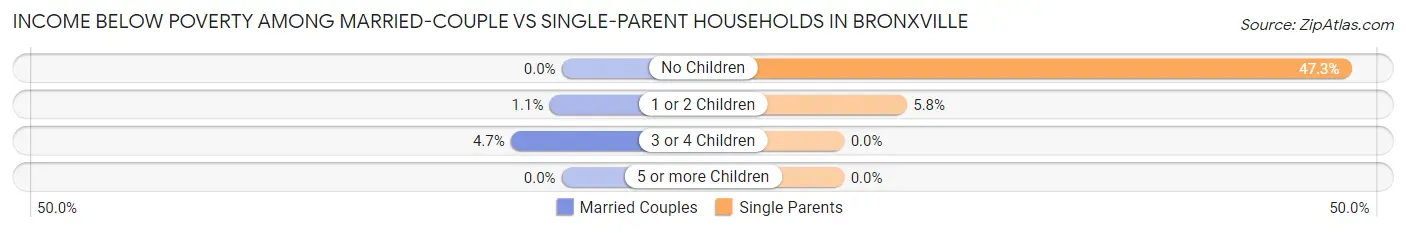
| Children | Married-Couple Families | Single-Parent Households |
| No Children | 0 (0.0%) | 121 (47.3%) |
| 1 or 2 Children | 6 (1.1%) | 6 (5.8%) |
| 3 or 4 Children | 12 (4.7%) | 0 (0.0%) |
| 5 or more Children | 0 (0.0%) | 0 (0.0%) |
| Total | 18 (1.4%) | 127 (34.8%) |
Race in Bronxville
The most populous races in Bronxville are White / Caucasian (5,579 | 84.9%), Hispanic or Latino (480 | 7.3%), and Two or more Races (456 | 6.9%).
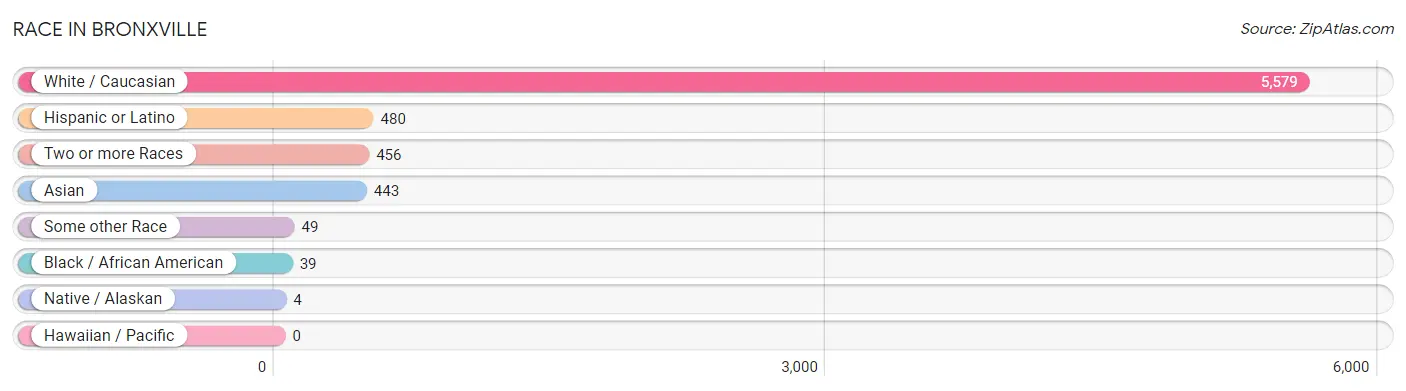
| Race | # Population | % Population |
| Asian | 443 | 6.7% |
| Black / African American | 39 | 0.6% |
| Hawaiian / Pacific | 0 | 0.0% |
| Hispanic or Latino | 480 | 7.3% |
| Native / Alaskan | 4 | 0.1% |
| White / Caucasian | 5,579 | 84.9% |
| Two or more Races | 456 | 6.9% |
| Some other Race | 49 | 0.7% |
| Total | 6,570 | 100.0% |
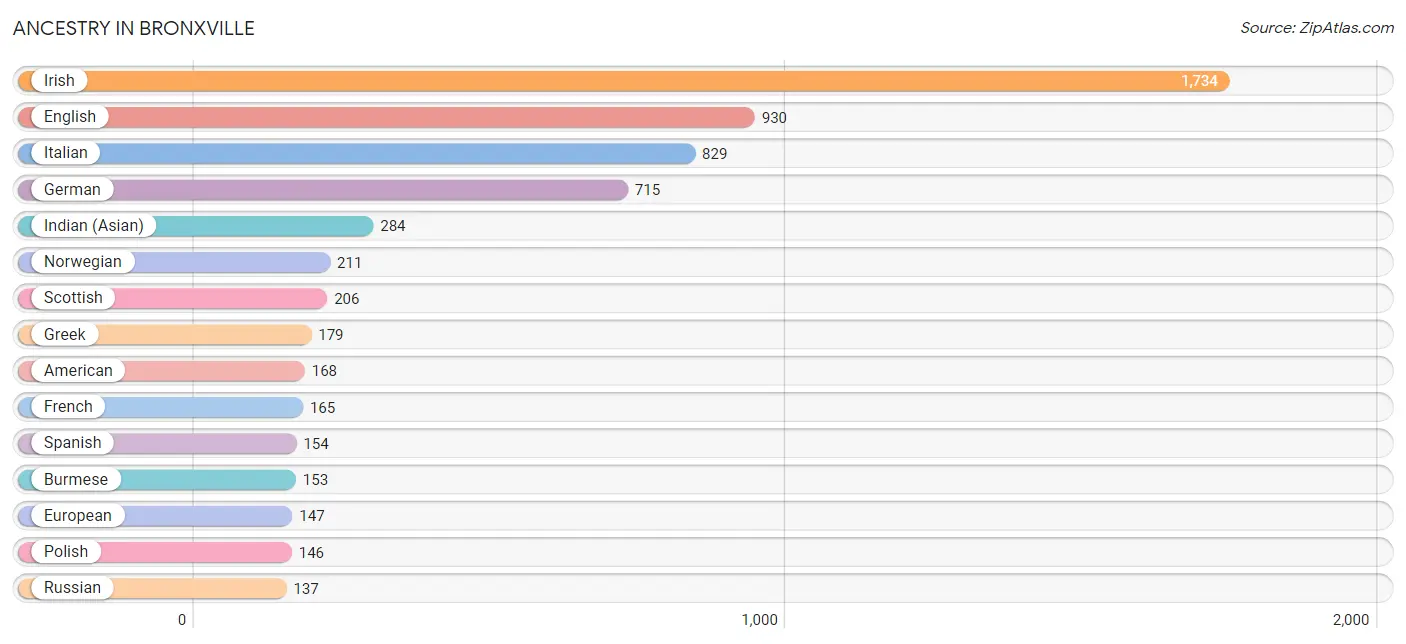
Ancestry in Bronxville
The most populous ancestries reported in Bronxville are Irish (1,734 | 26.4%), English (930 | 14.2%), Italian (829 | 12.6%), German (715 | 10.9%), and Indian (Asian) (284 | 4.3%), together accounting for 68.4% of all Bronxville residents.
| Ancestry | # Population | % Population |
| Albanian | 8 | 0.1% |
| Alsatian | 9 | 0.1% |
| American | 168 | 2.6% |
| Arab | 29 | 0.4% |
| Argentinean | 10 | 0.2% |
| Austrian | 13 | 0.2% |
| Bhutanese | 113 | 1.7% |
| Brazilian | 21 | 0.3% |
| British | 54 | 0.8% |
| Bulgarian | 12 | 0.2% |
| Burmese | 153 | 2.3% |
| Canadian | 7 | 0.1% |
| Central American | 14 | 0.2% |
| Cherokee | 6 | 0.1% |
| Cuban | 7 | 0.1% |
| Czech | 29 | 0.4% |
| Czechoslovakian | 4 | 0.1% |
| Danish | 13 | 0.2% |
| Dominican | 12 | 0.2% |
| Dutch | 50 | 0.8% |
| Eastern European | 38 | 0.6% |
| Ecuadorian | 22 | 0.3% |
| English | 930 | 14.2% |
| European | 147 | 2.2% |
| Finnish | 26 | 0.4% |
| French | 165 | 2.5% |
| French Canadian | 35 | 0.5% |
| German | 715 | 10.9% |
| Greek | 179 | 2.7% |
| Guatemalan | 10 | 0.2% |
| Hungarian | 33 | 0.5% |
| Indian (Asian) | 284 | 4.3% |
| Irish | 1,734 | 26.4% |
| Israeli | 28 | 0.4% |
| Italian | 829 | 12.6% |
| Jamaican | 19 | 0.3% |
| Korean | 4 | 0.1% |
| Lebanese | 29 | 0.4% |
| Lithuanian | 22 | 0.3% |
| Maltese | 18 | 0.3% |
| Mexican | 45 | 0.7% |
| Native Hawaiian | 10 | 0.2% |
| Northern European | 27 | 0.4% |
| Norwegian | 211 | 3.2% |
| Peruvian | 72 | 1.1% |
| Polish | 146 | 2.2% |
| Portuguese | 34 | 0.5% |
| Puerto Rican | 74 | 1.1% |
| Romanian | 7 | 0.1% |
| Russian | 137 | 2.1% |
| Salvadoran | 4 | 0.1% |
| Scotch-Irish | 60 | 0.9% |
| Scottish | 206 | 3.1% |
| Slovak | 1 | 0.0% |
| Slovene | 12 | 0.2% |
| South American | 109 | 1.7% |
| Spaniard | 58 | 0.9% |
| Spanish | 154 | 2.3% |
| Sri Lankan | 7 | 0.1% |
| Swedish | 72 | 1.1% |
| Swiss | 9 | 0.1% |
| Thai | 75 | 1.1% |
| Turkish | 19 | 0.3% |
| Ukrainian | 83 | 1.3% |
| Venezuelan | 5 | 0.1% |
| Welsh | 21 | 0.3% | View All 66 Rows |
Immigrants in Bronxville
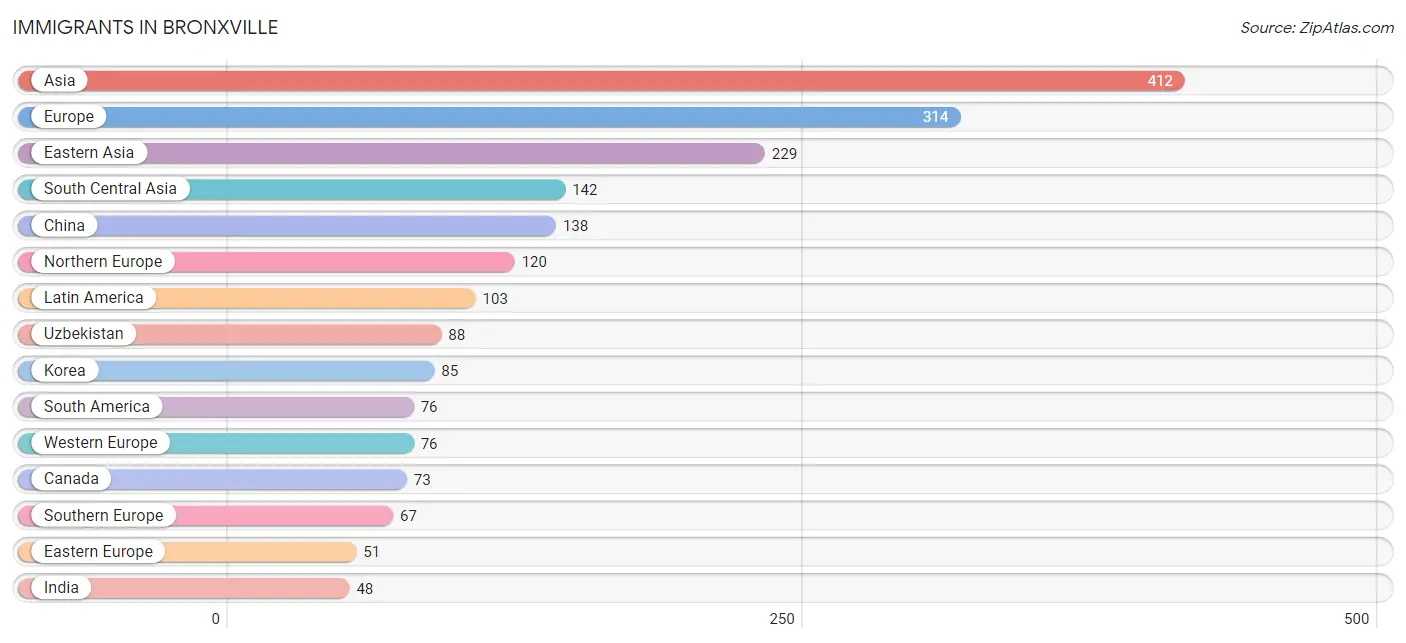
The most numerous immigrant groups reported in Bronxville came from Asia (412 | 6.3%), Europe (314 | 4.8%), Eastern Asia (229 | 3.5%), South Central Asia (142 | 2.2%), and China (138 | 2.1%), together accounting for 18.8% of all Bronxville residents.
| Immigration Origin | # Population | % Population |
| Africa | 7 | 0.1% |
| Albania | 8 | 0.1% |
| Argentina | 10 | 0.2% |
| Asia | 412 | 6.3% |
| Austria | 9 | 0.1% |
| Belarus | 8 | 0.1% |
| Brazil | 33 | 0.5% |
| Canada | 73 | 1.1% |
| Caribbean | 6 | 0.1% |
| Central America | 21 | 0.3% |
| China | 138 | 2.1% |
| Czechoslovakia | 7 | 0.1% |
| Denmark | 5 | 0.1% |
| Dominican Republic | 4 | 0.1% |
| Eastern Africa | 7 | 0.1% |
| Eastern Asia | 229 | 3.5% |
| Eastern Europe | 51 | 0.8% |
| Ecuador | 6 | 0.1% |
| England | 7 | 0.1% |
| Europe | 314 | 4.8% |
| France | 43 | 0.6% |
| Germany | 24 | 0.4% |
| Hong Kong | 17 | 0.3% |
| Hungary | 7 | 0.1% |
| India | 48 | 0.7% |
| Ireland | 12 | 0.2% |
| Italy | 20 | 0.3% |
| Jamaica | 2 | 0.0% |
| Japan | 6 | 0.1% |
| Korea | 85 | 1.3% |
| Latin America | 103 | 1.6% |
| Mexico | 21 | 0.3% |
| Northern Europe | 120 | 1.8% |
| Peru | 27 | 0.4% |
| Russia | 9 | 0.1% |
| South America | 76 | 1.2% |
| South Central Asia | 142 | 2.2% |
| South Eastern Asia | 9 | 0.1% |
| Southern Europe | 67 | 1.0% |
| Spain | 47 | 0.7% |
| Sri Lanka | 6 | 0.1% |
| Sweden | 3 | 0.1% |
| Taiwan | 21 | 0.3% |
| Thailand | 9 | 0.1% |
| Turkey | 27 | 0.4% |
| Ukraine | 12 | 0.2% |
| Uzbekistan | 88 | 1.3% |
| Western Asia | 32 | 0.5% |
| Western Europe | 76 | 1.2% |
| Zimbabwe | 7 | 0.1% | View All 50 Rows |
Sex and Age in Bronxville
Sex and Age in Bronxville
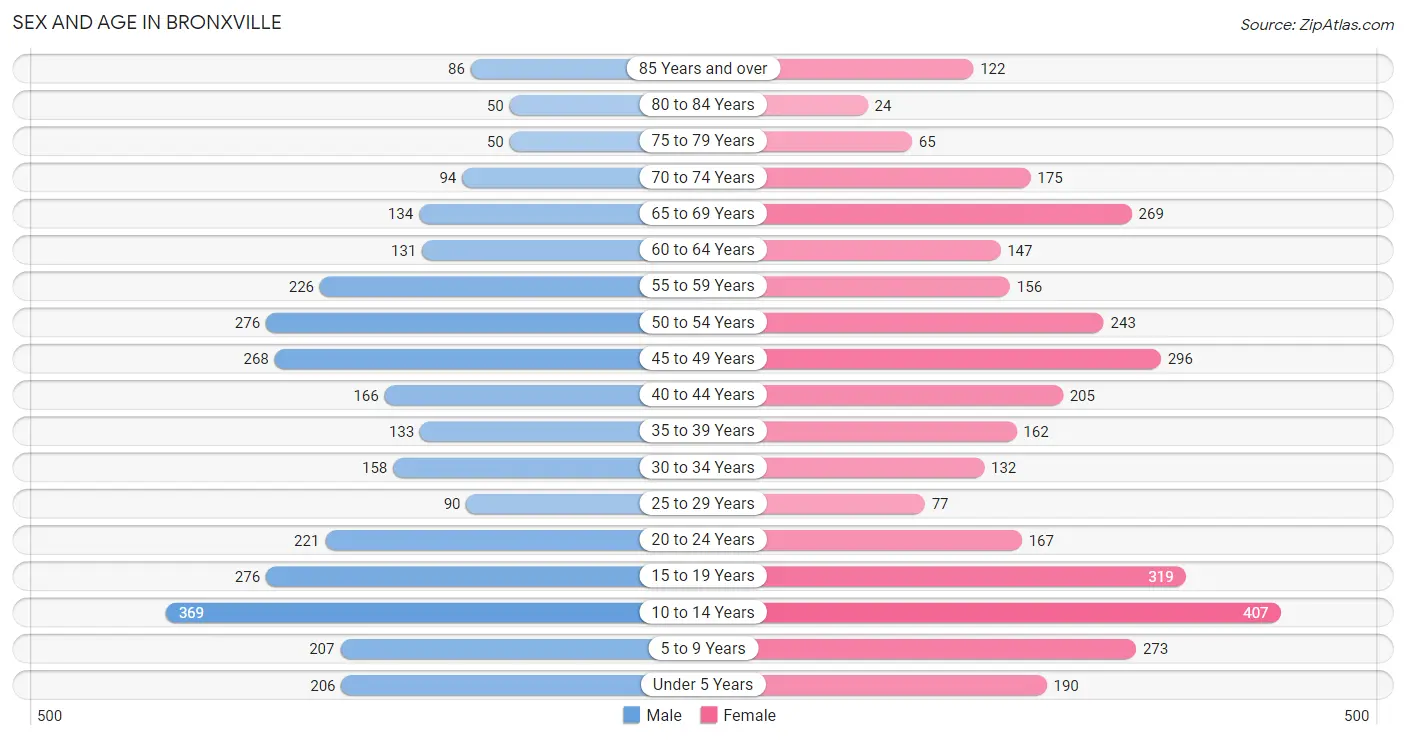
The most populous age groups in Bronxville are 10 to 14 Years (369 | 11.7%) for men and 10 to 14 Years (407 | 11.9%) for women.
| Age Bracket | Male | Female |
| Under 5 Years | 206 (6.6%) | 190 (5.5%) |
| 5 to 9 Years | 207 (6.6%) | 273 (8.0%) |
| 10 to 14 Years | 369 (11.7%) | 407 (11.9%) |
| 15 to 19 Years | 276 (8.8%) | 319 (9.3%) |
| 20 to 24 Years | 221 (7.0%) | 167 (4.9%) |
| 25 to 29 Years | 90 (2.9%) | 77 (2.2%) |
| 30 to 34 Years | 158 (5.0%) | 132 (3.8%) |
| 35 to 39 Years | 133 (4.2%) | 162 (4.7%) |
| 40 to 44 Years | 166 (5.3%) | 205 (6.0%) |
| 45 to 49 Years | 268 (8.5%) | 296 (8.6%) |
| 50 to 54 Years | 276 (8.8%) | 243 (7.1%) |
| 55 to 59 Years | 226 (7.2%) | 156 (4.5%) |
| 60 to 64 Years | 131 (4.2%) | 147 (4.3%) |
| 65 to 69 Years | 134 (4.3%) | 269 (7.8%) |
| 70 to 74 Years | 94 (3.0%) | 175 (5.1%) |
| 75 to 79 Years | 50 (1.6%) | 65 (1.9%) |
| 80 to 84 Years | 50 (1.6%) | 24 (0.7%) |
| 85 Years and over | 86 (2.7%) | 122 (3.6%) |
| Total | 3,141 (100.0%) | 3,429 (100.0%) |
Families and Households in Bronxville
Median Family Size in Bronxville
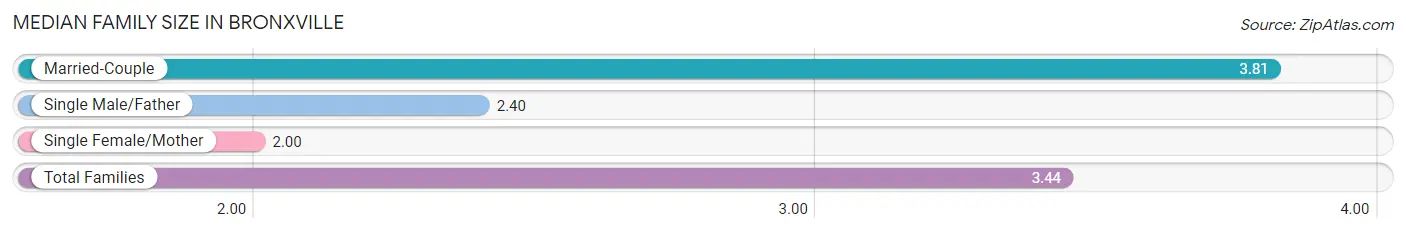
The median family size in Bronxville is 3.44 persons per family, with married-couple families (1,281 | 77.8%) accounting for the largest median family size of 3.81 persons per family. On the other hand, single female/mother families (244 | 14.8%) represent the smallest median family size with 2.00 persons per family.
| Family Type | # Families | Family Size |
| Married-Couple | 1,281 (77.8%) | 3.81 |
| Single Male/Father | 121 (7.3%) | 2.40 |
| Single Female/Mother | 244 (14.8%) | 2.00 |
| Total Families | 1,646 (100.0%) | 3.44 |
Median Household Size in Bronxville
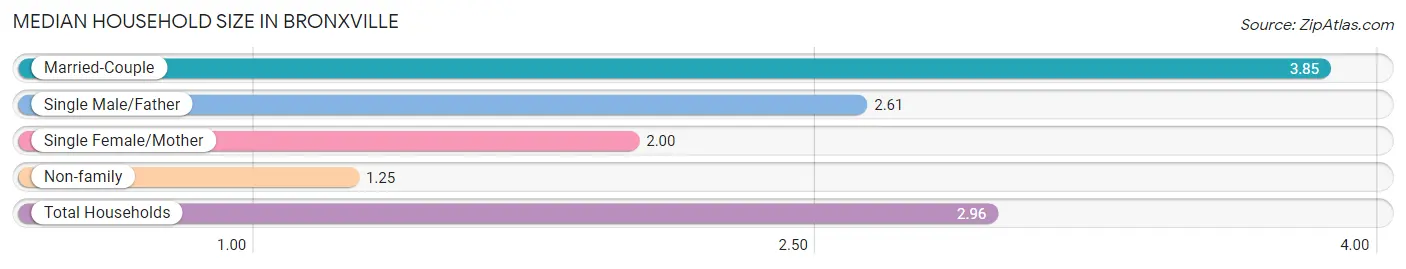
The median household size in Bronxville is 2.96 persons per household, with married-couple households (1,281 | 59.4%) accounting for the largest median household size of 3.85 persons per household. non-family households (511 | 23.7%) represent the smallest median household size with 1.25 persons per household.
| Household Type | # Households | Household Size |
| Married-Couple | 1,281 (59.4%) | 3.85 |
| Single Male/Father | 121 (5.6%) | 2.61 |
| Single Female/Mother | 244 (11.3%) | 2.00 |
| Non-family | 511 (23.7%) | 1.25 |
| Total Households | 2,157 (100.0%) | 2.96 |
Household Size by Marriage Status in Bronxville
Out of a total of 2,157 households in Bronxville, 1,646 (76.3%) are family households, while 511 (23.7%) are nonfamily households. The most numerous type of family households are 2-person households, comprising 613, and the most common type of nonfamily households are 1-person households, comprising 411.
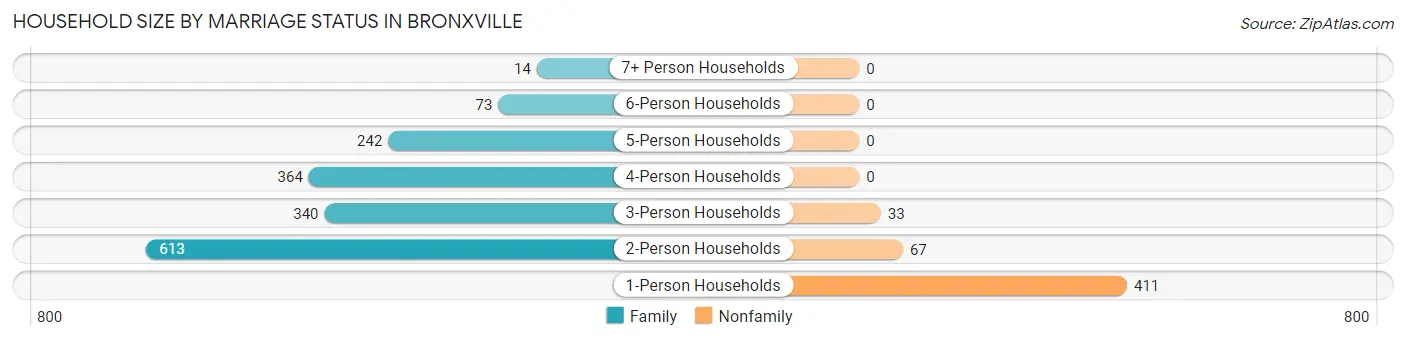
| Household Size | Family Households | Nonfamily Households |
| 1-Person Households | - | 411 (19.1%) |
| 2-Person Households | 613 (28.4%) | 67 (3.1%) |
| 3-Person Households | 340 (15.8%) | 33 (1.5%) |
| 4-Person Households | 364 (16.9%) | 0 (0.0%) |
| 5-Person Households | 242 (11.2%) | 0 (0.0%) |
| 6-Person Households | 73 (3.4%) | 0 (0.0%) |
| 7+ Person Households | 14 (0.6%) | 0 (0.0%) |
| Total | 1,646 (76.3%) | 511 (23.7%) |
Female Fertility in Bronxville
Fertility by Age in Bronxville
Average fertility rate in Bronxville is 65.0 births per 1,000 women. Women in the age bracket of 20 to 34 years have the highest fertility rate with 109.0 births per 1,000 women. Women in the age bracket of 35 to 50 years acount for 54.4% of all women with births.
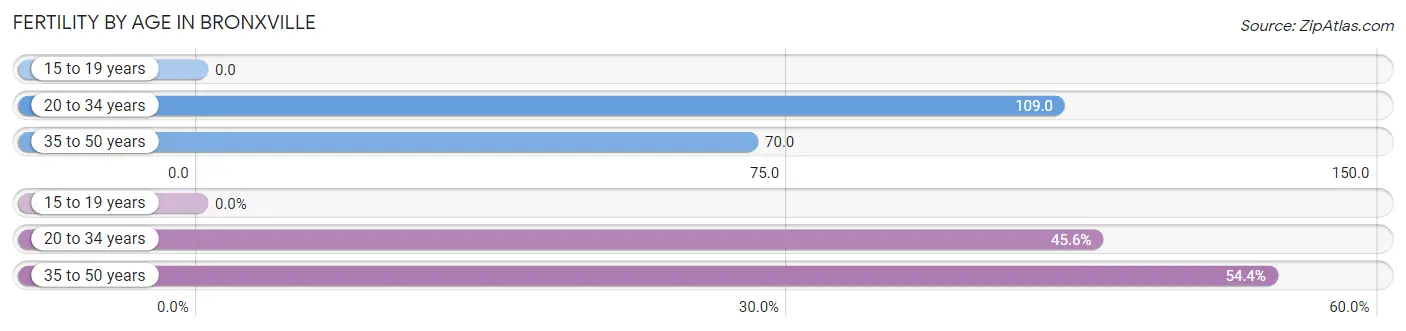
| Age Bracket | Women with Births | Births / 1,000 Women |
| 15 to 19 years | 0 (0.0%) | 0.0 |
| 20 to 34 years | 41 (45.6%) | 109.0 |
| 35 to 50 years | 49 (54.4%) | 70.0 |
| Total | 90 (100.0%) | 65.0 |
Fertility by Age by Marriage Status in Bronxville
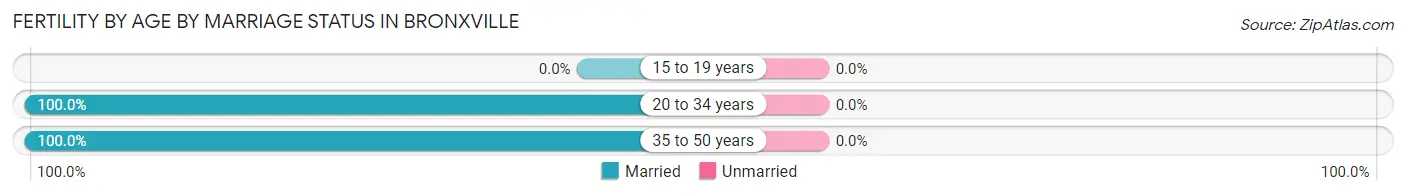
| Age Bracket | Married | Unmarried |
| 15 to 19 years | 0 (0.0%) | 0 (0.0%) |
| 20 to 34 years | 41 (100.0%) | 0 (0.0%) |
| 35 to 50 years | 49 (100.0%) | 0 (0.0%) |
| Total | 90 (100.0%) | 0 (0.0%) |
Fertility by Education in Bronxville
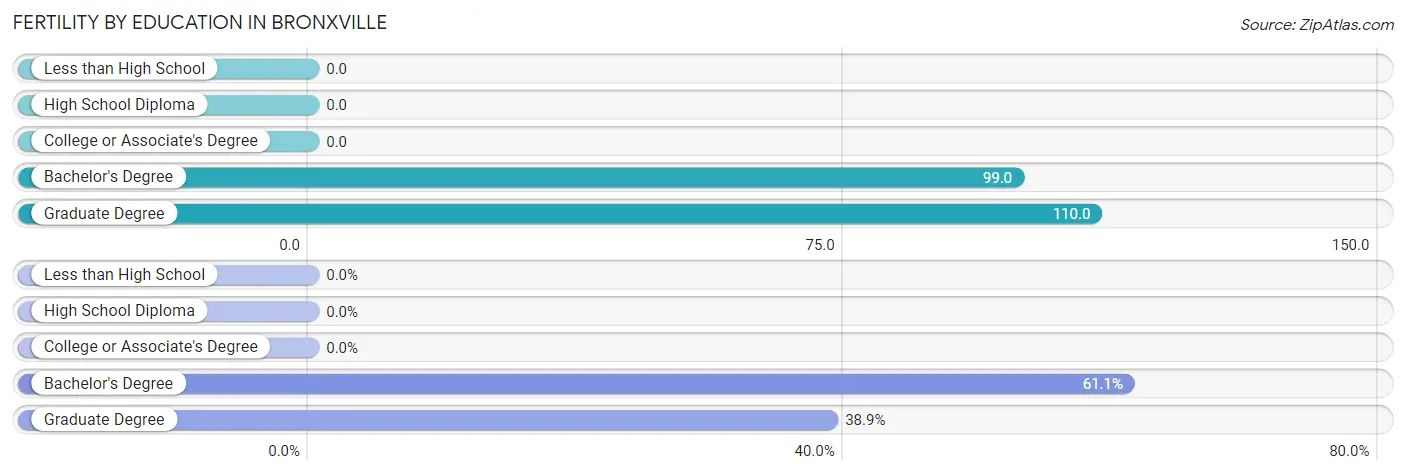
| Educational Attainment | Women with Births | Births / 1,000 Women |
| Less than High School | 0 (0.0%) | 0.0 |
| High School Diploma | 0 (0.0%) | 0.0 |
| College or Associate's Degree | 0 (0.0%) | 0.0 |
| Bachelor's Degree | 55 (61.1%) | 99.0 |
| Graduate Degree | 35 (38.9%) | 110.0 |
| Total | 90 (100.0%) | 65.0 |
Fertility by Education by Marriage Status in Bronxville

| Educational Attainment | Married | Unmarried |
| Less than High School | 0 (0.0%) | 0 (0.0%) |
| High School Diploma | 0 (0.0%) | 0 (0.0%) |
| College or Associate's Degree | 0 (0.0%) | 0 (0.0%) |
| Bachelor's Degree | 55 (100.0%) | 0 (0.0%) |
| Graduate Degree | 35 (100.0%) | 0 (0.0%) |
| Total | 90 (100.0%) | 0 (0.0%) |
Employment Characteristics in Bronxville
Employment by Class of Employer in Bronxville
Among the 2,676 employed individuals in Bronxville, private company employees (1,739 | 65.0%), not-for-profit organizations (485 | 18.1%), and self-employed (incorporated) (142 | 5.3%) make up the most common classes of employment.
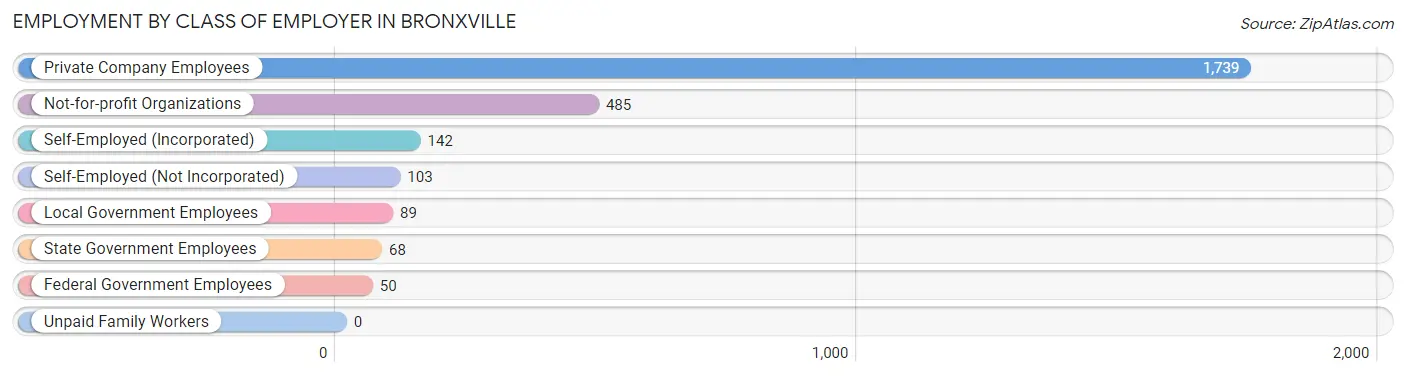
| Employer Class | # Employees | % Employees |
| Private Company Employees | 1,739 | 65.0% |
| Self-Employed (Incorporated) | 142 | 5.3% |
| Self-Employed (Not Incorporated) | 103 | 3.8% |
| Not-for-profit Organizations | 485 | 18.1% |
| Local Government Employees | 89 | 3.3% |
| State Government Employees | 68 | 2.5% |
| Federal Government Employees | 50 | 1.9% |
| Unpaid Family Workers | 0 | 0.0% |
| Total | 2,676 | 100.0% |
Employment Status by Age in Bronxville
According to the labor force statistics for Bronxville, out of the total population over 16 years of age (4,852), 59.2% or 2,872 individuals are in the labor force, with 3.5% or 101 of them unemployed. The age group with the highest labor force participation rate is 30 to 34 years, with 88.6% or 257 individuals in the labor force. Within the labor force, the 16 to 19 years age range has the highest percentage of unemployed individuals, with 39.8% or 35 of them being unemployed.
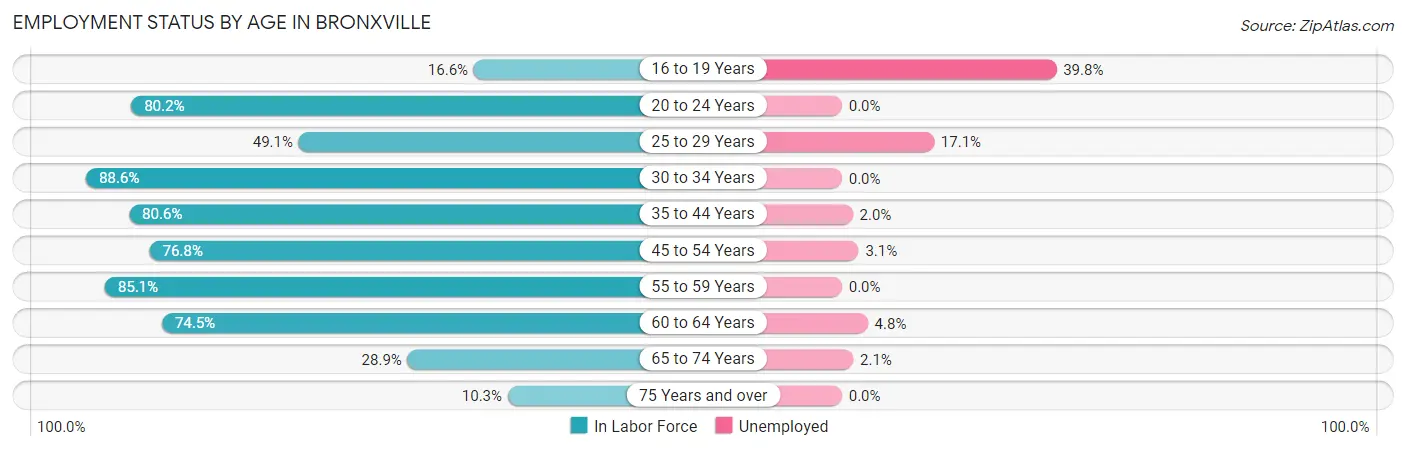
| Age Bracket | In Labor Force | Unemployed |
| 16 to 19 Years | 88 (16.6%) | 35 (39.8%) |
| 20 to 24 Years | 311 (80.2%) | 0 (0.0%) |
| 25 to 29 Years | 82 (49.1%) | 14 (17.1%) |
| 30 to 34 Years | 257 (88.6%) | 0 (0.0%) |
| 35 to 44 Years | 537 (80.6%) | 11 (2.0%) |
| 45 to 54 Years | 832 (76.8%) | 26 (3.1%) |
| 55 to 59 Years | 325 (85.1%) | 0 (0.0%) |
| 60 to 64 Years | 207 (74.5%) | 10 (4.8%) |
| 65 to 74 Years | 194 (28.9%) | 4 (2.1%) |
| 75 Years and over | 41 (10.3%) | 0 (0.0%) |
| Total | 2,872 (59.2%) | 101 (3.5%) |
Employment Status by Educational Attainment in Bronxville
According to labor force statistics for Bronxville, 78.2% of individuals (2,241) out of the total population between 25 and 64 years of age (2,866) are in the labor force, with 2.7% or 61 of them being unemployed. The group with the highest labor force participation rate are those with the educational attainment of high school diploma, with 87.3% or 103 individuals in the labor force. Within the labor force, individuals with bachelor's degree or higher education have the highest percentage of unemployment, with 3.3% or 62 of them being unemployed.
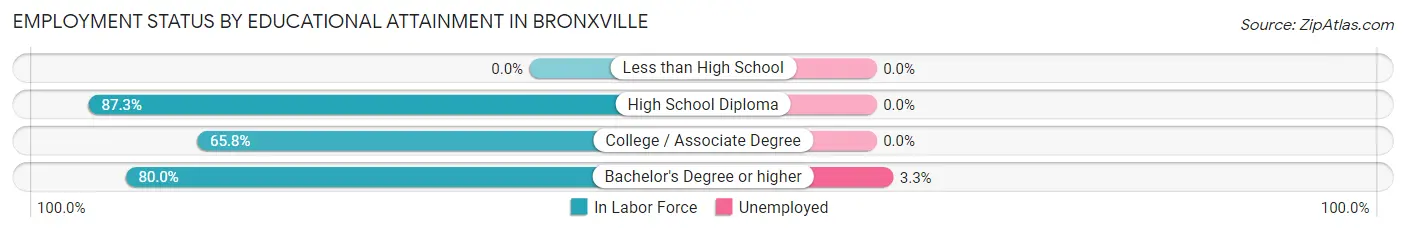
| Educational Attainment | In Labor Force | Unemployed |
| Less than High School | 0 (0.0%) | 0 (0.0%) |
| High School Diploma | 103 (87.3%) | 0 (0.0%) |
| College / Associate Degree | 271 (65.8%) | 0 (0.0%) |
| Bachelor's Degree or higher | 1,866 (80.0%) | 77 (3.3%) |
| Total | 2,241 (78.2%) | 77 (2.7%) |
Employment Occupations by Sex in Bronxville
Management, Business, Science and Arts Occupations
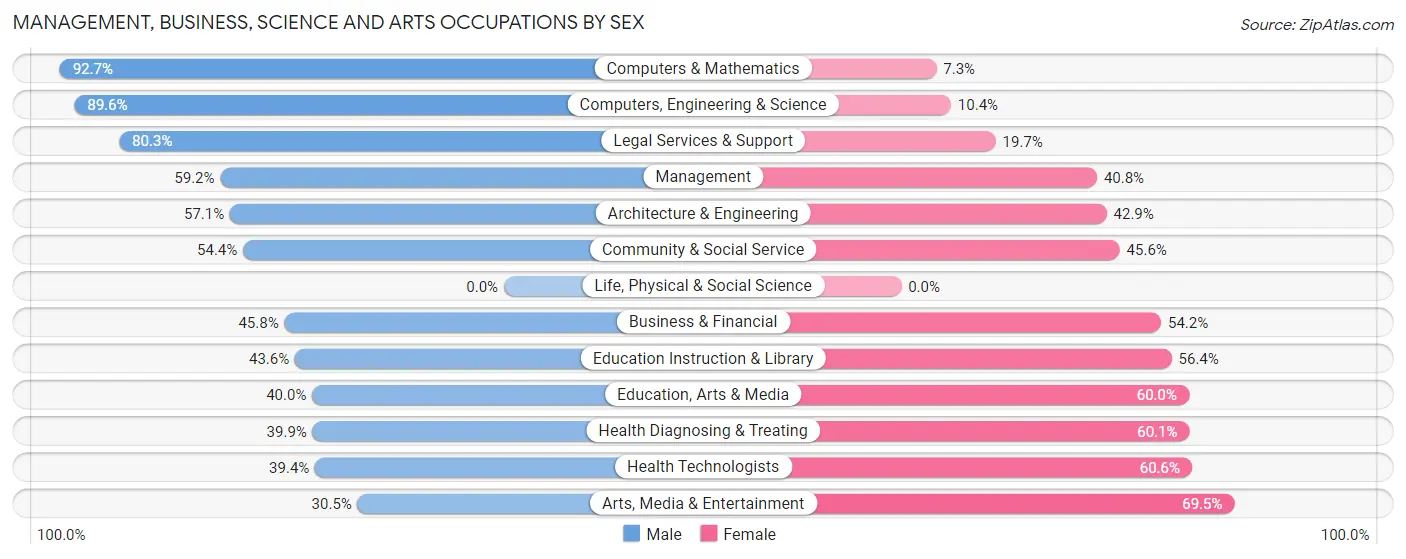
The most common Management, Business, Science and Arts occupations in Bronxville are Management (573 | 20.7%), Community & Social Service (509 | 18.3%), Business & Financial (380 | 13.7%), Health Diagnosing & Treating (233 | 8.4%), and Health Technologists (231 | 8.3%).
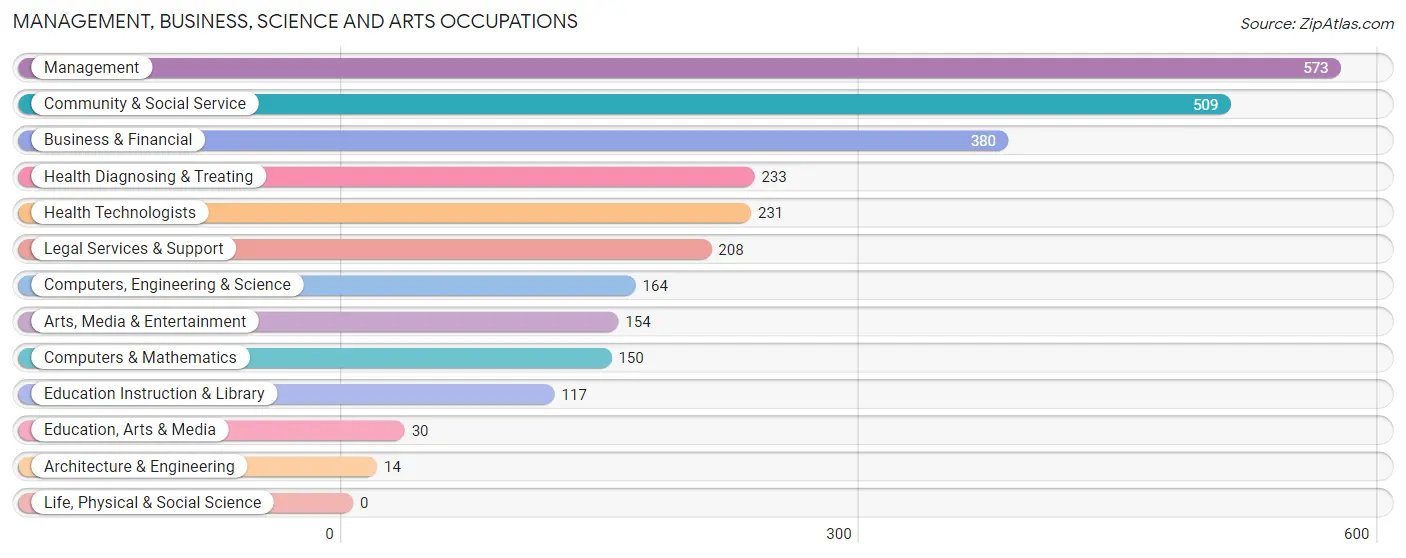
Management, Business, Science and Arts Occupations by Sex
Within the Management, Business, Science and Arts occupations in Bronxville, the most male-oriented occupations are Computers & Mathematics (92.7%), Computers, Engineering & Science (89.6%), and Legal Services & Support (80.3%), while the most female-oriented occupations are Arts, Media & Entertainment (69.5%), Health Technologists (60.6%), and Health Diagnosing & Treating (60.1%).
| Occupation | Male | Female |
| Management | 339 (59.2%) | 234 (40.8%) |
| Business & Financial | 174 (45.8%) | 206 (54.2%) |
| Computers, Engineering & Science | 147 (89.6%) | 17 (10.4%) |
| Computers & Mathematics | 139 (92.7%) | 11 (7.3%) |
| Architecture & Engineering | 8 (57.1%) | 6 (42.9%) |
| Life, Physical & Social Science | 0 (0.0%) | 0 (0.0%) |
| Community & Social Service | 277 (54.4%) | 232 (45.6%) |
| Education, Arts & Media | 12 (40.0%) | 18 (60.0%) |
| Legal Services & Support | 167 (80.3%) | 41 (19.7%) |
| Education Instruction & Library | 51 (43.6%) | 66 (56.4%) |
| Arts, Media & Entertainment | 47 (30.5%) | 107 (69.5%) |
| Health Diagnosing & Treating | 93 (39.9%) | 140 (60.1%) |
| Health Technologists | 91 (39.4%) | 140 (60.6%) |
| Total (Category) | 1,030 (55.4%) | 829 (44.6%) |
| Total (Overall) | 1,614 (58.2%) | 1,160 (41.8%) |
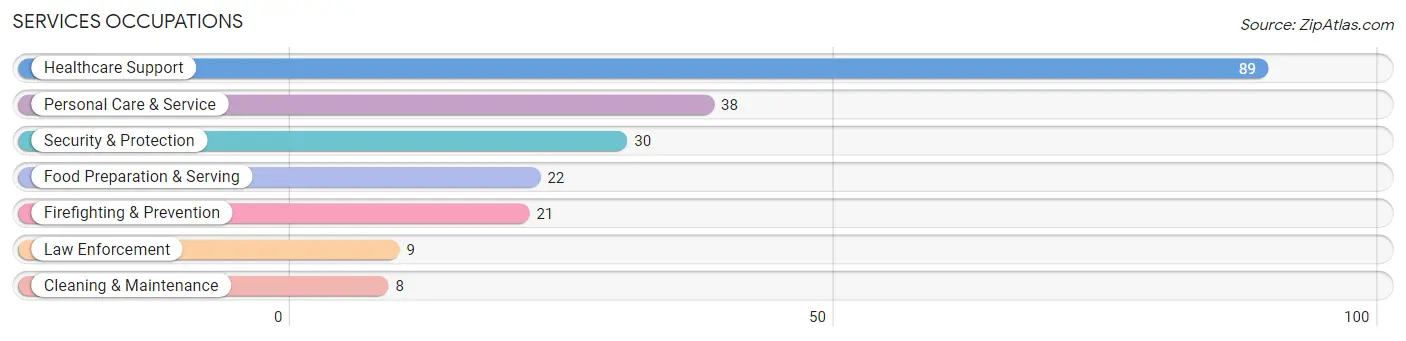
Services Occupations
The most common Services occupations in Bronxville are Healthcare Support (89 | 3.2%), Personal Care & Service (38 | 1.4%), Security & Protection (30 | 1.1%), Food Preparation & Serving (22 | 0.8%), and Firefighting & Prevention (21 | 0.8%).
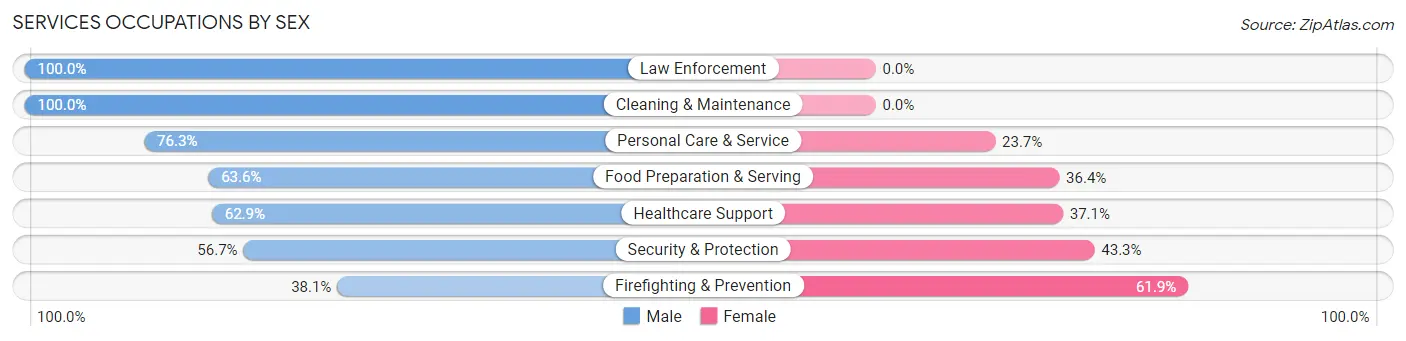
Services Occupations by Sex
Within the Services occupations in Bronxville, the most male-oriented occupations are Law Enforcement (100.0%), Cleaning & Maintenance (100.0%), and Personal Care & Service (76.3%), while the most female-oriented occupations are Firefighting & Prevention (61.9%), Security & Protection (43.3%), and Healthcare Support (37.1%).
| Occupation | Male | Female |
| Healthcare Support | 56 (62.9%) | 33 (37.1%) |
| Security & Protection | 17 (56.7%) | 13 (43.3%) |
| Firefighting & Prevention | 8 (38.1%) | 13 (61.9%) |
| Law Enforcement | 9 (100.0%) | 0 (0.0%) |
| Food Preparation & Serving | 14 (63.6%) | 8 (36.4%) |
| Cleaning & Maintenance | 8 (100.0%) | 0 (0.0%) |
| Personal Care & Service | 29 (76.3%) | 9 (23.7%) |
| Total (Category) | 124 (66.3%) | 63 (33.7%) |
| Total (Overall) | 1,614 (58.2%) | 1,160 (41.8%) |
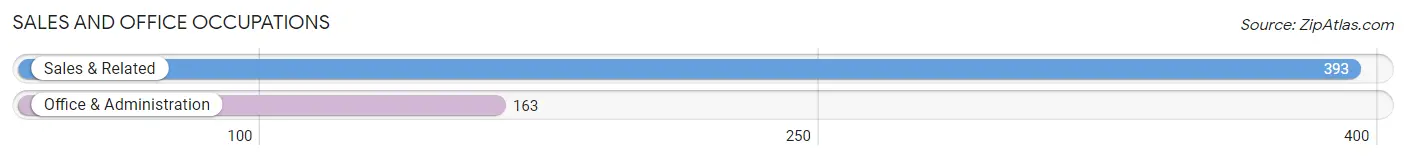
Sales and Office Occupations
The most common Sales and Office occupations in Bronxville are Sales & Related (393 | 14.2%), and Office & Administration (163 | 5.9%).
Sales and Office Occupations by Sex
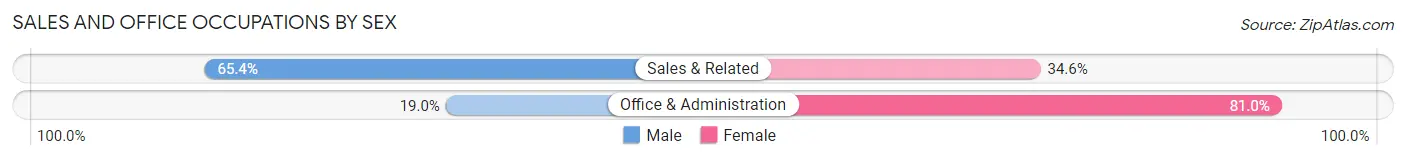
| Occupation | Male | Female |
| Sales & Related | 257 (65.4%) | 136 (34.6%) |
| Office & Administration | 31 (19.0%) | 132 (81.0%) |
| Total (Category) | 288 (51.8%) | 268 (48.2%) |
| Total (Overall) | 1,614 (58.2%) | 1,160 (41.8%) |
Natural Resources, Construction and Maintenance Occupations
The most common Natural Resources, Construction and Maintenance occupations in Bronxville are , and Construction & Extraction (135 | 4.9%).
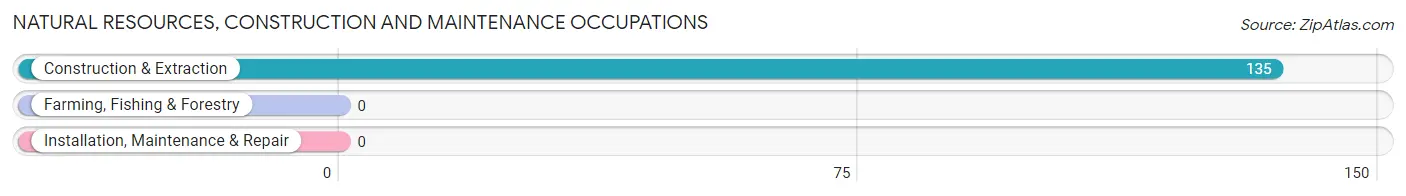
Natural Resources, Construction and Maintenance Occupations by Sex
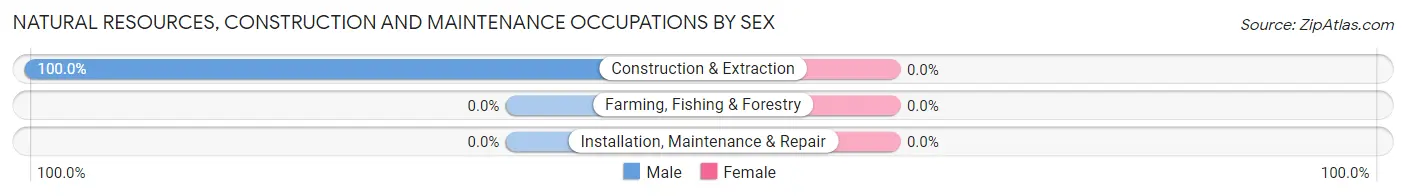
| Occupation | Male | Female |
| Farming, Fishing & Forestry | 0 (0.0%) | 0 (0.0%) |
| Construction & Extraction | 135 (100.0%) | 0 (0.0%) |
| Installation, Maintenance & Repair | 0 (0.0%) | 0 (0.0%) |
| Total (Category) | 135 (100.0%) | 0 (0.0%) |
| Total (Overall) | 1,614 (58.2%) | 1,160 (41.8%) |
Production, Transportation and Moving Occupations
The most common Production, Transportation and Moving occupations in Bronxville are Transportation (27 | 1.0%), and Material Moving (10 | 0.4%).
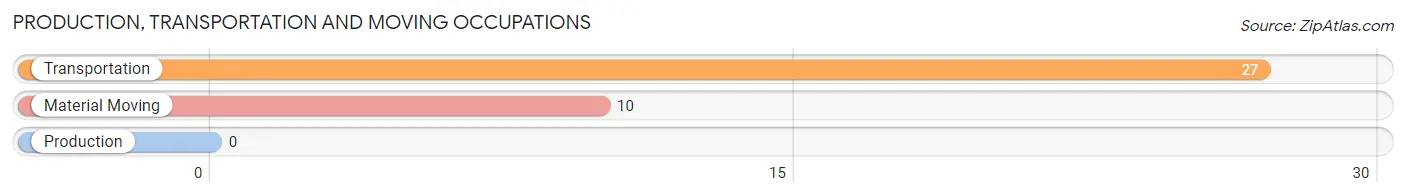
Production, Transportation and Moving Occupations by Sex
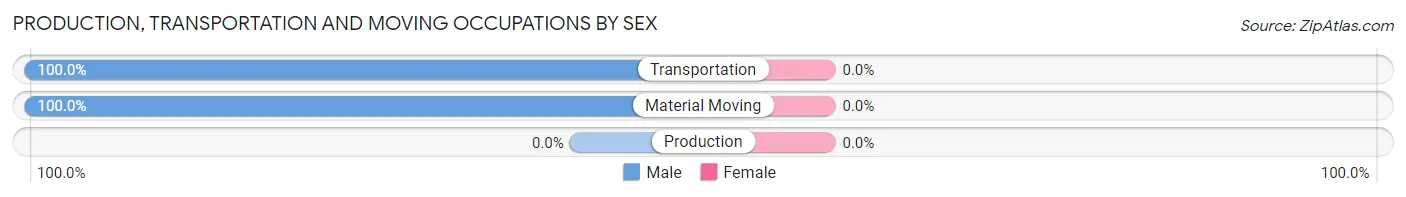
| Occupation | Male | Female |
| Production | 0 (0.0%) | 0 (0.0%) |
| Transportation | 27 (100.0%) | 0 (0.0%) |
| Material Moving | 10 (100.0%) | 0 (0.0%) |
| Total (Category) | 37 (100.0%) | 0 (0.0%) |
| Total (Overall) | 1,614 (58.2%) | 1,160 (41.8%) |
Employment Industries by Sex in Bronxville
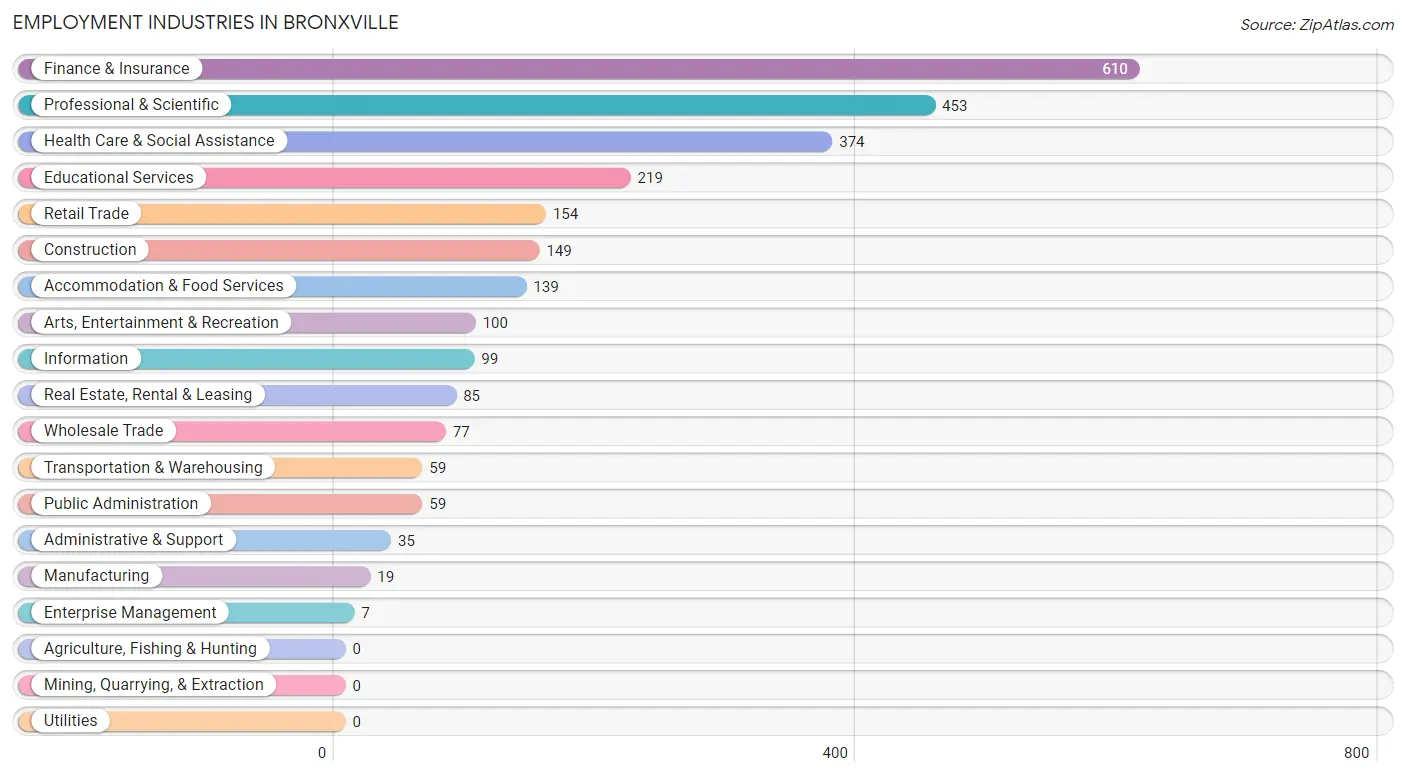
Employment Industries in Bronxville
The major employment industries in Bronxville include Finance & Insurance (610 | 22.0%), Professional & Scientific (453 | 16.3%), Health Care & Social Assistance (374 | 13.5%), Educational Services (219 | 7.9%), and Retail Trade (154 | 5.6%).
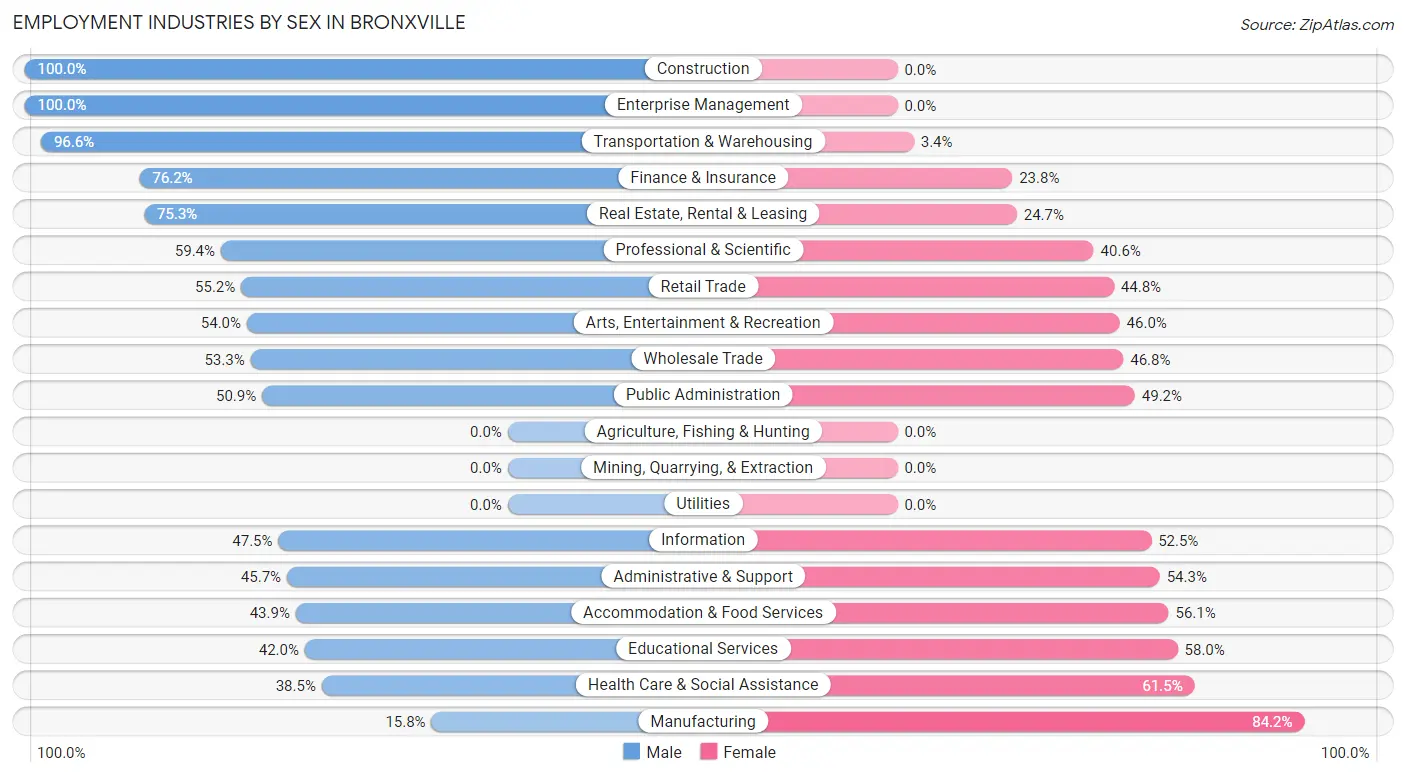
Employment Industries by Sex in Bronxville
The Bronxville industries that see more men than women are Construction (100.0%), Enterprise Management (100.0%), and Transportation & Warehousing (96.6%), whereas the industries that tend to have a higher number of women are Manufacturing (84.2%), Health Care & Social Assistance (61.5%), and Educational Services (58.0%).
| Industry | Male | Female |
| Agriculture, Fishing & Hunting | 0 (0.0%) | 0 (0.0%) |
| Mining, Quarrying, & Extraction | 0 (0.0%) | 0 (0.0%) |
| Construction | 149 (100.0%) | 0 (0.0%) |
| Manufacturing | 3 (15.8%) | 16 (84.2%) |
| Wholesale Trade | 41 (53.2%) | 36 (46.8%) |
| Retail Trade | 85 (55.2%) | 69 (44.8%) |
| Transportation & Warehousing | 57 (96.6%) | 2 (3.4%) |
| Utilities | 0 (0.0%) | 0 (0.0%) |
| Information | 47 (47.5%) | 52 (52.5%) |
| Finance & Insurance | 465 (76.2%) | 145 (23.8%) |
| Real Estate, Rental & Leasing | 64 (75.3%) | 21 (24.7%) |
| Professional & Scientific | 269 (59.4%) | 184 (40.6%) |
| Enterprise Management | 7 (100.0%) | 0 (0.0%) |
| Administrative & Support | 16 (45.7%) | 19 (54.3%) |
| Educational Services | 92 (42.0%) | 127 (58.0%) |
| Health Care & Social Assistance | 144 (38.5%) | 230 (61.5%) |
| Arts, Entertainment & Recreation | 54 (54.0%) | 46 (46.0%) |
| Accommodation & Food Services | 61 (43.9%) | 78 (56.1%) |
| Public Administration | 30 (50.8%) | 29 (49.1%) |
| Total | 1,614 (58.2%) | 1,160 (41.8%) |
Education in Bronxville
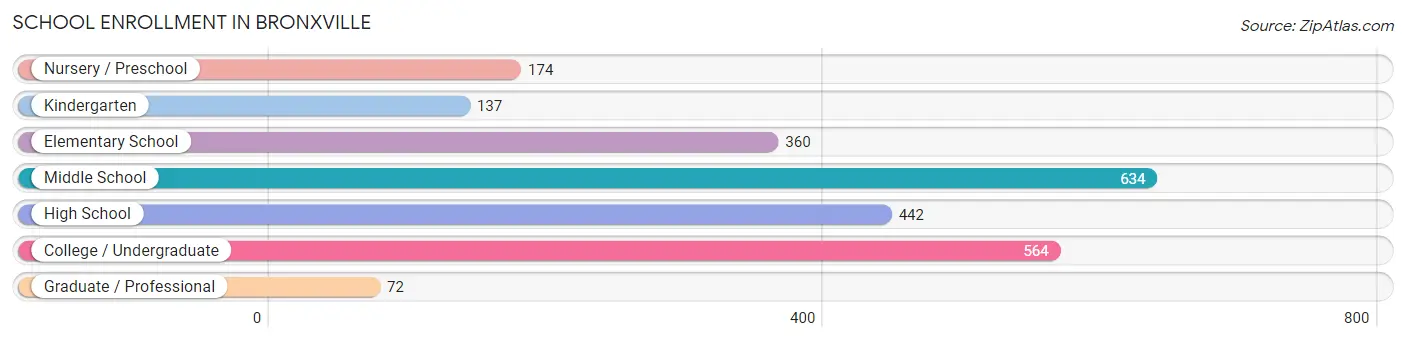
School Enrollment in Bronxville
The most common levels of schooling among the 2,383 students in Bronxville are middle school (634 | 26.6%), college / undergraduate (564 | 23.7%), and high school (442 | 18.5%).
| School Level | # Students | % Students |
| Nursery / Preschool | 174 | 7.3% |
| Kindergarten | 137 | 5.8% |
| Elementary School | 360 | 15.1% |
| Middle School | 634 | 26.6% |
| High School | 442 | 18.5% |
| College / Undergraduate | 564 | 23.7% |
| Graduate / Professional | 72 | 3.0% |
| Total | 2,383 | 100.0% |
School Enrollment by Age by Funding Source in Bronxville
Out of a total of 2,383 students who are enrolled in schools in Bronxville, 710 (29.8%) attend a private institution, while the remaining 1,673 (70.2%) are enrolled in public schools. The age group of 20 to 24 year olds has the highest likelihood of being enrolled in private schools, with 210 (83.0% in the age bracket) enrolled. Conversely, the age group of 5 to 9 year old has the lowest likelihood of being enrolled in a private school, with 465 (98.1% in the age bracket) attending a public institution.
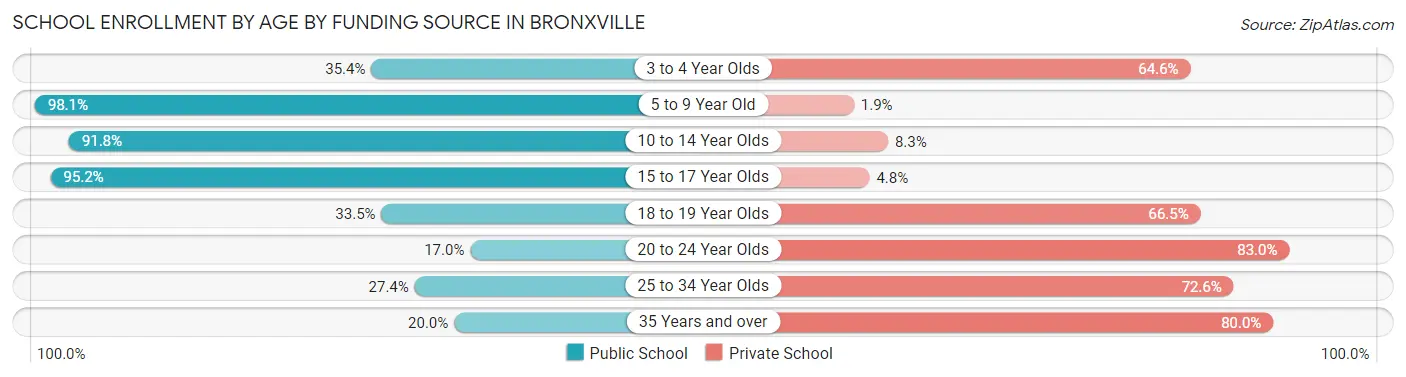
| Age Bracket | Public School | Private School |
| 3 to 4 Year Olds | 51 (35.4%) | 93 (64.6%) |
| 5 to 9 Year Old | 465 (98.1%) | 9 (1.9%) |
| 10 to 14 Year Olds | 712 (91.7%) | 64 (8.3%) |
| 15 to 17 Year Olds | 257 (95.2%) | 13 (4.8%) |
| 18 to 19 Year Olds | 109 (33.5%) | 216 (66.5%) |
| 20 to 24 Year Olds | 43 (17.0%) | 210 (83.0%) |
| 25 to 34 Year Olds | 29 (27.4%) | 77 (72.6%) |
| 35 Years and over | 7 (20.0%) | 28 (80.0%) |
| Total | 1,673 (70.2%) | 710 (29.8%) |
Educational Attainment by Field of Study in Bronxville
Social sciences (734 | 21.9%), business (632 | 18.9%), literature & languages (392 | 11.7%), liberal arts & history (337 | 10.1%), and visual & performing arts (226 | 6.8%) are the most common fields of study among 3,350 individuals in Bronxville who have obtained a bachelor's degree or higher.
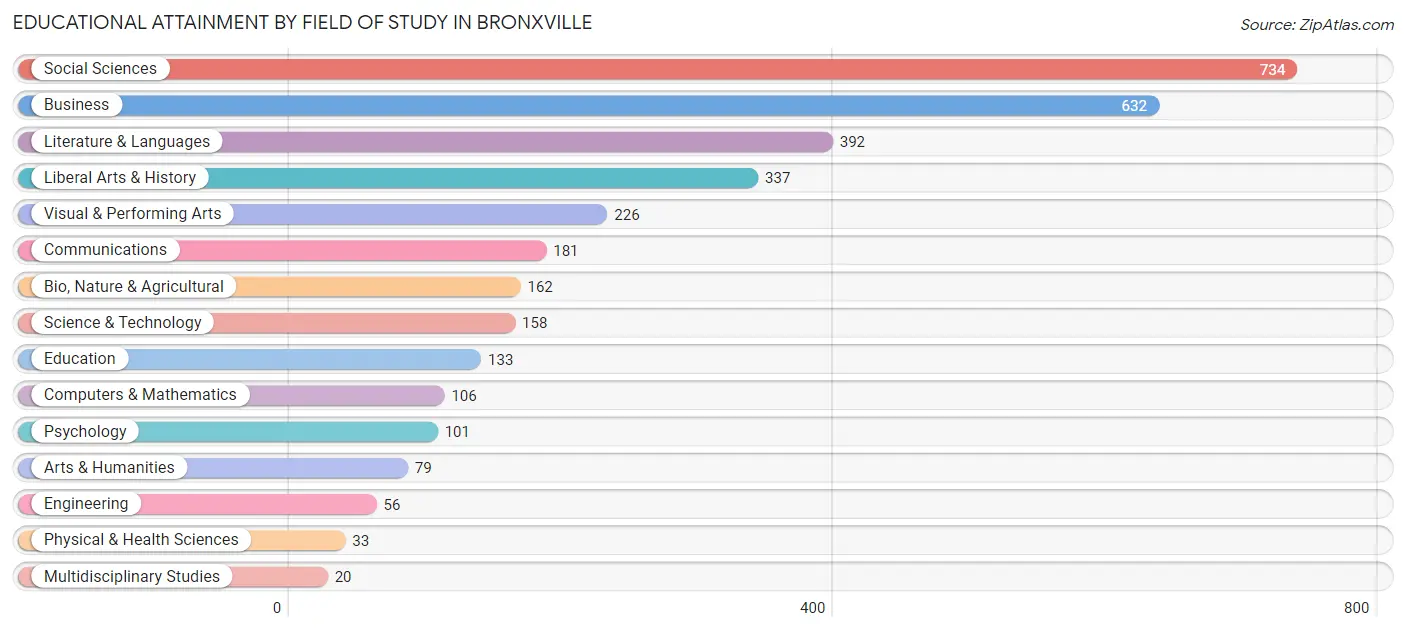
| Field of Study | # Graduates | % Graduates |
| Computers & Mathematics | 106 | 3.2% |
| Bio, Nature & Agricultural | 162 | 4.8% |
| Physical & Health Sciences | 33 | 1.0% |
| Psychology | 101 | 3.0% |
| Social Sciences | 734 | 21.9% |
| Engineering | 56 | 1.7% |
| Multidisciplinary Studies | 20 | 0.6% |
| Science & Technology | 158 | 4.7% |
| Business | 632 | 18.9% |
| Education | 133 | 4.0% |
| Literature & Languages | 392 | 11.7% |
| Liberal Arts & History | 337 | 10.1% |
| Visual & Performing Arts | 226 | 6.8% |
| Communications | 181 | 5.4% |
| Arts & Humanities | 79 | 2.4% |
| Total | 3,350 | 100.0% |
Transportation & Commute in Bronxville
Vehicle Availability by Sex in Bronxville
The most prevalent vehicle ownership categories in Bronxville are males with 2 vehicles (583, accounting for 38.8%) and females with 2 vehicles (441, making up 53.4%).
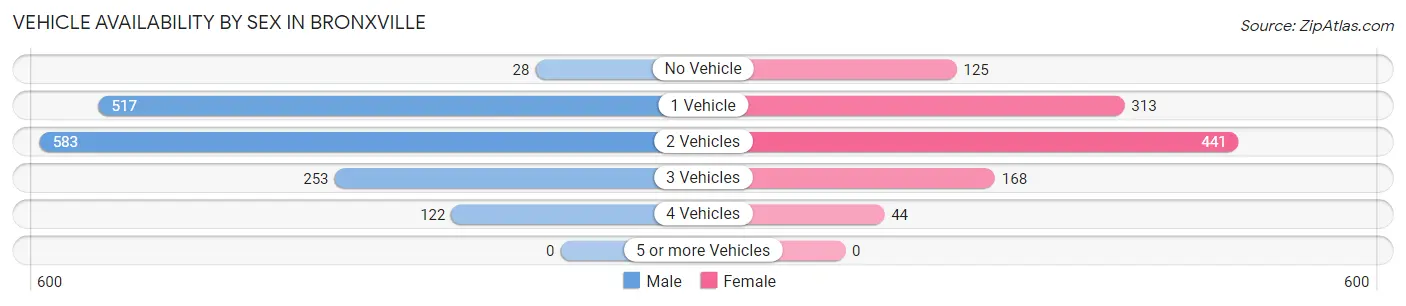
| Vehicles Available | Male | Female |
| No Vehicle | 28 (1.9%) | 125 (11.5%) |
| 1 Vehicle | 517 (34.4%) | 313 (28.7%) |
| 2 Vehicles | 583 (38.8%) | 441 (40.4%) |
| 3 Vehicles | 253 (16.8%) | 168 (15.4%) |
| 4 Vehicles | 122 (8.1%) | 44 (4.0%) |
| 5 or more Vehicles | 0 (0.0%) | 0 (0.0%) |
| Total | 1,503 (100.0%) | 1,091 (100.0%) |
Commute Time in Bronxville
The most frequently occuring commute durations in Bronxville are 45 to 59 minutes (508 commuters, 23.9%), 60 to 89 minutes (346 commuters, 16.3%), and 20 to 24 minutes (335 commuters, 15.8%).
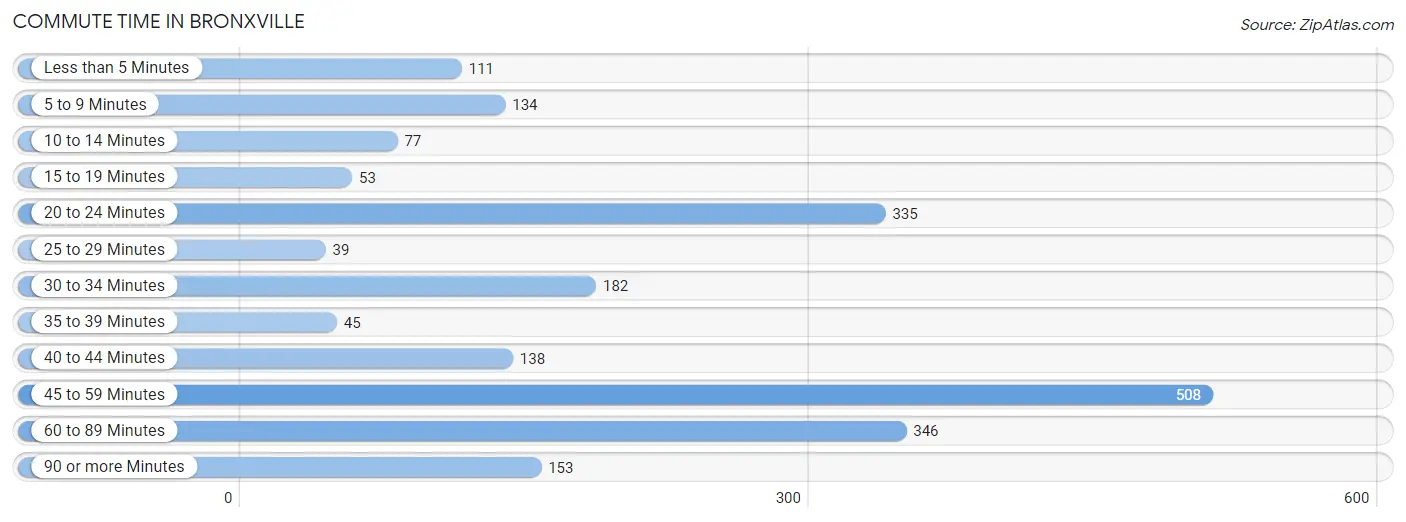
| Commute Time | # Commuters | % Commuters |
| Less than 5 Minutes | 111 | 5.2% |
| 5 to 9 Minutes | 134 | 6.3% |
| 10 to 14 Minutes | 77 | 3.6% |
| 15 to 19 Minutes | 53 | 2.5% |
| 20 to 24 Minutes | 335 | 15.8% |
| 25 to 29 Minutes | 39 | 1.8% |
| 30 to 34 Minutes | 182 | 8.6% |
| 35 to 39 Minutes | 45 | 2.1% |
| 40 to 44 Minutes | 138 | 6.5% |
| 45 to 59 Minutes | 508 | 23.9% |
| 60 to 89 Minutes | 346 | 16.3% |
| 90 or more Minutes | 153 | 7.2% |
Commute Time by Sex in Bronxville
The most common commute times in Bronxville are 45 to 59 minutes (355 commuters, 28.5%) for males and 20 to 24 minutes (154 commuters, 17.6%) for females.
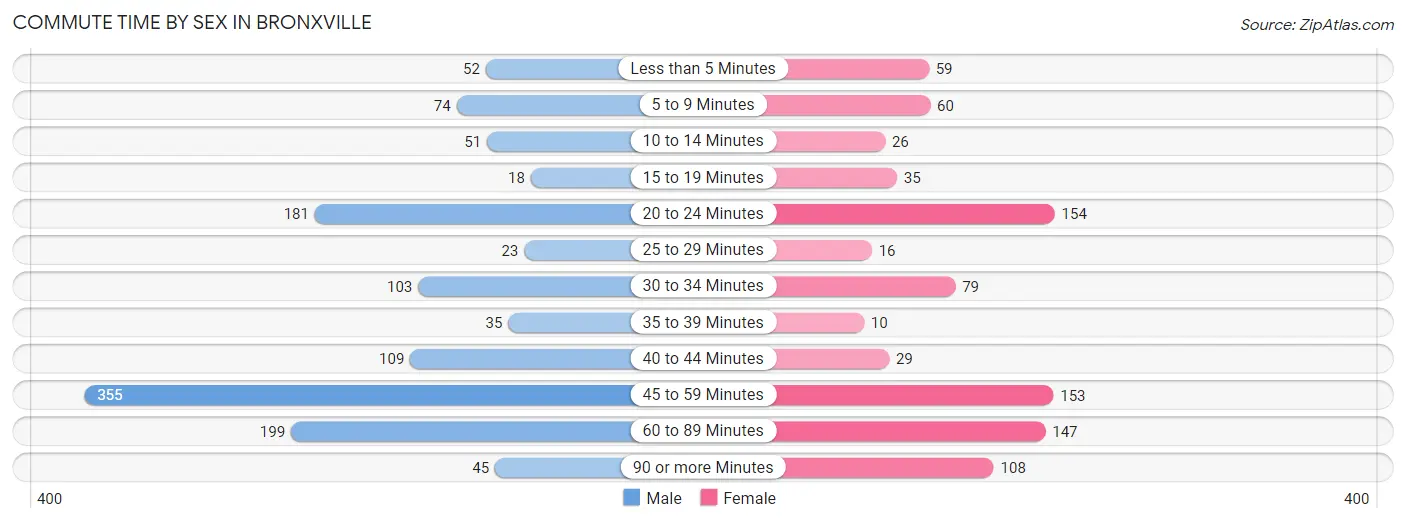
| Commute Time | Male | Female |
| Less than 5 Minutes | 52 (4.2%) | 59 (6.7%) |
| 5 to 9 Minutes | 74 (5.9%) | 60 (6.9%) |
| 10 to 14 Minutes | 51 (4.1%) | 26 (3.0%) |
| 15 to 19 Minutes | 18 (1.5%) | 35 (4.0%) |
| 20 to 24 Minutes | 181 (14.5%) | 154 (17.6%) |
| 25 to 29 Minutes | 23 (1.8%) | 16 (1.8%) |
| 30 to 34 Minutes | 103 (8.3%) | 79 (9.0%) |
| 35 to 39 Minutes | 35 (2.8%) | 10 (1.1%) |
| 40 to 44 Minutes | 109 (8.8%) | 29 (3.3%) |
| 45 to 59 Minutes | 355 (28.5%) | 153 (17.5%) |
| 60 to 89 Minutes | 199 (16.0%) | 147 (16.8%) |
| 90 or more Minutes | 45 (3.6%) | 108 (12.3%) |
Time of Departure to Work by Sex in Bronxville
The most frequent times of departure to work in Bronxville are 8:00 AM to 8:29 AM (269, 21.6%) for males and 8:00 AM to 8:29 AM (257, 29.3%) for females.
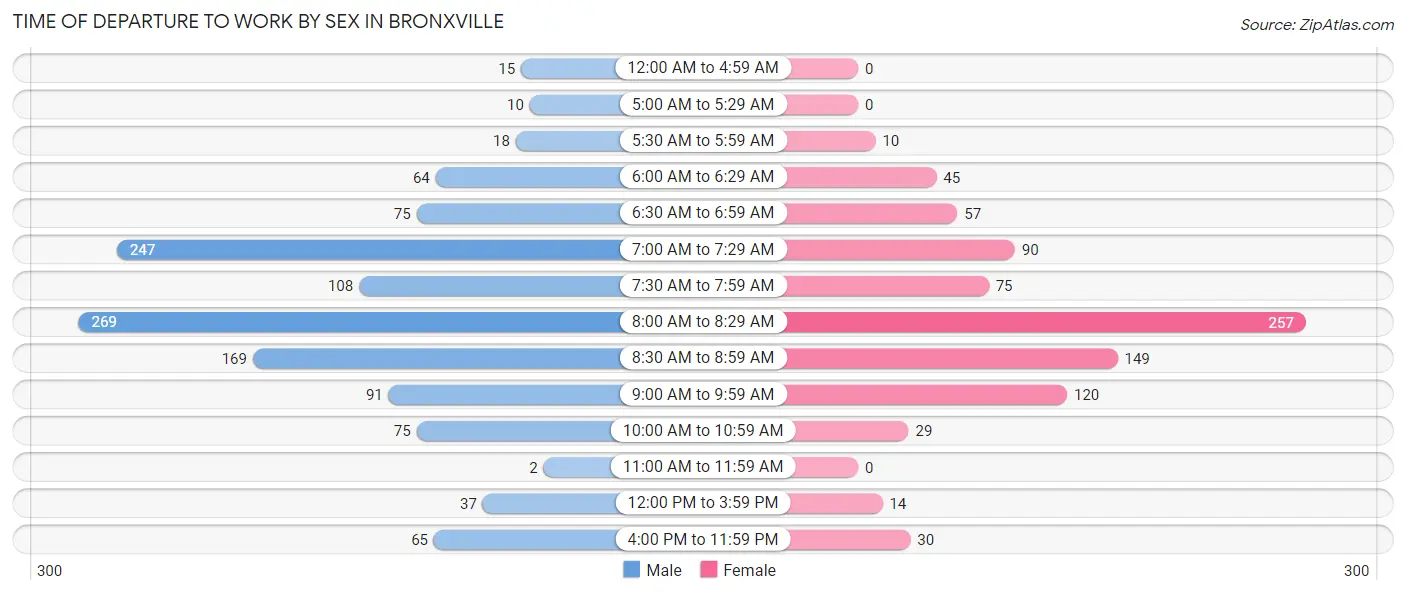
| Time of Departure | Male | Female |
| 12:00 AM to 4:59 AM | 15 (1.2%) | 0 (0.0%) |
| 5:00 AM to 5:29 AM | 10 (0.8%) | 0 (0.0%) |
| 5:30 AM to 5:59 AM | 18 (1.5%) | 10 (1.1%) |
| 6:00 AM to 6:29 AM | 64 (5.1%) | 45 (5.1%) |
| 6:30 AM to 6:59 AM | 75 (6.0%) | 57 (6.5%) |
| 7:00 AM to 7:29 AM | 247 (19.8%) | 90 (10.3%) |
| 7:30 AM to 7:59 AM | 108 (8.7%) | 75 (8.6%) |
| 8:00 AM to 8:29 AM | 269 (21.6%) | 257 (29.3%) |
| 8:30 AM to 8:59 AM | 169 (13.6%) | 149 (17.0%) |
| 9:00 AM to 9:59 AM | 91 (7.3%) | 120 (13.7%) |
| 10:00 AM to 10:59 AM | 75 (6.0%) | 29 (3.3%) |
| 11:00 AM to 11:59 AM | 2 (0.2%) | 0 (0.0%) |
| 12:00 PM to 3:59 PM | 37 (3.0%) | 14 (1.6%) |
| 4:00 PM to 11:59 PM | 65 (5.2%) | 30 (3.4%) |
| Total | 1,245 (100.0%) | 876 (100.0%) |
Housing Occupancy in Bronxville
Occupancy by Ownership in Bronxville
Of the total 2,157 dwellings in Bronxville, owner-occupied units account for 1,743 (80.8%), while renter-occupied units make up 414 (19.2%).

| Occupancy | # Housing Units | % Housing Units |
| Owner Occupied Housing Units | 1,743 | 80.8% |
| Renter-Occupied Housing Units | 414 | 19.2% |
| Total Occupied Housing Units | 2,157 | 100.0% |
Occupancy by Household Size in Bronxville
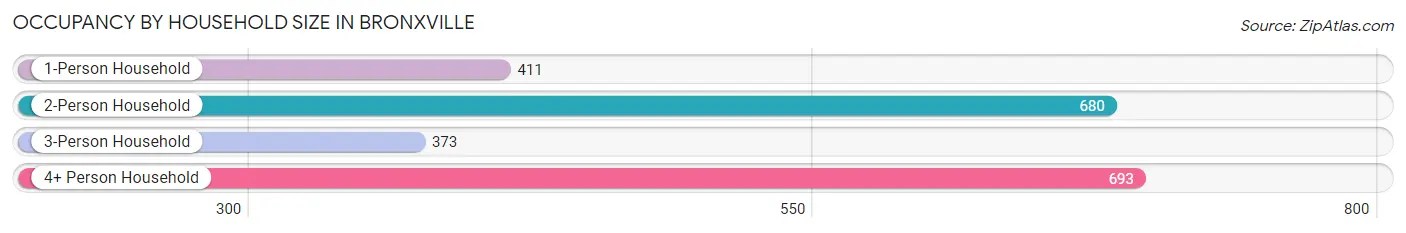
| Household Size | # Housing Units | % Housing Units |
| 1-Person Household | 411 | 19.1% |
| 2-Person Household | 680 | 31.5% |
| 3-Person Household | 373 | 17.3% |
| 4+ Person Household | 693 | 32.1% |
| Total Housing Units | 2,157 | 100.0% |
Occupancy by Ownership by Household Size in Bronxville
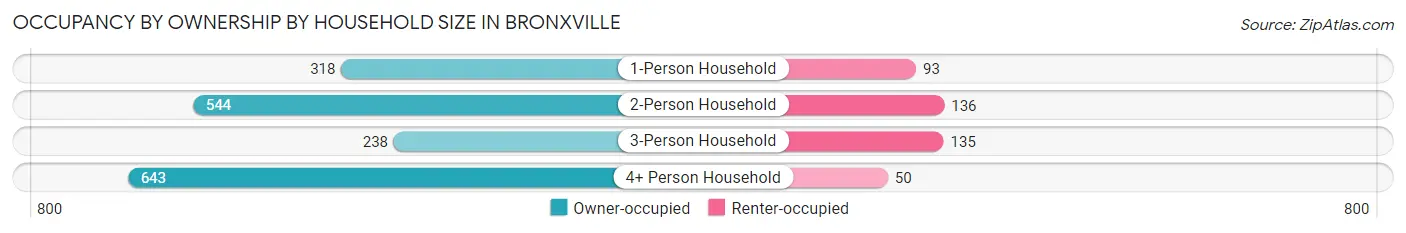
| Household Size | Owner-occupied | Renter-occupied |
| 1-Person Household | 318 (77.4%) | 93 (22.6%) |
| 2-Person Household | 544 (80.0%) | 136 (20.0%) |
| 3-Person Household | 238 (63.8%) | 135 (36.2%) |
| 4+ Person Household | 643 (92.8%) | 50 (7.2%) |
| Total Housing Units | 1,743 (80.8%) | 414 (19.2%) |
Occupancy by Educational Attainment in Bronxville
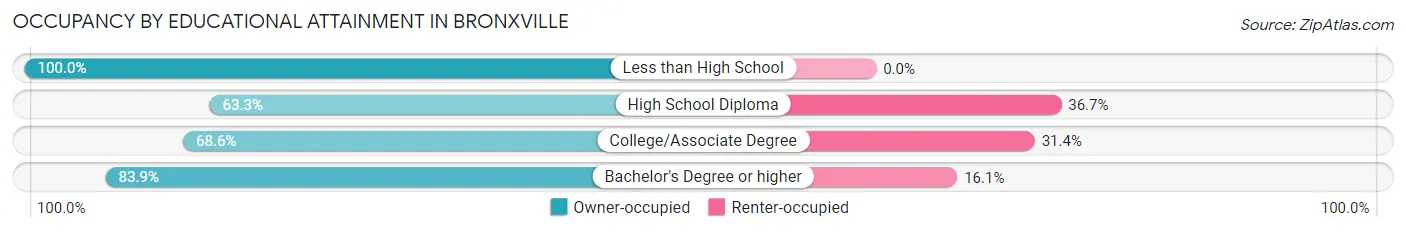
| Household Size | Owner-occupied | Renter-occupied |
| Less than High School | 7 (100.0%) | 0 (0.0%) |
| High School Diploma | 69 (63.3%) | 40 (36.7%) |
| College/Associate Degree | 205 (68.6%) | 94 (31.4%) |
| Bachelor's Degree or higher | 1,462 (83.9%) | 280 (16.1%) |
Occupancy by Age of Householder in Bronxville
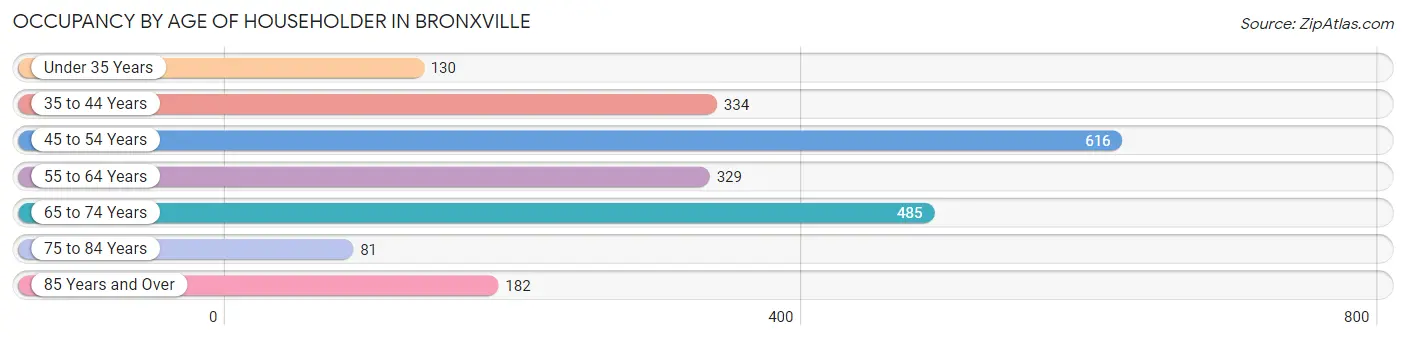
| Age Bracket | # Households | % Households |
| Under 35 Years | 130 | 6.0% |
| 35 to 44 Years | 334 | 15.5% |
| 45 to 54 Years | 616 | 28.6% |
| 55 to 64 Years | 329 | 15.2% |
| 65 to 74 Years | 485 | 22.5% |
| 75 to 84 Years | 81 | 3.8% |
| 85 Years and Over | 182 | 8.4% |
| Total | 2,157 | 100.0% |
Housing Finances in Bronxville
Median Income by Occupancy in Bronxville
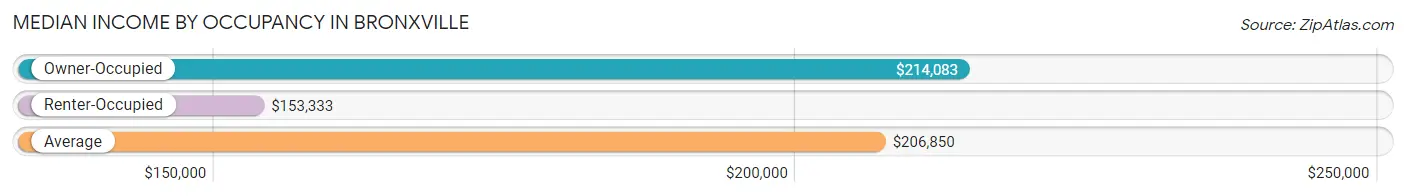
| Occupancy Type | # Households | Median Income |
| Owner-Occupied | 1,743 (80.8%) | $214,083 |
| Renter-Occupied | 414 (19.2%) | $153,333 |
| Average | 2,157 (100.0%) | $206,850 |
Occupancy by Householder Income Bracket in Bronxville
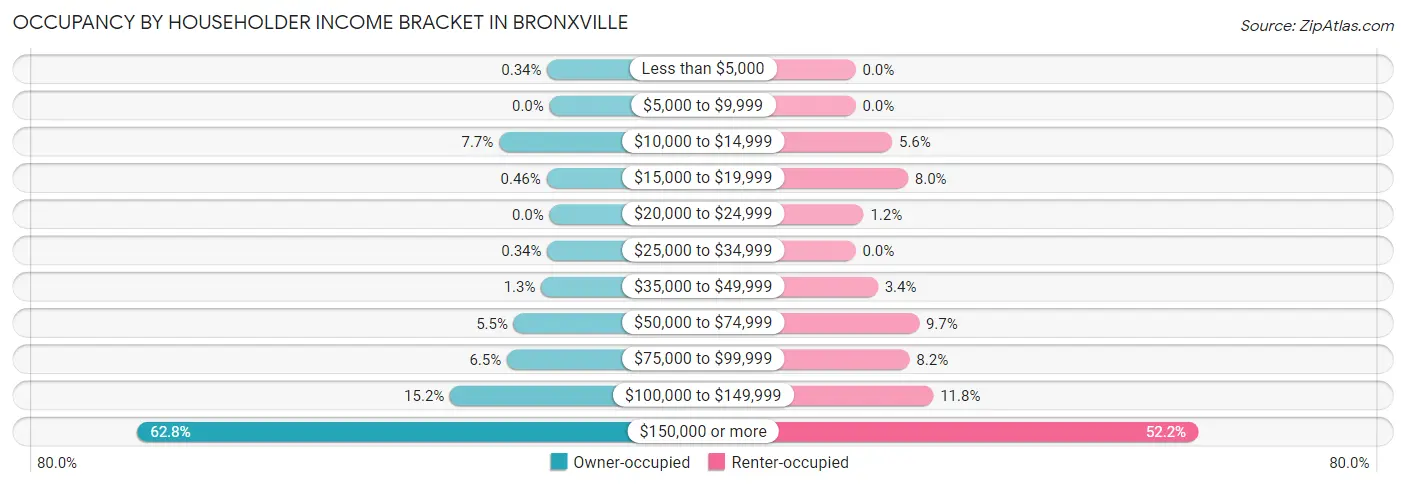
| Income Bracket | Owner-occupied | Renter-occupied |
| Less than $5,000 | 6 (0.3%) | 0 (0.0%) |
| $5,000 to $9,999 | 0 (0.0%) | 0 (0.0%) |
| $10,000 to $14,999 | 134 (7.7%) | 23 (5.6%) |
| $15,000 to $19,999 | 8 (0.5%) | 33 (8.0%) |
| $20,000 to $24,999 | 0 (0.0%) | 5 (1.2%) |
| $25,000 to $34,999 | 6 (0.3%) | 0 (0.0%) |
| $35,000 to $49,999 | 22 (1.3%) | 14 (3.4%) |
| $50,000 to $74,999 | 95 (5.4%) | 40 (9.7%) |
| $75,000 to $99,999 | 113 (6.5%) | 34 (8.2%) |
| $100,000 to $149,999 | 264 (15.1%) | 49 (11.8%) |
| $150,000 or more | 1,095 (62.8%) | 216 (52.2%) |
| Total | 1,743 (100.0%) | 414 (100.0%) |
Monthly Housing Cost Tiers in Bronxville
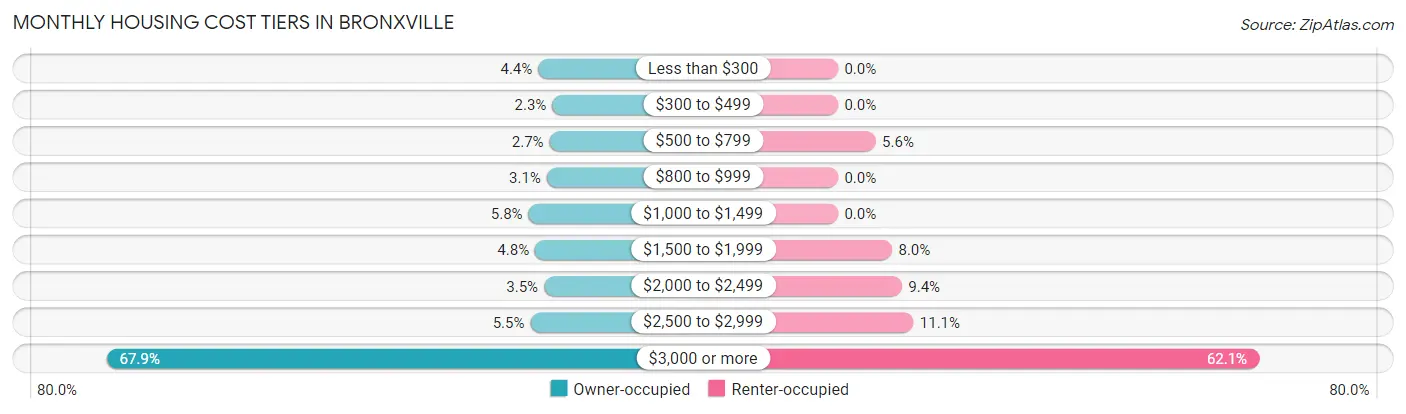
| Monthly Cost | Owner-occupied | Renter-occupied |
| Less than $300 | 76 (4.4%) | 0 (0.0%) |
| $300 to $499 | 40 (2.3%) | 0 (0.0%) |
| $500 to $799 | 47 (2.7%) | 23 (5.6%) |
| $800 to $999 | 54 (3.1%) | 0 (0.0%) |
| $1,000 to $1,499 | 101 (5.8%) | 0 (0.0%) |
| $1,500 to $1,999 | 84 (4.8%) | 33 (8.0%) |
| $2,000 to $2,499 | 61 (3.5%) | 39 (9.4%) |
| $2,500 to $2,999 | 96 (5.5%) | 46 (11.1%) |
| $3,000 or more | 1,184 (67.9%) | 257 (62.1%) |
| Total | 1,743 (100.0%) | 414 (100.0%) |
Physical Housing Characteristics in Bronxville
Housing Structures in Bronxville
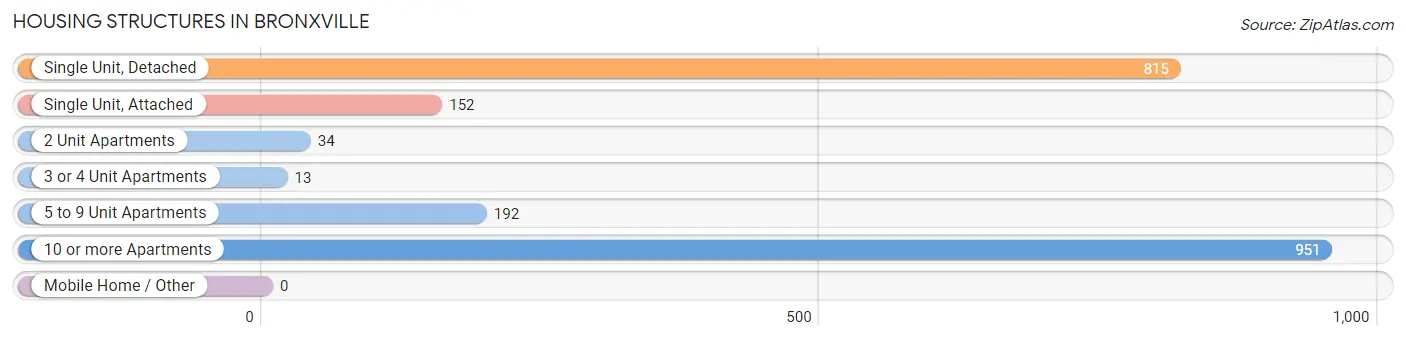
| Structure Type | # Housing Units | % Housing Units |
| Single Unit, Detached | 815 | 37.8% |
| Single Unit, Attached | 152 | 7.0% |
| 2 Unit Apartments | 34 | 1.6% |
| 3 or 4 Unit Apartments | 13 | 0.6% |
| 5 to 9 Unit Apartments | 192 | 8.9% |
| 10 or more Apartments | 951 | 44.1% |
| Mobile Home / Other | 0 | 0.0% |
| Total | 2,157 | 100.0% |
Housing Structures by Occupancy in Bronxville
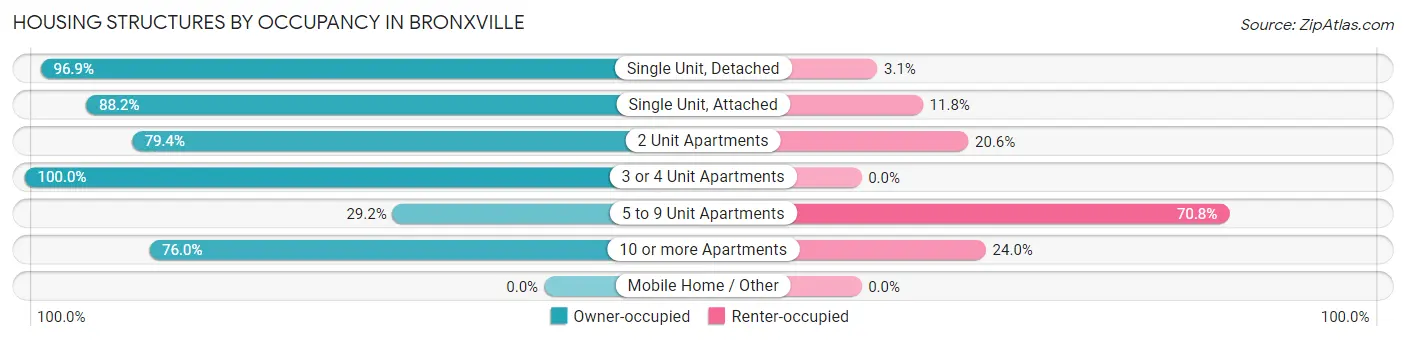
| Structure Type | Owner-occupied | Renter-occupied |
| Single Unit, Detached | 790 (96.9%) | 25 (3.1%) |
| Single Unit, Attached | 134 (88.2%) | 18 (11.8%) |
| 2 Unit Apartments | 27 (79.4%) | 7 (20.6%) |
| 3 or 4 Unit Apartments | 13 (100.0%) | 0 (0.0%) |
| 5 to 9 Unit Apartments | 56 (29.2%) | 136 (70.8%) |
| 10 or more Apartments | 723 (76.0%) | 228 (24.0%) |
| Mobile Home / Other | 0 (0.0%) | 0 (0.0%) |
| Total | 1,743 (80.8%) | 414 (19.2%) |
Housing Structures by Number of Rooms in Bronxville
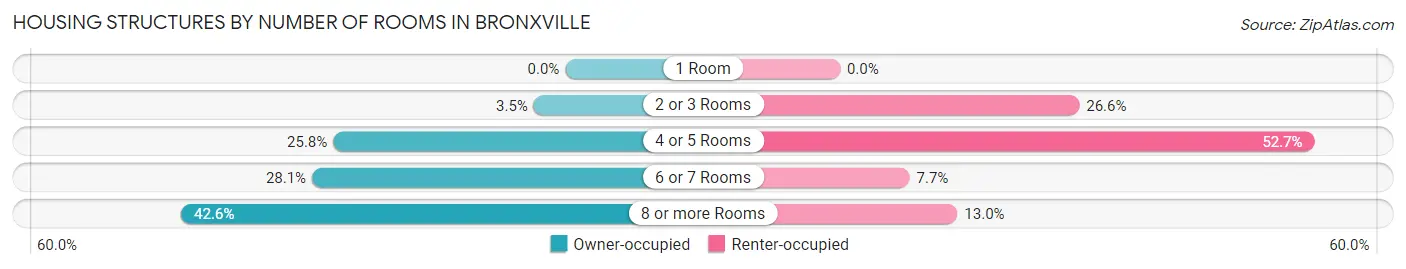
| Number of Rooms | Owner-occupied | Renter-occupied |
| 1 Room | 0 (0.0%) | 0 (0.0%) |
| 2 or 3 Rooms | 61 (3.5%) | 110 (26.6%) |
| 4 or 5 Rooms | 449 (25.8%) | 218 (52.7%) |
| 6 or 7 Rooms | 490 (28.1%) | 32 (7.7%) |
| 8 or more Rooms | 743 (42.6%) | 54 (13.0%) |
| Total | 1,743 (100.0%) | 414 (100.0%) |
Housing Structure by Heating Type in Bronxville
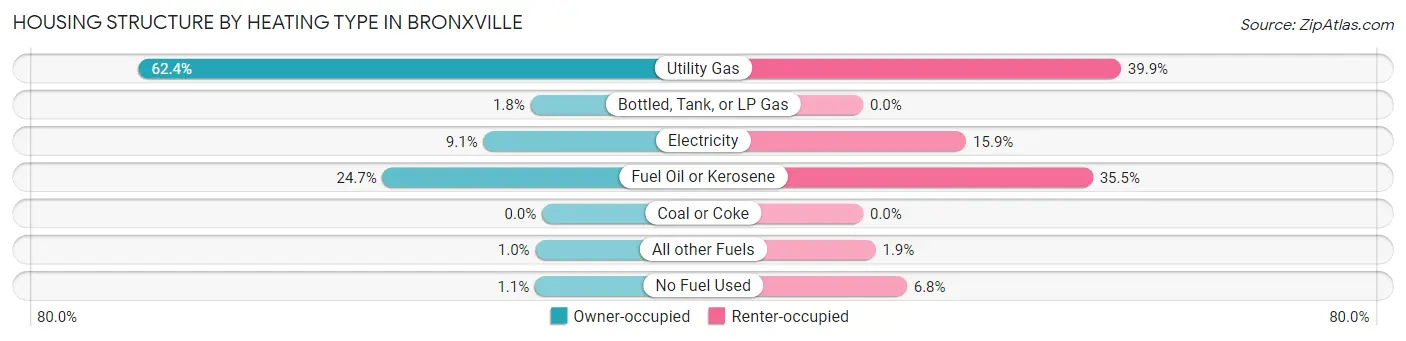
| Heating Type | Owner-occupied | Renter-occupied |
| Utility Gas | 1,087 (62.4%) | 165 (39.9%) |
| Bottled, Tank, or LP Gas | 31 (1.8%) | 0 (0.0%) |
| Electricity | 158 (9.1%) | 66 (15.9%) |
| Fuel Oil or Kerosene | 430 (24.7%) | 147 (35.5%) |
| Coal or Coke | 0 (0.0%) | 0 (0.0%) |
| All other Fuels | 18 (1.0%) | 8 (1.9%) |
| No Fuel Used | 19 (1.1%) | 28 (6.8%) |
| Total | 1,743 (100.0%) | 414 (100.0%) |
Household Vehicle Usage in Bronxville
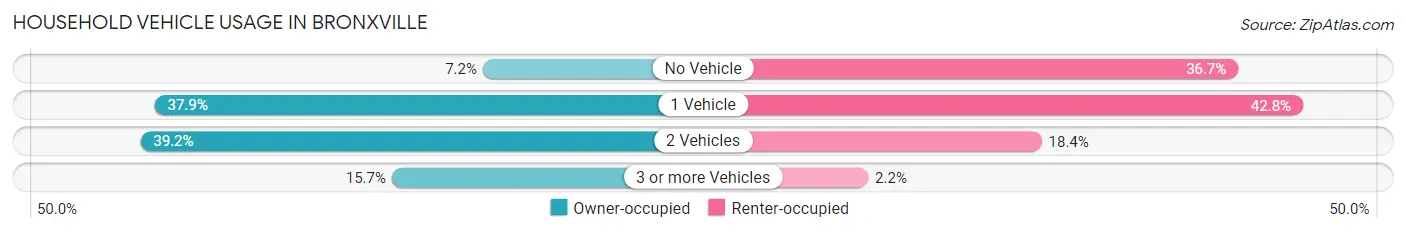
| Vehicles per Household | Owner-occupied | Renter-occupied |
| No Vehicle | 126 (7.2%) | 152 (36.7%) |
| 1 Vehicle | 660 (37.9%) | 177 (42.7%) |
| 2 Vehicles | 683 (39.2%) | 76 (18.4%) |
| 3 or more Vehicles | 274 (15.7%) | 9 (2.2%) |
| Total | 1,743 (100.0%) | 414 (100.0%) |
Real Estate & Mortgages in Bronxville
Real Estate and Mortgage Overview in Bronxville
| Characteristic | Without Mortgage | With Mortgage |
| Housing Units | 794 | 949 |
| Median Property Value | $805,000 | $1,806,800 |
| Median Household Income | $122,404 | $739 |
| Monthly Housing Costs | $1,501 | $828 |
| Real Estate Taxes | $10,001 | $5 |
Property Value by Mortgage Status in Bronxville
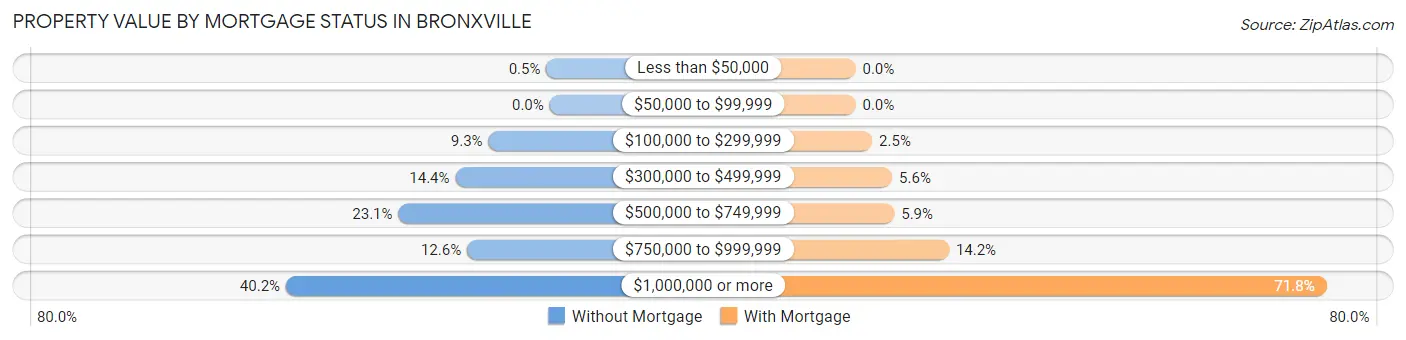
| Property Value | Without Mortgage | With Mortgage |
| Less than $50,000 | 4 (0.5%) | 0 (0.0%) |
| $50,000 to $99,999 | 0 (0.0%) | 0 (0.0%) |
| $100,000 to $299,999 | 74 (9.3%) | 24 (2.5%) |
| $300,000 to $499,999 | 114 (14.4%) | 53 (5.6%) |
| $500,000 to $749,999 | 183 (23.1%) | 56 (5.9%) |
| $750,000 to $999,999 | 100 (12.6%) | 135 (14.2%) |
| $1,000,000 or more | 319 (40.2%) | 681 (71.8%) |
| Total | 794 (100.0%) | 949 (100.0%) |
Household Income by Mortgage Status in Bronxville
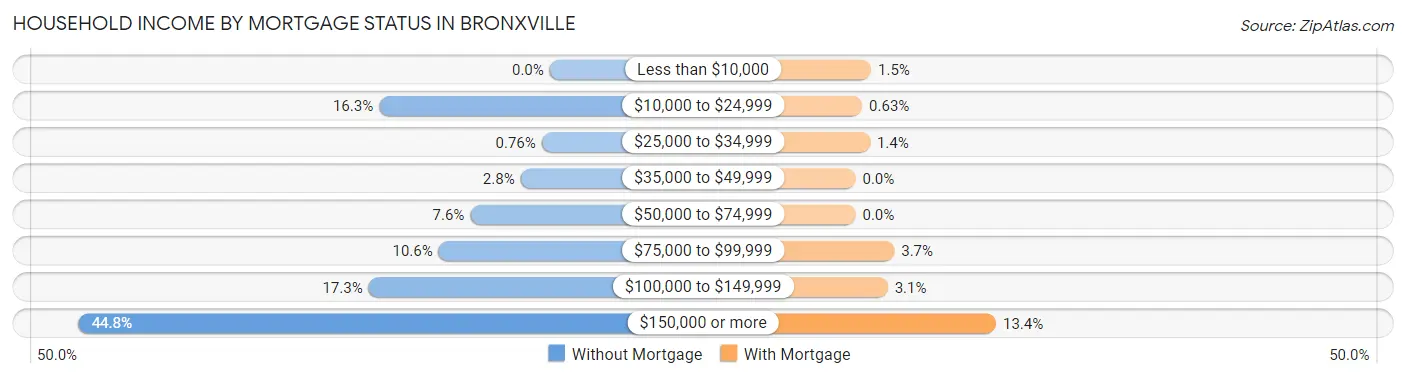
| Household Income | Without Mortgage | With Mortgage |
| Less than $10,000 | 0 (0.0%) | 14 (1.5%) |
| $10,000 to $24,999 | 129 (16.3%) | 6 (0.6%) |
| $25,000 to $34,999 | 6 (0.8%) | 13 (1.4%) |
| $35,000 to $49,999 | 22 (2.8%) | 0 (0.0%) |
| $50,000 to $74,999 | 60 (7.6%) | 0 (0.0%) |
| $75,000 to $99,999 | 84 (10.6%) | 35 (3.7%) |
| $100,000 to $149,999 | 137 (17.2%) | 29 (3.1%) |
| $150,000 or more | 356 (44.8%) | 127 (13.4%) |
| Total | 794 (100.0%) | 949 (100.0%) |
Property Value to Household Income Ratio in Bronxville
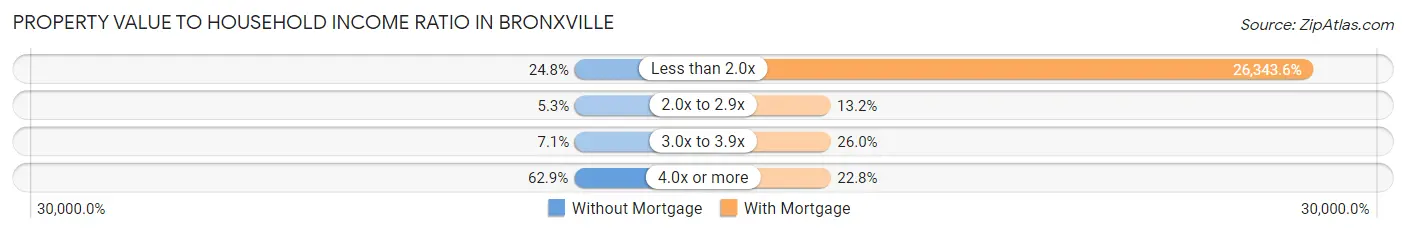
| Value-to-Income Ratio | Without Mortgage | With Mortgage |
| Less than 2.0x | 197 (24.8%) | 250,001 (26,343.6%) |
| 2.0x to 2.9x | 42 (5.3%) | 125 (13.2%) |
| 3.0x to 3.9x | 56 (7.0%) | 247 (26.0%) |
| 4.0x or more | 499 (62.8%) | 216 (22.8%) |
| Total | 794 (100.0%) | 949 (100.0%) |
Real Estate Taxes by Mortgage Status in Bronxville
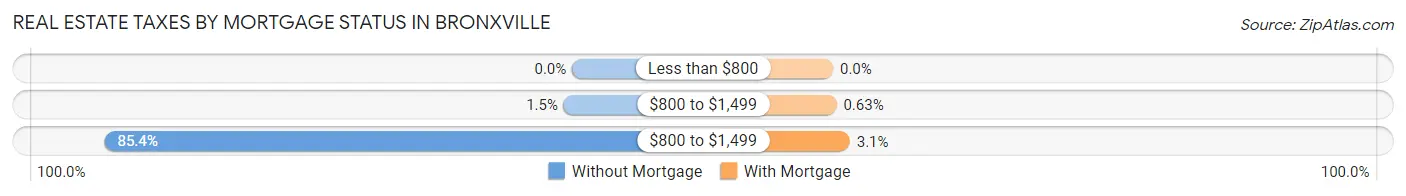
| Property Taxes | Without Mortgage | With Mortgage |
| Less than $800 | 0 (0.0%) | 0 (0.0%) |
| $800 to $1,499 | 12 (1.5%) | 6 (0.6%) |
| $800 to $1,499 | 678 (85.4%) | 29 (3.1%) |
| Total | 794 (100.0%) | 949 (100.0%) |
Health & Disability in Bronxville
Health Insurance Coverage by Age in Bronxville
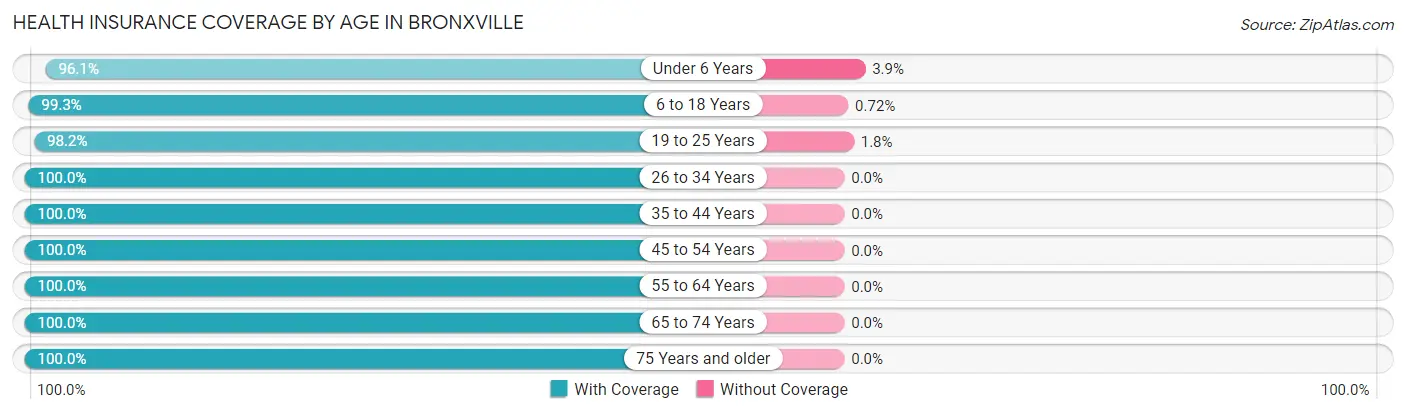
| Age Bracket | With Coverage | Without Coverage |
| Under 6 Years | 419 (96.1%) | 17 (3.9%) |
| 6 to 18 Years | 1,659 (99.3%) | 12 (0.7%) |
| 19 to 25 Years | 554 (98.2%) | 10 (1.8%) |
| 26 to 34 Years | 420 (100.0%) | 0 (0.0%) |
| 35 to 44 Years | 666 (100.0%) | 0 (0.0%) |
| 45 to 54 Years | 1,083 (100.0%) | 0 (0.0%) |
| 55 to 64 Years | 656 (100.0%) | 0 (0.0%) |
| 65 to 74 Years | 672 (100.0%) | 0 (0.0%) |
| 75 Years and older | 397 (100.0%) | 0 (0.0%) |
| Total | 6,526 (99.4%) | 39 (0.6%) |
Health Insurance Coverage by Citizenship Status in Bronxville
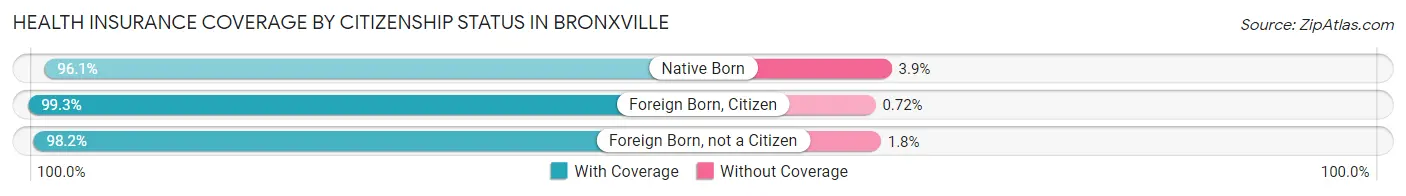
| Citizenship Status | With Coverage | Without Coverage |
| Native Born | 419 (96.1%) | 17 (3.9%) |
| Foreign Born, Citizen | 1,659 (99.3%) | 12 (0.7%) |
| Foreign Born, not a Citizen | 554 (98.2%) | 10 (1.8%) |
Health Insurance Coverage by Household Income in Bronxville
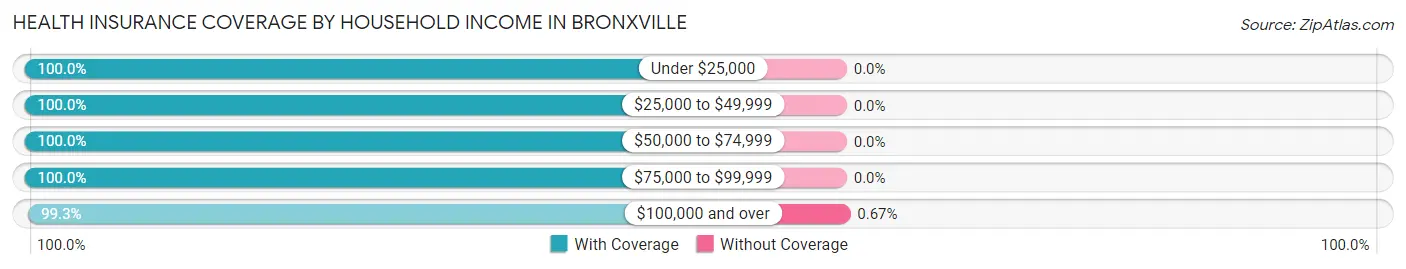
| Household Income | With Coverage | Without Coverage |
| Under $25,000 | 430 (100.0%) | 0 (0.0%) |
| $25,000 to $49,999 | 42 (100.0%) | 0 (0.0%) |
| $50,000 to $74,999 | 240 (100.0%) | 0 (0.0%) |
| $75,000 to $99,999 | 324 (100.0%) | 0 (0.0%) |
| $100,000 and over | 5,302 (99.3%) | 36 (0.7%) |
Public vs Private Health Insurance Coverage by Age in Bronxville
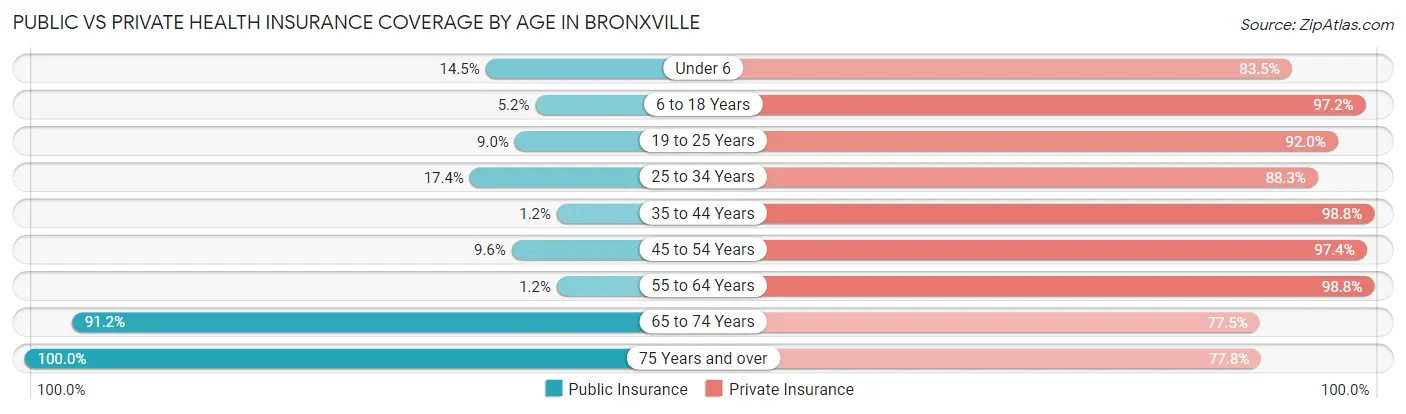
| Age Bracket | Public Insurance | Private Insurance |
| Under 6 | 63 (14.4%) | 364 (83.5%) |
| 6 to 18 Years | 87 (5.2%) | 1,624 (97.2%) |
| 19 to 25 Years | 51 (9.0%) | 519 (92.0%) |
| 25 to 34 Years | 73 (17.4%) | 371 (88.3%) |
| 35 to 44 Years | 8 (1.2%) | 658 (98.8%) |
| 45 to 54 Years | 104 (9.6%) | 1,055 (97.4%) |
| 55 to 64 Years | 8 (1.2%) | 648 (98.8%) |
| 65 to 74 Years | 613 (91.2%) | 521 (77.5%) |
| 75 Years and over | 397 (100.0%) | 309 (77.8%) |
| Total | 1,404 (21.4%) | 6,069 (92.4%) |
Disability Status by Sex by Age in Bronxville
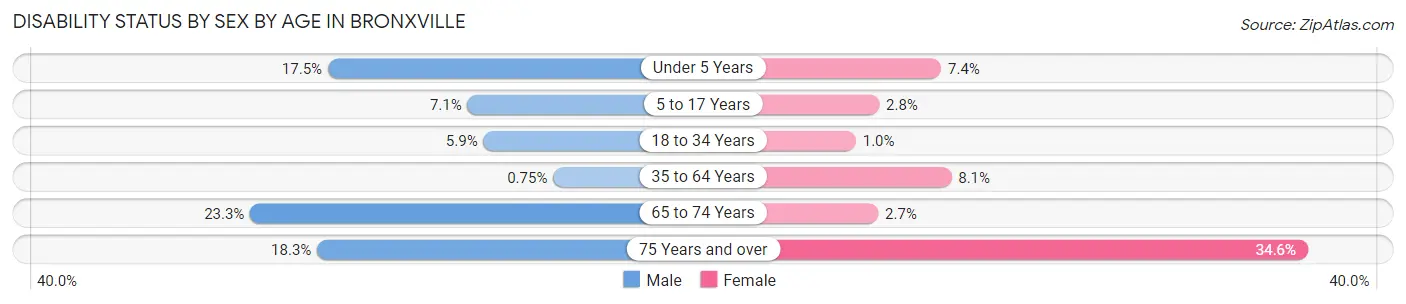
| Age Bracket | Male | Female |
| Under 5 Years | 36 (17.5%) | 14 (7.4%) |
| 5 to 17 Years | 52 (7.1%) | 22 (2.8%) |
| 18 to 34 Years | 35 (5.9%) | 6 (1.0%) |
| 35 to 64 Years | 9 (0.7%) | 98 (8.1%) |
| 65 to 74 Years | 53 (23.3%) | 12 (2.7%) |
| 75 Years and over | 34 (18.3%) | 73 (34.6%) |
Disability Class by Sex by Age in Bronxville
Disability Class: Hearing Difficulty
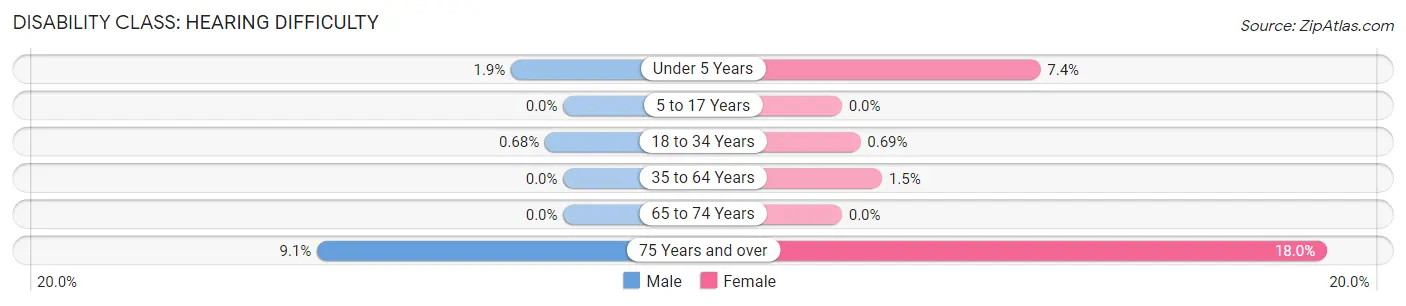
| Age Bracket | Male | Female |
| Under 5 Years | 4 (1.9%) | 14 (7.4%) |
| 5 to 17 Years | 0 (0.0%) | 0 (0.0%) |
| 18 to 34 Years | 4 (0.7%) | 4 (0.7%) |
| 35 to 64 Years | 0 (0.0%) | 18 (1.5%) |
| 65 to 74 Years | 0 (0.0%) | 0 (0.0%) |
| 75 Years and over | 17 (9.1%) | 38 (18.0%) |
Disability Class: Vision Difficulty
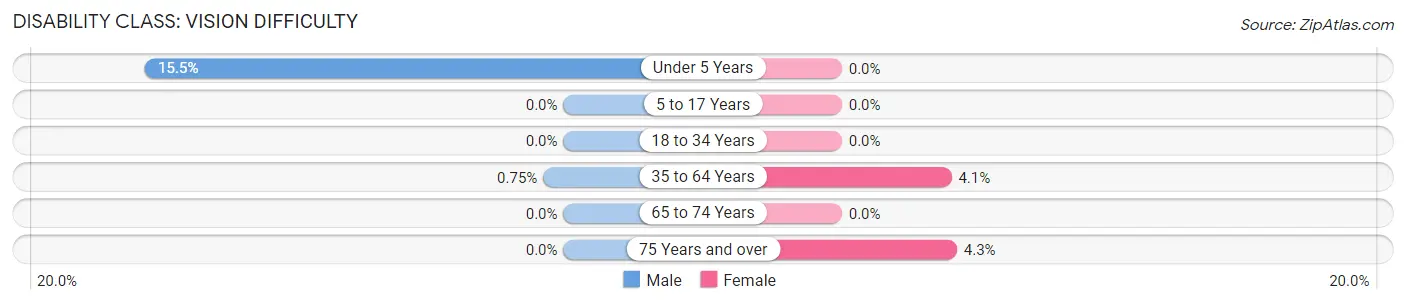
| Age Bracket | Male | Female |
| Under 5 Years | 32 (15.5%) | 0 (0.0%) |
| 5 to 17 Years | 0 (0.0%) | 0 (0.0%) |
| 18 to 34 Years | 0 (0.0%) | 0 (0.0%) |
| 35 to 64 Years | 9 (0.7%) | 49 (4.1%) |
| 65 to 74 Years | 0 (0.0%) | 0 (0.0%) |
| 75 Years and over | 0 (0.0%) | 9 (4.3%) |
Disability Class: Cognitive Difficulty
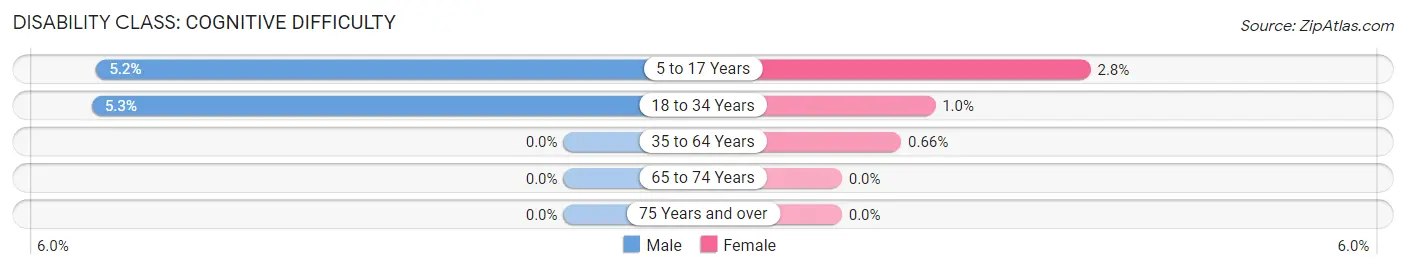
| Age Bracket | Male | Female |
| 5 to 17 Years | 38 (5.2%) | 22 (2.8%) |
| 18 to 34 Years | 31 (5.2%) | 6 (1.0%) |
| 35 to 64 Years | 0 (0.0%) | 8 (0.7%) |
| 65 to 74 Years | 0 (0.0%) | 0 (0.0%) |
| 75 Years and over | 0 (0.0%) | 0 (0.0%) |
Disability Class: Ambulatory Difficulty
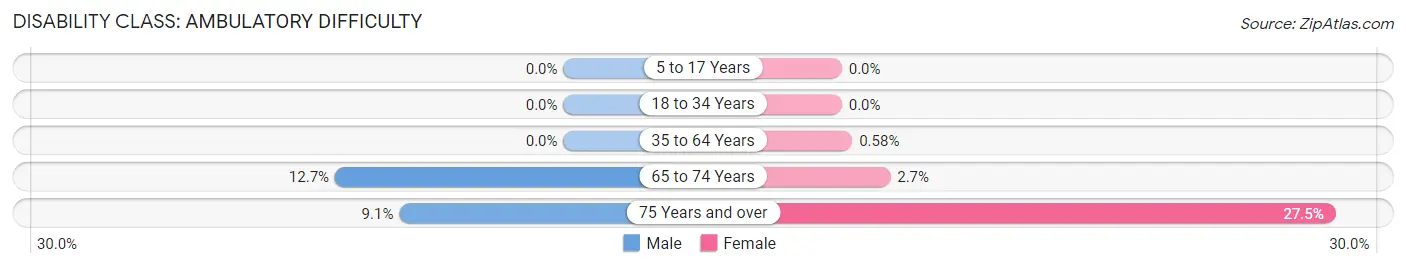
| Age Bracket | Male | Female |
| 5 to 17 Years | 0 (0.0%) | 0 (0.0%) |
| 18 to 34 Years | 0 (0.0%) | 0 (0.0%) |
| 35 to 64 Years | 0 (0.0%) | 7 (0.6%) |
| 65 to 74 Years | 29 (12.7%) | 12 (2.7%) |
| 75 Years and over | 17 (9.1%) | 58 (27.5%) |
Disability Class: Self-Care Difficulty
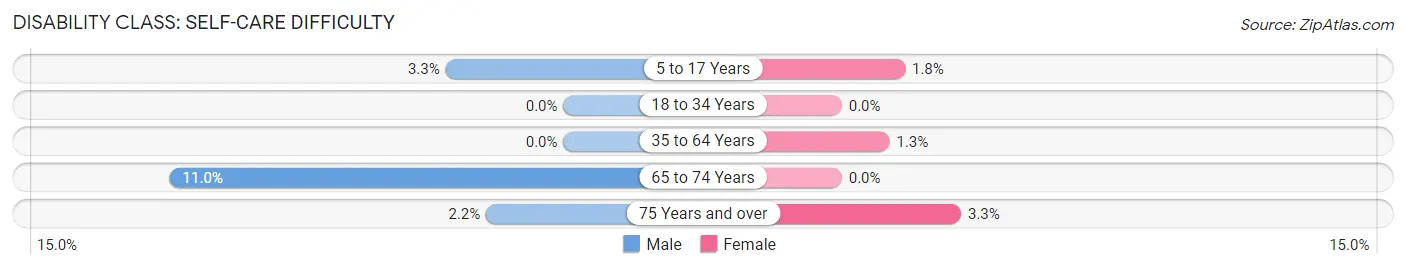
| Age Bracket | Male | Female |
| 5 to 17 Years | 24 (3.3%) | 14 (1.8%) |
| 18 to 34 Years | 0 (0.0%) | 0 (0.0%) |
| 35 to 64 Years | 0 (0.0%) | 16 (1.3%) |
| 65 to 74 Years | 25 (11.0%) | 0 (0.0%) |
| 75 Years and over | 4 (2.1%) | 7 (3.3%) |
Technology Access in Bronxville
Computing Device Access in Bronxville
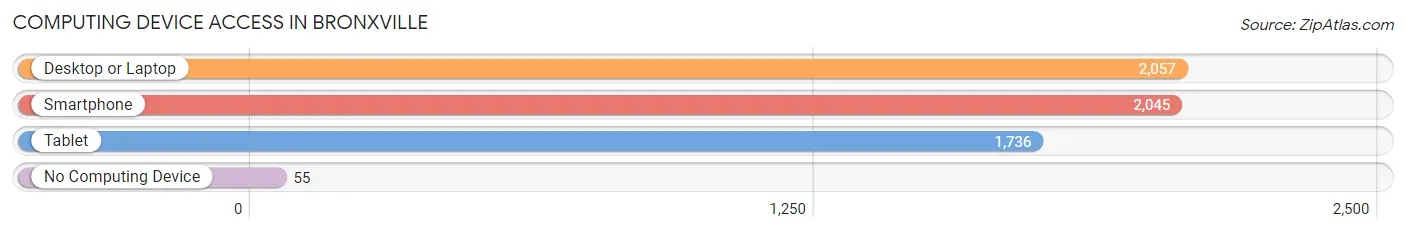
| Device Type | # Households | % Households |
| Desktop or Laptop | 2,057 | 95.4% |
| Smartphone | 2,045 | 94.8% |
| Tablet | 1,736 | 80.5% |
| No Computing Device | 55 | 2.5% |
| Total | 2,157 | 100.0% |
Internet Access in Bronxville
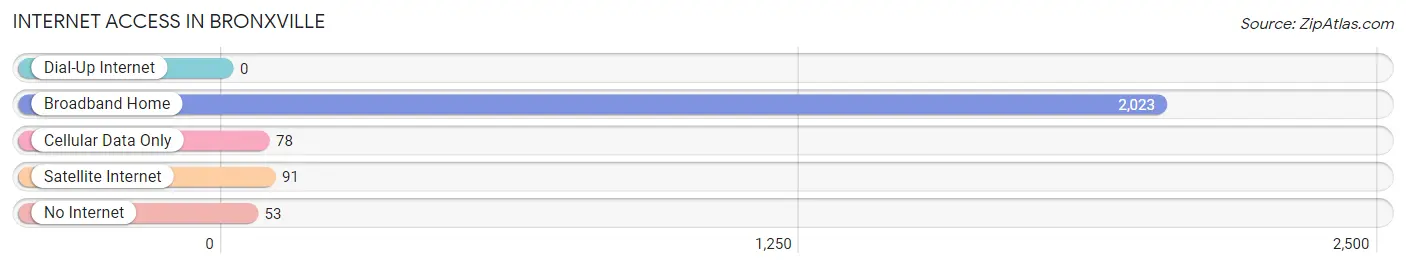
| Internet Type | # Households | % Households |
| Dial-Up Internet | 0 | 0.0% |
| Broadband Home | 2,023 | 93.8% |
| Cellular Data Only | 78 | 3.6% |
| Satellite Internet | 91 | 4.2% |
| No Internet | 53 | 2.5% |
| Total | 2,157 | 100.0% |
Bronxville Summary
Bronxville, NY is a village located in Westchester County, New York. It is situated about 15 miles north of Manhattan and is part of the town of Eastchester. The village has a population of 6,543 as of the 2010 census.
History
The area that is now Bronxville was originally inhabited by the Siwanoy Native American tribe. The first European settlers arrived in the area in 1683 and the village was officially incorporated in 1898. The village was named after the Bronx River, which runs through the area.
In the late 19th century, the village became a popular summer destination for wealthy New Yorkers. This led to the development of many grand estates and mansions in the area. The village was also home to several prominent figures, including John F. Kennedy, who lived in Bronxville from 1927 to 1929.
Geography
Bronxville is located in southeastern Westchester County, about 15 miles north of Manhattan. It is bordered by the towns of Eastchester, Mount Vernon, and New Rochelle. The village is situated on the Bronx River, which runs through the area.
The village has a total area of 1.2 square miles, all of which is land. The terrain is mostly hilly, with elevations ranging from 200 to 400 feet above sea level.
Economy
The economy of Bronxville is largely based on retail and services. The village is home to several small businesses, including restaurants, boutiques, and professional services. The village is also home to several corporate offices, including those of PepsiCo and IBM.
The median household income in Bronxville is $150,000, which is significantly higher than the national average. The unemployment rate is also lower than the national average, at 3.2%.
Demographics
As of the 2010 census, the population of Bronxville was 6,543. The racial makeup of the village was 87.2% White, 5.3% African American, 0.2% Native American, 4.2% Asian, and 2.9% from other races. Hispanic or Latino of any race were 8.2% of the population.
The median age in Bronxville is 43.3 years, with 24.3% of the population under the age of 18 and 11.2% over the age of 65. The village has a higher percentage of college-educated adults than the national average, with 57.2% of adults having a bachelor's degree or higher.
The village is also home to a large number of foreign-born residents, with 28.2% of the population being foreign-born. The largest foreign-born population is from India, with 8.2% of the population being of Indian descent.
Common Questions
What is Per Capita Income in Bronxville?
Per Capita income in Bronxville is $137,579.
What is the Median Family Income in Bronxville?
Median Family Income in Bronxville is $250,001.
What is the Median Household income in Bronxville?
Median Household Income in Bronxville is $206,850.
What is Income or Wage Gap in Bronxville?
Income or Wage Gap in Bronxville is 32.5%.
Women in Bronxville earn 67.5 cents for every dollar earned by a man.
What is Inequality or Gini Index in Bronxville?
Inequality or Gini Index in Bronxville is 0.57.
What is the Total Population of Bronxville?
Total Population of Bronxville is 6,570.
What is the Total Male Population of Bronxville?
Total Male Population of Bronxville is 3,141.
What is the Total Female Population of Bronxville?
Total Female Population of Bronxville is 3,429.
What is the Ratio of Males per 100 Females in Bronxville?
There are 91.60 Males per 100 Females in Bronxville.
What is the Ratio of Females per 100 Males in Bronxville?
There are 109.17 Females per 100 Males in Bronxville.
What is the Median Population Age in Bronxville?
Median Population Age in Bronxville is 37.9 Years.
What is the Average Family Size in Bronxville
Average Family Size in Bronxville is 3.4 People.
What is the Average Household Size in Bronxville
Average Household Size in Bronxville is 3.0 People.
How Large is the Labor Force in Bronxville?
There are 2,872 People in the Labor Forcein in Bronxville.
What is the Percentage of People in the Labor Force in Bronxville?
59.2% of People are in the Labor Force in Bronxville.
What is the Unemployment Rate in Bronxville?
Unemployment Rate in Bronxville is 3.5%.