Blauvelt, NY Map & Demographics
Blauvelt Map
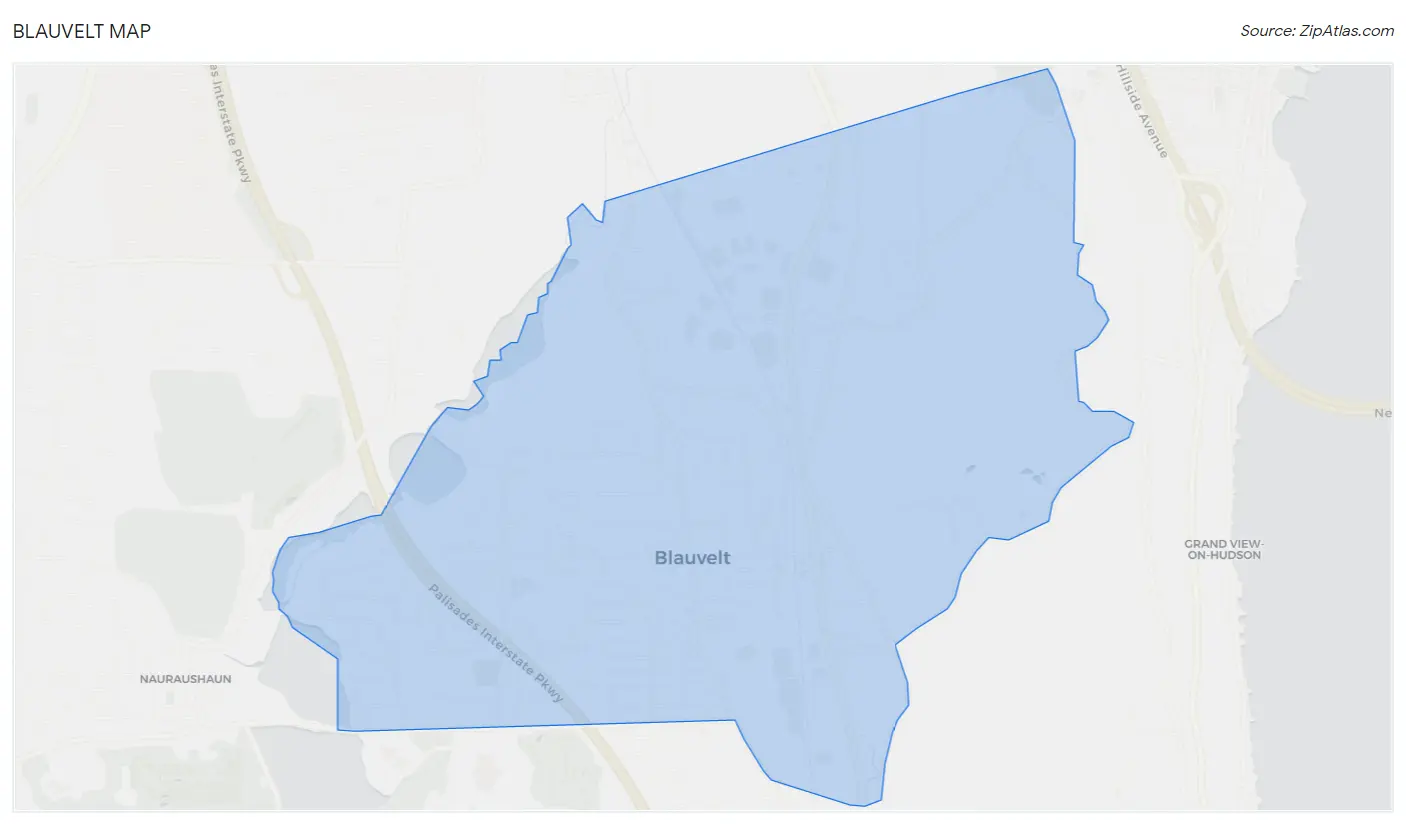
Blauvelt Overview
$55,473
PER CAPITA INCOME
$177,026
AVG FAMILY INCOME
$171,786
AVG HOUSEHOLD INCOME
31.2%
WAGE / INCOME GAP [ % ]
68.8¢/ $1
WAGE / INCOME GAP [ $ ]
0.39
INEQUALITY / GINI INDEX
5,154
TOTAL POPULATION
2,597
MALE POPULATION
2,557
FEMALE POPULATION
101.56
MALES / 100 FEMALES
98.46
FEMALES / 100 MALES
42.2
MEDIAN AGE
3.4
AVG FAMILY SIZE
3.1
AVG HOUSEHOLD SIZE
2,695
LABOR FORCE [ PEOPLE ]
62.8%
PERCENT IN LABOR FORCE
5.7%
UNEMPLOYMENT RATE
Blauvelt Zip Codes
Blauvelt Area Codes
Income in Blauvelt
Income Overview in Blauvelt
Per Capita Income in Blauvelt is $55,473, while median incomes of families and households are $177,026 and $171,786 respectively.
| Characteristic | Number | Measure |
| Per Capita Income | 5,154 | $55,473 |
| Median Family Income | 1,263 | $177,026 |
| Mean Family Income | 1,263 | $183,910 |
| Median Household Income | 1,520 | $171,786 |
| Mean Household Income | 1,520 | $174,475 |
| Income Deficit | 1,263 | $0 |
| Wage / Income Gap (%) | 5,154 | 31.19% |
| Wage / Income Gap ($) | 5,154 | 68.81¢ per $1 |
| Gini / Inequality Index | 5,154 | 0.39 |
Earnings by Sex in Blauvelt
Average Earnings in Blauvelt are $67,675, $80,595 for men and $55,455 for women, a difference of 31.2%.
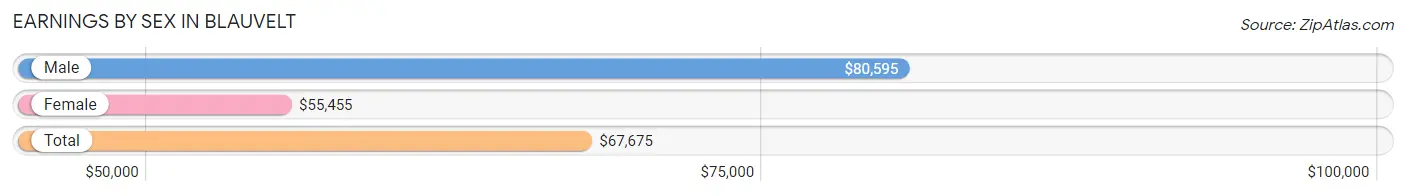
| Sex | Number | Average Earnings |
| Male | 1,521 (52.3%) | $80,595 |
| Female | 1,386 (47.7%) | $55,455 |
| Total | 2,907 (100.0%) | $67,675 |
Earnings by Sex by Income Bracket in Blauvelt
The most common earnings brackets in Blauvelt are $100,000+ for men (656 | 43.1%) and $100,000+ for women (358 | 25.8%).
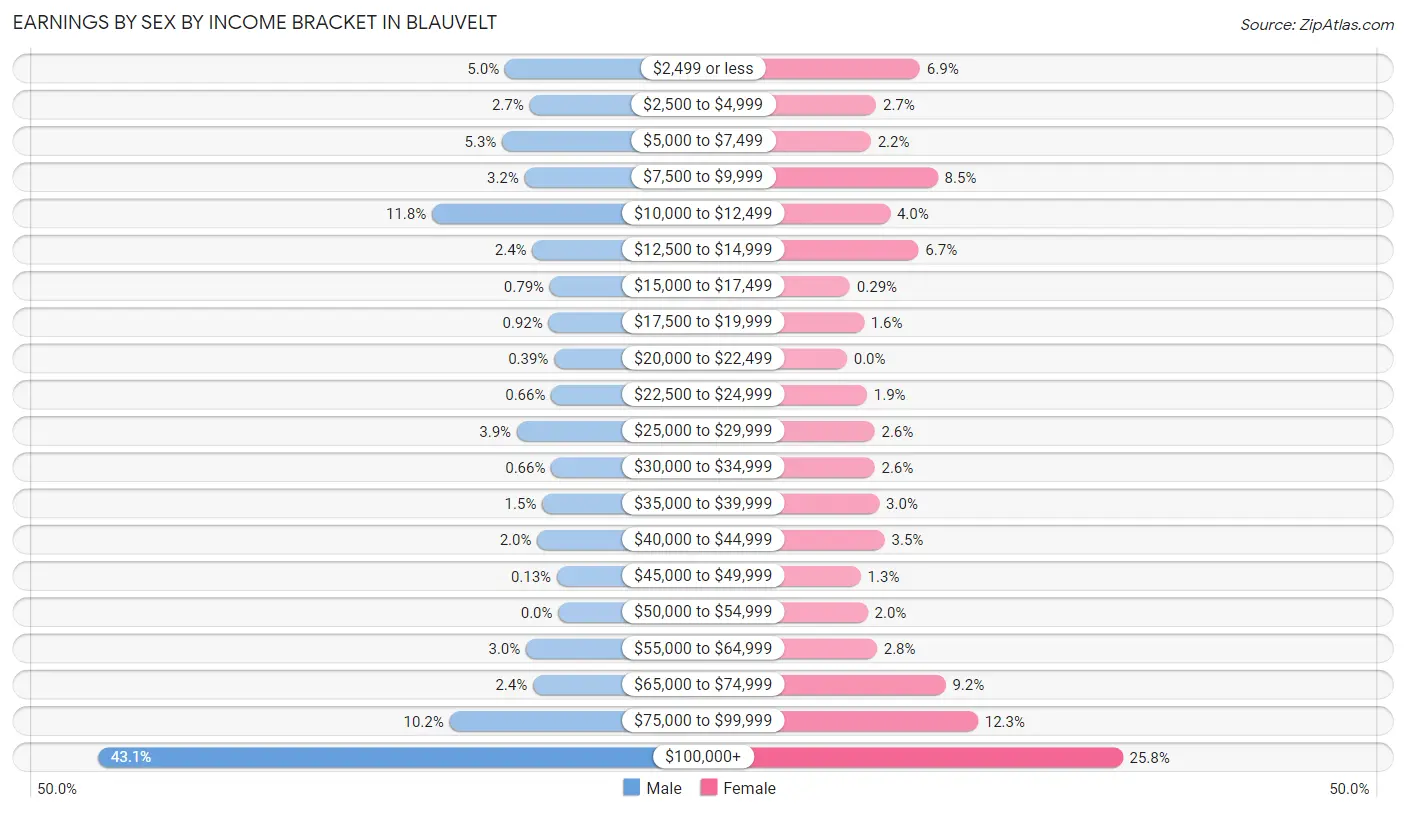
| Income | Male | Female |
| $2,499 or less | 76 (5.0%) | 95 (6.9%) |
| $2,500 to $4,999 | 41 (2.7%) | 38 (2.7%) |
| $5,000 to $7,499 | 80 (5.3%) | 31 (2.2%) |
| $7,500 to $9,999 | 48 (3.2%) | 118 (8.5%) |
| $10,000 to $12,499 | 180 (11.8%) | 56 (4.0%) |
| $12,500 to $14,999 | 37 (2.4%) | 93 (6.7%) |
| $15,000 to $17,499 | 12 (0.8%) | 4 (0.3%) |
| $17,500 to $19,999 | 14 (0.9%) | 22 (1.6%) |
| $20,000 to $22,499 | 6 (0.4%) | 0 (0.0%) |
| $22,500 to $24,999 | 10 (0.7%) | 26 (1.9%) |
| $25,000 to $29,999 | 59 (3.9%) | 36 (2.6%) |
| $30,000 to $34,999 | 10 (0.7%) | 36 (2.6%) |
| $35,000 to $39,999 | 23 (1.5%) | 42 (3.0%) |
| $40,000 to $44,999 | 30 (2.0%) | 49 (3.5%) |
| $45,000 to $49,999 | 2 (0.1%) | 18 (1.3%) |
| $50,000 to $54,999 | 0 (0.0%) | 27 (1.9%) |
| $55,000 to $64,999 | 46 (3.0%) | 39 (2.8%) |
| $65,000 to $74,999 | 36 (2.4%) | 128 (9.2%) |
| $75,000 to $99,999 | 155 (10.2%) | 170 (12.3%) |
| $100,000+ | 656 (43.1%) | 358 (25.8%) |
| Total | 1,521 (100.0%) | 1,386 (100.0%) |
Earnings by Sex by Educational Attainment in Blauvelt
Average earnings in Blauvelt are $100,104 for men and $73,542 for women, a difference of 26.5%. Men with an educational attainment of graduate degree enjoy the highest average annual earnings of $134,773, while those with college or associate's degree education earn the least with $80,930. Women with an educational attainment of graduate degree earn the most with the average annual earnings of $101,094, while those with college or associate's degree education have the smallest earnings of $38,221.
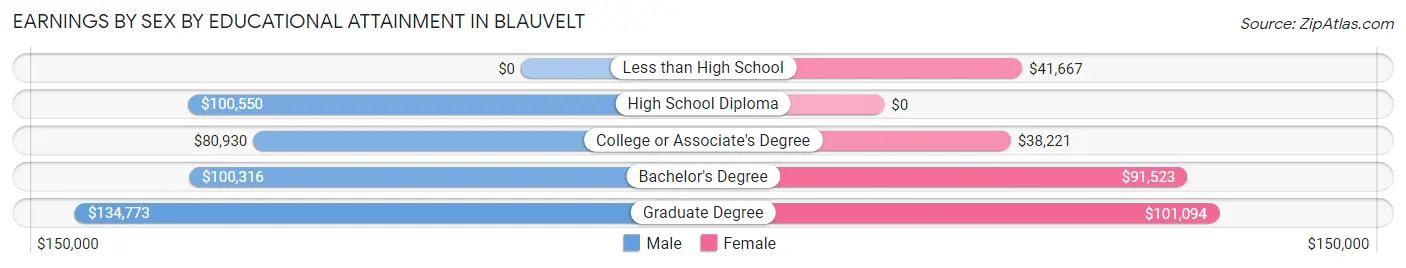
| Educational Attainment | Male Income | Female Income |
| Less than High School | - | - |
| High School Diploma | $100,550 | $0 |
| College or Associate's Degree | $80,930 | $38,221 |
| Bachelor's Degree | $100,316 | $91,523 |
| Graduate Degree | $134,773 | $101,094 |
| Total | $100,104 | $73,542 |
Family Income in Blauvelt
Family Income Brackets in Blauvelt
According to the Blauvelt family income data, there are 458 families falling into the $200,000+ income range, which is the most common income bracket and makes up 36.3% of all families.
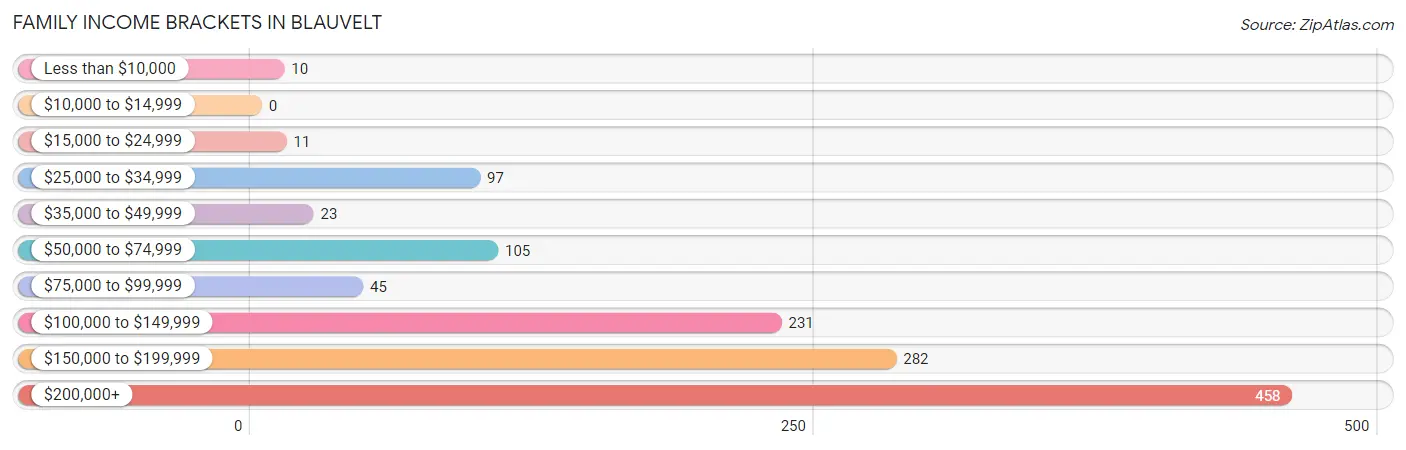
| Income Bracket | # Families | % Families |
| Less than $10,000 | 10 | 0.8% |
| $10,000 to $14,999 | 0 | 0.0% |
| $15,000 to $24,999 | 11 | 0.9% |
| $25,000 to $34,999 | 97 | 7.7% |
| $35,000 to $49,999 | 23 | 1.8% |
| $50,000 to $74,999 | 105 | 8.3% |
| $75,000 to $99,999 | 45 | 3.6% |
| $100,000 to $149,999 | 231 | 18.3% |
| $150,000 to $199,999 | 282 | 22.3% |
| $200,000+ | 458 | 36.3% |
Family Income by Famaliy Size in Blauvelt
3-person families (199 | 15.8%) account for the highest median family income in Blauvelt with $216,161 per family, while 3-person families (199 | 15.8%) have the highest median income of $72,054 per family member.
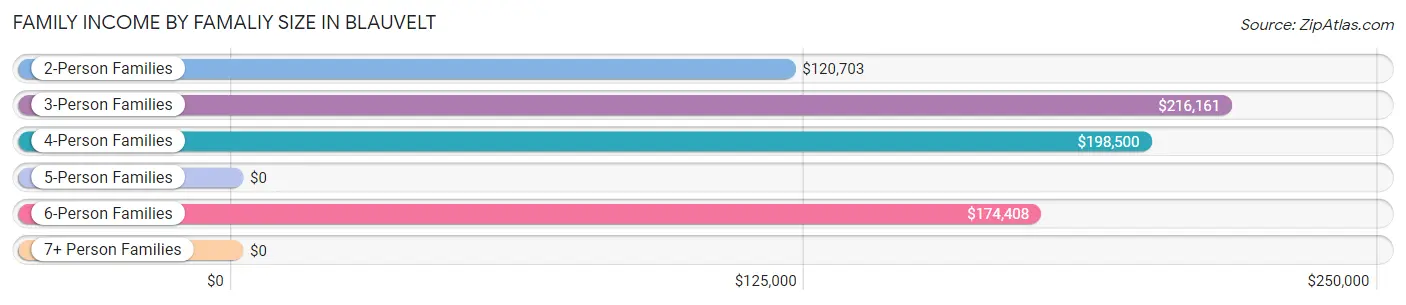
| Income Bracket | # Families | Median Income |
| 2-Person Families | 563 (44.6%) | $120,703 |
| 3-Person Families | 199 (15.8%) | $216,161 |
| 4-Person Families | 250 (19.8%) | $198,500 |
| 5-Person Families | 144 (11.4%) | $0 |
| 6-Person Families | 75 (5.9%) | $174,408 |
| 7+ Person Families | 32 (2.5%) | $0 |
| Total | 1,263 (100.0%) | $177,026 |
Family Income by Number of Earners in Blauvelt
The median family income in Blauvelt is $177,026, with families comprising 3+ earners (199) having the highest median family income of $250,001, while families with no earners (209) have the lowest median family income of $67,604, accounting for 15.8% and 16.6% of families, respectively.
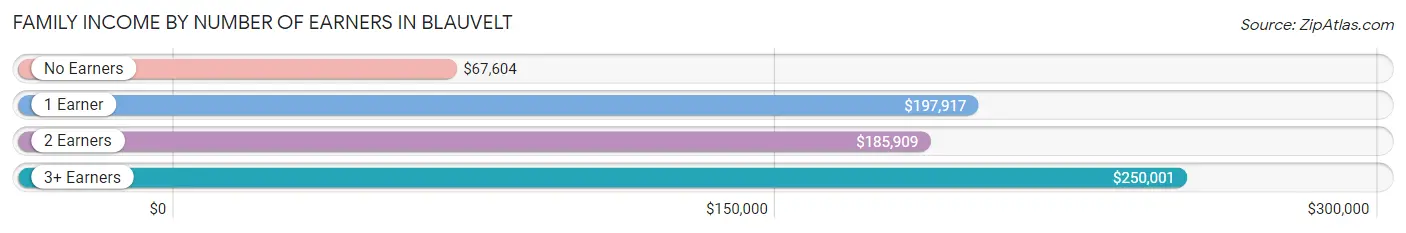
| Number of Earners | # Families | Median Income |
| No Earners | 209 (16.6%) | $67,604 |
| 1 Earner | 221 (17.5%) | $197,917 |
| 2 Earners | 634 (50.2%) | $185,909 |
| 3+ Earners | 199 (15.8%) | $250,001 |
| Total | 1,263 (100.0%) | $177,026 |
Household Income in Blauvelt
Household Income Brackets in Blauvelt
With 512 households falling in the category, the $200,000+ income range is the most frequent in Blauvelt, accounting for 33.7% of all households.
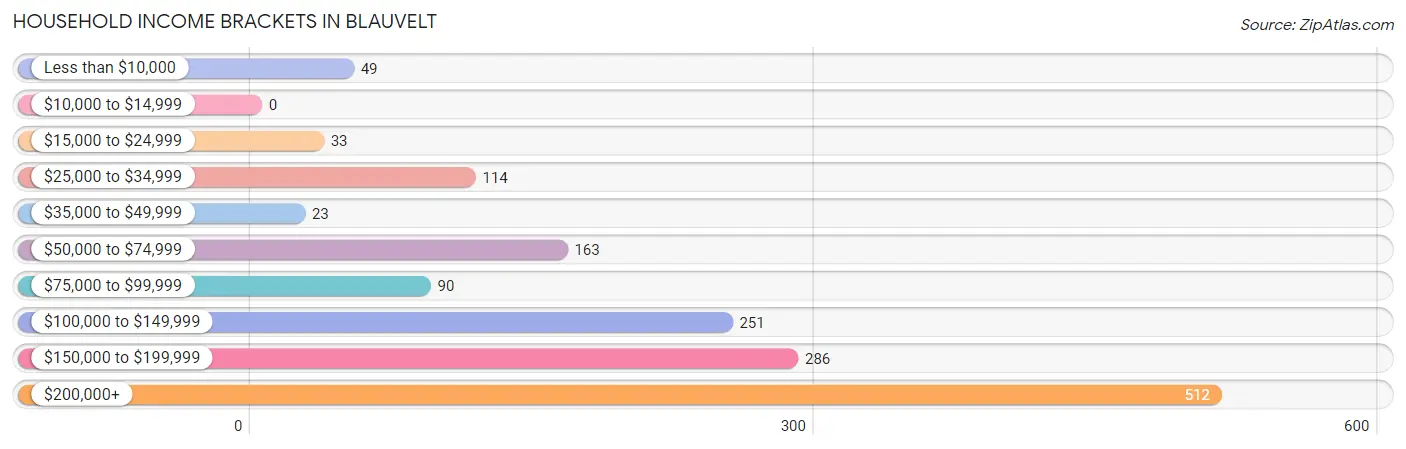
| Income Bracket | # Households | % Households |
| Less than $10,000 | 49 | 3.2% |
| $10,000 to $14,999 | 0 | 0.0% |
| $15,000 to $24,999 | 33 | 2.2% |
| $25,000 to $34,999 | 114 | 7.5% |
| $35,000 to $49,999 | 23 | 1.5% |
| $50,000 to $74,999 | 163 | 10.7% |
| $75,000 to $99,999 | 90 | 5.9% |
| $100,000 to $149,999 | 251 | 16.5% |
| $150,000 to $199,999 | 286 | 18.8% |
| $200,000+ | 512 | 33.7% |
Household Income by Householder Age in Blauvelt
The median household income in Blauvelt is $171,786, with the highest median household income of $207,500 found in the 45 to 64 years age bracket for the primary householder. A total of 646 households (42.5%) fall into this category.

| Income Bracket | # Households | Median Income |
| 15 to 24 Years | 0 (0.0%) | $0 |
| 25 to 44 Years | 305 (20.1%) | $112,083 |
| 45 to 64 Years | 646 (42.5%) | $207,500 |
| 65+ Years | 569 (37.4%) | $86,281 |
| Total | 1,520 (100.0%) | $171,786 |
Poverty in Blauvelt
Income Below Poverty by Sex and Age in Blauvelt
With 6.9% poverty level for males and 6.2% for females among the residents of Blauvelt, 15 year old males and 75 year old and over females are the most vulnerable to poverty, with 22 males (100.0%) and 61 females (21.2%) in their respective age groups living below the poverty level.
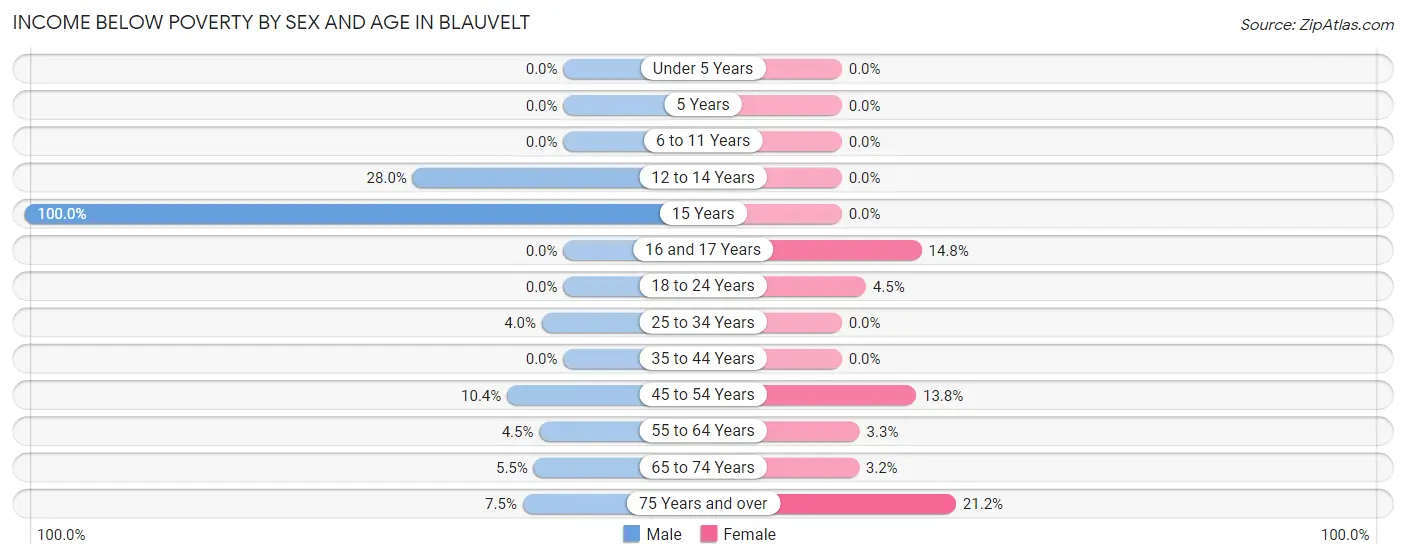
| Age Bracket | Male | Female |
| Under 5 Years | 0 (0.0%) | 0 (0.0%) |
| 5 Years | 0 (0.0%) | 0 (0.0%) |
| 6 to 11 Years | 0 (0.0%) | 0 (0.0%) |
| 12 to 14 Years | 40 (28.0%) | 0 (0.0%) |
| 15 Years | 22 (100.0%) | 0 (0.0%) |
| 16 and 17 Years | 0 (0.0%) | 8 (14.8%) |
| 18 to 24 Years | 0 (0.0%) | 9 (4.5%) |
| 25 to 34 Years | 14 (4.0%) | 0 (0.0%) |
| 35 to 44 Years | 0 (0.0%) | 0 (0.0%) |
| 45 to 54 Years | 38 (10.4%) | 51 (13.8%) |
| 55 to 64 Years | 19 (4.5%) | 10 (3.3%) |
| 65 to 74 Years | 9 (5.5%) | 8 (3.2%) |
| 75 Years and over | 23 (7.5%) | 61 (21.2%) |
| Total | 165 (6.9%) | 147 (6.2%) |
Income Above Poverty by Sex and Age in Blauvelt
According to the poverty statistics in Blauvelt, males aged under 5 years and females aged under 5 years are the age groups that are most secure financially, with 100.0% of males and 100.0% of females in these age groups living above the poverty line.
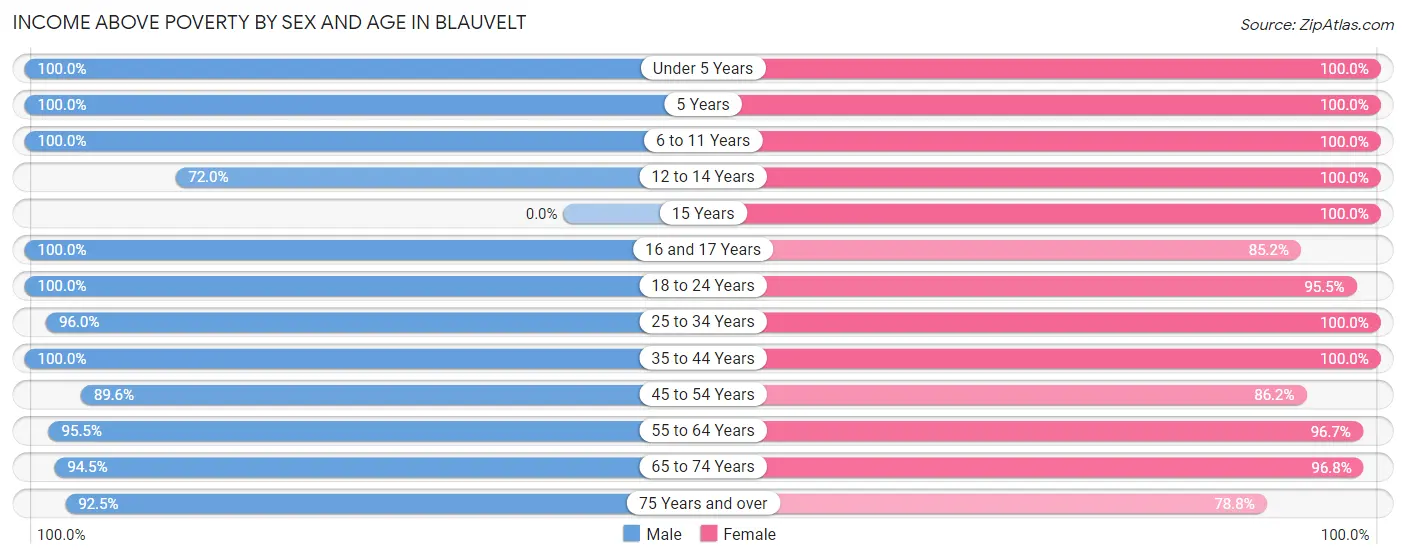
| Age Bracket | Male | Female |
| Under 5 Years | 53 (100.0%) | 73 (100.0%) |
| 5 Years | 6 (100.0%) | 68 (100.0%) |
| 6 to 11 Years | 125 (100.0%) | 180 (100.0%) |
| 12 to 14 Years | 103 (72.0%) | 89 (100.0%) |
| 15 Years | 0 (0.0%) | 88 (100.0%) |
| 16 and 17 Years | 57 (100.0%) | 46 (85.2%) |
| 18 to 24 Years | 142 (100.0%) | 192 (95.5%) |
| 25 to 34 Years | 337 (96.0%) | 228 (100.0%) |
| 35 to 44 Years | 244 (100.0%) | 177 (100.0%) |
| 45 to 54 Years | 326 (89.6%) | 319 (86.2%) |
| 55 to 64 Years | 407 (95.5%) | 291 (96.7%) |
| 65 to 74 Years | 154 (94.5%) | 245 (96.8%) |
| 75 Years and over | 282 (92.5%) | 227 (78.8%) |
| Total | 2,236 (93.1%) | 2,223 (93.8%) |
Income Below Poverty Among Married-Couple Families in Blauvelt
The poverty statistics for married-couple families in Blauvelt show that 4.1% or 45 of the total 1,096 families live below the poverty line. Families with 3 or 4 children have the highest poverty rate of 17.8%, comprising of 23 families. On the other hand, families with 5 or more children have the lowest poverty rate of 0.0%, which includes 0 families.
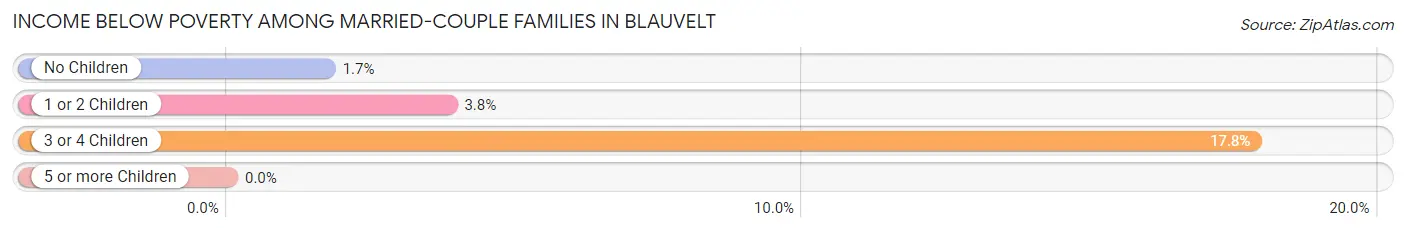
| Children | Above Poverty | Below Poverty |
| No Children | 637 (98.3%) | 11 (1.7%) |
| 1 or 2 Children | 277 (96.2%) | 11 (3.8%) |
| 3 or 4 Children | 106 (82.2%) | 23 (17.8%) |
| 5 or more Children | 31 (100.0%) | 0 (0.0%) |
| Total | 1,051 (95.9%) | 45 (4.1%) |
Income Below Poverty Among Single-Parent Households in Blauvelt
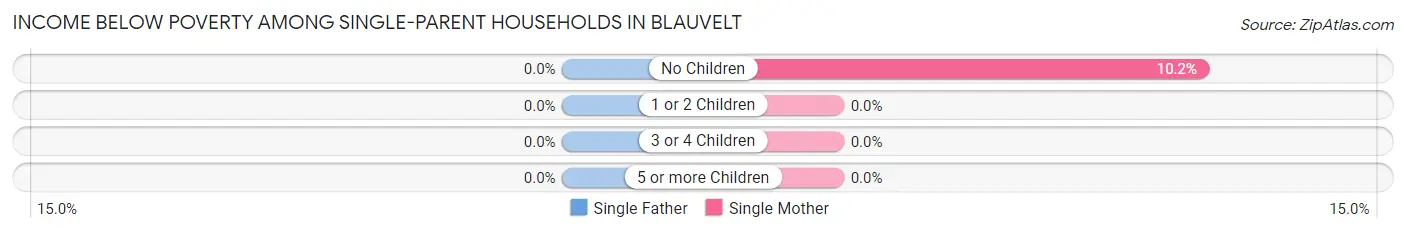
| Children | Single Father | Single Mother |
| No Children | 0 (0.0%) | 10 (10.2%) |
| 1 or 2 Children | 0 (0.0%) | 0 (0.0%) |
| 3 or 4 Children | 0 (0.0%) | 0 (0.0%) |
| 5 or more Children | 0 (0.0%) | 0 (0.0%) |
| Total | 0 (0.0%) | 10 (10.2%) |
Income Below Poverty Among Married-Couple vs Single-Parent Households in Blauvelt
The poverty data for Blauvelt shows that 45 of the married-couple family households (4.1%) and 10 of the single-parent households (6.0%) are living below the poverty level. Within the married-couple family households, those with 3 or 4 children have the highest poverty rate, with 23 households (17.8%) falling below the poverty line. Among the single-parent households, those with no children have the highest poverty rate, with 10 household (6.0%) living below poverty.
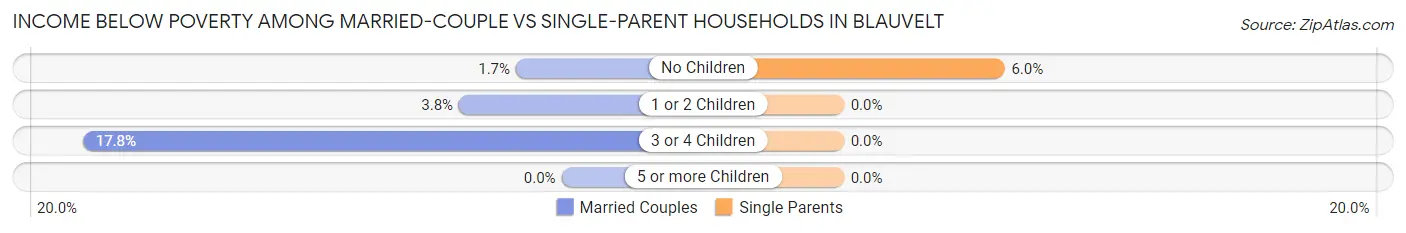
| Children | Married-Couple Families | Single-Parent Households |
| No Children | 11 (1.7%) | 10 (6.0%) |
| 1 or 2 Children | 11 (3.8%) | 0 (0.0%) |
| 3 or 4 Children | 23 (17.8%) | 0 (0.0%) |
| 5 or more Children | 0 (0.0%) | 0 (0.0%) |
| Total | 45 (4.1%) | 10 (6.0%) |
Race in Blauvelt
The most populous races in Blauvelt are White / Caucasian (4,209 | 81.7%), Two or more Races (464 | 9.0%), and Hispanic or Latino (406 | 7.9%).
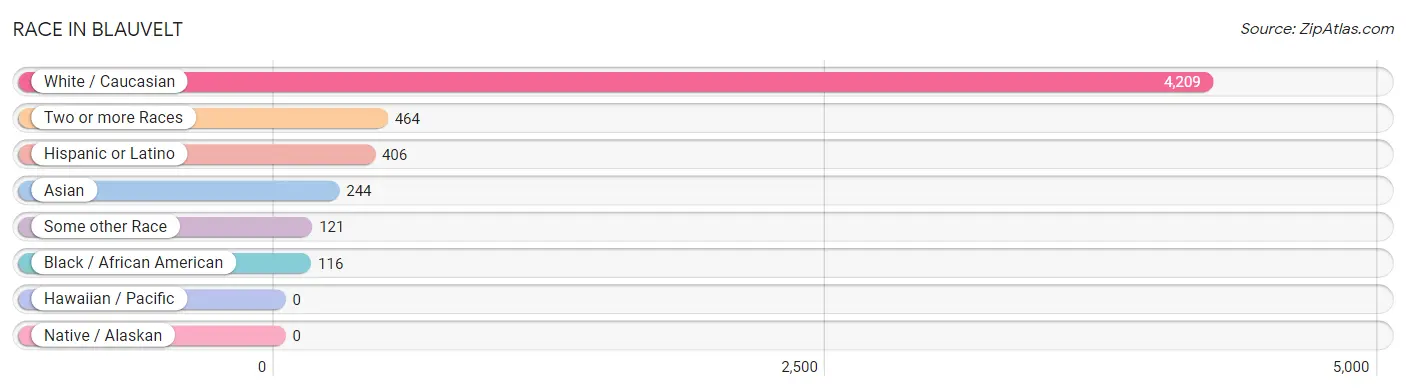
| Race | # Population | % Population |
| Asian | 244 | 4.7% |
| Black / African American | 116 | 2.2% |
| Hawaiian / Pacific | 0 | 0.0% |
| Hispanic or Latino | 406 | 7.9% |
| Native / Alaskan | 0 | 0.0% |
| White / Caucasian | 4,209 | 81.7% |
| Two or more Races | 464 | 9.0% |
| Some other Race | 121 | 2.4% |
| Total | 5,154 | 100.0% |
Ancestry in Blauvelt
The most populous ancestries reported in Blauvelt are Irish (1,512 | 29.3%), Italian (873 | 16.9%), German (467 | 9.1%), American (264 | 5.1%), and Polish (237 | 4.6%), together accounting for 65.1% of all Blauvelt residents.
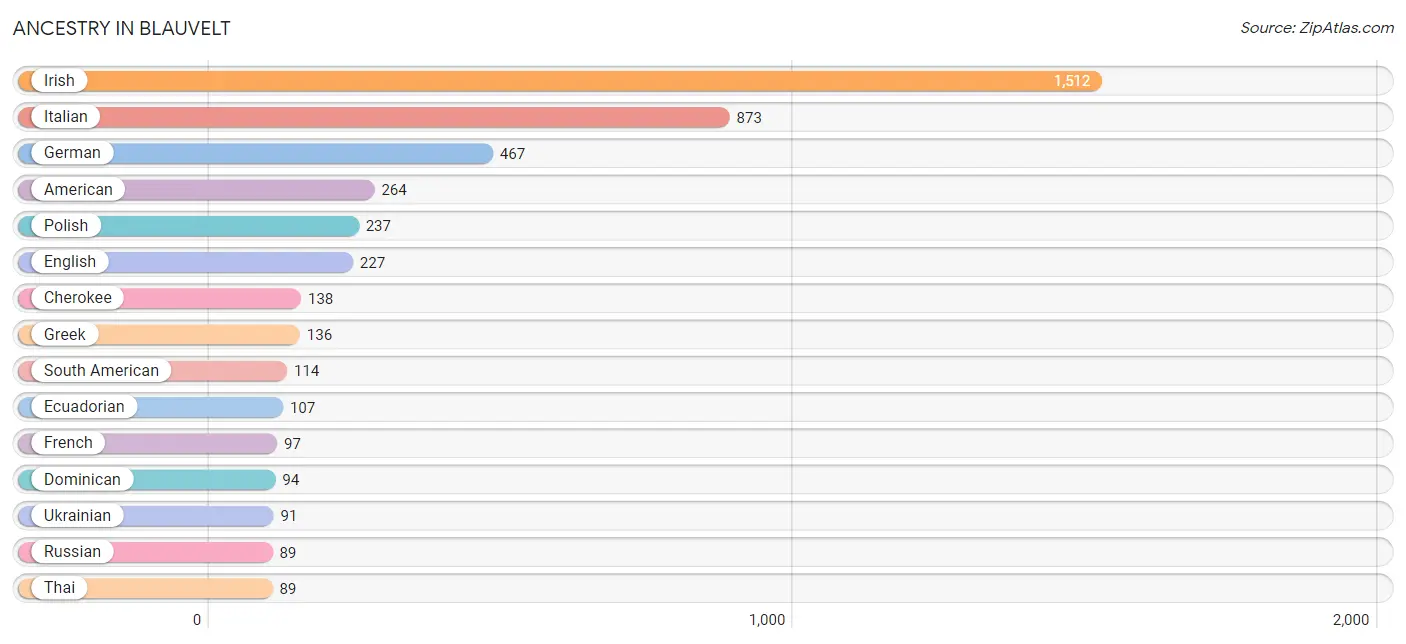
| Ancestry | # Population | % Population |
| African | 5 | 0.1% |
| Albanian | 10 | 0.2% |
| American | 264 | 5.1% |
| Austrian | 66 | 1.3% |
| Burmese | 79 | 1.5% |
| Canadian | 12 | 0.2% |
| Central American | 45 | 0.9% |
| Cherokee | 138 | 2.7% |
| Colombian | 7 | 0.1% |
| Cuban | 5 | 0.1% |
| Czech | 22 | 0.4% |
| Czechoslovakian | 13 | 0.3% |
| Dominican | 94 | 1.8% |
| Dutch | 64 | 1.2% |
| Eastern European | 35 | 0.7% |
| Ecuadorian | 107 | 2.1% |
| English | 227 | 4.4% |
| Estonian | 6 | 0.1% |
| European | 40 | 0.8% |
| Filipino | 10 | 0.2% |
| French | 97 | 1.9% |
| French Canadian | 31 | 0.6% |
| German | 467 | 9.1% |
| Ghanaian | 5 | 0.1% |
| Greek | 136 | 2.6% |
| Guyanese | 4 | 0.1% |
| Haitian | 6 | 0.1% |
| Honduran | 5 | 0.1% |
| Hungarian | 49 | 0.9% |
| Indian (Asian) | 43 | 0.8% |
| Irish | 1,512 | 29.3% |
| Israeli | 4 | 0.1% |
| Italian | 873 | 16.9% |
| Jamaican | 5 | 0.1% |
| Korean | 56 | 1.1% |
| Lithuanian | 6 | 0.1% |
| Mexican | 54 | 1.1% |
| Norwegian | 13 | 0.3% |
| Polish | 237 | 4.6% |
| Portuguese | 13 | 0.3% |
| Puerto Rican | 78 | 1.5% |
| Russian | 89 | 1.7% |
| Salvadoran | 40 | 0.8% |
| Scottish | 60 | 1.2% |
| Slovene | 25 | 0.5% |
| South American | 114 | 2.2% |
| Spaniard | 10 | 0.2% |
| Spanish | 6 | 0.1% |
| Subsaharan African | 5 | 0.1% |
| Swedish | 27 | 0.5% |
| Swiss | 24 | 0.5% |
| Thai | 89 | 1.7% |
| Ukrainian | 91 | 1.8% |
| Yugoslavian | 6 | 0.1% | View All 54 Rows |
Immigrants in Blauvelt
The most numerous immigrant groups reported in Blauvelt came from Asia (197 | 3.8%), Europe (151 | 2.9%), Latin America (141 | 2.7%), Eastern Asia (93 | 1.8%), and Korea (75 | 1.5%), together accounting for 12.8% of all Blauvelt residents.
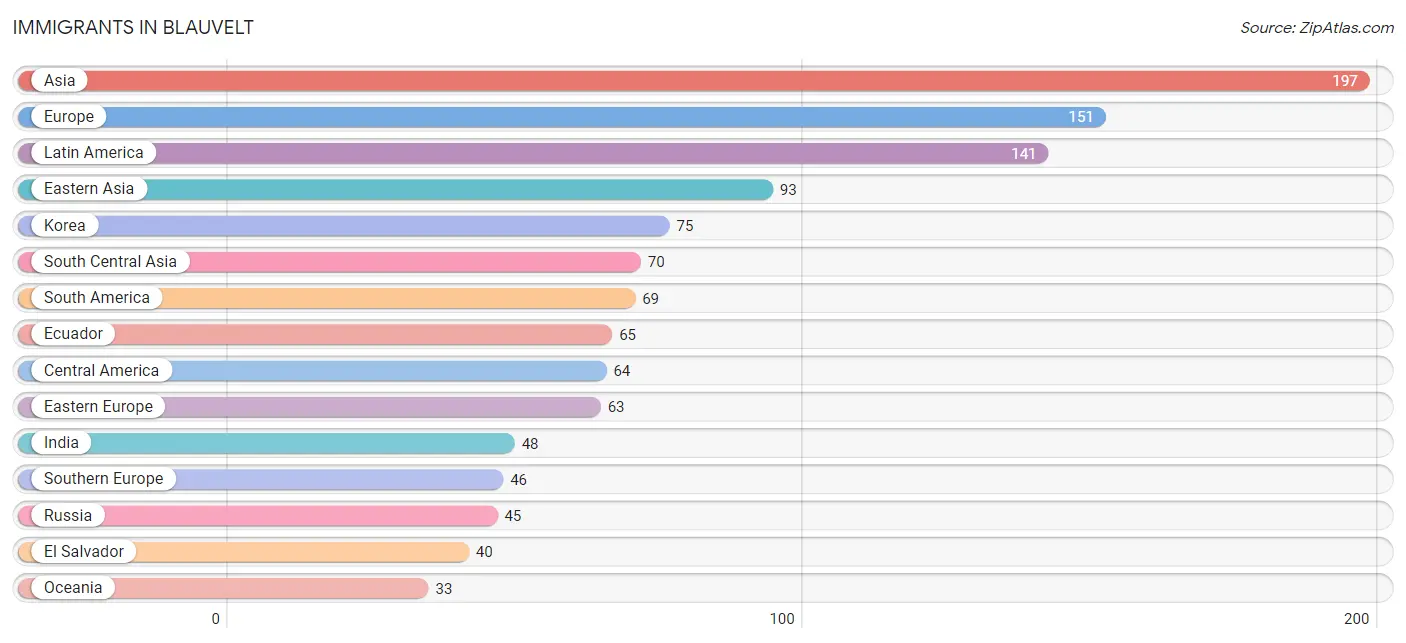
| Immigration Origin | # Population | % Population |
| Africa | 5 | 0.1% |
| Asia | 197 | 3.8% |
| Canada | 17 | 0.3% |
| Caribbean | 8 | 0.2% |
| Central America | 64 | 1.2% |
| China | 18 | 0.4% |
| Dominican Republic | 8 | 0.2% |
| Eastern Asia | 93 | 1.8% |
| Eastern Europe | 63 | 1.2% |
| Ecuador | 65 | 1.3% |
| El Salvador | 40 | 0.8% |
| Europe | 151 | 2.9% |
| Germany | 21 | 0.4% |
| Ghana | 5 | 0.1% |
| Greece | 23 | 0.4% |
| Guyana | 4 | 0.1% |
| Hungary | 11 | 0.2% |
| India | 48 | 0.9% |
| Ireland | 21 | 0.4% |
| Israel | 11 | 0.2% |
| Italy | 18 | 0.4% |
| Korea | 75 | 1.5% |
| Latin America | 141 | 2.7% |
| Mexico | 24 | 0.5% |
| Moldova | 7 | 0.1% |
| Northern Europe | 21 | 0.4% |
| Oceania | 33 | 0.6% |
| Pakistan | 22 | 0.4% |
| Philippines | 23 | 0.4% |
| Russia | 45 | 0.9% |
| South America | 69 | 1.3% |
| South Central Asia | 70 | 1.4% |
| South Eastern Asia | 23 | 0.4% |
| Southern Europe | 46 | 0.9% |
| Spain | 5 | 0.1% |
| Taiwan | 6 | 0.1% |
| Western Africa | 5 | 0.1% |
| Western Asia | 11 | 0.2% |
| Western Europe | 21 | 0.4% | View All 39 Rows |
Sex and Age in Blauvelt
Sex and Age in Blauvelt
The most populous age groups in Blauvelt are 25 to 29 Years (265 | 10.2%) for men and 20 to 24 Years (343 | 13.4%) for women.
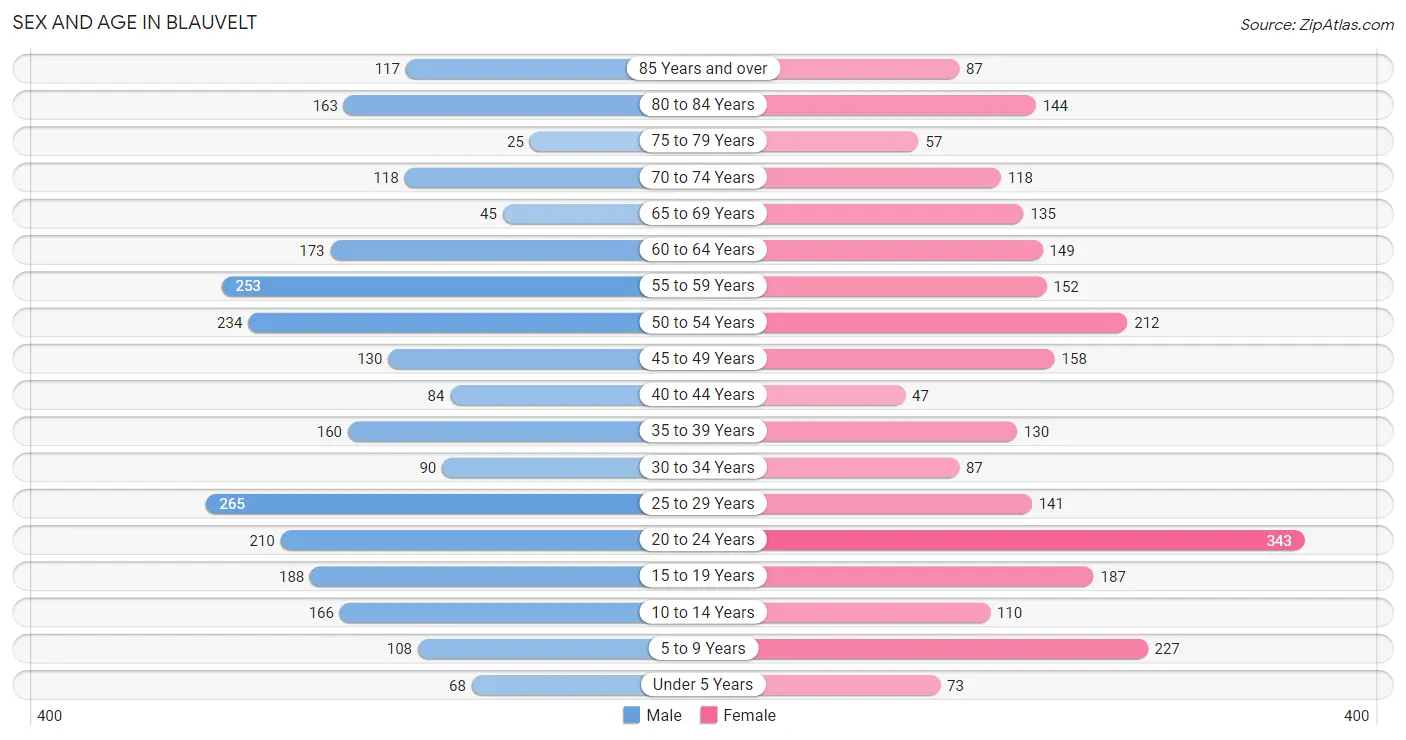
| Age Bracket | Male | Female |
| Under 5 Years | 68 (2.6%) | 73 (2.9%) |
| 5 to 9 Years | 108 (4.2%) | 227 (8.9%) |
| 10 to 14 Years | 166 (6.4%) | 110 (4.3%) |
| 15 to 19 Years | 188 (7.2%) | 187 (7.3%) |
| 20 to 24 Years | 210 (8.1%) | 343 (13.4%) |
| 25 to 29 Years | 265 (10.2%) | 141 (5.5%) |
| 30 to 34 Years | 90 (3.5%) | 87 (3.4%) |
| 35 to 39 Years | 160 (6.2%) | 130 (5.1%) |
| 40 to 44 Years | 84 (3.2%) | 47 (1.8%) |
| 45 to 49 Years | 130 (5.0%) | 158 (6.2%) |
| 50 to 54 Years | 234 (9.0%) | 212 (8.3%) |
| 55 to 59 Years | 253 (9.7%) | 152 (5.9%) |
| 60 to 64 Years | 173 (6.7%) | 149 (5.8%) |
| 65 to 69 Years | 45 (1.7%) | 135 (5.3%) |
| 70 to 74 Years | 118 (4.5%) | 118 (4.6%) |
| 75 to 79 Years | 25 (1.0%) | 57 (2.2%) |
| 80 to 84 Years | 163 (6.3%) | 144 (5.6%) |
| 85 Years and over | 117 (4.5%) | 87 (3.4%) |
| Total | 2,597 (100.0%) | 2,557 (100.0%) |
Families and Households in Blauvelt
Median Family Size in Blauvelt
The median family size in Blauvelt is 3.44 persons per family, with married-couple families (1,096 | 86.8%) accounting for the largest median family size of 3.59 persons per family. On the other hand, single male/father families (69 | 5.5%) represent the smallest median family size with 2.42 persons per family.
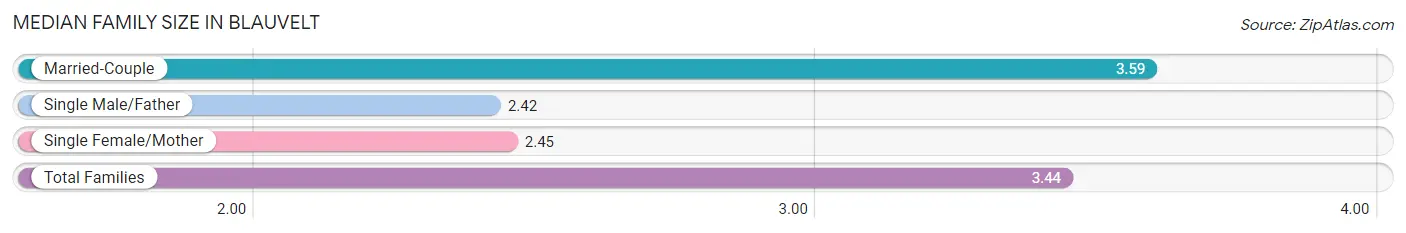
| Family Type | # Families | Family Size |
| Married-Couple | 1,096 (86.8%) | 3.59 |
| Single Male/Father | 69 (5.5%) | 2.42 |
| Single Female/Mother | 98 (7.8%) | 2.45 |
| Total Families | 1,263 (100.0%) | 3.44 |
Median Household Size in Blauvelt
The median household size in Blauvelt is 3.12 persons per household, with married-couple households (1,096 | 72.1%) accounting for the largest median household size of 3.68 persons per household. non-family households (257 | 16.9%) represent the smallest median household size with 1.16 persons per household.
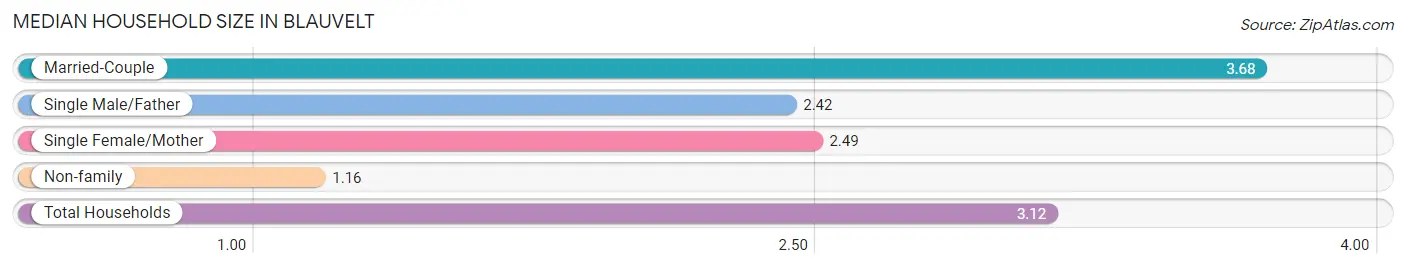
| Household Type | # Households | Household Size |
| Married-Couple | 1,096 (72.1%) | 3.68 |
| Single Male/Father | 69 (4.5%) | 2.42 |
| Single Female/Mother | 98 (6.5%) | 2.49 |
| Non-family | 257 (16.9%) | 1.16 |
| Total Households | 1,520 (100.0%) | 3.12 |
Household Size by Marriage Status in Blauvelt
Out of a total of 1,520 households in Blauvelt, 1,263 (83.1%) are family households, while 257 (16.9%) are nonfamily households. The most numerous type of family households are 2-person households, comprising 538, and the most common type of nonfamily households are 1-person households, comprising 225.
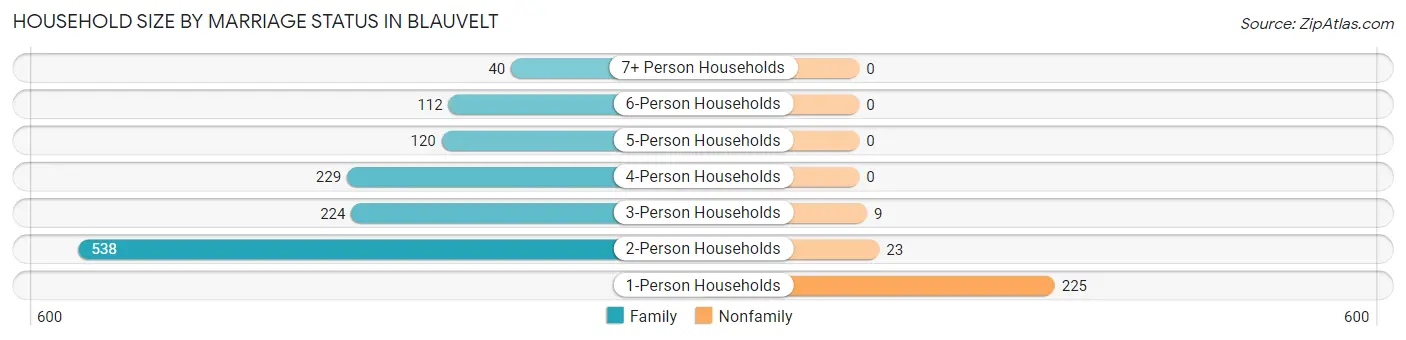
| Household Size | Family Households | Nonfamily Households |
| 1-Person Households | - | 225 (14.8%) |
| 2-Person Households | 538 (35.4%) | 23 (1.5%) |
| 3-Person Households | 224 (14.7%) | 9 (0.6%) |
| 4-Person Households | 229 (15.1%) | 0 (0.0%) |
| 5-Person Households | 120 (7.9%) | 0 (0.0%) |
| 6-Person Households | 112 (7.4%) | 0 (0.0%) |
| 7+ Person Households | 40 (2.6%) | 0 (0.0%) |
| Total | 1,263 (83.1%) | 257 (16.9%) |
Female Fertility in Blauvelt
Fertility by Age in Blauvelt
Average fertility rate in Blauvelt is 15.0 births per 1,000 women. Women in the age bracket of 20 to 34 years have the highest fertility rate with 30.0 births per 1,000 women. Women in the age bracket of 20 to 34 years acount for 100.0% of all women with births.
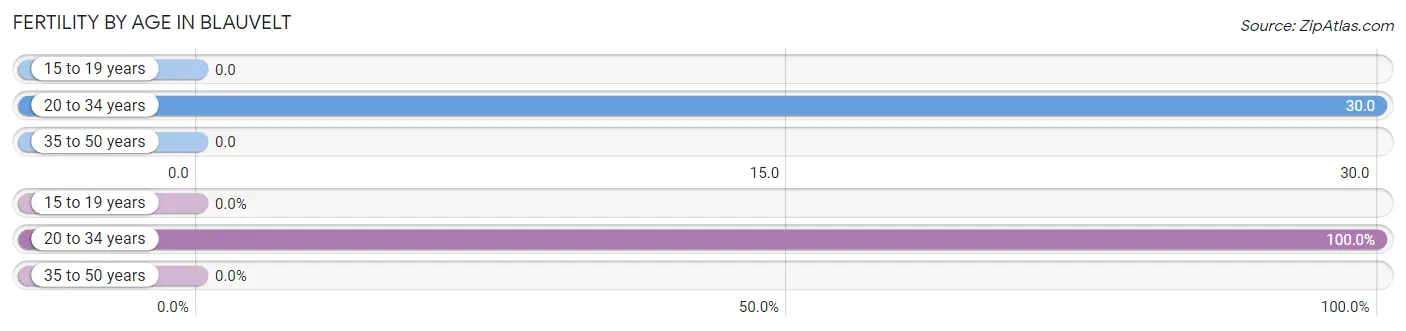
| Age Bracket | Women with Births | Births / 1,000 Women |
| 15 to 19 years | 0 (0.0%) | 0.0 |
| 20 to 34 years | 17 (100.0%) | 30.0 |
| 35 to 50 years | 0 (0.0%) | 0.0 |
| Total | 17 (100.0%) | 15.0 |
Fertility by Age by Marriage Status in Blauvelt
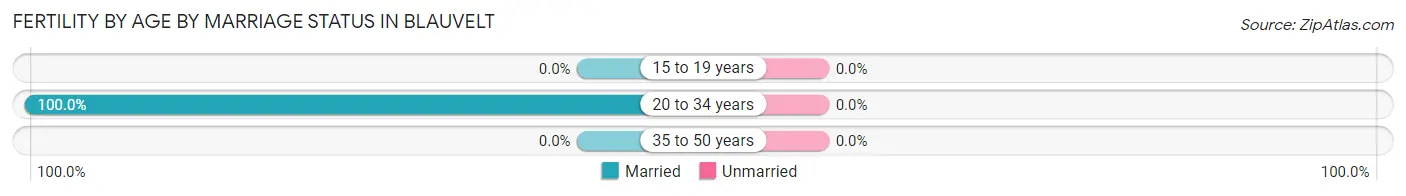
| Age Bracket | Married | Unmarried |
| 15 to 19 years | 0 (0.0%) | 0 (0.0%) |
| 20 to 34 years | 17 (100.0%) | 0 (0.0%) |
| 35 to 50 years | 0 (0.0%) | 0 (0.0%) |
| Total | 17 (100.0%) | 0 (0.0%) |
Fertility by Education in Blauvelt
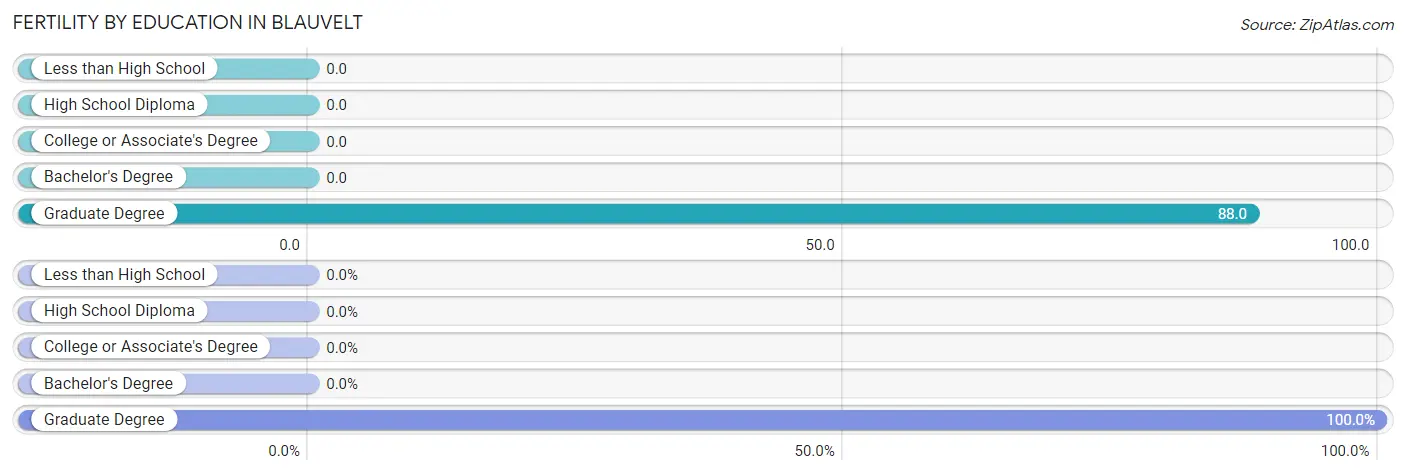
| Educational Attainment | Women with Births | Births / 1,000 Women |
| Less than High School | 0 (0.0%) | 0.0 |
| High School Diploma | 0 (0.0%) | 0.0 |
| College or Associate's Degree | 0 (0.0%) | 0.0 |
| Bachelor's Degree | 0 (0.0%) | 0.0 |
| Graduate Degree | 17 (100.0%) | 88.0 |
| Total | 17 (100.0%) | 15.0 |
Fertility by Education by Marriage Status in Blauvelt
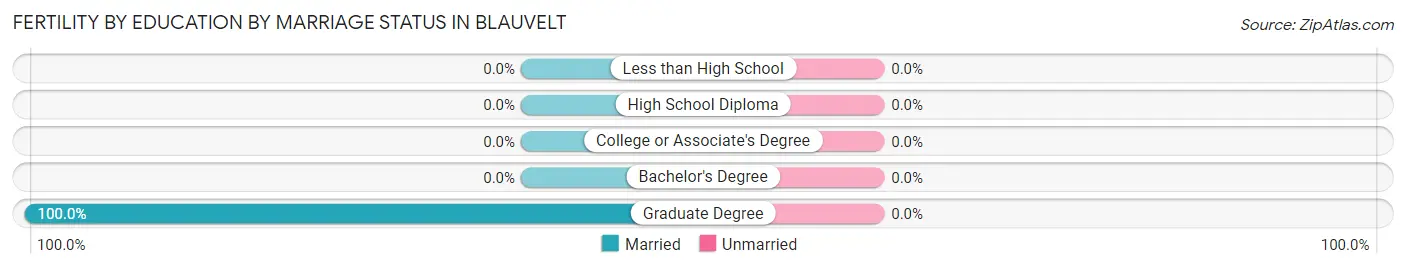
| Educational Attainment | Married | Unmarried |
| Less than High School | 0 (0.0%) | 0 (0.0%) |
| High School Diploma | 0 (0.0%) | 0 (0.0%) |
| College or Associate's Degree | 0 (0.0%) | 0 (0.0%) |
| Bachelor's Degree | 0 (0.0%) | 0 (0.0%) |
| Graduate Degree | 17 (100.0%) | 0 (0.0%) |
| Total | 17 (100.0%) | 0 (0.0%) |
Employment Characteristics in Blauvelt
Employment by Class of Employer in Blauvelt
Among the 2,535 employed individuals in Blauvelt, private company employees (1,487 | 58.7%), not-for-profit organizations (335 | 13.2%), and local government employees (310 | 12.2%) make up the most common classes of employment.
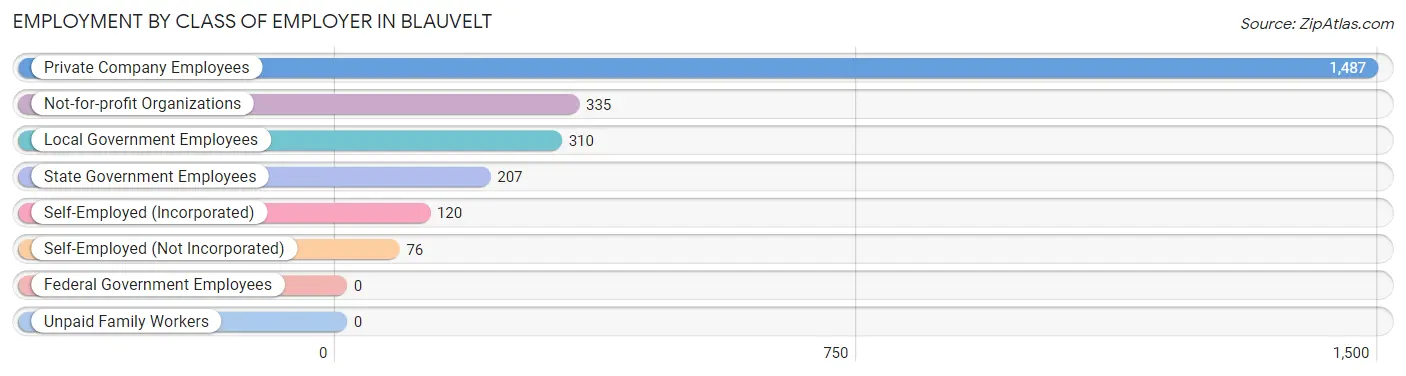
| Employer Class | # Employees | % Employees |
| Private Company Employees | 1,487 | 58.7% |
| Self-Employed (Incorporated) | 120 | 4.7% |
| Self-Employed (Not Incorporated) | 76 | 3.0% |
| Not-for-profit Organizations | 335 | 13.2% |
| Local Government Employees | 310 | 12.2% |
| State Government Employees | 207 | 8.2% |
| Federal Government Employees | 0 | 0.0% |
| Unpaid Family Workers | 0 | 0.0% |
| Total | 2,535 | 100.0% |
Employment Status by Age in Blauvelt
According to the labor force statistics for Blauvelt, out of the total population over 16 years of age (4,292), 62.8% or 2,695 individuals are in the labor force, with 5.7% or 154 of them unemployed. The age group with the highest labor force participation rate is 25 to 29 years, with 94.1% or 382 individuals in the labor force. Within the labor force, the 20 to 24 years age range has the highest percentage of unemployed individuals, with 23.7% or 83 of them being unemployed.
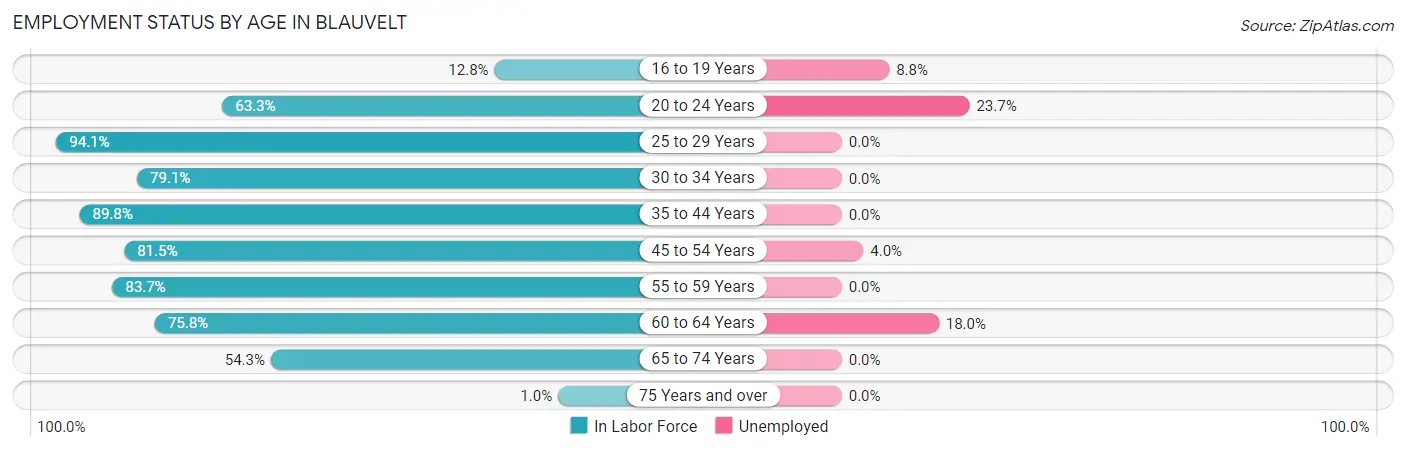
| Age Bracket | In Labor Force | Unemployed |
| 16 to 19 Years | 34 (12.8%) | 3 (8.8%) |
| 20 to 24 Years | 350 (63.3%) | 83 (23.7%) |
| 25 to 29 Years | 382 (94.1%) | 0 (0.0%) |
| 30 to 34 Years | 140 (79.1%) | 0 (0.0%) |
| 35 to 44 Years | 378 (89.8%) | 0 (0.0%) |
| 45 to 54 Years | 598 (81.5%) | 24 (4.0%) |
| 55 to 59 Years | 339 (83.7%) | 0 (0.0%) |
| 60 to 64 Years | 244 (75.8%) | 44 (18.0%) |
| 65 to 74 Years | 226 (54.3%) | 0 (0.0%) |
| 75 Years and over | 6 (1.0%) | 0 (0.0%) |
| Total | 2,695 (62.8%) | 154 (5.7%) |
Employment Status by Educational Attainment in Blauvelt
According to labor force statistics for Blauvelt, 84.4% of individuals (2,080) out of the total population between 25 and 64 years of age (2,465) are in the labor force, with 3.3% or 69 of them being unemployed. The group with the highest labor force participation rate are those with the educational attainment of college / associate degree, with 92.2% or 541 individuals in the labor force. Within the labor force, individuals with high school diploma education have the highest percentage of unemployment, with 11.7% or 37 of them being unemployed.
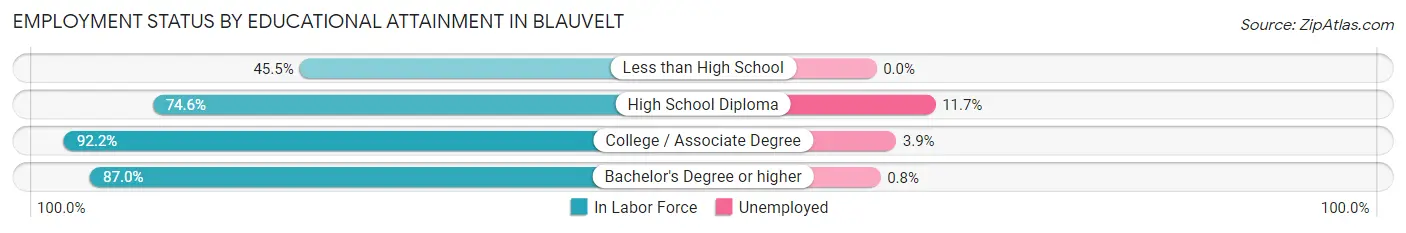
| Educational Attainment | In Labor Force | Unemployed |
| Less than High School | 46 (45.5%) | 0 (0.0%) |
| High School Diploma | 315 (74.6%) | 49 (11.7%) |
| College / Associate Degree | 541 (92.2%) | 23 (3.9%) |
| Bachelor's Degree or higher | 1,179 (87.0%) | 11 (0.8%) |
| Total | 2,080 (84.4%) | 81 (3.3%) |
Employment Occupations by Sex in Blauvelt
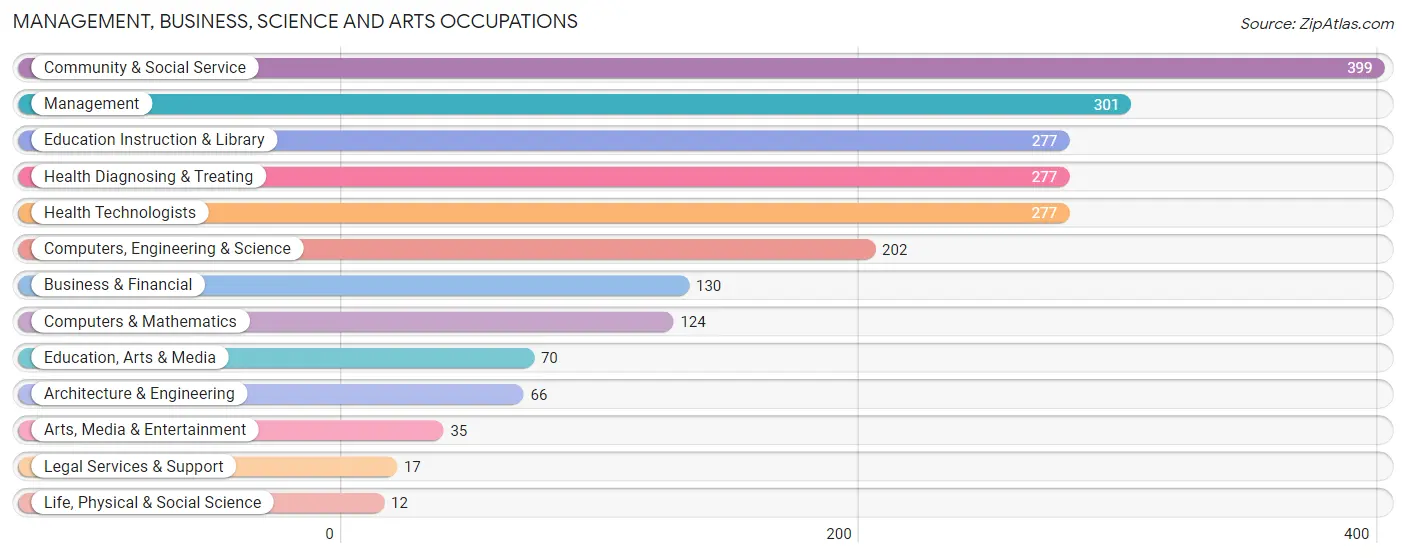
Management, Business, Science and Arts Occupations
The most common Management, Business, Science and Arts occupations in Blauvelt are Community & Social Service (399 | 15.7%), Management (301 | 11.8%), Education Instruction & Library (277 | 10.9%), Health Diagnosing & Treating (277 | 10.9%), and Health Technologists (277 | 10.9%).
Management, Business, Science and Arts Occupations by Sex
Within the Management, Business, Science and Arts occupations in Blauvelt, the most male-oriented occupations are Computers & Mathematics (100.0%), Life, Physical & Social Science (100.0%), and Computers, Engineering & Science (85.6%), while the most female-oriented occupations are Arts, Media & Entertainment (100.0%), Health Diagnosing & Treating (88.4%), and Health Technologists (88.4%).
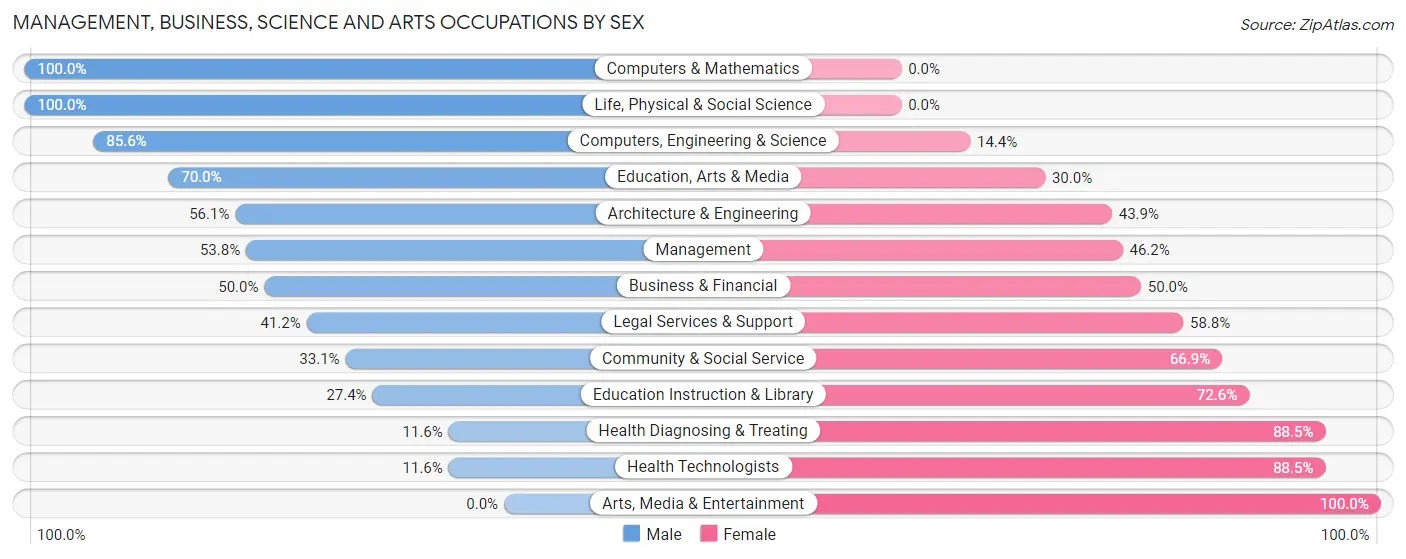
| Occupation | Male | Female |
| Management | 162 (53.8%) | 139 (46.2%) |
| Business & Financial | 65 (50.0%) | 65 (50.0%) |
| Computers, Engineering & Science | 173 (85.6%) | 29 (14.4%) |
| Computers & Mathematics | 124 (100.0%) | 0 (0.0%) |
| Architecture & Engineering | 37 (56.1%) | 29 (43.9%) |
| Life, Physical & Social Science | 12 (100.0%) | 0 (0.0%) |
| Community & Social Service | 132 (33.1%) | 267 (66.9%) |
| Education, Arts & Media | 49 (70.0%) | 21 (30.0%) |
| Legal Services & Support | 7 (41.2%) | 10 (58.8%) |
| Education Instruction & Library | 76 (27.4%) | 201 (72.6%) |
| Arts, Media & Entertainment | 0 (0.0%) | 35 (100.0%) |
| Health Diagnosing & Treating | 32 (11.6%) | 245 (88.4%) |
| Health Technologists | 32 (11.6%) | 245 (88.4%) |
| Total (Category) | 564 (43.1%) | 745 (56.9%) |
| Total (Overall) | 1,380 (54.3%) | 1,163 (45.7%) |
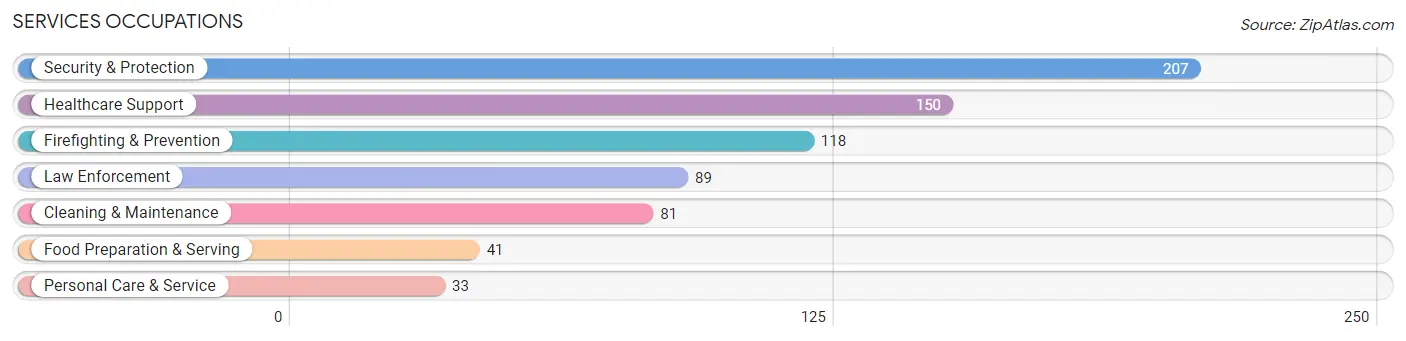
Services Occupations
The most common Services occupations in Blauvelt are Security & Protection (207 | 8.1%), Healthcare Support (150 | 5.9%), Firefighting & Prevention (118 | 4.6%), Law Enforcement (89 | 3.5%), and Cleaning & Maintenance (81 | 3.2%).
Services Occupations by Sex
Within the Services occupations in Blauvelt, the most male-oriented occupations are Firefighting & Prevention (100.0%), Security & Protection (80.2%), and Cleaning & Maintenance (71.6%), while the most female-oriented occupations are Personal Care & Service (81.8%), Food Preparation & Serving (51.2%), and Law Enforcement (46.1%).
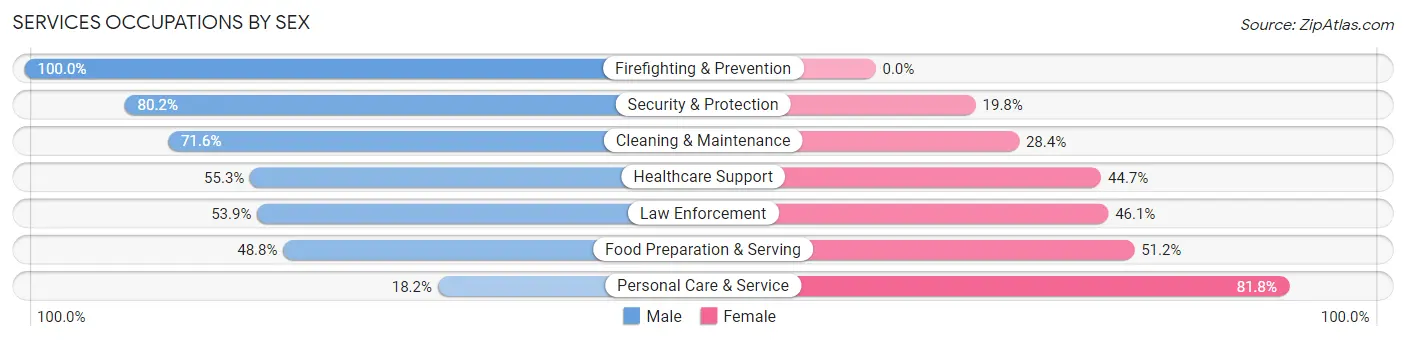
| Occupation | Male | Female |
| Healthcare Support | 83 (55.3%) | 67 (44.7%) |
| Security & Protection | 166 (80.2%) | 41 (19.8%) |
| Firefighting & Prevention | 118 (100.0%) | 0 (0.0%) |
| Law Enforcement | 48 (53.9%) | 41 (46.1%) |
| Food Preparation & Serving | 20 (48.8%) | 21 (51.2%) |
| Cleaning & Maintenance | 58 (71.6%) | 23 (28.4%) |
| Personal Care & Service | 6 (18.2%) | 27 (81.8%) |
| Total (Category) | 333 (65.0%) | 179 (35.0%) |
| Total (Overall) | 1,380 (54.3%) | 1,163 (45.7%) |
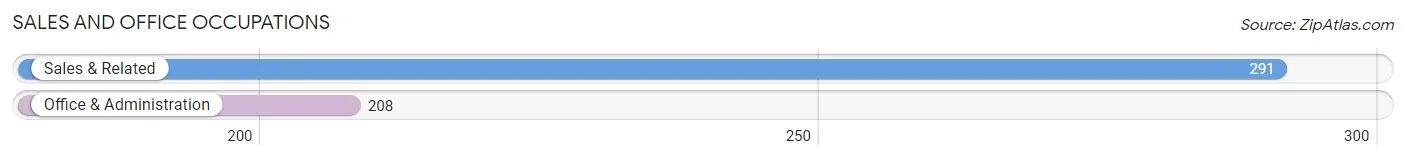
Sales and Office Occupations
The most common Sales and Office occupations in Blauvelt are Sales & Related (291 | 11.4%), and Office & Administration (208 | 8.2%).
Sales and Office Occupations by Sex
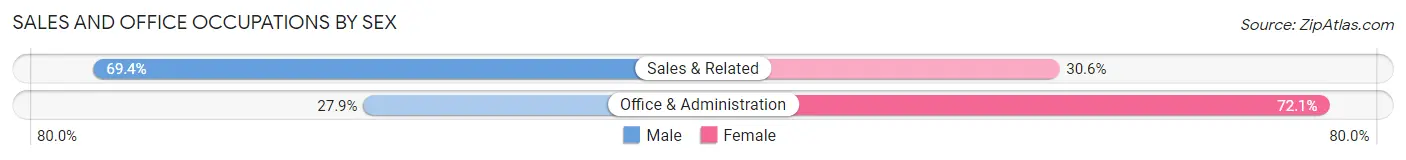
| Occupation | Male | Female |
| Sales & Related | 202 (69.4%) | 89 (30.6%) |
| Office & Administration | 58 (27.9%) | 150 (72.1%) |
| Total (Category) | 260 (52.1%) | 239 (47.9%) |
| Total (Overall) | 1,380 (54.3%) | 1,163 (45.7%) |
Natural Resources, Construction and Maintenance Occupations
The most common Natural Resources, Construction and Maintenance occupations in Blauvelt are Construction & Extraction (150 | 5.9%), and Installation, Maintenance & Repair (29 | 1.1%).
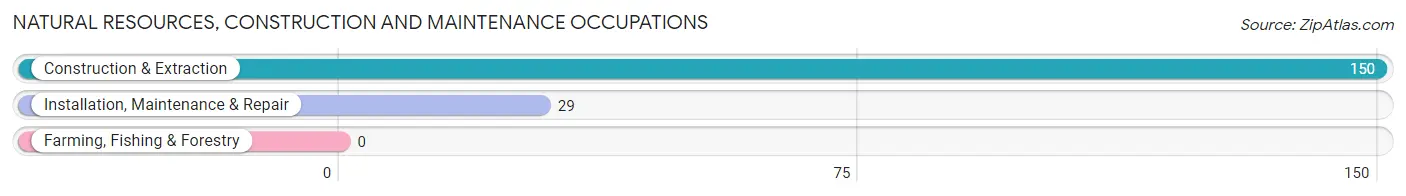
Natural Resources, Construction and Maintenance Occupations by Sex
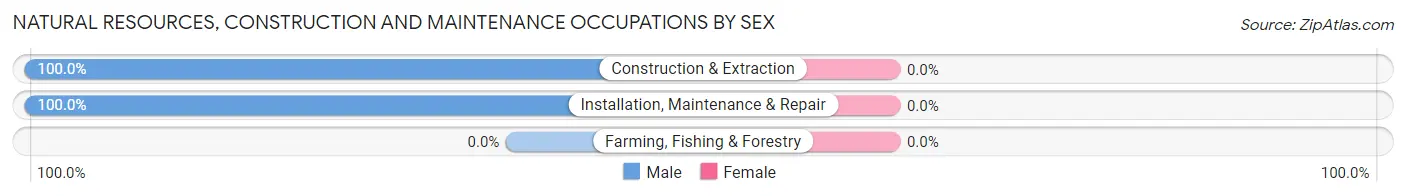
| Occupation | Male | Female |
| Farming, Fishing & Forestry | 0 (0.0%) | 0 (0.0%) |
| Construction & Extraction | 150 (100.0%) | 0 (0.0%) |
| Installation, Maintenance & Repair | 29 (100.0%) | 0 (0.0%) |
| Total (Category) | 179 (100.0%) | 0 (0.0%) |
| Total (Overall) | 1,380 (54.3%) | 1,163 (45.7%) |
Production, Transportation and Moving Occupations
The most common Production, Transportation and Moving occupations in Blauvelt are Transportation (32 | 1.3%), Production (10 | 0.4%), and Material Moving (2 | 0.1%).
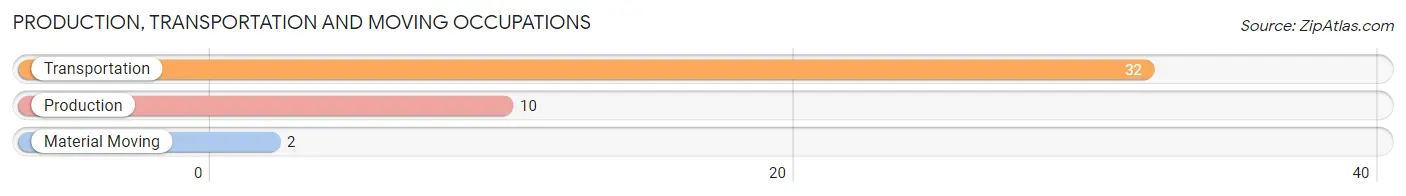
Production, Transportation and Moving Occupations by Sex
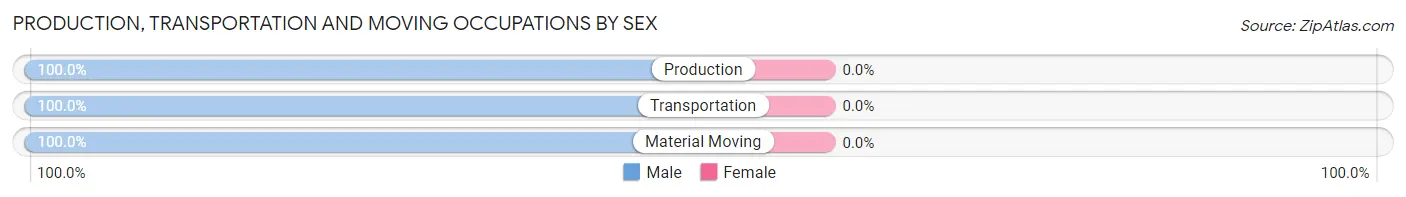
| Occupation | Male | Female |
| Production | 10 (100.0%) | 0 (0.0%) |
| Transportation | 32 (100.0%) | 0 (0.0%) |
| Material Moving | 2 (100.0%) | 0 (0.0%) |
| Total (Category) | 44 (100.0%) | 0 (0.0%) |
| Total (Overall) | 1,380 (54.3%) | 1,163 (45.7%) |
Employment Industries by Sex in Blauvelt
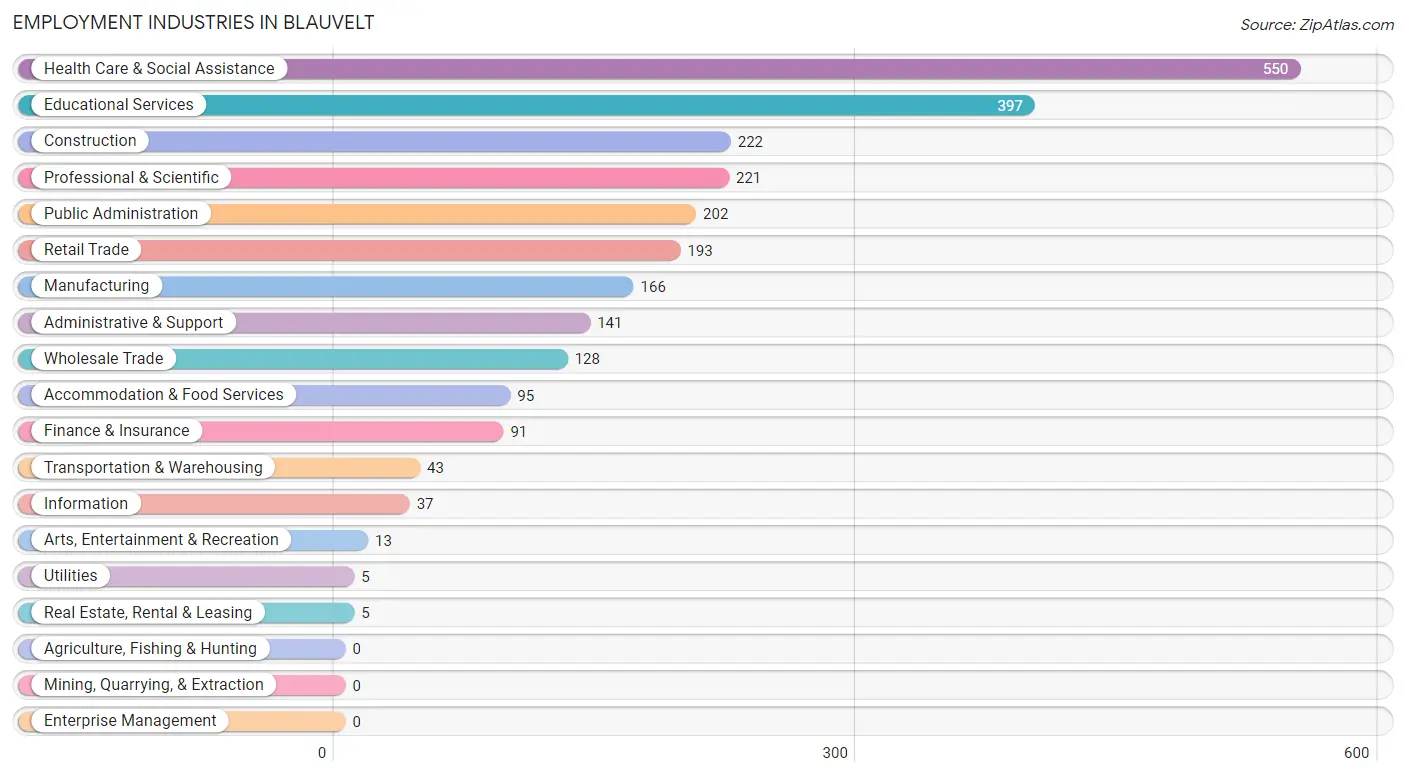
Employment Industries in Blauvelt
The major employment industries in Blauvelt include Health Care & Social Assistance (550 | 21.6%), Educational Services (397 | 15.6%), Construction (222 | 8.7%), Professional & Scientific (221 | 8.7%), and Public Administration (202 | 7.9%).
Employment Industries by Sex in Blauvelt
The Blauvelt industries that see more men than women are Real Estate, Rental & Leasing (100.0%), Construction (93.2%), and Information (89.2%), whereas the industries that tend to have a higher number of women are Utilities (100.0%), Accommodation & Food Services (78.9%), and Educational Services (69.0%).
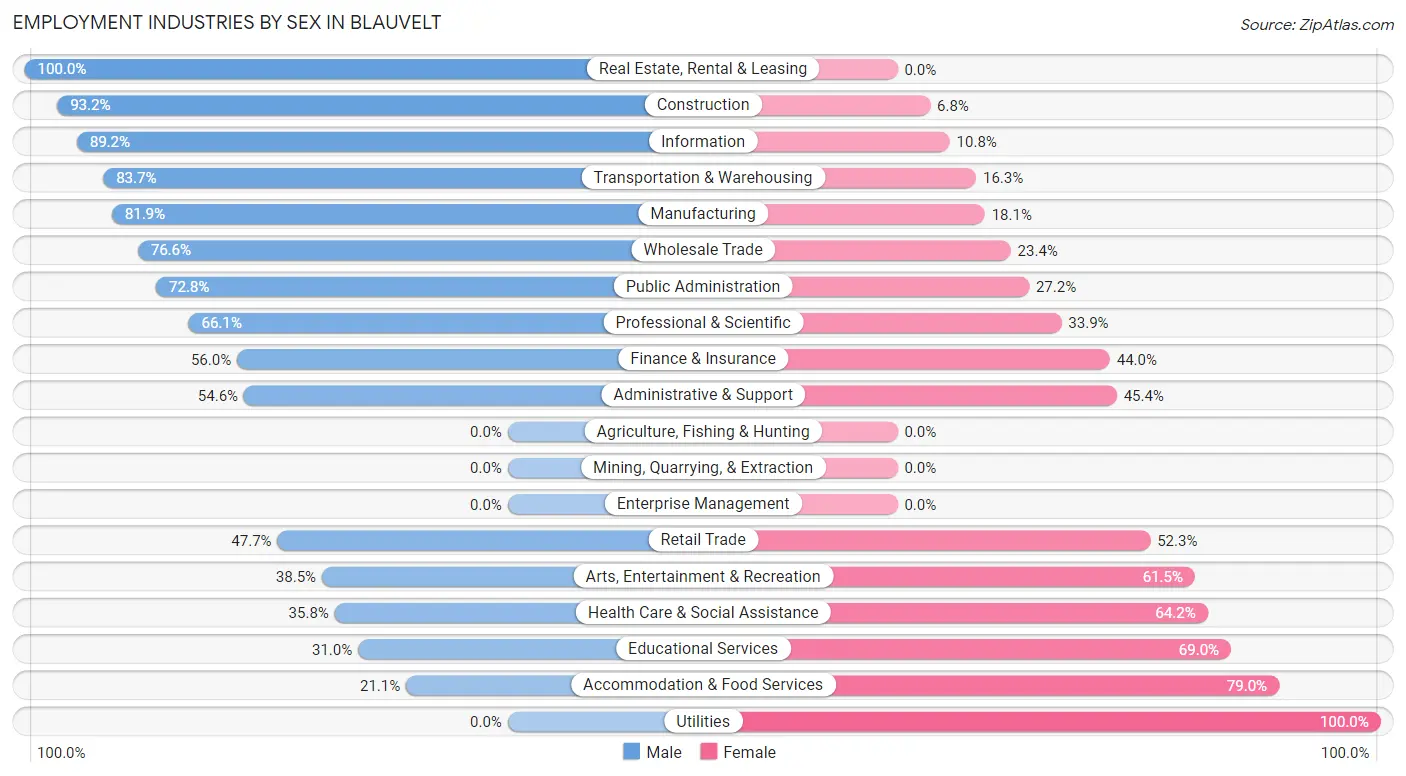
| Industry | Male | Female |
| Agriculture, Fishing & Hunting | 0 (0.0%) | 0 (0.0%) |
| Mining, Quarrying, & Extraction | 0 (0.0%) | 0 (0.0%) |
| Construction | 207 (93.2%) | 15 (6.8%) |
| Manufacturing | 136 (81.9%) | 30 (18.1%) |
| Wholesale Trade | 98 (76.6%) | 30 (23.4%) |
| Retail Trade | 92 (47.7%) | 101 (52.3%) |
| Transportation & Warehousing | 36 (83.7%) | 7 (16.3%) |
| Utilities | 0 (0.0%) | 5 (100.0%) |
| Information | 33 (89.2%) | 4 (10.8%) |
| Finance & Insurance | 51 (56.0%) | 40 (44.0%) |
| Real Estate, Rental & Leasing | 5 (100.0%) | 0 (0.0%) |
| Professional & Scientific | 146 (66.1%) | 75 (33.9%) |
| Enterprise Management | 0 (0.0%) | 0 (0.0%) |
| Administrative & Support | 77 (54.6%) | 64 (45.4%) |
| Educational Services | 123 (31.0%) | 274 (69.0%) |
| Health Care & Social Assistance | 197 (35.8%) | 353 (64.2%) |
| Arts, Entertainment & Recreation | 5 (38.5%) | 8 (61.5%) |
| Accommodation & Food Services | 20 (21.0%) | 75 (78.9%) |
| Public Administration | 147 (72.8%) | 55 (27.2%) |
| Total | 1,380 (54.3%) | 1,163 (45.7%) |
Education in Blauvelt
School Enrollment in Blauvelt
The most common levels of schooling among the 1,637 students in Blauvelt are college / undergraduate (540 | 33.0%), high school (301 | 18.4%), and elementary school (268 | 16.4%).
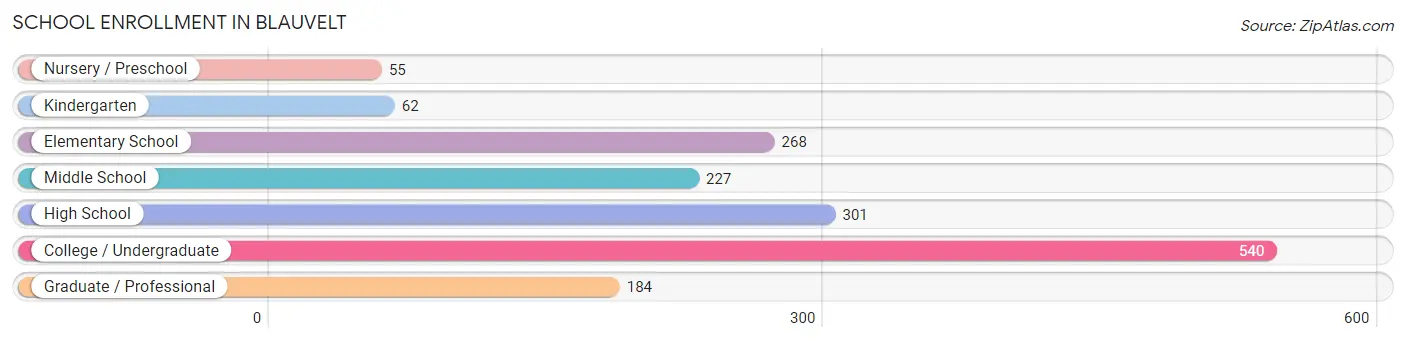
| School Level | # Students | % Students |
| Nursery / Preschool | 55 | 3.4% |
| Kindergarten | 62 | 3.8% |
| Elementary School | 268 | 16.4% |
| Middle School | 227 | 13.9% |
| High School | 301 | 18.4% |
| College / Undergraduate | 540 | 33.0% |
| Graduate / Professional | 184 | 11.2% |
| Total | 1,637 | 100.0% |
School Enrollment by Age by Funding Source in Blauvelt
Out of a total of 1,637 students who are enrolled in schools in Blauvelt, 778 (47.5%) attend a private institution, while the remaining 859 (52.5%) are enrolled in public schools. The age group of 35 years and over has the highest likelihood of being enrolled in private schools, with 53 (84.1% in the age bracket) enrolled. Conversely, the age group of 15 to 17 year olds has the lowest likelihood of being enrolled in a private school, with 189 (85.5% in the age bracket) attending a public institution.
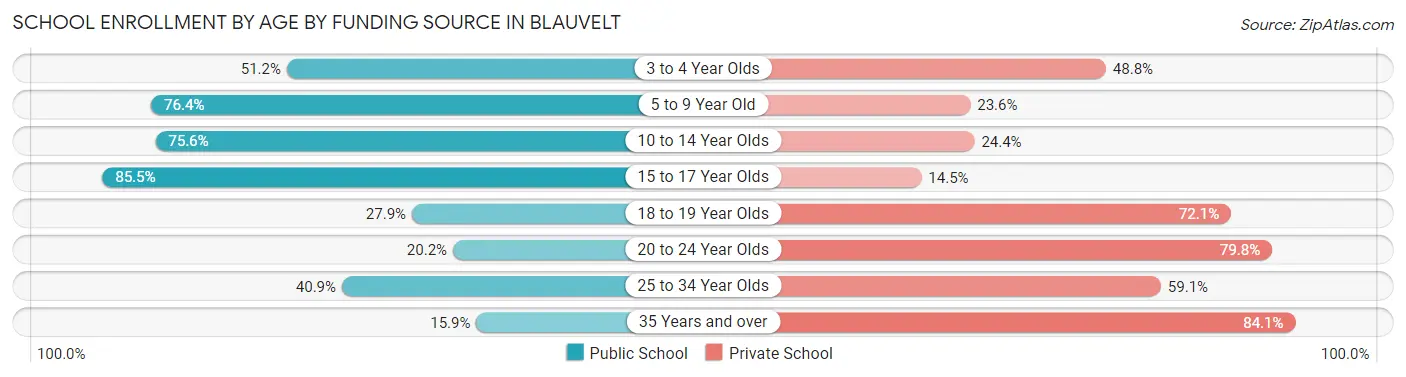
| Age Bracket | Public School | Private School |
| 3 to 4 Year Olds | 22 (51.2%) | 21 (48.8%) |
| 5 to 9 Year Old | 256 (76.4%) | 79 (23.6%) |
| 10 to 14 Year Olds | 208 (75.6%) | 67 (24.4%) |
| 15 to 17 Year Olds | 189 (85.5%) | 32 (14.5%) |
| 18 to 19 Year Olds | 39 (27.9%) | 101 (72.1%) |
| 20 to 24 Year Olds | 91 (20.2%) | 359 (79.8%) |
| 25 to 34 Year Olds | 45 (40.9%) | 65 (59.1%) |
| 35 Years and over | 10 (15.9%) | 53 (84.1%) |
| Total | 859 (52.5%) | 778 (47.5%) |
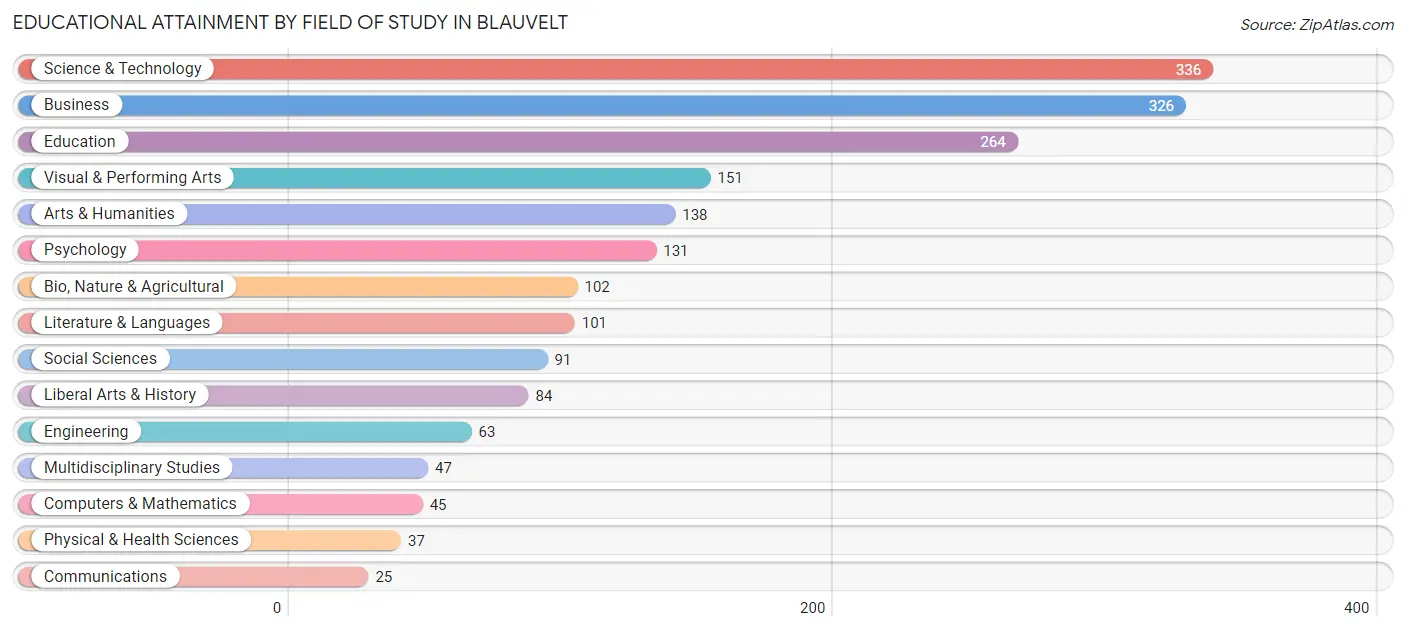
Educational Attainment by Field of Study in Blauvelt
Science & technology (336 | 17.3%), business (326 | 16.8%), education (264 | 13.6%), visual & performing arts (151 | 7.8%), and arts & humanities (138 | 7.1%) are the most common fields of study among 1,941 individuals in Blauvelt who have obtained a bachelor's degree or higher.
| Field of Study | # Graduates | % Graduates |
| Computers & Mathematics | 45 | 2.3% |
| Bio, Nature & Agricultural | 102 | 5.3% |
| Physical & Health Sciences | 37 | 1.9% |
| Psychology | 131 | 6.8% |
| Social Sciences | 91 | 4.7% |
| Engineering | 63 | 3.3% |
| Multidisciplinary Studies | 47 | 2.4% |
| Science & Technology | 336 | 17.3% |
| Business | 326 | 16.8% |
| Education | 264 | 13.6% |
| Literature & Languages | 101 | 5.2% |
| Liberal Arts & History | 84 | 4.3% |
| Visual & Performing Arts | 151 | 7.8% |
| Communications | 25 | 1.3% |
| Arts & Humanities | 138 | 7.1% |
| Total | 1,941 | 100.0% |
Transportation & Commute in Blauvelt
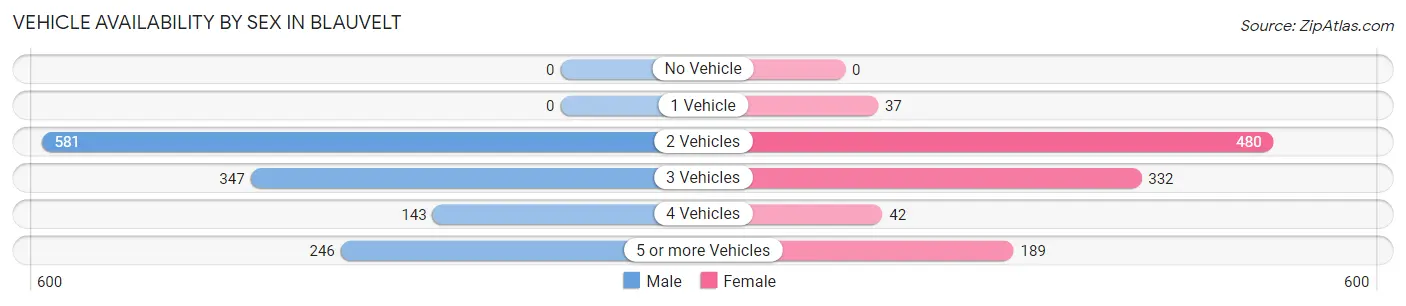
Vehicle Availability by Sex in Blauvelt
The most prevalent vehicle ownership categories in Blauvelt are males with 2 vehicles (581, accounting for 44.1%) and females with 2 vehicles (480, making up 53.8%).
| Vehicles Available | Male | Female |
| No Vehicle | 0 (0.0%) | 0 (0.0%) |
| 1 Vehicle | 0 (0.0%) | 37 (3.4%) |
| 2 Vehicles | 581 (44.1%) | 480 (44.4%) |
| 3 Vehicles | 347 (26.4%) | 332 (30.7%) |
| 4 Vehicles | 143 (10.9%) | 42 (3.9%) |
| 5 or more Vehicles | 246 (18.7%) | 189 (17.5%) |
| Total | 1,317 (100.0%) | 1,080 (100.0%) |
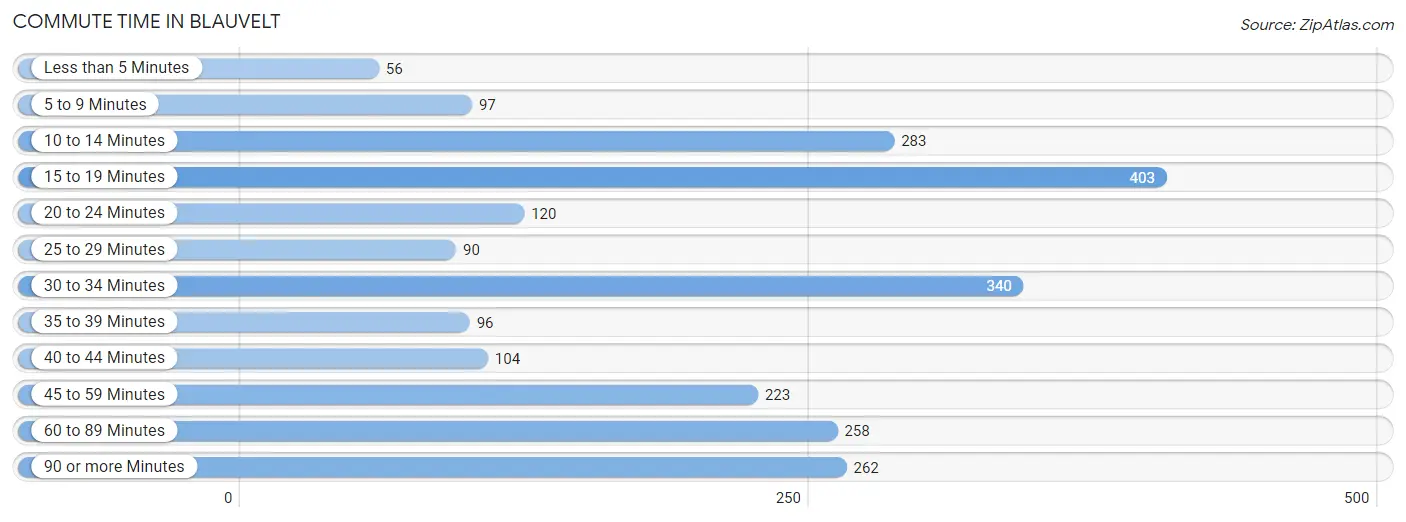
Commute Time in Blauvelt
The most frequently occuring commute durations in Blauvelt are 15 to 19 minutes (403 commuters, 17.3%), 30 to 34 minutes (340 commuters, 14.6%), and 10 to 14 minutes (283 commuters, 12.1%).
| Commute Time | # Commuters | % Commuters |
| Less than 5 Minutes | 56 | 2.4% |
| 5 to 9 Minutes | 97 | 4.2% |
| 10 to 14 Minutes | 283 | 12.1% |
| 15 to 19 Minutes | 403 | 17.3% |
| 20 to 24 Minutes | 120 | 5.1% |
| 25 to 29 Minutes | 90 | 3.9% |
| 30 to 34 Minutes | 340 | 14.6% |
| 35 to 39 Minutes | 96 | 4.1% |
| 40 to 44 Minutes | 104 | 4.5% |
| 45 to 59 Minutes | 223 | 9.6% |
| 60 to 89 Minutes | 258 | 11.1% |
| 90 or more Minutes | 262 | 11.2% |
Commute Time by Sex in Blauvelt
The most common commute times in Blauvelt are 30 to 34 minutes (228 commuters, 17.8%) for males and 15 to 19 minutes (224 commuters, 21.4%) for females.
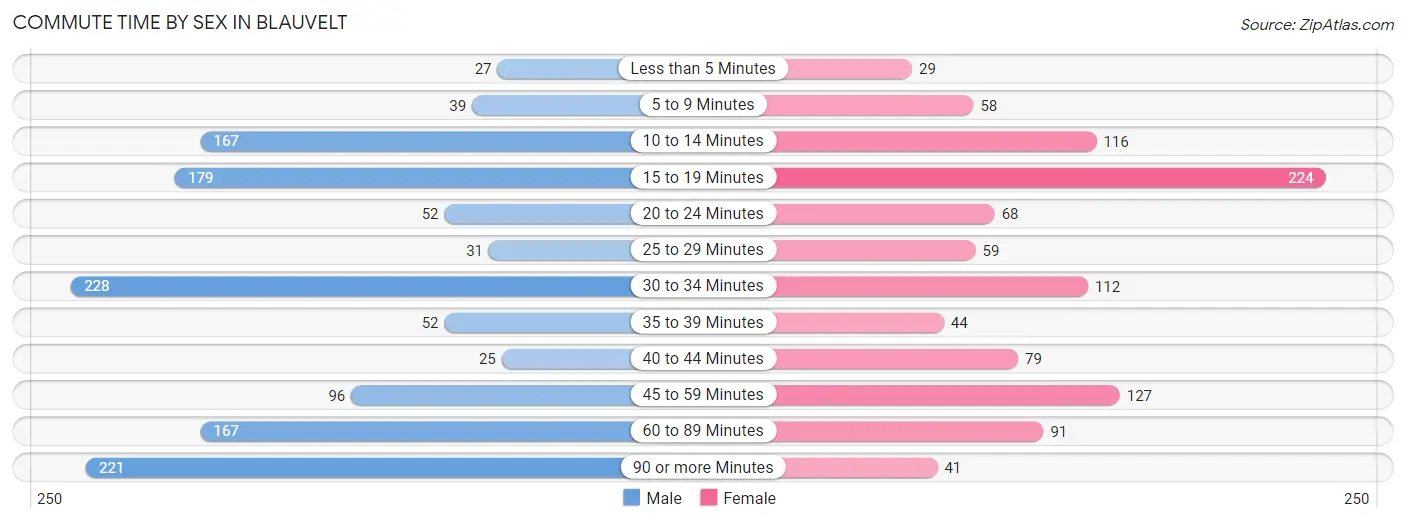
| Commute Time | Male | Female |
| Less than 5 Minutes | 27 (2.1%) | 29 (2.8%) |
| 5 to 9 Minutes | 39 (3.0%) | 58 (5.5%) |
| 10 to 14 Minutes | 167 (13.0%) | 116 (11.1%) |
| 15 to 19 Minutes | 179 (13.9%) | 224 (21.4%) |
| 20 to 24 Minutes | 52 (4.1%) | 68 (6.5%) |
| 25 to 29 Minutes | 31 (2.4%) | 59 (5.6%) |
| 30 to 34 Minutes | 228 (17.8%) | 112 (10.7%) |
| 35 to 39 Minutes | 52 (4.1%) | 44 (4.2%) |
| 40 to 44 Minutes | 25 (1.9%) | 79 (7.5%) |
| 45 to 59 Minutes | 96 (7.5%) | 127 (12.1%) |
| 60 to 89 Minutes | 167 (13.0%) | 91 (8.7%) |
| 90 or more Minutes | 221 (17.2%) | 41 (3.9%) |
Time of Departure to Work by Sex in Blauvelt
The most frequent times of departure to work in Blauvelt are 8:00 AM to 8:29 AM (210, 16.4%) for males and 6:30 AM to 6:59 AM (155, 14.8%) for females.
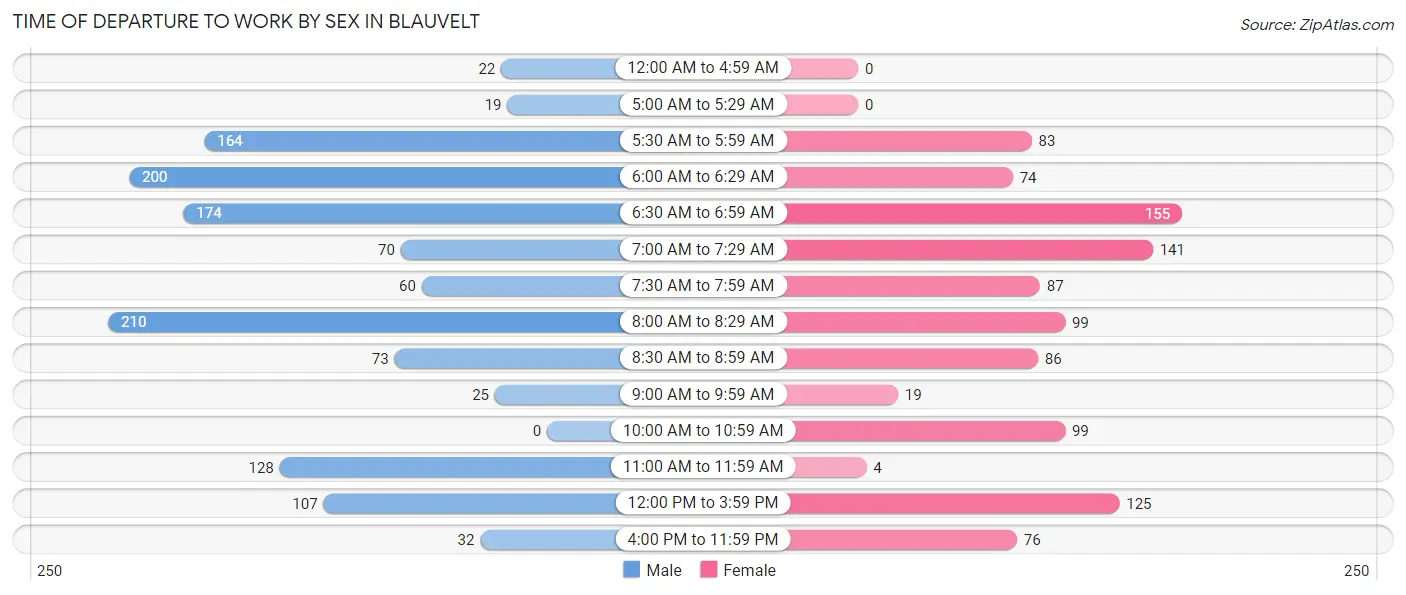
| Time of Departure | Male | Female |
| 12:00 AM to 4:59 AM | 22 (1.7%) | 0 (0.0%) |
| 5:00 AM to 5:29 AM | 19 (1.5%) | 0 (0.0%) |
| 5:30 AM to 5:59 AM | 164 (12.8%) | 83 (7.9%) |
| 6:00 AM to 6:29 AM | 200 (15.6%) | 74 (7.1%) |
| 6:30 AM to 6:59 AM | 174 (13.6%) | 155 (14.8%) |
| 7:00 AM to 7:29 AM | 70 (5.4%) | 141 (13.5%) |
| 7:30 AM to 7:59 AM | 60 (4.7%) | 87 (8.3%) |
| 8:00 AM to 8:29 AM | 210 (16.4%) | 99 (9.5%) |
| 8:30 AM to 8:59 AM | 73 (5.7%) | 86 (8.2%) |
| 9:00 AM to 9:59 AM | 25 (1.9%) | 19 (1.8%) |
| 10:00 AM to 10:59 AM | 0 (0.0%) | 99 (9.5%) |
| 11:00 AM to 11:59 AM | 128 (10.0%) | 4 (0.4%) |
| 12:00 PM to 3:59 PM | 107 (8.3%) | 125 (11.9%) |
| 4:00 PM to 11:59 PM | 32 (2.5%) | 76 (7.2%) |
| Total | 1,284 (100.0%) | 1,048 (100.0%) |
Housing Occupancy in Blauvelt
Occupancy by Ownership in Blauvelt
Of the total 1,520 dwellings in Blauvelt, owner-occupied units account for 1,432 (94.2%), while renter-occupied units make up 88 (5.8%).
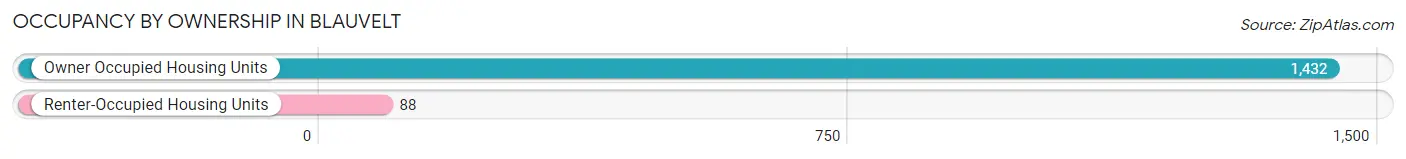
| Occupancy | # Housing Units | % Housing Units |
| Owner Occupied Housing Units | 1,432 | 94.2% |
| Renter-Occupied Housing Units | 88 | 5.8% |
| Total Occupied Housing Units | 1,520 | 100.0% |
Occupancy by Household Size in Blauvelt
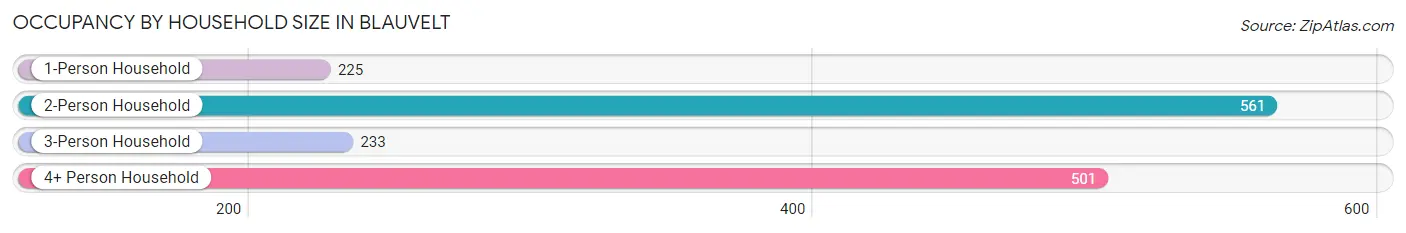
| Household Size | # Housing Units | % Housing Units |
| 1-Person Household | 225 | 14.8% |
| 2-Person Household | 561 | 36.9% |
| 3-Person Household | 233 | 15.3% |
| 4+ Person Household | 501 | 33.0% |
| Total Housing Units | 1,520 | 100.0% |
Occupancy by Ownership by Household Size in Blauvelt
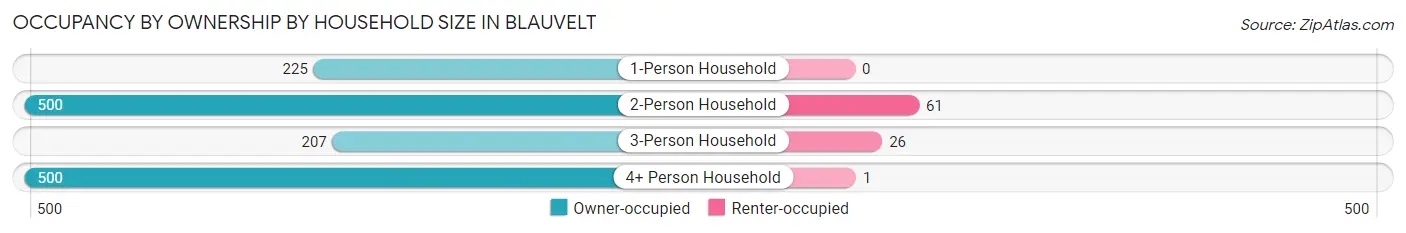
| Household Size | Owner-occupied | Renter-occupied |
| 1-Person Household | 225 (100.0%) | 0 (0.0%) |
| 2-Person Household | 500 (89.1%) | 61 (10.9%) |
| 3-Person Household | 207 (88.8%) | 26 (11.2%) |
| 4+ Person Household | 500 (99.8%) | 1 (0.2%) |
| Total Housing Units | 1,432 (94.2%) | 88 (5.8%) |
Occupancy by Educational Attainment in Blauvelt
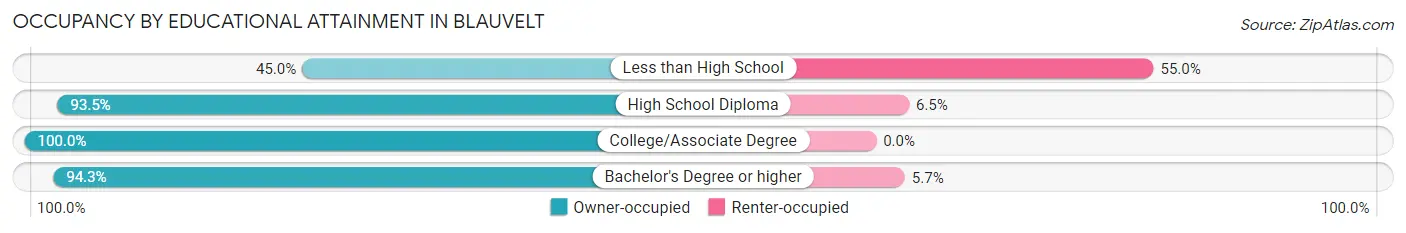
| Household Size | Owner-occupied | Renter-occupied |
| Less than High School | 18 (45.0%) | 22 (55.0%) |
| High School Diploma | 273 (93.5%) | 19 (6.5%) |
| College/Associate Degree | 364 (100.0%) | 0 (0.0%) |
| Bachelor's Degree or higher | 777 (94.3%) | 47 (5.7%) |
Occupancy by Age of Householder in Blauvelt
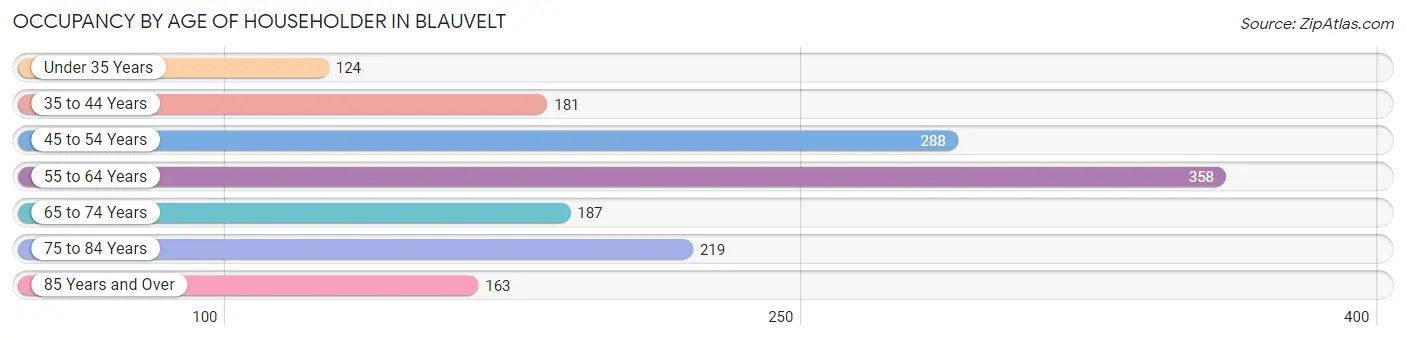
| Age Bracket | # Households | % Households |
| Under 35 Years | 124 | 8.2% |
| 35 to 44 Years | 181 | 11.9% |
| 45 to 54 Years | 288 | 19.0% |
| 55 to 64 Years | 358 | 23.5% |
| 65 to 74 Years | 187 | 12.3% |
| 75 to 84 Years | 219 | 14.4% |
| 85 Years and Over | 163 | 10.7% |
| Total | 1,520 | 100.0% |
Housing Finances in Blauvelt
Median Income by Occupancy in Blauvelt
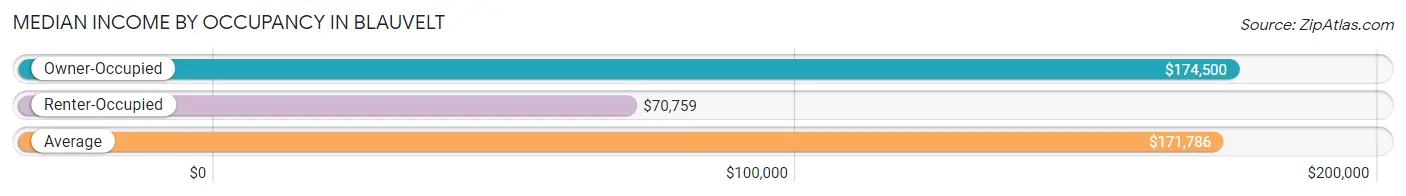
| Occupancy Type | # Households | Median Income |
| Owner-Occupied | 1,432 (94.2%) | $174,500 |
| Renter-Occupied | 88 (5.8%) | $70,759 |
| Average | 1,520 (100.0%) | $171,786 |
Occupancy by Householder Income Bracket in Blauvelt
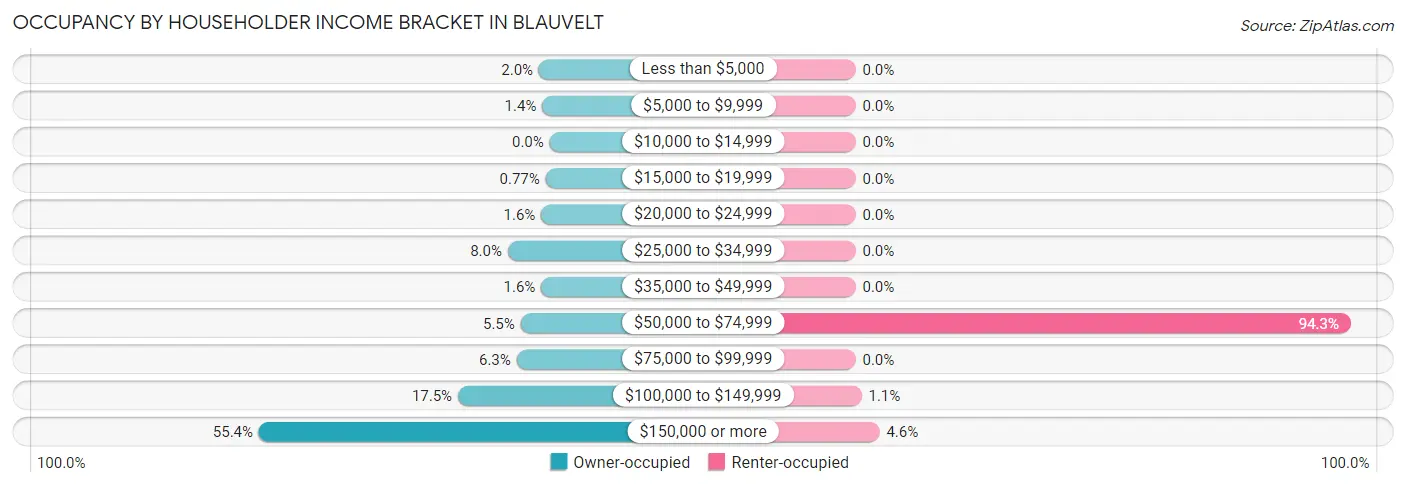
| Income Bracket | Owner-occupied | Renter-occupied |
| Less than $5,000 | 29 (2.0%) | 0 (0.0%) |
| $5,000 to $9,999 | 20 (1.4%) | 0 (0.0%) |
| $10,000 to $14,999 | 0 (0.0%) | 0 (0.0%) |
| $15,000 to $19,999 | 11 (0.8%) | 0 (0.0%) |
| $20,000 to $24,999 | 23 (1.6%) | 0 (0.0%) |
| $25,000 to $34,999 | 114 (8.0%) | 0 (0.0%) |
| $35,000 to $49,999 | 23 (1.6%) | 0 (0.0%) |
| $50,000 to $74,999 | 79 (5.5%) | 83 (94.3%) |
| $75,000 to $99,999 | 90 (6.3%) | 0 (0.0%) |
| $100,000 to $149,999 | 250 (17.5%) | 1 (1.1%) |
| $150,000 or more | 793 (55.4%) | 4 (4.5%) |
| Total | 1,432 (100.0%) | 88 (100.0%) |
Monthly Housing Cost Tiers in Blauvelt
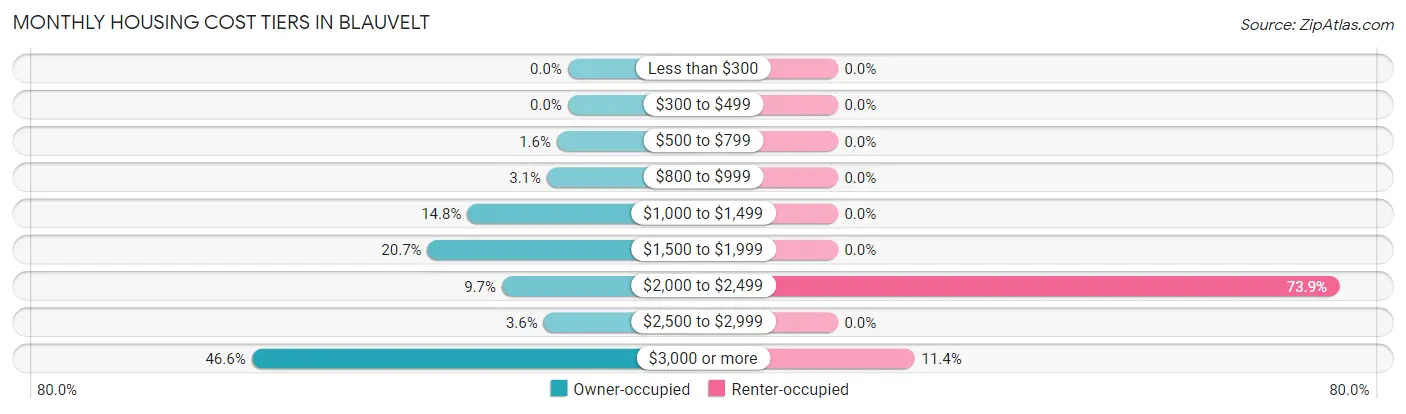
| Monthly Cost | Owner-occupied | Renter-occupied |
| Less than $300 | 0 (0.0%) | 0 (0.0%) |
| $300 to $499 | 0 (0.0%) | 0 (0.0%) |
| $500 to $799 | 23 (1.6%) | 0 (0.0%) |
| $800 to $999 | 44 (3.1%) | 0 (0.0%) |
| $1,000 to $1,499 | 212 (14.8%) | 0 (0.0%) |
| $1,500 to $1,999 | 296 (20.7%) | 0 (0.0%) |
| $2,000 to $2,499 | 139 (9.7%) | 65 (73.9%) |
| $2,500 to $2,999 | 51 (3.6%) | 0 (0.0%) |
| $3,000 or more | 667 (46.6%) | 10 (11.4%) |
| Total | 1,432 (100.0%) | 88 (100.0%) |
Physical Housing Characteristics in Blauvelt
Housing Structures in Blauvelt
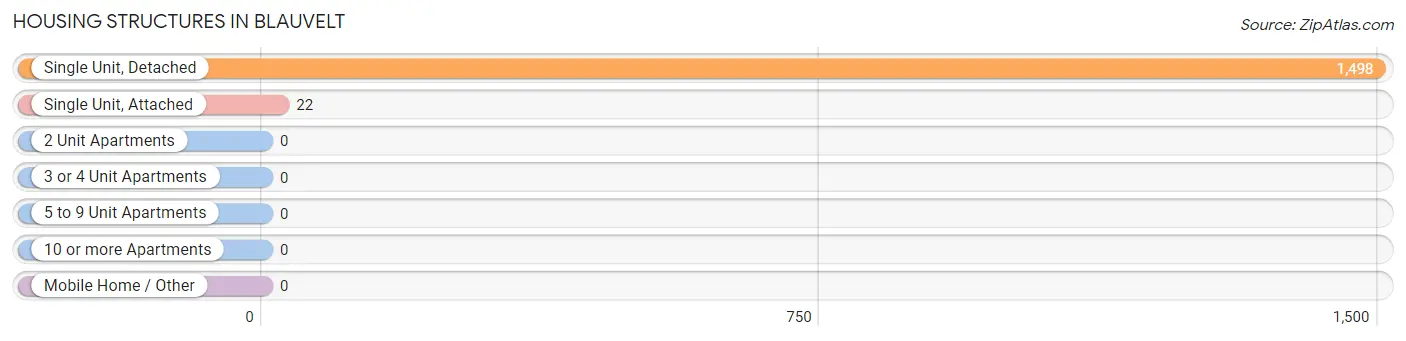
| Structure Type | # Housing Units | % Housing Units |
| Single Unit, Detached | 1,498 | 98.6% |
| Single Unit, Attached | 22 | 1.5% |
| 2 Unit Apartments | 0 | 0.0% |
| 3 or 4 Unit Apartments | 0 | 0.0% |
| 5 to 9 Unit Apartments | 0 | 0.0% |
| 10 or more Apartments | 0 | 0.0% |
| Mobile Home / Other | 0 | 0.0% |
| Total | 1,520 | 100.0% |
Housing Structures by Occupancy in Blauvelt
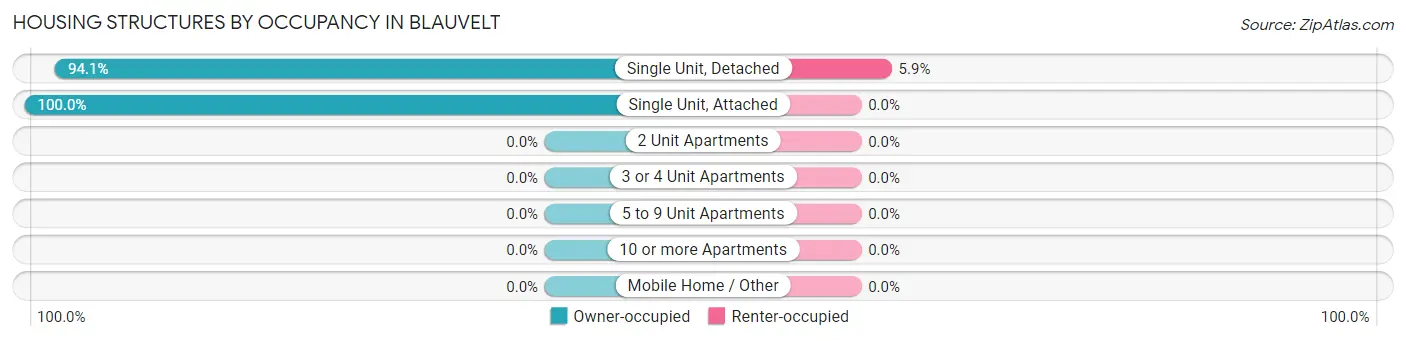
| Structure Type | Owner-occupied | Renter-occupied |
| Single Unit, Detached | 1,410 (94.1%) | 88 (5.9%) |
| Single Unit, Attached | 22 (100.0%) | 0 (0.0%) |
| 2 Unit Apartments | 0 (0.0%) | 0 (0.0%) |
| 3 or 4 Unit Apartments | 0 (0.0%) | 0 (0.0%) |
| 5 to 9 Unit Apartments | 0 (0.0%) | 0 (0.0%) |
| 10 or more Apartments | 0 (0.0%) | 0 (0.0%) |
| Mobile Home / Other | 0 (0.0%) | 0 (0.0%) |
| Total | 1,432 (94.2%) | 88 (5.8%) |
Housing Structures by Number of Rooms in Blauvelt
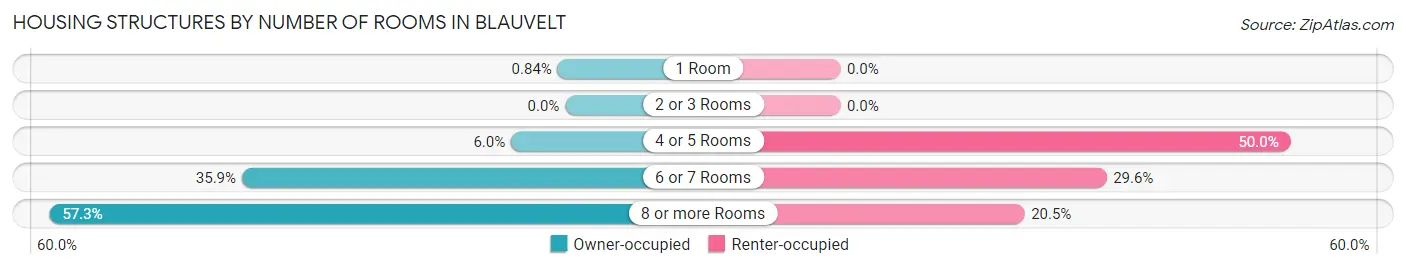
| Number of Rooms | Owner-occupied | Renter-occupied |
| 1 Room | 12 (0.8%) | 0 (0.0%) |
| 2 or 3 Rooms | 0 (0.0%) | 0 (0.0%) |
| 4 or 5 Rooms | 86 (6.0%) | 44 (50.0%) |
| 6 or 7 Rooms | 514 (35.9%) | 26 (29.5%) |
| 8 or more Rooms | 820 (57.3%) | 18 (20.4%) |
| Total | 1,432 (100.0%) | 88 (100.0%) |
Housing Structure by Heating Type in Blauvelt
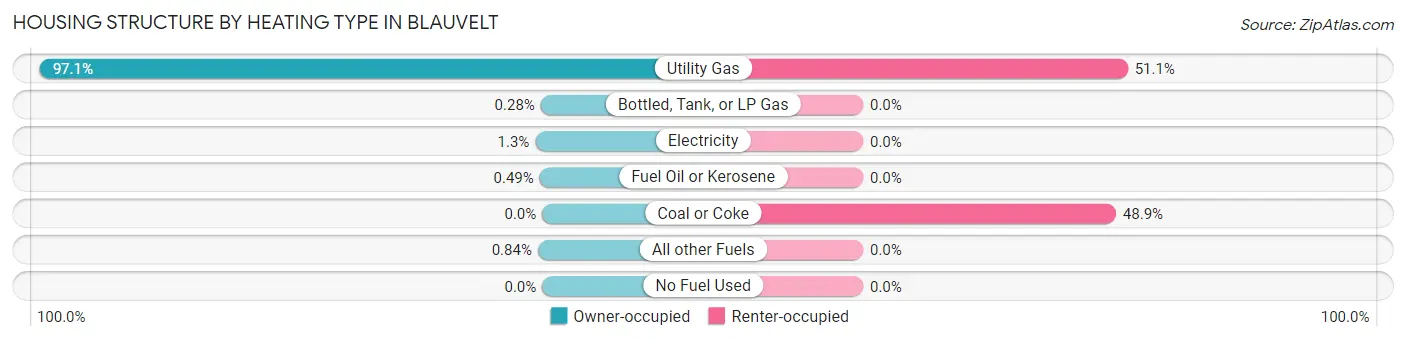
| Heating Type | Owner-occupied | Renter-occupied |
| Utility Gas | 1,390 (97.1%) | 45 (51.1%) |
| Bottled, Tank, or LP Gas | 4 (0.3%) | 0 (0.0%) |
| Electricity | 19 (1.3%) | 0 (0.0%) |
| Fuel Oil or Kerosene | 7 (0.5%) | 0 (0.0%) |
| Coal or Coke | 0 (0.0%) | 43 (48.9%) |
| All other Fuels | 12 (0.8%) | 0 (0.0%) |
| No Fuel Used | 0 (0.0%) | 0 (0.0%) |
| Total | 1,432 (100.0%) | 88 (100.0%) |
Household Vehicle Usage in Blauvelt
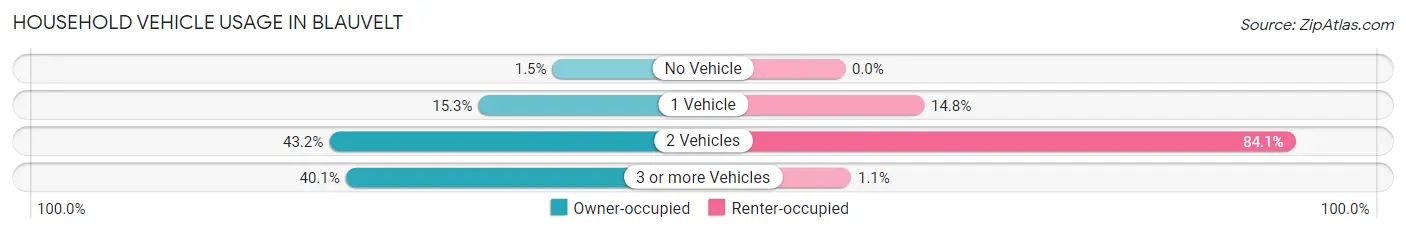
| Vehicles per Household | Owner-occupied | Renter-occupied |
| No Vehicle | 21 (1.5%) | 0 (0.0%) |
| 1 Vehicle | 219 (15.3%) | 13 (14.8%) |
| 2 Vehicles | 618 (43.2%) | 74 (84.1%) |
| 3 or more Vehicles | 574 (40.1%) | 1 (1.1%) |
| Total | 1,432 (100.0%) | 88 (100.0%) |
Real Estate & Mortgages in Blauvelt
Real Estate and Mortgage Overview in Blauvelt
| Characteristic | Without Mortgage | With Mortgage |
| Housing Units | 620 | 812 |
| Median Property Value | $570,800 | $618,800 |
| Median Household Income | $106,731 | $541 |
| Monthly Housing Costs | $1,501 | $644 |
| Real Estate Taxes | $10,001 | $0 |
Property Value by Mortgage Status in Blauvelt
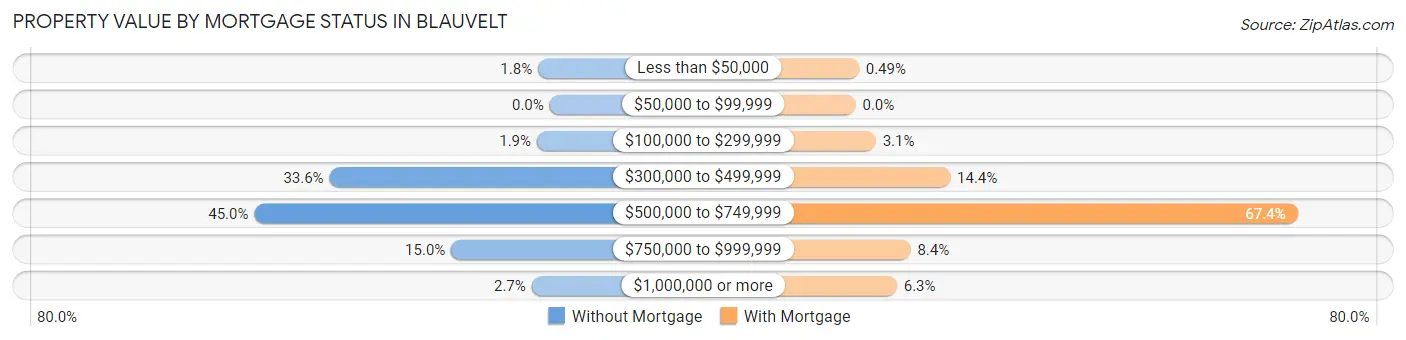
| Property Value | Without Mortgage | With Mortgage |
| Less than $50,000 | 11 (1.8%) | 4 (0.5%) |
| $50,000 to $99,999 | 0 (0.0%) | 0 (0.0%) |
| $100,000 to $299,999 | 12 (1.9%) | 25 (3.1%) |
| $300,000 to $499,999 | 208 (33.6%) | 117 (14.4%) |
| $500,000 to $749,999 | 279 (45.0%) | 547 (67.4%) |
| $750,000 to $999,999 | 93 (15.0%) | 68 (8.4%) |
| $1,000,000 or more | 17 (2.7%) | 51 (6.3%) |
| Total | 620 (100.0%) | 812 (100.0%) |
Household Income by Mortgage Status in Blauvelt
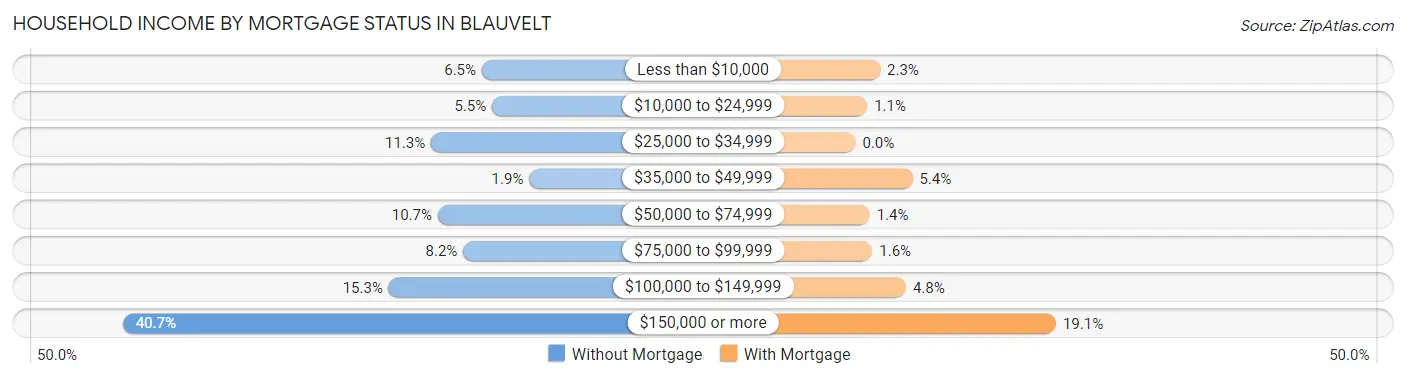
| Household Income | Without Mortgage | With Mortgage |
| Less than $10,000 | 40 (6.5%) | 19 (2.3%) |
| $10,000 to $24,999 | 34 (5.5%) | 9 (1.1%) |
| $25,000 to $34,999 | 70 (11.3%) | 0 (0.0%) |
| $35,000 to $49,999 | 12 (1.9%) | 44 (5.4%) |
| $50,000 to $74,999 | 66 (10.6%) | 11 (1.3%) |
| $75,000 to $99,999 | 51 (8.2%) | 13 (1.6%) |
| $100,000 to $149,999 | 95 (15.3%) | 39 (4.8%) |
| $150,000 or more | 252 (40.6%) | 155 (19.1%) |
| Total | 620 (100.0%) | 812 (100.0%) |
Property Value to Household Income Ratio in Blauvelt
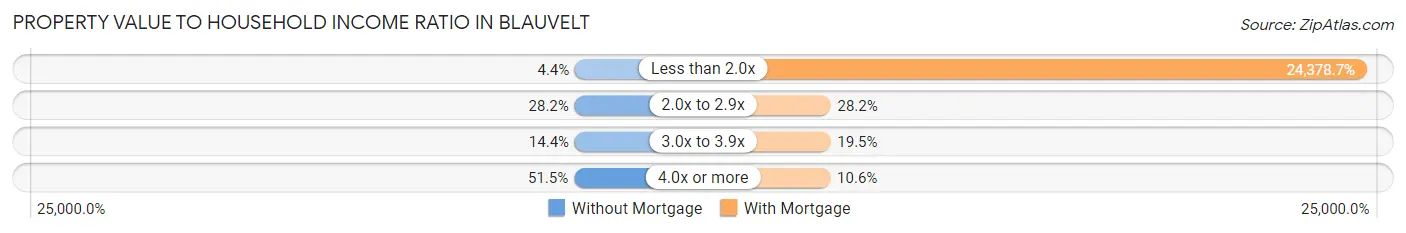
| Value-to-Income Ratio | Without Mortgage | With Mortgage |
| Less than 2.0x | 27 (4.3%) | 197,955 (24,378.7%) |
| 2.0x to 2.9x | 175 (28.2%) | 229 (28.2%) |
| 3.0x to 3.9x | 89 (14.3%) | 158 (19.5%) |
| 4.0x or more | 319 (51.4%) | 86 (10.6%) |
| Total | 620 (100.0%) | 812 (100.0%) |
Real Estate Taxes by Mortgage Status in Blauvelt
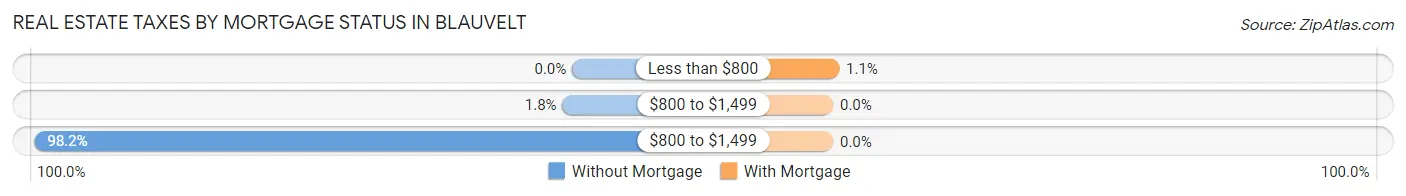
| Property Taxes | Without Mortgage | With Mortgage |
| Less than $800 | 0 (0.0%) | 9 (1.1%) |
| $800 to $1,499 | 11 (1.8%) | 0 (0.0%) |
| $800 to $1,499 | 609 (98.2%) | 0 (0.0%) |
| Total | 620 (100.0%) | 812 (100.0%) |
Health & Disability in Blauvelt
Health Insurance Coverage by Age in Blauvelt
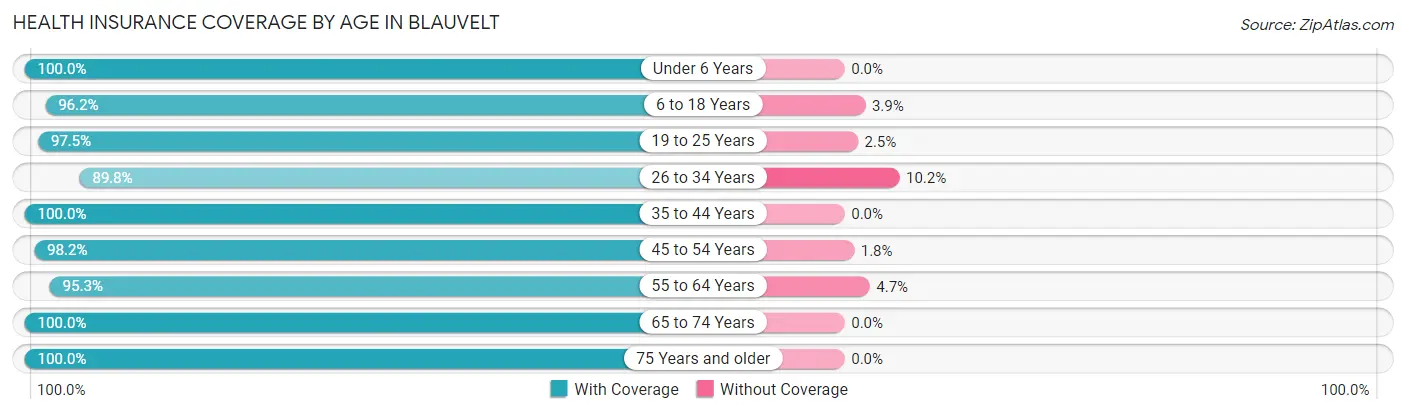
| Age Bracket | With Coverage | Without Coverage |
| Under 6 Years | 215 (100.0%) | 0 (0.0%) |
| 6 to 18 Years | 799 (96.2%) | 32 (3.8%) |
| 19 to 25 Years | 671 (97.5%) | 17 (2.5%) |
| 26 to 34 Years | 475 (89.8%) | 54 (10.2%) |
| 35 to 44 Years | 421 (100.0%) | 0 (0.0%) |
| 45 to 54 Years | 721 (98.2%) | 13 (1.8%) |
| 55 to 64 Years | 693 (95.3%) | 34 (4.7%) |
| 65 to 74 Years | 416 (100.0%) | 0 (0.0%) |
| 75 Years and older | 593 (100.0%) | 0 (0.0%) |
| Total | 5,004 (97.1%) | 150 (2.9%) |
Health Insurance Coverage by Citizenship Status in Blauvelt
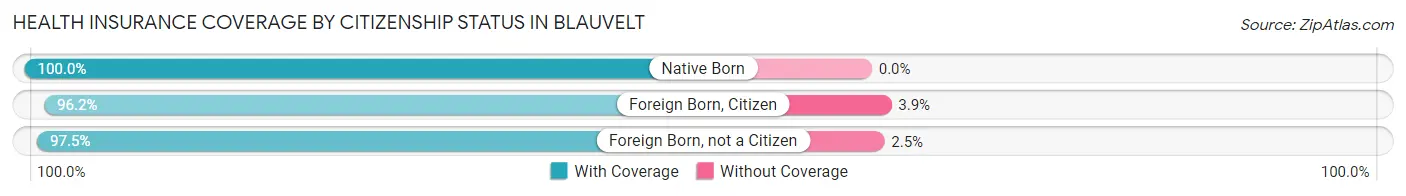
| Citizenship Status | With Coverage | Without Coverage |
| Native Born | 215 (100.0%) | 0 (0.0%) |
| Foreign Born, Citizen | 799 (96.2%) | 32 (3.8%) |
| Foreign Born, not a Citizen | 671 (97.5%) | 17 (2.5%) |
Health Insurance Coverage by Household Income in Blauvelt
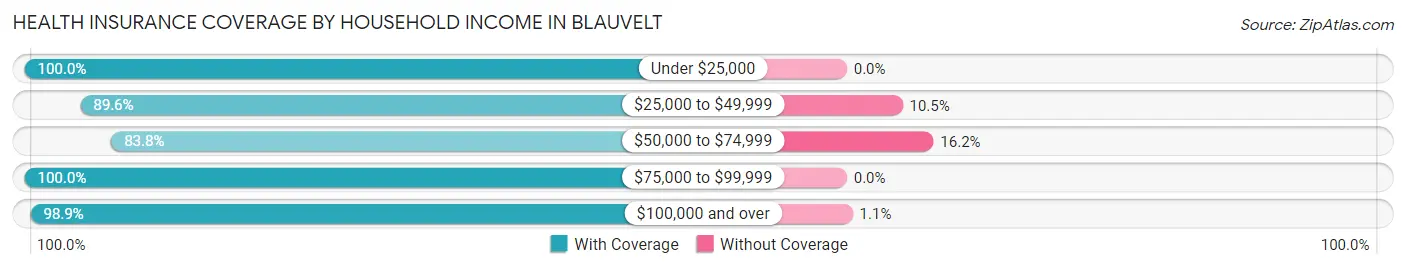
| Household Income | With Coverage | Without Coverage |
| Under $25,000 | 109 (100.0%) | 0 (0.0%) |
| $25,000 to $49,999 | 300 (89.5%) | 35 (10.4%) |
| $50,000 to $74,999 | 289 (83.8%) | 56 (16.2%) |
| $75,000 to $99,999 | 137 (100.0%) | 0 (0.0%) |
| $100,000 and over | 3,778 (98.9%) | 42 (1.1%) |
Public vs Private Health Insurance Coverage by Age in Blauvelt
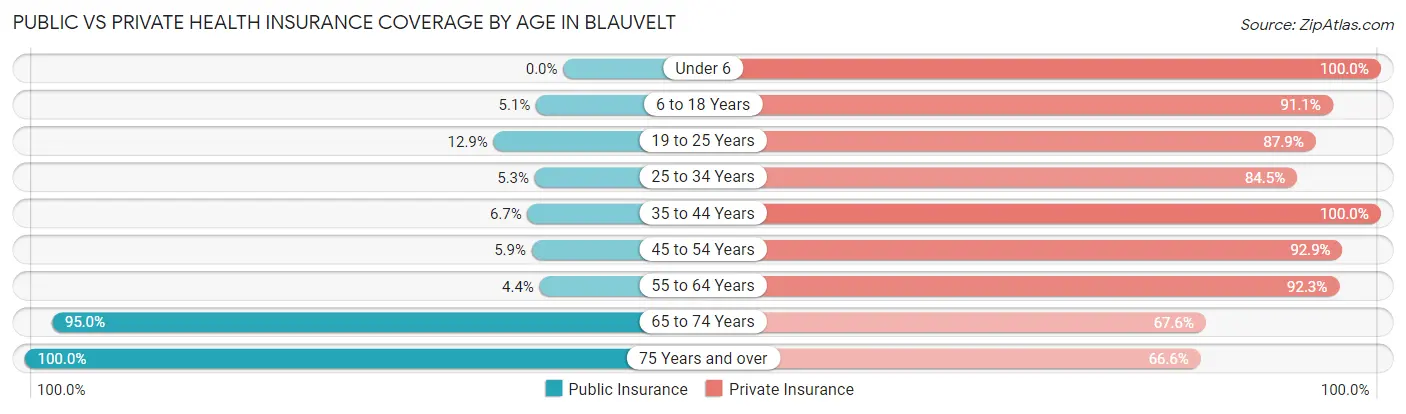
| Age Bracket | Public Insurance | Private Insurance |
| Under 6 | 0 (0.0%) | 215 (100.0%) |
| 6 to 18 Years | 42 (5.1%) | 757 (91.1%) |
| 19 to 25 Years | 89 (12.9%) | 605 (87.9%) |
| 25 to 34 Years | 28 (5.3%) | 447 (84.5%) |
| 35 to 44 Years | 28 (6.7%) | 421 (100.0%) |
| 45 to 54 Years | 43 (5.9%) | 682 (92.9%) |
| 55 to 64 Years | 32 (4.4%) | 671 (92.3%) |
| 65 to 74 Years | 395 (95.0%) | 281 (67.5%) |
| 75 Years and over | 593 (100.0%) | 395 (66.6%) |
| Total | 1,250 (24.2%) | 4,474 (86.8%) |
Disability Status by Sex by Age in Blauvelt
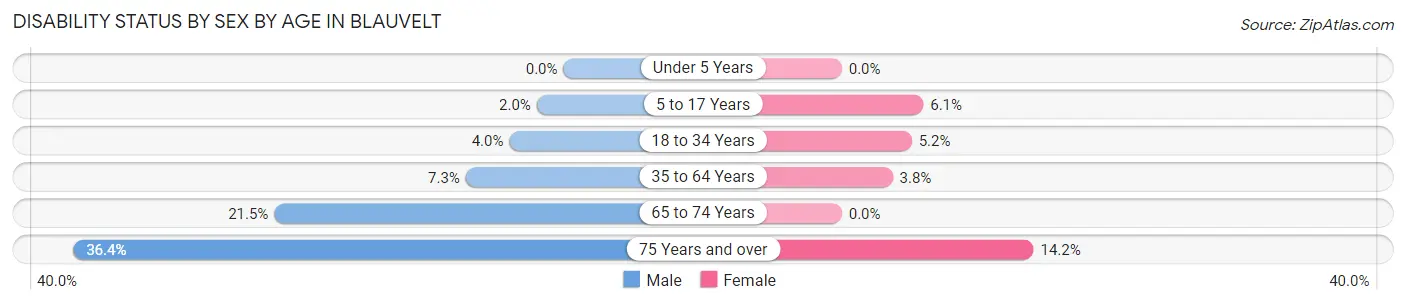
| Age Bracket | Male | Female |
| Under 5 Years | 0 (0.0%) | 0 (0.0%) |
| 5 to 17 Years | 7 (2.0%) | 29 (6.0%) |
| 18 to 34 Years | 27 (4.0%) | 32 (5.2%) |
| 35 to 64 Years | 75 (7.2%) | 32 (3.8%) |
| 65 to 74 Years | 35 (21.5%) | 0 (0.0%) |
| 75 Years and over | 111 (36.4%) | 41 (14.2%) |
Disability Class by Sex by Age in Blauvelt
Disability Class: Hearing Difficulty
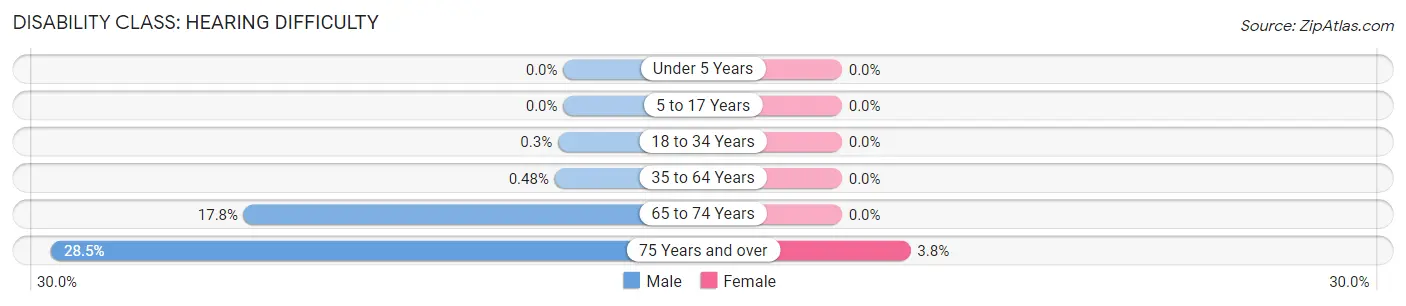
| Age Bracket | Male | Female |
| Under 5 Years | 0 (0.0%) | 0 (0.0%) |
| 5 to 17 Years | 0 (0.0%) | 0 (0.0%) |
| 18 to 34 Years | 2 (0.3%) | 0 (0.0%) |
| 35 to 64 Years | 5 (0.5%) | 0 (0.0%) |
| 65 to 74 Years | 29 (17.8%) | 0 (0.0%) |
| 75 Years and over | 87 (28.5%) | 11 (3.8%) |
Disability Class: Vision Difficulty
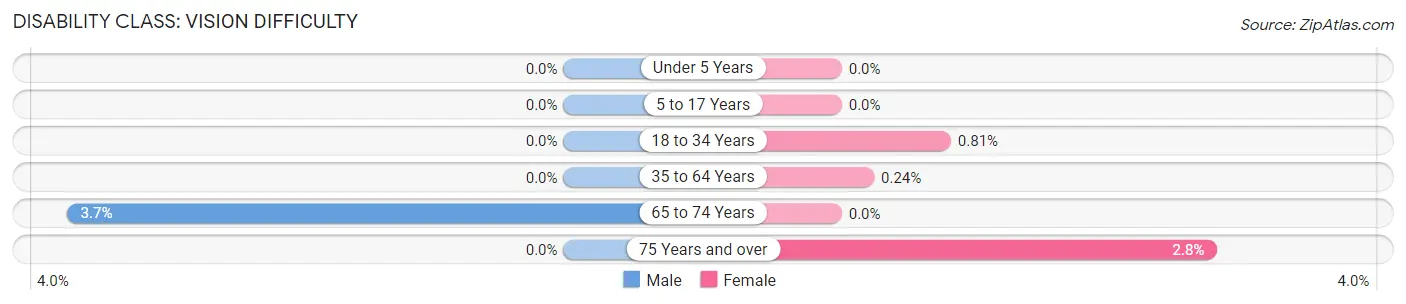
| Age Bracket | Male | Female |
| Under 5 Years | 0 (0.0%) | 0 (0.0%) |
| 5 to 17 Years | 0 (0.0%) | 0 (0.0%) |
| 18 to 34 Years | 0 (0.0%) | 5 (0.8%) |
| 35 to 64 Years | 0 (0.0%) | 2 (0.2%) |
| 65 to 74 Years | 6 (3.7%) | 0 (0.0%) |
| 75 Years and over | 0 (0.0%) | 8 (2.8%) |
Disability Class: Cognitive Difficulty
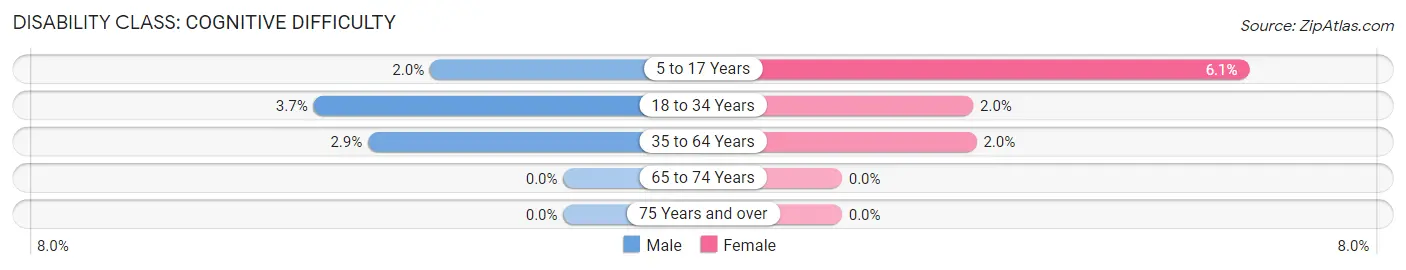
| Age Bracket | Male | Female |
| 5 to 17 Years | 7 (2.0%) | 29 (6.0%) |
| 18 to 34 Years | 25 (3.7%) | 12 (1.9%) |
| 35 to 64 Years | 30 (2.9%) | 17 (2.0%) |
| 65 to 74 Years | 0 (0.0%) | 0 (0.0%) |
| 75 Years and over | 0 (0.0%) | 0 (0.0%) |
Disability Class: Ambulatory Difficulty
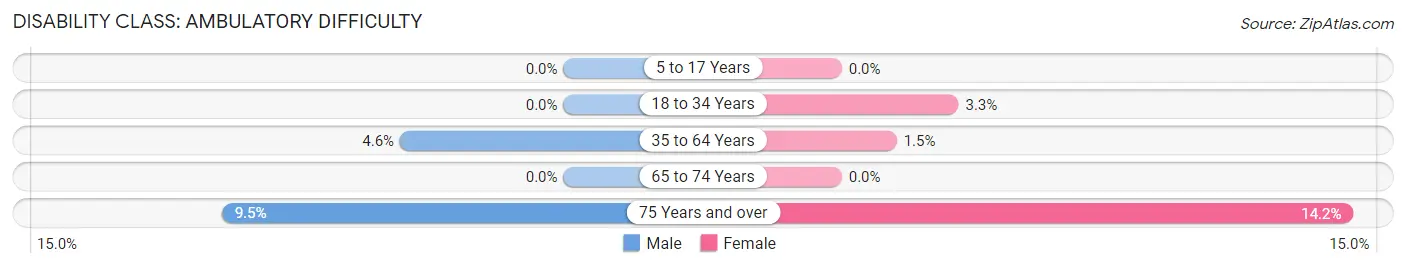
| Age Bracket | Male | Female |
| 5 to 17 Years | 0 (0.0%) | 0 (0.0%) |
| 18 to 34 Years | 0 (0.0%) | 20 (3.3%) |
| 35 to 64 Years | 47 (4.5%) | 13 (1.5%) |
| 65 to 74 Years | 0 (0.0%) | 0 (0.0%) |
| 75 Years and over | 29 (9.5%) | 41 (14.2%) |
Disability Class: Self-Care Difficulty
| Age Bracket | Male | Female |
| 5 to 17 Years | 0 (0.0%) | 0 (0.0%) |
| 18 to 34 Years | 0 (0.0%) | 0 (0.0%) |
| 35 to 64 Years | 0 (0.0%) | 12 (1.4%) |
| 65 to 74 Years | 0 (0.0%) | 0 (0.0%) |
| 75 Years and over | 0 (0.0%) | 8 (2.8%) |
Technology Access in Blauvelt
Computing Device Access in Blauvelt
| Device Type | # Households | % Households |
| Desktop or Laptop | 1,310 | 86.2% |
| Smartphone | 1,290 | 84.9% |
| Tablet | 1,121 | 73.8% |
| No Computing Device | 87 | 5.7% |
| Total | 1,520 | 100.0% |
Internet Access in Blauvelt
| Internet Type | # Households | % Households |
| Dial-Up Internet | 0 | 0.0% |
| Broadband Home | 1,308 | 86.1% |
| Cellular Data Only | 103 | 6.8% |
| Satellite Internet | 36 | 2.4% |
| No Internet | 80 | 5.3% |
| Total | 1,520 | 100.0% |
Blauvelt Summary
Blauvelt is a hamlet located in the town of Orangetown in Rockland County, New York. It is located about 20 miles north of New York City and is part of the New York metropolitan area. The hamlet is named after the Blauvelt family, who were among the earliest settlers in the area.
Geography
Blauvelt is located at 41°04'N 73°59'W. It is situated in the southeastern corner of Rockland County, just north of the New York City borough of the Bronx. The hamlet is bordered by the hamlets of Tappan to the north, Pearl River to the east, Orangeburg to the south, and West Nyack to the west. The hamlet is located in the Ramapo Mountains, which are part of the Appalachian Mountains. The highest point in Blauvelt is the summit of High Tor Mountain, which is 845 feet above sea level.
The hamlet is located in the Hackensack River watershed. The Hackensack River is a major tributary of the Hudson River, which flows into the Atlantic Ocean. The Hackensack River is the main source of water for the hamlet.
History
The area that is now Blauvelt was originally inhabited by the Lenape Native Americans. The first European settlers arrived in the area in the late 17th century. The hamlet was named after the Blauvelt family, who were among the earliest settlers in the area. The hamlet was officially established in 1858.
In the late 19th century, the hamlet was a popular summer resort destination for wealthy New Yorkers. The hamlet was home to several large estates, including the Blauvelt Mansion, which was built in 1875. The mansion is now a museum and is listed on the National Register of Historic Places.
Economy
The economy of Blauvelt is largely based on tourism and retail. The hamlet is home to several small businesses, including restaurants, shops, and galleries. The hamlet is also home to several corporate offices, including those of the pharmaceutical company Pfizer and the financial services company UBS.
Demographics
As of the 2010 census, the population of Blauvelt was 5,689. The racial makeup of the hamlet was 87.3% White, 5.2% African American, 0.3% Native American, 3.2% Asian, and 3.9% from other races. The median household income was $90,945, and the median family income was $103,945.
The hamlet is served by the South Orangetown Central School District. The district includes five elementary schools, one middle school, and one high school. The hamlet is also home to several private schools, including the Blauvelt Free Library and the Blauvelt Free School.
Common Questions
What is Per Capita Income in Blauvelt?
Per Capita income in Blauvelt is $55,473.
What is the Median Family Income in Blauvelt?
Median Family Income in Blauvelt is $177,026.
What is the Median Household income in Blauvelt?
Median Household Income in Blauvelt is $171,786.
What is Income or Wage Gap in Blauvelt?
Income or Wage Gap in Blauvelt is 31.2%.
Women in Blauvelt earn 68.8 cents for every dollar earned by a man.
What is Inequality or Gini Index in Blauvelt?
Inequality or Gini Index in Blauvelt is 0.39.
What is the Total Population of Blauvelt?
Total Population of Blauvelt is 5,154.
What is the Total Male Population of Blauvelt?
Total Male Population of Blauvelt is 2,597.
What is the Total Female Population of Blauvelt?
Total Female Population of Blauvelt is 2,557.
What is the Ratio of Males per 100 Females in Blauvelt?
There are 101.56 Males per 100 Females in Blauvelt.
What is the Ratio of Females per 100 Males in Blauvelt?
There are 98.46 Females per 100 Males in Blauvelt.
What is the Median Population Age in Blauvelt?
Median Population Age in Blauvelt is 42.2 Years.
What is the Average Family Size in Blauvelt
Average Family Size in Blauvelt is 3.4 People.
What is the Average Household Size in Blauvelt
Average Household Size in Blauvelt is 3.1 People.
How Large is the Labor Force in Blauvelt?
There are 2,695 People in the Labor Forcein in Blauvelt.
What is the Percentage of People in the Labor Force in Blauvelt?
62.8% of People are in the Labor Force in Blauvelt.
What is the Unemployment Rate in Blauvelt?
Unemployment Rate in Blauvelt is 5.7%.