Binghamton, NY Map & Demographics
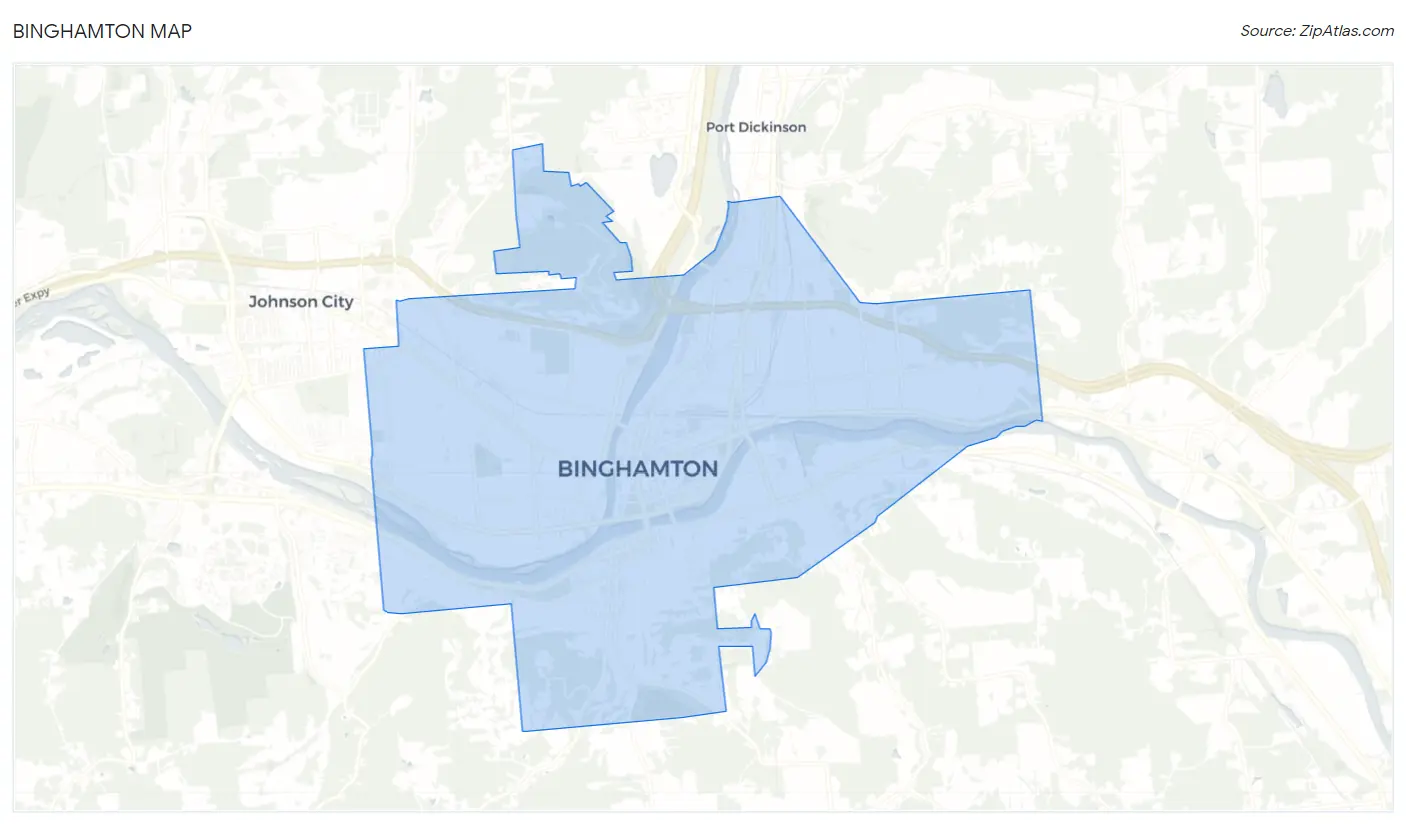
Binghamton Map
Binghamton Overview
$30,282
PER CAPITA INCOME
$60,648
AVG FAMILY INCOME
$42,031
AVG HOUSEHOLD INCOME
22.2%
WAGE / INCOME GAP [ % ]
77.8¢/ $1
WAGE / INCOME GAP [ $ ]
$11,290
FAMILY INCOME DEFICIT
0.53
INEQUALITY / GINI INDEX
47,617
TOTAL POPULATION
22,968
MALE POPULATION
24,649
FEMALE POPULATION
93.18
MALES / 100 FEMALES
107.32
FEMALES / 100 MALES
35.4
MEDIAN AGE
3.0
AVG FAMILY SIZE
2.2
AVG HOUSEHOLD SIZE
23,089
LABOR FORCE [ PEOPLE ]
56.8%
PERCENT IN LABOR FORCE
10.1%
UNEMPLOYMENT RATE
Binghamton Area Codes
Income in Binghamton
Income Overview in Binghamton
Per Capita Income in Binghamton is $30,282, while median incomes of families and households are $60,648 and $42,031 respectively.
| Characteristic | Number | Measure |
| Per Capita Income | 47,617 | $30,282 |
| Median Family Income | 9,140 | $60,648 |
| Mean Family Income | 9,140 | $85,245 |
| Median Household Income | 20,935 | $42,031 |
| Mean Household Income | 20,935 | $68,254 |
| Income Deficit | 9,140 | $11,290 |
| Wage / Income Gap (%) | 47,617 | 22.17% |
| Wage / Income Gap ($) | 47,617 | 77.83¢ per $1 |
| Gini / Inequality Index | 47,617 | 0.53 |
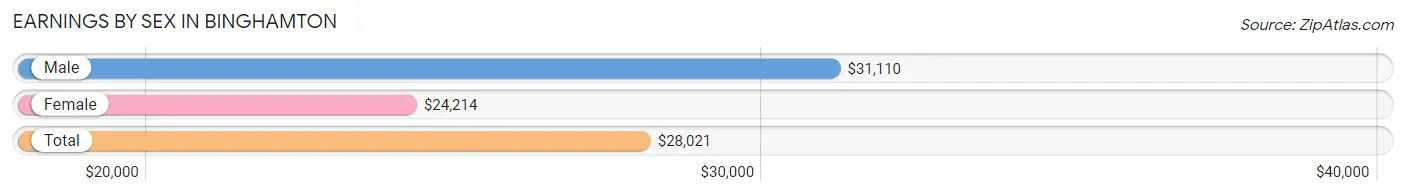
Earnings by Sex in Binghamton
Average Earnings in Binghamton are $28,021, $31,110 for men and $24,214 for women, a difference of 22.2%.
| Sex | Number | Average Earnings |
| Male | 12,638 (50.9%) | $31,110 |
| Female | 12,170 (49.1%) | $24,214 |
| Total | 24,808 (100.0%) | $28,021 |
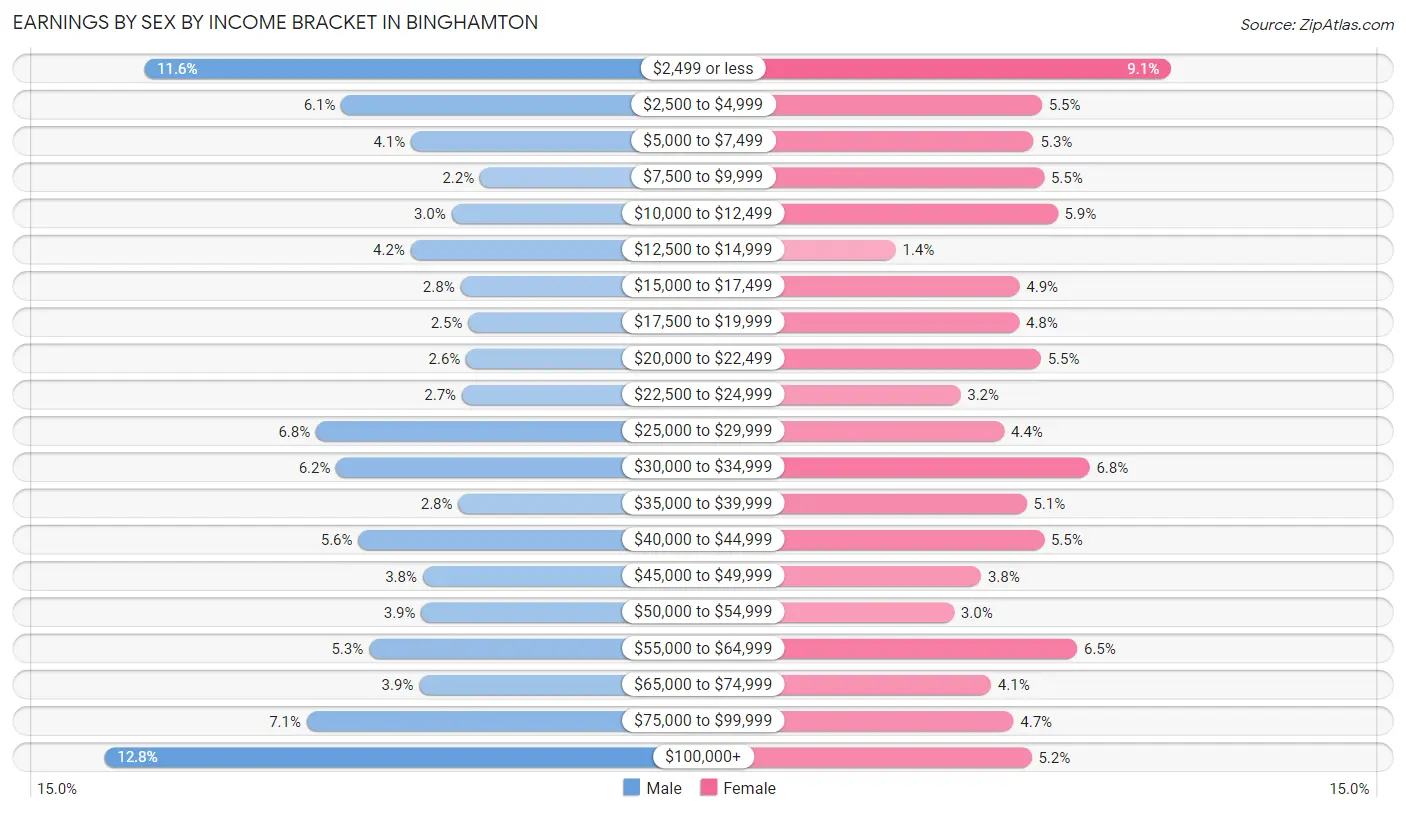
Earnings by Sex by Income Bracket in Binghamton
The most common earnings brackets in Binghamton are $100,000+ for men (1,613 | 12.8%) and $2,499 or less for women (1,109 | 9.1%).
| Income | Male | Female |
| $2,499 or less | 1,471 (11.6%) | 1,109 (9.1%) |
| $2,500 to $4,999 | 771 (6.1%) | 667 (5.5%) |
| $5,000 to $7,499 | 523 (4.1%) | 639 (5.2%) |
| $7,500 to $9,999 | 278 (2.2%) | 674 (5.5%) |
| $10,000 to $12,499 | 379 (3.0%) | 721 (5.9%) |
| $12,500 to $14,999 | 524 (4.2%) | 167 (1.4%) |
| $15,000 to $17,499 | 348 (2.8%) | 590 (4.9%) |
| $17,500 to $19,999 | 320 (2.5%) | 589 (4.8%) |
| $20,000 to $22,499 | 327 (2.6%) | 663 (5.4%) |
| $22,500 to $24,999 | 343 (2.7%) | 388 (3.2%) |
| $25,000 to $29,999 | 861 (6.8%) | 538 (4.4%) |
| $30,000 to $34,999 | 788 (6.2%) | 830 (6.8%) |
| $35,000 to $39,999 | 355 (2.8%) | 614 (5.1%) |
| $40,000 to $44,999 | 710 (5.6%) | 674 (5.5%) |
| $45,000 to $49,999 | 482 (3.8%) | 459 (3.8%) |
| $50,000 to $54,999 | 486 (3.8%) | 366 (3.0%) |
| $55,000 to $64,999 | 672 (5.3%) | 787 (6.5%) |
| $65,000 to $74,999 | 494 (3.9%) | 493 (4.1%) |
| $75,000 to $99,999 | 893 (7.1%) | 570 (4.7%) |
| $100,000+ | 1,613 (12.8%) | 632 (5.2%) |
| Total | 12,638 (100.0%) | 12,170 (100.0%) |
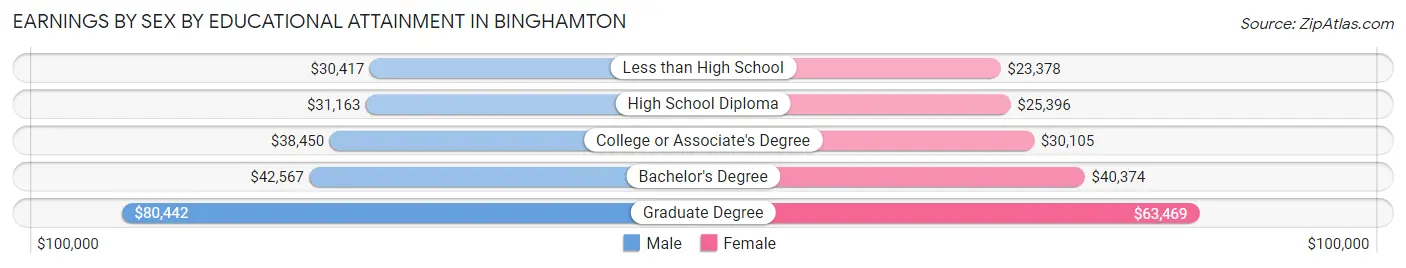
Earnings by Sex by Educational Attainment in Binghamton
Average earnings in Binghamton are $41,832 for men and $35,158 for women, a difference of 16.0%. Men with an educational attainment of graduate degree enjoy the highest average annual earnings of $80,442, while those with less than high school education earn the least with $30,417. Women with an educational attainment of graduate degree earn the most with the average annual earnings of $63,469, while those with less than high school education have the smallest earnings of $23,378.
| Educational Attainment | Male Income | Female Income |
| Less than High School | $30,417 | $23,378 |
| High School Diploma | $31,163 | $25,396 |
| College or Associate's Degree | $38,450 | $30,105 |
| Bachelor's Degree | $42,567 | $40,374 |
| Graduate Degree | $80,442 | $63,469 |
| Total | $41,832 | $35,158 |
Family Income in Binghamton
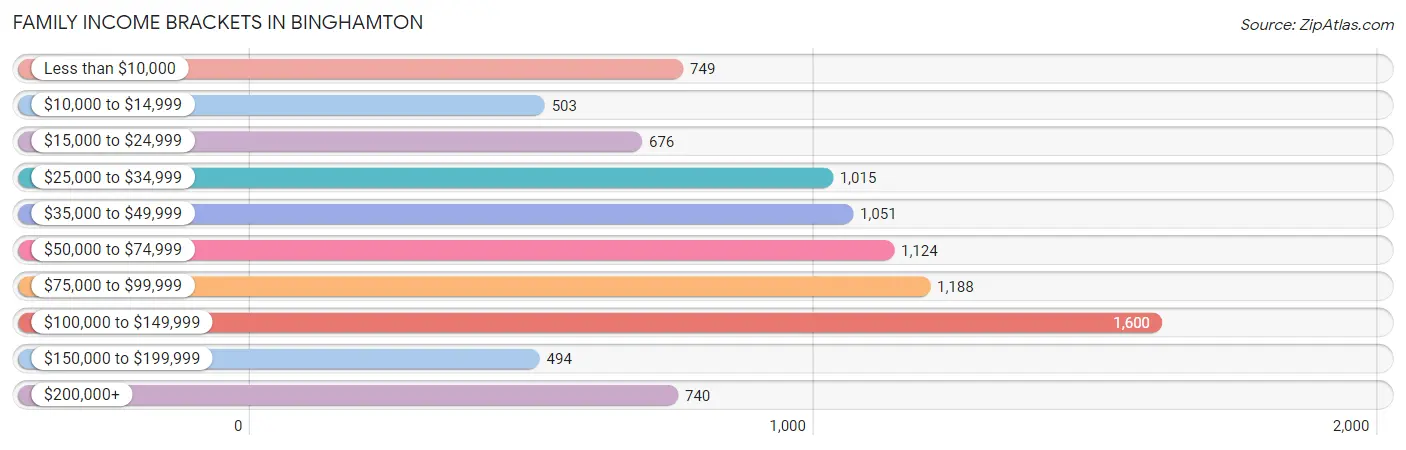
Family Income Brackets in Binghamton
According to the Binghamton family income data, there are 1,600 families falling into the $100,000 to $149,999 income range, which is the most common income bracket and makes up 17.5% of all families. Conversely, the $150,000 to $199,999 income bracket is the least frequent group with only 494 families (5.4%) belonging to this category.
| Income Bracket | # Families | % Families |
| Less than $10,000 | 749 | 8.2% |
| $10,000 to $14,999 | 503 | 5.5% |
| $15,000 to $24,999 | 676 | 7.4% |
| $25,000 to $34,999 | 1,015 | 11.1% |
| $35,000 to $49,999 | 1,051 | 11.5% |
| $50,000 to $74,999 | 1,124 | 12.3% |
| $75,000 to $99,999 | 1,188 | 13.0% |
| $100,000 to $149,999 | 1,600 | 17.5% |
| $150,000 to $199,999 | 494 | 5.4% |
| $200,000+ | 740 | 8.1% |
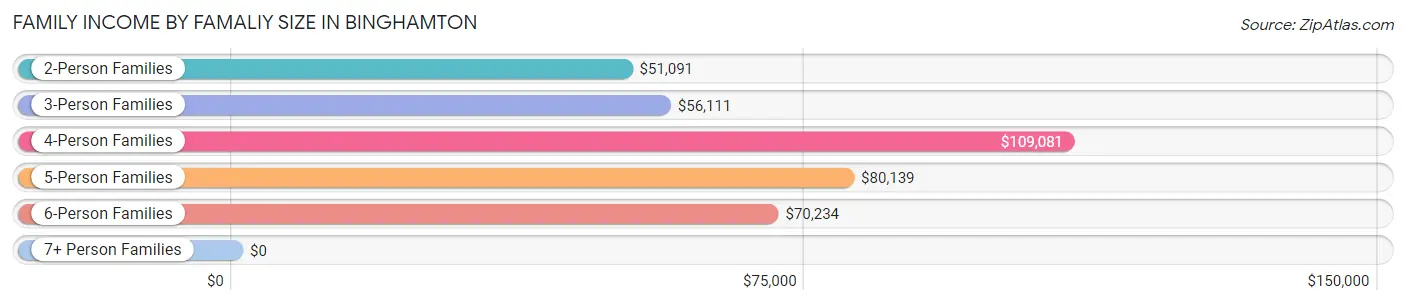
Family Income by Famaliy Size in Binghamton
4-person families (1,251 | 13.7%) account for the highest median family income in Binghamton with $109,081 per family, while 4-person families (1,251 | 13.7%) have the highest median income of $27,270 per family member.
| Income Bracket | # Families | Median Income |
| 2-Person Families | 4,843 (53.0%) | $51,091 |
| 3-Person Families | 2,062 (22.6%) | $56,111 |
| 4-Person Families | 1,251 (13.7%) | $109,081 |
| 5-Person Families | 566 (6.2%) | $80,139 |
| 6-Person Families | 265 (2.9%) | $70,234 |
| 7+ Person Families | 153 (1.7%) | $0 |
| Total | 9,140 (100.0%) | $60,648 |
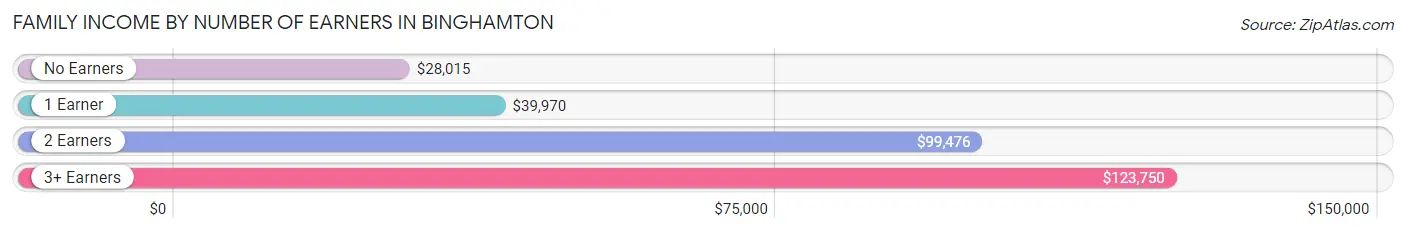
Family Income by Number of Earners in Binghamton
The median family income in Binghamton is $60,648, with families comprising 3+ earners (793) having the highest median family income of $123,750, while families with no earners (1,760) have the lowest median family income of $28,015, accounting for 8.7% and 19.3% of families, respectively.
| Number of Earners | # Families | Median Income |
| No Earners | 1,760 (19.3%) | $28,015 |
| 1 Earner | 3,384 (37.0%) | $39,970 |
| 2 Earners | 3,203 (35.0%) | $99,476 |
| 3+ Earners | 793 (8.7%) | $123,750 |
| Total | 9,140 (100.0%) | $60,648 |
Household Income in Binghamton
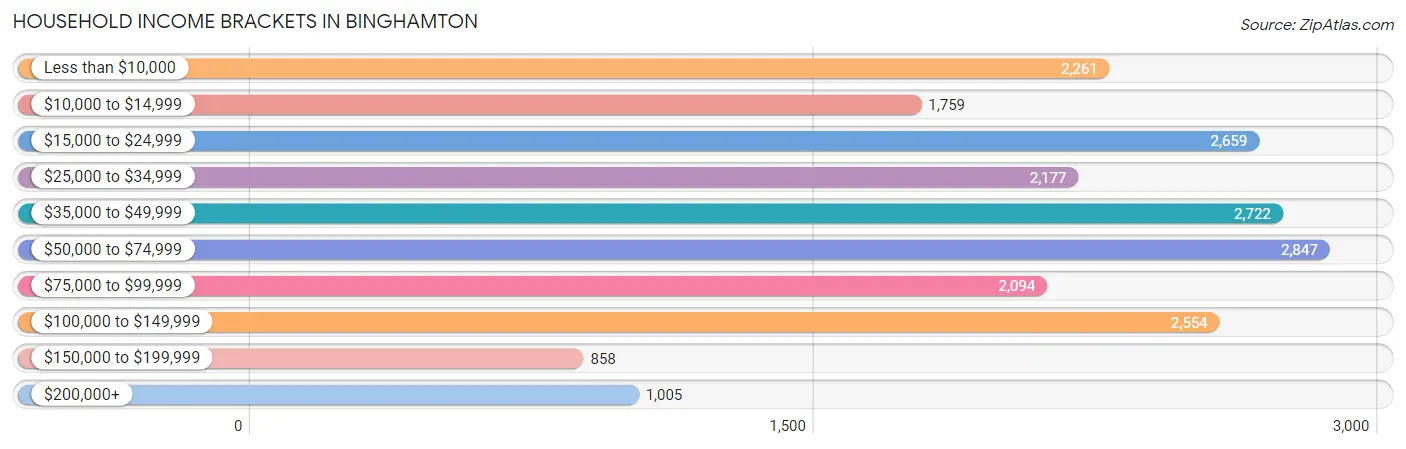
Household Income Brackets in Binghamton
With 2,847 households falling in the category, the $50,000 to $74,999 income range is the most frequent in Binghamton, accounting for 13.6% of all households. In contrast, only 858 households (4.1%) fall into the $150,000 to $199,999 income bracket, making it the least populous group.
| Income Bracket | # Households | % Households |
| Less than $10,000 | 2,261 | 10.8% |
| $10,000 to $14,999 | 1,759 | 8.4% |
| $15,000 to $24,999 | 2,659 | 12.7% |
| $25,000 to $34,999 | 2,177 | 10.4% |
| $35,000 to $49,999 | 2,722 | 13.0% |
| $50,000 to $74,999 | 2,847 | 13.6% |
| $75,000 to $99,999 | 2,094 | 10.0% |
| $100,000 to $149,999 | 2,554 | 12.2% |
| $150,000 to $199,999 | 858 | 4.1% |
| $200,000+ | 1,005 | 4.8% |
Household Income by Householder Age in Binghamton
The median household income in Binghamton is $42,031, with the highest median household income of $55,372 found in the 25 to 44 years age bracket for the primary householder. A total of 5,772 households (27.6%) fall into this category. Meanwhile, the 15 to 24 years age bracket for the primary householder has the lowest median household income of $21,309, with 2,437 households (11.6%) in this group.
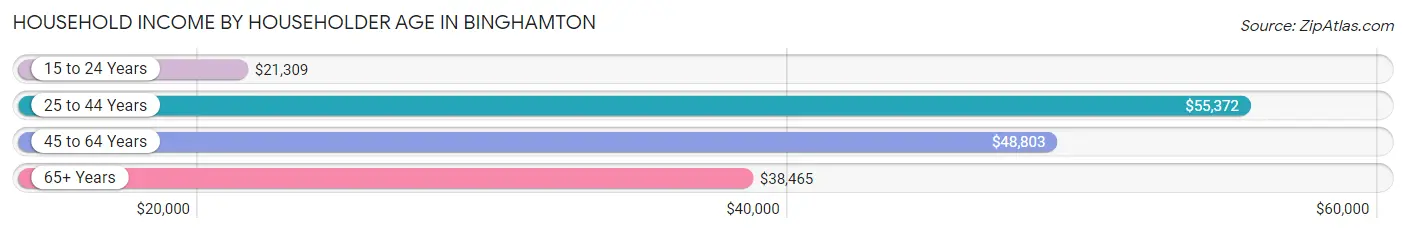
| Income Bracket | # Households | Median Income |
| 15 to 24 Years | 2,437 (11.6%) | $21,309 |
| 25 to 44 Years | 5,772 (27.6%) | $55,372 |
| 45 to 64 Years | 7,227 (34.5%) | $48,803 |
| 65+ Years | 5,499 (26.3%) | $38,465 |
| Total | 20,935 (100.0%) | $42,031 |
Poverty in Binghamton
Income Below Poverty by Sex and Age in Binghamton
With 32.0% poverty level for males and 31.4% for females among the residents of Binghamton, 6 to 11 year old males and 18 to 24 year old females are the most vulnerable to poverty, with 580 males (56.9%) and 2,548 females (58.0%) in their respective age groups living below the poverty level.
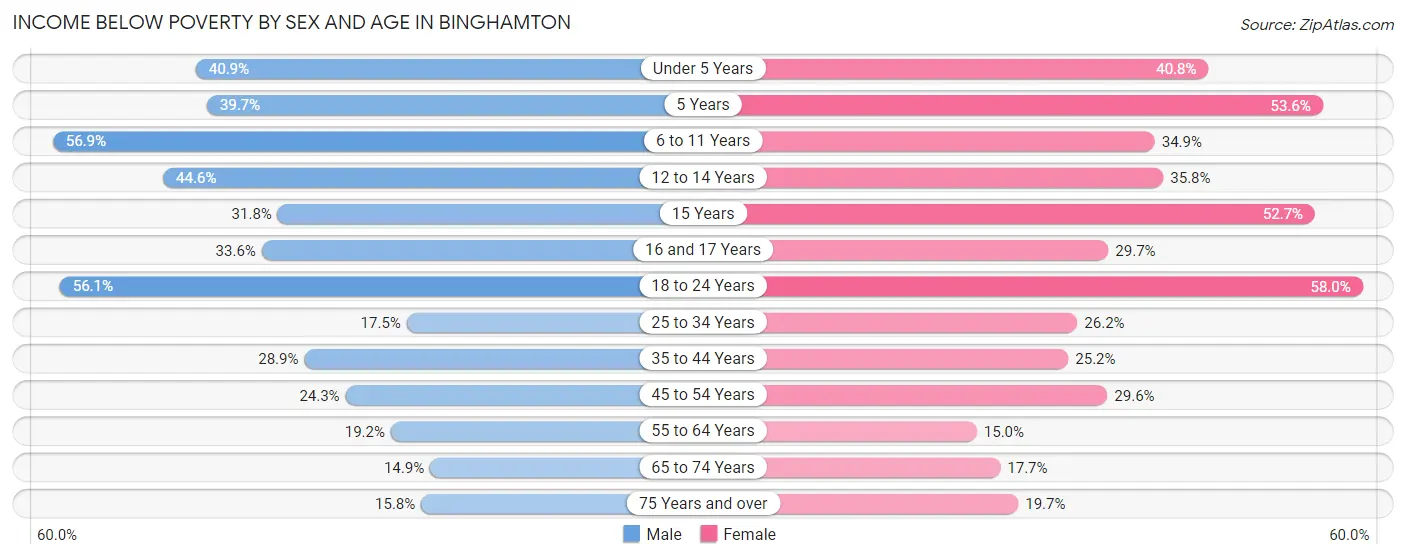
| Age Bracket | Male | Female |
| Under 5 Years | 426 (40.9%) | 493 (40.8%) |
| 5 Years | 79 (39.7%) | 83 (53.5%) |
| 6 to 11 Years | 580 (56.9%) | 396 (34.9%) |
| 12 to 14 Years | 353 (44.6%) | 332 (35.8%) |
| 15 Years | 42 (31.8%) | 88 (52.7%) |
| 16 and 17 Years | 166 (33.6%) | 171 (29.7%) |
| 18 to 24 Years | 2,665 (56.1%) | 2,548 (58.0%) |
| 25 to 34 Years | 566 (17.4%) | 793 (26.2%) |
| 35 to 44 Years | 723 (28.8%) | 614 (25.2%) |
| 45 to 54 Years | 557 (24.3%) | 784 (29.6%) |
| 55 to 64 Years | 530 (19.2%) | 476 (15.0%) |
| 65 to 74 Years | 276 (14.8%) | 392 (17.7%) |
| 75 Years and over | 208 (15.8%) | 394 (19.7%) |
| Total | 7,171 (32.0%) | 7,564 (31.4%) |
Income Above Poverty by Sex and Age in Binghamton
According to the poverty statistics in Binghamton, males aged 65 to 74 years and females aged 55 to 64 years are the age groups that are most secure financially, with 85.2% of males and 85.0% of females in these age groups living above the poverty line.
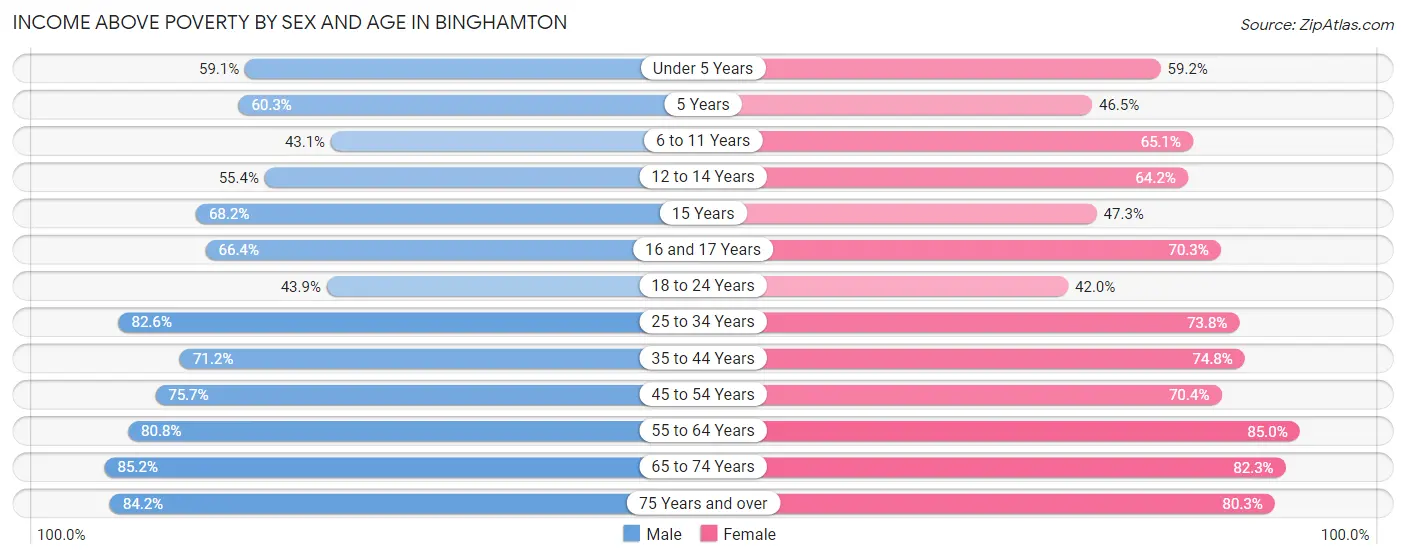
| Age Bracket | Male | Female |
| Under 5 Years | 615 (59.1%) | 715 (59.2%) |
| 5 Years | 120 (60.3%) | 72 (46.5%) |
| 6 to 11 Years | 440 (43.1%) | 740 (65.1%) |
| 12 to 14 Years | 439 (55.4%) | 595 (64.2%) |
| 15 Years | 90 (68.2%) | 79 (47.3%) |
| 16 and 17 Years | 328 (66.4%) | 405 (70.3%) |
| 18 to 24 Years | 2,087 (43.9%) | 1,846 (42.0%) |
| 25 to 34 Years | 2,677 (82.6%) | 2,229 (73.8%) |
| 35 to 44 Years | 1,783 (71.2%) | 1,820 (74.8%) |
| 45 to 54 Years | 1,738 (75.7%) | 1,866 (70.4%) |
| 55 to 64 Years | 2,228 (80.8%) | 2,689 (85.0%) |
| 65 to 74 Years | 1,583 (85.2%) | 1,828 (82.3%) |
| 75 Years and over | 1,105 (84.2%) | 1,610 (80.3%) |
| Total | 15,233 (68.0%) | 16,494 (68.6%) |
Income Below Poverty Among Married-Couple Families in Binghamton
The poverty statistics for married-couple families in Binghamton show that 9.5% or 507 of the total 5,322 families live below the poverty line. Families with 5 or more children have the highest poverty rate of 95.2%, comprising of 99 families. On the other hand, families with 1 or 2 children have the lowest poverty rate of 4.6%, which includes 60 families.
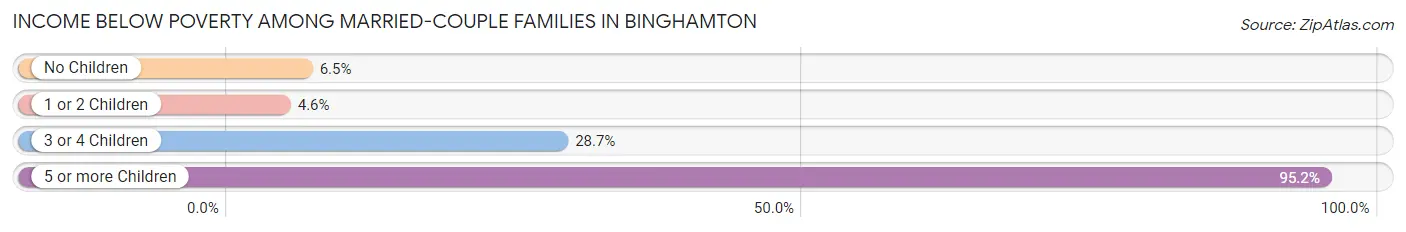
| Children | Above Poverty | Below Poverty |
| No Children | 3,263 (93.5%) | 227 (6.5%) |
| 1 or 2 Children | 1,247 (95.4%) | 60 (4.6%) |
| 3 or 4 Children | 300 (71.3%) | 121 (28.7%) |
| 5 or more Children | 5 (4.8%) | 99 (95.2%) |
| Total | 4,815 (90.5%) | 507 (9.5%) |
Income Below Poverty Among Single-Parent Households in Binghamton
According to the poverty data in Binghamton, 31.6% or 268 single-father households and 37.5% or 1,114 single-mother households are living below the poverty line. Among single-father households, those with 1 or 2 children have the highest poverty rate, with 206 households (46.4%) experiencing poverty. Likewise, among single-mother households, those with 5 or more children have the highest poverty rate, with 39 households (100.0%) falling below the poverty line.
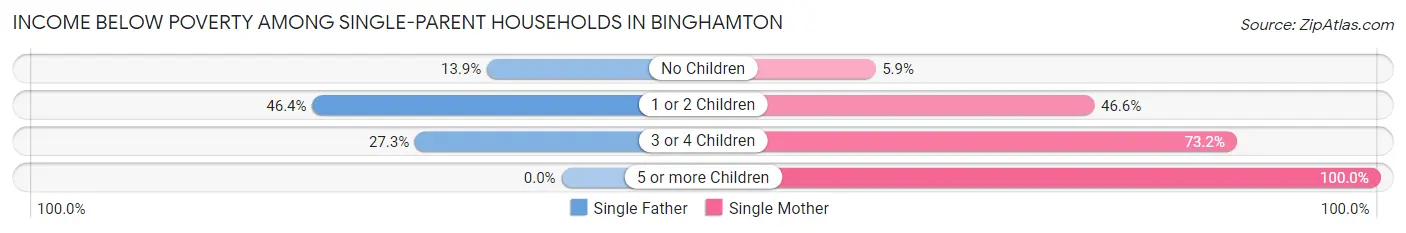
| Children | Single Father | Single Mother |
| No Children | 50 (13.9%) | 50 (5.9%) |
| 1 or 2 Children | 206 (46.4%) | 872 (46.6%) |
| 3 or 4 Children | 12 (27.3%) | 153 (73.2%) |
| 5 or more Children | 0 (0.0%) | 39 (100.0%) |
| Total | 268 (31.6%) | 1,114 (37.5%) |
Income Below Poverty Among Married-Couple vs Single-Parent Households in Binghamton
The poverty data for Binghamton shows that 507 of the married-couple family households (9.5%) and 1,382 of the single-parent households (36.2%) are living below the poverty level. Within the married-couple family households, those with 5 or more children have the highest poverty rate, with 99 households (95.2%) falling below the poverty line. Among the single-parent households, those with 5 or more children have the highest poverty rate, with 39 household (100.0%) living below poverty.
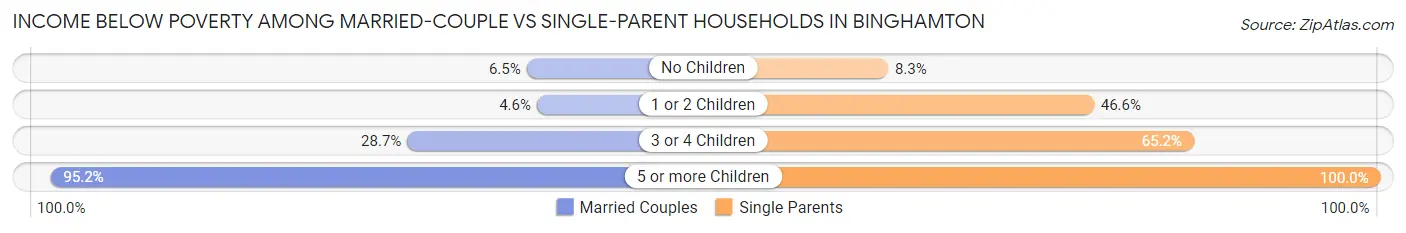
| Children | Married-Couple Families | Single-Parent Households |
| No Children | 227 (6.5%) | 100 (8.3%) |
| 1 or 2 Children | 60 (4.6%) | 1,078 (46.6%) |
| 3 or 4 Children | 121 (28.7%) | 165 (65.2%) |
| 5 or more Children | 99 (95.2%) | 39 (100.0%) |
| Total | 507 (9.5%) | 1,382 (36.2%) |
Race in Binghamton
The most populous races in Binghamton are White / Caucasian (32,710 | 68.7%), Black / African American (6,772 | 14.2%), and Hispanic or Latino (4,389 | 9.2%).
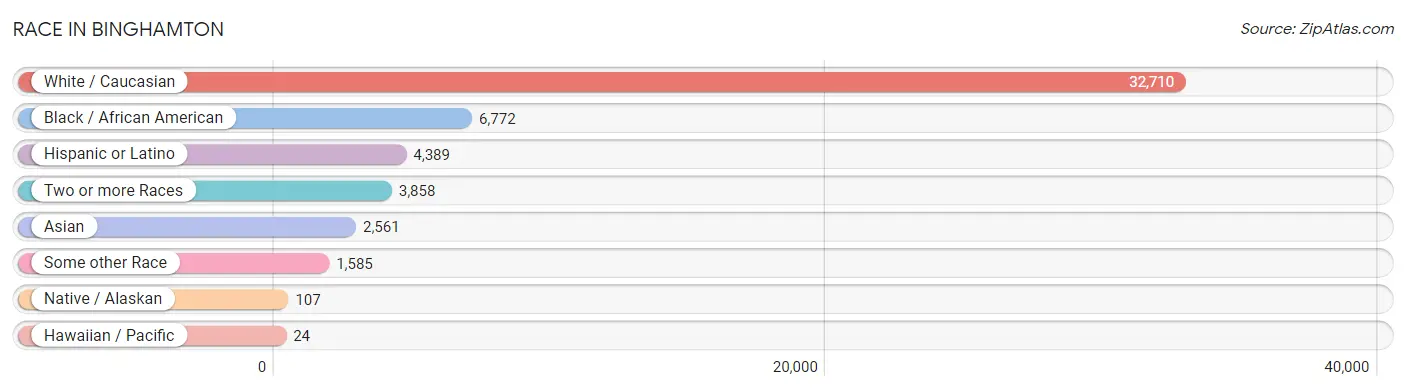
| Race | # Population | % Population |
| Asian | 2,561 | 5.4% |
| Black / African American | 6,772 | 14.2% |
| Hawaiian / Pacific | 24 | 0.1% |
| Hispanic or Latino | 4,389 | 9.2% |
| Native / Alaskan | 107 | 0.2% |
| White / Caucasian | 32,710 | 68.7% |
| Two or more Races | 3,858 | 8.1% |
| Some other Race | 1,585 | 3.3% |
| Total | 47,617 | 100.0% |
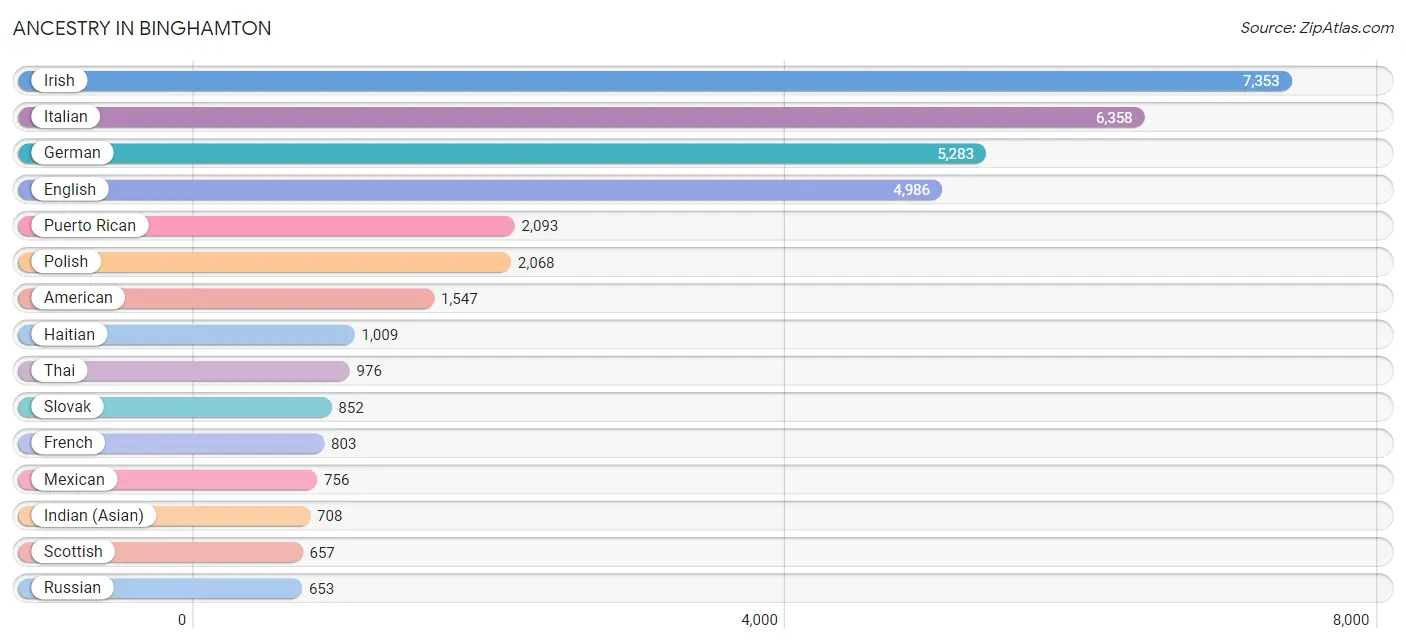
Ancestry in Binghamton
The most populous ancestries reported in Binghamton are Irish (7,353 | 15.4%), Italian (6,358 | 13.4%), German (5,283 | 11.1%), English (4,986 | 10.5%), and Puerto Rican (2,093 | 4.4%), together accounting for 54.8% of all Binghamton residents.
| Ancestry | # Population | % Population |
| African | 225 | 0.5% |
| Albanian | 40 | 0.1% |
| American | 1,547 | 3.3% |
| Arab | 418 | 0.9% |
| Argentinean | 21 | 0.0% |
| Armenian | 98 | 0.2% |
| Austrian | 51 | 0.1% |
| Barbadian | 44 | 0.1% |
| Belgian | 47 | 0.1% |
| Bhutanese | 182 | 0.4% |
| Blackfeet | 5 | 0.0% |
| Brazilian | 68 | 0.1% |
| British | 101 | 0.2% |
| British West Indian | 4 | 0.0% |
| Burmese | 195 | 0.4% |
| Carpatho Rusyn | 17 | 0.0% |
| Celtic | 12 | 0.0% |
| Central American | 220 | 0.5% |
| Central American Indian | 53 | 0.1% |
| Cherokee | 126 | 0.3% |
| Chilean | 91 | 0.2% |
| Chippewa | 7 | 0.0% |
| Colombian | 188 | 0.4% |
| Costa Rican | 14 | 0.0% |
| Croatian | 13 | 0.0% |
| Cuban | 52 | 0.1% |
| Czech | 144 | 0.3% |
| Czechoslovakian | 125 | 0.3% |
| Danish | 184 | 0.4% |
| Delaware | 2 | 0.0% |
| Dominican | 619 | 1.3% |
| Dutch | 591 | 1.2% |
| Eastern European | 181 | 0.4% |
| Ecuadorian | 20 | 0.0% |
| English | 4,986 | 10.5% |
| European | 344 | 0.7% |
| Filipino | 19 | 0.0% |
| Finnish | 66 | 0.1% |
| French | 803 | 1.7% |
| French Canadian | 144 | 0.3% |
| German | 5,283 | 11.1% |
| Ghanaian | 24 | 0.1% |
| Greek | 432 | 0.9% |
| Guamanian / Chamorro | 24 | 0.1% |
| Guyanese | 48 | 0.1% |
| Haitian | 1,009 | 2.1% |
| Honduran | 132 | 0.3% |
| Hungarian | 184 | 0.4% |
| Icelander | 10 | 0.0% |
| Indian (Asian) | 708 | 1.5% |
| Indonesian | 53 | 0.1% |
| Iranian | 28 | 0.1% |
| Iraqi | 53 | 0.1% |
| Irish | 7,353 | 15.4% |
| Iroquois | 65 | 0.1% |
| Israeli | 75 | 0.2% |
| Italian | 6,358 | 13.4% |
| Jamaican | 273 | 0.6% |
| Jordanian | 20 | 0.0% |
| Kenyan | 66 | 0.1% |
| Korean | 275 | 0.6% |
| Laotian | 2 | 0.0% |
| Latvian | 68 | 0.1% |
| Lebanese | 45 | 0.1% |
| Lithuanian | 294 | 0.6% |
| Malaysian | 61 | 0.1% |
| Mexican | 756 | 1.6% |
| Moroccan | 14 | 0.0% |
| Navajo | 10 | 0.0% |
| Nigerian | 7 | 0.0% |
| Northern European | 18 | 0.0% |
| Norwegian | 193 | 0.4% |
| Panamanian | 42 | 0.1% |
| Pennsylvania German | 115 | 0.2% |
| Peruvian | 7 | 0.0% |
| Polish | 2,068 | 4.3% |
| Portuguese | 154 | 0.3% |
| Puerto Rican | 2,093 | 4.4% |
| Romanian | 71 | 0.2% |
| Russian | 653 | 1.4% |
| Salvadoran | 8 | 0.0% |
| Scandinavian | 133 | 0.3% |
| Scotch-Irish | 338 | 0.7% |
| Scottish | 657 | 1.4% |
| Slavic | 11 | 0.0% |
| Slovak | 852 | 1.8% |
| Slovene | 58 | 0.1% |
| South American | 363 | 0.8% |
| Spaniard | 5 | 0.0% |
| Spanish | 92 | 0.2% |
| Sri Lankan | 284 | 0.6% |
| Subsaharan African | 619 | 1.3% |
| Sudanese | 138 | 0.3% |
| Swedish | 340 | 0.7% |
| Swiss | 14 | 0.0% |
| Syrian | 122 | 0.3% |
| Thai | 976 | 2.1% |
| Trinidadian and Tobagonian | 15 | 0.0% |
| Turkish | 108 | 0.2% |
| U.S. Virgin Islander | 19 | 0.0% |
| Ukrainian | 299 | 0.6% |
| Venezuelan | 10 | 0.0% |
| Vietnamese | 163 | 0.3% |
| Welsh | 482 | 1.0% |
| West Indian | 48 | 0.1% |
| Yugoslavian | 197 | 0.4% |
| Zimbabwean | 11 | 0.0% | View All 107 Rows |
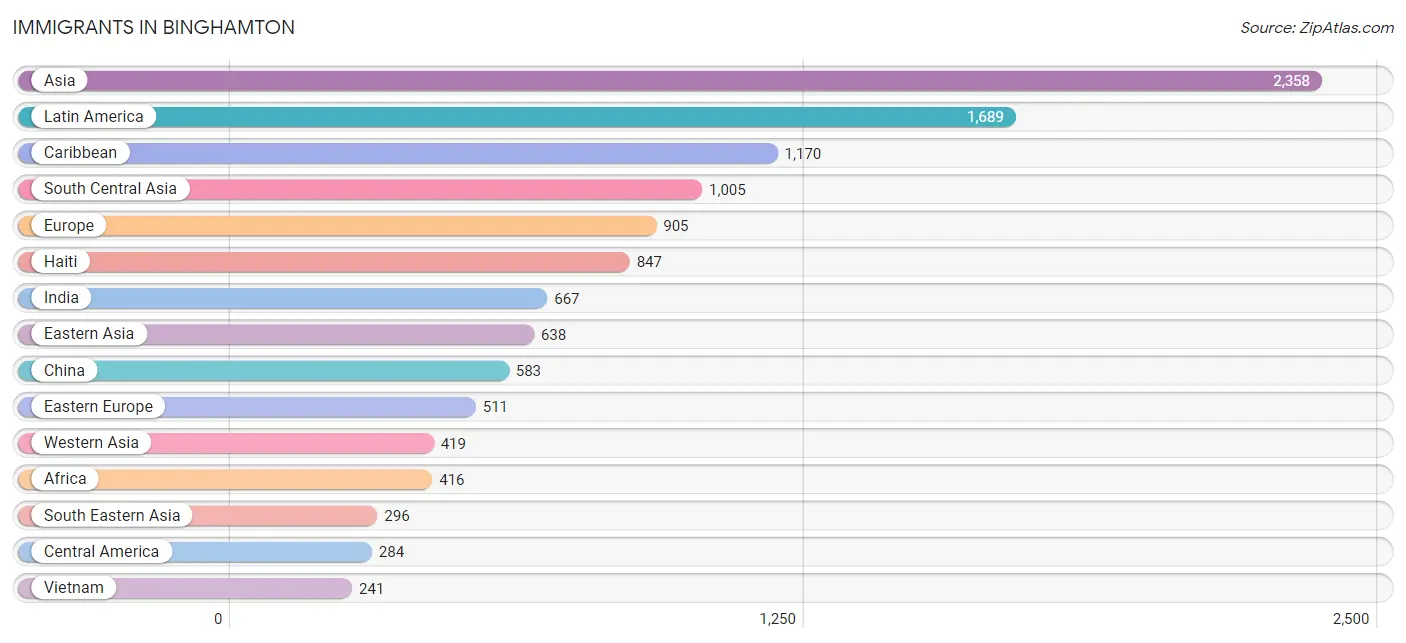
Immigrants in Binghamton
The most numerous immigrant groups reported in Binghamton came from Asia (2,358 | 5.0%), Latin America (1,689 | 3.5%), Caribbean (1,170 | 2.5%), South Central Asia (1,005 | 2.1%), and Europe (905 | 1.9%), together accounting for 15.0% of all Binghamton residents.
| Immigration Origin | # Population | % Population |
| Afghanistan | 28 | 0.1% |
| Africa | 416 | 0.9% |
| Asia | 2,358 | 5.0% |
| Bangladesh | 100 | 0.2% |
| Barbados | 5 | 0.0% |
| Belarus | 24 | 0.1% |
| Bosnia and Herzegovina | 158 | 0.3% |
| Brazil | 7 | 0.0% |
| Canada | 185 | 0.4% |
| Caribbean | 1,170 | 2.5% |
| Central America | 284 | 0.6% |
| Chile | 19 | 0.0% |
| China | 583 | 1.2% |
| Colombia | 111 | 0.2% |
| Costa Rica | 14 | 0.0% |
| Croatia | 13 | 0.0% |
| Cuba | 14 | 0.0% |
| Czechoslovakia | 9 | 0.0% |
| Denmark | 14 | 0.0% |
| Dominican Republic | 137 | 0.3% |
| Eastern Africa | 105 | 0.2% |
| Eastern Asia | 638 | 1.3% |
| Eastern Europe | 511 | 1.1% |
| Ecuador | 1 | 0.0% |
| Egypt | 20 | 0.0% |
| El Salvador | 13 | 0.0% |
| England | 76 | 0.2% |
| Europe | 905 | 1.9% |
| Germany | 26 | 0.1% |
| Ghana | 11 | 0.0% |
| Greece | 135 | 0.3% |
| Guyana | 92 | 0.2% |
| Haiti | 847 | 1.8% |
| Honduras | 50 | 0.1% |
| Hong Kong | 14 | 0.0% |
| Hungary | 2 | 0.0% |
| India | 667 | 1.4% |
| Iraq | 178 | 0.4% |
| Ireland | 4 | 0.0% |
| Israel | 6 | 0.0% |
| Italy | 101 | 0.2% |
| Jamaica | 152 | 0.3% |
| Japan | 29 | 0.1% |
| Jordan | 40 | 0.1% |
| Kenya | 43 | 0.1% |
| Korea | 26 | 0.1% |
| Laos | 21 | 0.0% |
| Latin America | 1,689 | 3.5% |
| Mexico | 207 | 0.4% |
| Netherlands | 7 | 0.0% |
| Northern Africa | 113 | 0.2% |
| Northern Europe | 106 | 0.2% |
| Pakistan | 90 | 0.2% |
| Peru | 5 | 0.0% |
| Philippines | 20 | 0.0% |
| Romania | 38 | 0.1% |
| Russia | 83 | 0.2% |
| Saudi Arabia | 25 | 0.1% |
| Scotland | 12 | 0.0% |
| South Africa | 117 | 0.3% |
| South America | 235 | 0.5% |
| South Central Asia | 1,005 | 2.1% |
| South Eastern Asia | 296 | 0.6% |
| Southern Europe | 236 | 0.5% |
| Sri Lanka | 120 | 0.3% |
| Sudan | 93 | 0.2% |
| Switzerland | 19 | 0.0% |
| Taiwan | 19 | 0.0% |
| Trinidad and Tobago | 7 | 0.0% |
| Turkey | 117 | 0.3% |
| Ukraine | 150 | 0.3% |
| Vietnam | 241 | 0.5% |
| Western Africa | 70 | 0.2% |
| Western Asia | 419 | 0.9% |
| Western Europe | 52 | 0.1% |
| Yemen | 53 | 0.1% | View All 76 Rows |
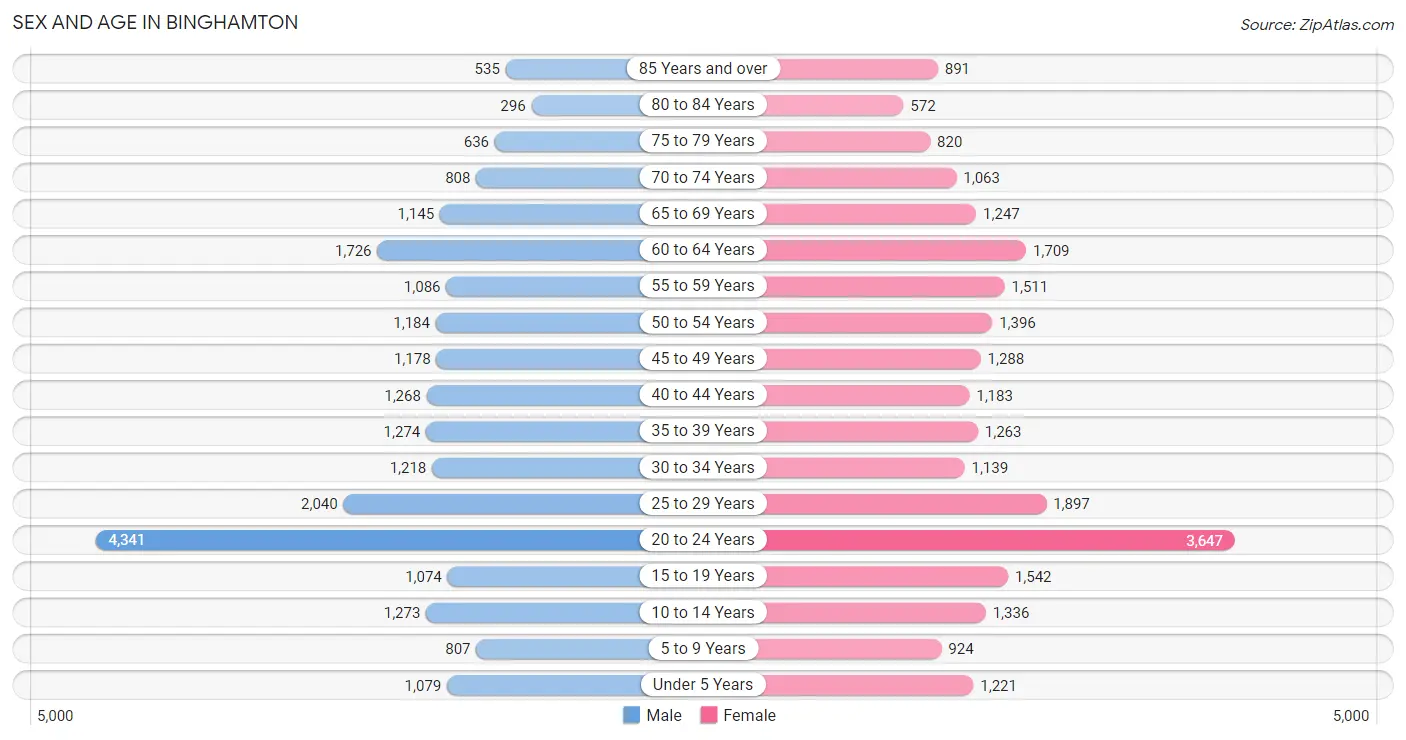
Sex and Age in Binghamton
Sex and Age in Binghamton
The most populous age groups in Binghamton are 20 to 24 Years (4,341 | 18.9%) for men and 20 to 24 Years (3,647 | 14.8%) for women.
| Age Bracket | Male | Female |
| Under 5 Years | 1,079 (4.7%) | 1,221 (5.0%) |
| 5 to 9 Years | 807 (3.5%) | 924 (3.7%) |
| 10 to 14 Years | 1,273 (5.5%) | 1,336 (5.4%) |
| 15 to 19 Years | 1,074 (4.7%) | 1,542 (6.3%) |
| 20 to 24 Years | 4,341 (18.9%) | 3,647 (14.8%) |
| 25 to 29 Years | 2,040 (8.9%) | 1,897 (7.7%) |
| 30 to 34 Years | 1,218 (5.3%) | 1,139 (4.6%) |
| 35 to 39 Years | 1,274 (5.6%) | 1,263 (5.1%) |
| 40 to 44 Years | 1,268 (5.5%) | 1,183 (4.8%) |
| 45 to 49 Years | 1,178 (5.1%) | 1,288 (5.2%) |
| 50 to 54 Years | 1,184 (5.1%) | 1,396 (5.7%) |
| 55 to 59 Years | 1,086 (4.7%) | 1,511 (6.1%) |
| 60 to 64 Years | 1,726 (7.5%) | 1,709 (6.9%) |
| 65 to 69 Years | 1,145 (5.0%) | 1,247 (5.1%) |
| 70 to 74 Years | 808 (3.5%) | 1,063 (4.3%) |
| 75 to 79 Years | 636 (2.8%) | 820 (3.3%) |
| 80 to 84 Years | 296 (1.3%) | 572 (2.3%) |
| 85 Years and over | 535 (2.3%) | 891 (3.6%) |
| Total | 22,968 (100.0%) | 24,649 (100.0%) |
Families and Households in Binghamton
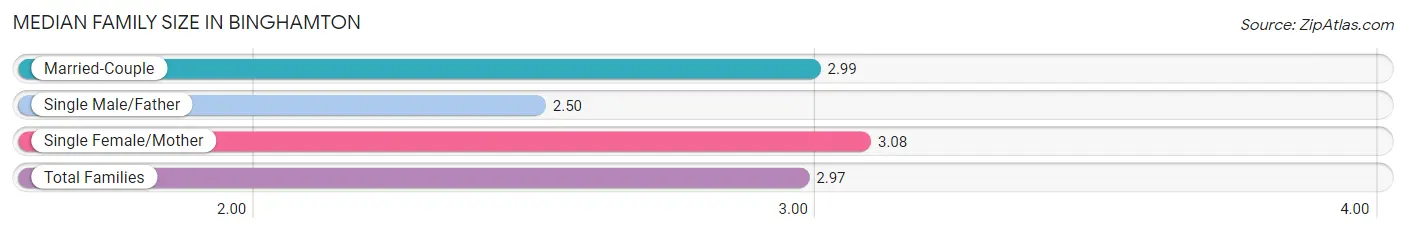
Median Family Size in Binghamton
The median family size in Binghamton is 2.97 persons per family, with single female/mother families (2,969 | 32.5%) accounting for the largest median family size of 3.08 persons per family. On the other hand, single male/father families (849 | 9.3%) represent the smallest median family size with 2.50 persons per family.
| Family Type | # Families | Family Size |
| Married-Couple | 5,322 (58.2%) | 2.99 |
| Single Male/Father | 849 (9.3%) | 2.50 |
| Single Female/Mother | 2,969 (32.5%) | 3.08 |
| Total Families | 9,140 (100.0%) | 2.97 |
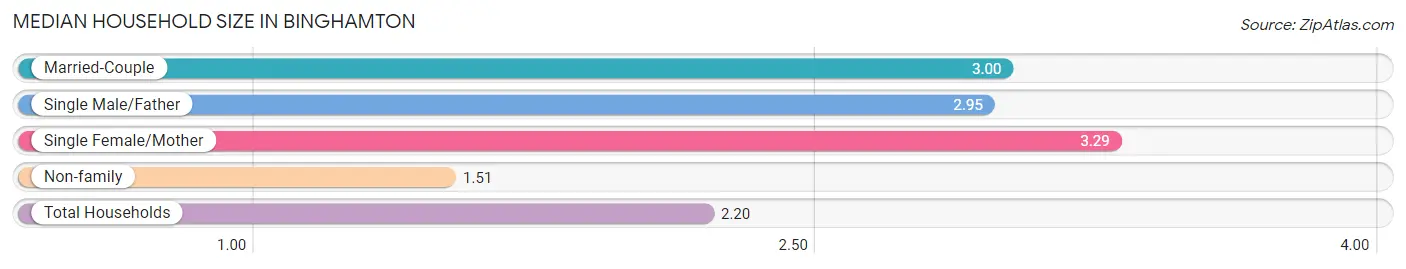
Median Household Size in Binghamton
The median household size in Binghamton is 2.20 persons per household, with single female/mother households (2,969 | 14.2%) accounting for the largest median household size of 3.29 persons per household. non-family households (11,795 | 56.3%) represent the smallest median household size with 1.51 persons per household.
| Household Type | # Households | Household Size |
| Married-Couple | 5,322 (25.4%) | 3.00 |
| Single Male/Father | 849 (4.1%) | 2.95 |
| Single Female/Mother | 2,969 (14.2%) | 3.29 |
| Non-family | 11,795 (56.3%) | 1.51 |
| Total Households | 20,935 (100.0%) | 2.20 |
Household Size by Marriage Status in Binghamton
Out of a total of 20,935 households in Binghamton, 9,140 (43.7%) are family households, while 11,795 (56.3%) are nonfamily households. The most numerous type of family households are 2-person households, comprising 4,384, and the most common type of nonfamily households are 1-person households, comprising 8,532.
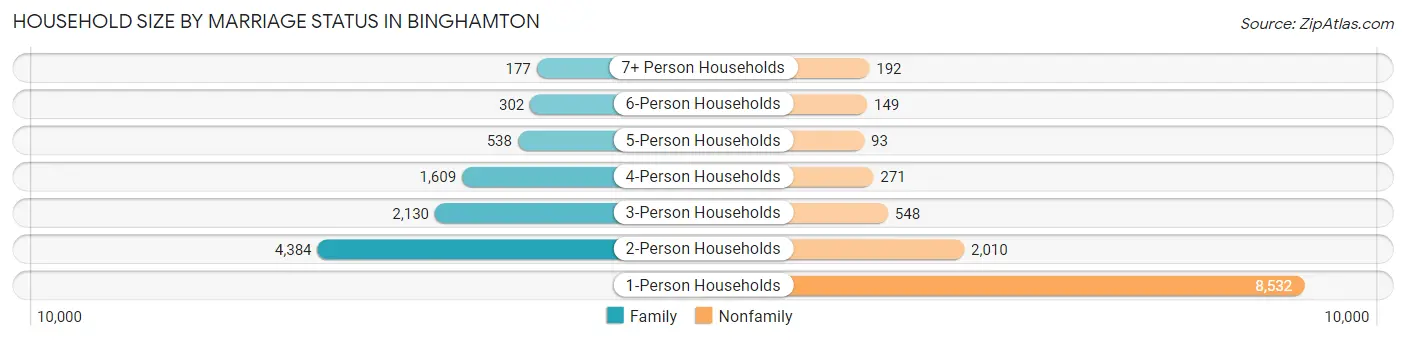
| Household Size | Family Households | Nonfamily Households |
| 1-Person Households | - | 8,532 (40.7%) |
| 2-Person Households | 4,384 (20.9%) | 2,010 (9.6%) |
| 3-Person Households | 2,130 (10.2%) | 548 (2.6%) |
| 4-Person Households | 1,609 (7.7%) | 271 (1.3%) |
| 5-Person Households | 538 (2.6%) | 93 (0.4%) |
| 6-Person Households | 302 (1.4%) | 149 (0.7%) |
| 7+ Person Households | 177 (0.9%) | 192 (0.9%) |
| Total | 9,140 (43.7%) | 11,795 (56.3%) |
Female Fertility in Binghamton
Fertility by Age in Binghamton
Average fertility rate in Binghamton is 54.0 births per 1,000 women. Women in the age bracket of 20 to 34 years have the highest fertility rate with 68.0 births per 1,000 women. Women in the age bracket of 20 to 34 years acount for 68.5% of all women with births.
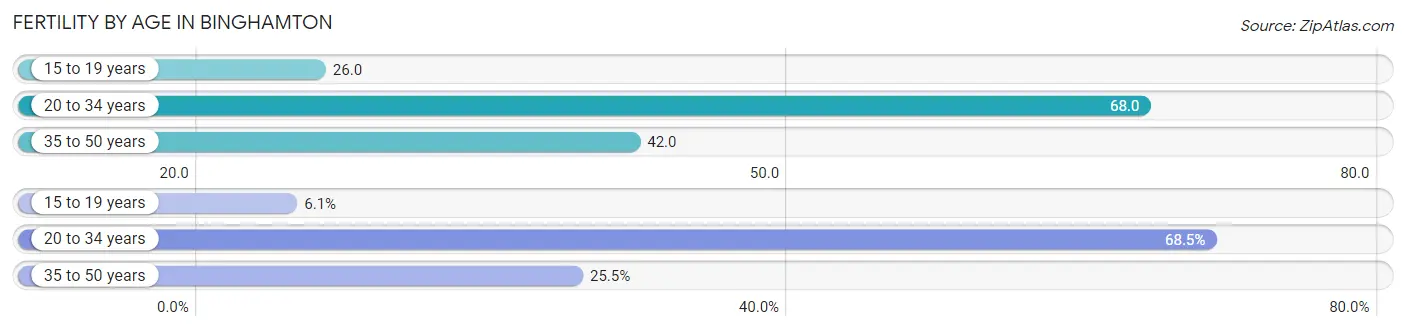
| Age Bracket | Women with Births | Births / 1,000 Women |
| 15 to 19 years | 40 (6.1%) | 26.0 |
| 20 to 34 years | 452 (68.5%) | 68.0 |
| 35 to 50 years | 168 (25.5%) | 42.0 |
| Total | 660 (100.0%) | 54.0 |
Fertility by Age by Marriage Status in Binghamton
33.3% of women with births (660) in Binghamton are married. The highest percentage of unmarried women with births falls into 15 to 19 years age bracket with 100.0% of them unmarried at the time of birth, while the lowest percentage of unmarried women with births belong to 35 to 50 years age bracket with 18.4% of them unmarried.
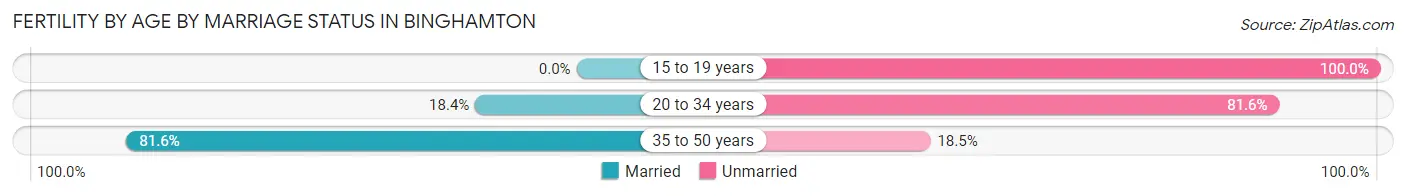
| Age Bracket | Married | Unmarried |
| 15 to 19 years | 0 (0.0%) | 40 (100.0%) |
| 20 to 34 years | 83 (18.4%) | 369 (81.6%) |
| 35 to 50 years | 137 (81.6%) | 31 (18.4%) |
| Total | 220 (33.3%) | 440 (66.7%) |
Fertility by Education in Binghamton
Average fertility rate in Binghamton is 54.0 births per 1,000 women. Women with the education attainment of college or associate's degree have the highest fertility rate of 75.0 births per 1,000 women, while women with the education attainment of bachelor's degree have the lowest fertility at 4.0 births per 1,000 women. Women with the education attainment of college or associate's degree represent 47.7% of all women with births.
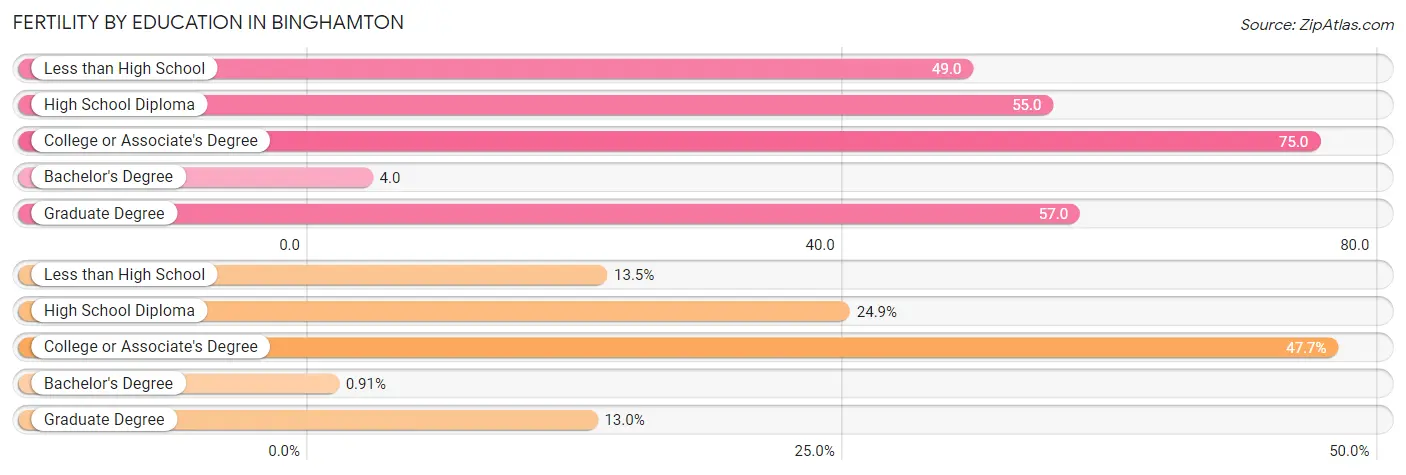
| Educational Attainment | Women with Births | Births / 1,000 Women |
| Less than High School | 89 (13.5%) | 49.0 |
| High School Diploma | 164 (24.8%) | 55.0 |
| College or Associate's Degree | 315 (47.7%) | 75.0 |
| Bachelor's Degree | 6 (0.9%) | 4.0 |
| Graduate Degree | 86 (13.0%) | 57.0 |
| Total | 660 (100.0%) | 54.0 |
Fertility by Education by Marriage Status in Binghamton
66.7% of women with births in Binghamton are unmarried. Women with the educational attainment of graduate degree are most likely to be married with 81.4% of them married at childbirth, while women with the educational attainment of bachelor's degree are least likely to be married with 100.0% of them unmarried at childbirth.
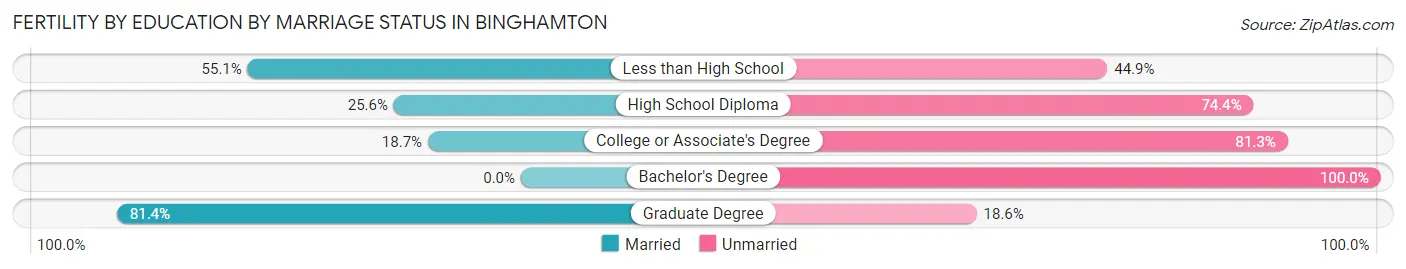
| Educational Attainment | Married | Unmarried |
| Less than High School | 49 (55.1%) | 40 (44.9%) |
| High School Diploma | 42 (25.6%) | 122 (74.4%) |
| College or Associate's Degree | 59 (18.7%) | 256 (81.3%) |
| Bachelor's Degree | 0 (0.0%) | 6 (100.0%) |
| Graduate Degree | 70 (81.4%) | 16 (18.6%) |
| Total | 220 (33.3%) | 440 (66.7%) |
Employment Characteristics in Binghamton
Employment by Class of Employer in Binghamton
Among the 19,912 employed individuals in Binghamton, private company employees (11,502 | 57.8%), not-for-profit organizations (2,827 | 14.2%), and state government employees (2,243 | 11.3%) make up the most common classes of employment.
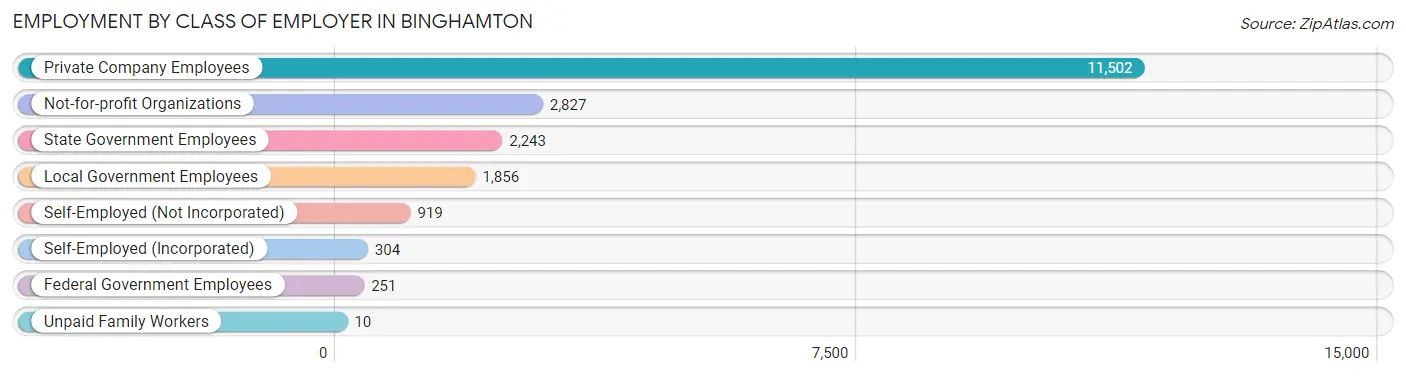
| Employer Class | # Employees | % Employees |
| Private Company Employees | 11,502 | 57.8% |
| Self-Employed (Incorporated) | 304 | 1.5% |
| Self-Employed (Not Incorporated) | 919 | 4.6% |
| Not-for-profit Organizations | 2,827 | 14.2% |
| Local Government Employees | 1,856 | 9.3% |
| State Government Employees | 2,243 | 11.3% |
| Federal Government Employees | 251 | 1.3% |
| Unpaid Family Workers | 10 | 0.1% |
| Total | 19,912 | 100.0% |
Employment Status by Age in Binghamton
According to the labor force statistics for Binghamton, out of the total population over 16 years of age (40,649), 56.8% or 23,089 individuals are in the labor force, with 10.1% or 2,332 of them unemployed. The age group with the highest labor force participation rate is 30 to 34 years, with 89.1% or 2,100 individuals in the labor force. Within the labor force, the 16 to 19 years age range has the highest percentage of unemployed individuals, with 25.6% or 236 of them being unemployed.
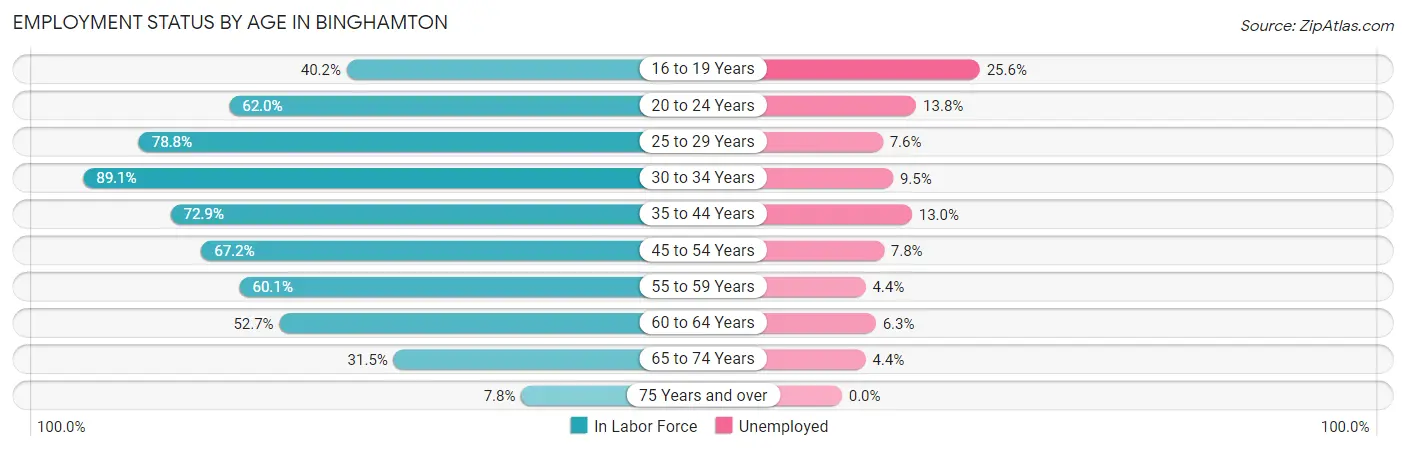
| Age Bracket | In Labor Force | Unemployed |
| 16 to 19 Years | 920 (40.2%) | 236 (25.6%) |
| 20 to 24 Years | 4,953 (62.0%) | 684 (13.8%) |
| 25 to 29 Years | 3,102 (78.8%) | 236 (7.6%) |
| 30 to 34 Years | 2,100 (89.1%) | 200 (9.5%) |
| 35 to 44 Years | 3,636 (72.9%) | 473 (13.0%) |
| 45 to 54 Years | 3,391 (67.2%) | 264 (7.8%) |
| 55 to 59 Years | 1,561 (60.1%) | 69 (4.4%) |
| 60 to 64 Years | 1,810 (52.7%) | 114 (6.3%) |
| 65 to 74 Years | 1,343 (31.5%) | 59 (4.4%) |
| 75 Years and over | 292 (7.8%) | 0 (0.0%) |
| Total | 23,089 (56.8%) | 2,332 (10.1%) |
Employment Status by Educational Attainment in Binghamton
According to labor force statistics for Binghamton, 69.8% of individuals (15,607) out of the total population between 25 and 64 years of age (22,360) are in the labor force, with 8.7% or 1,358 of them being unemployed. The group with the highest labor force participation rate are those with the educational attainment of bachelor's degree or higher, with 87.8% or 6,344 individuals in the labor force. Within the labor force, individuals with high school diploma education have the highest percentage of unemployment, with 17.3% or 644 of them being unemployed.
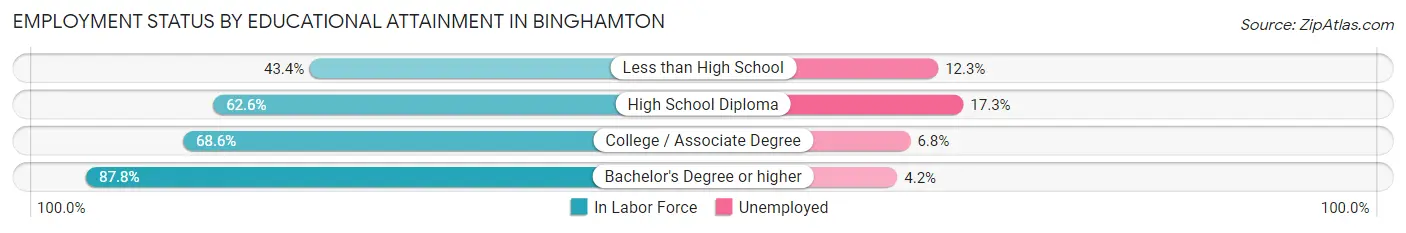
| Educational Attainment | In Labor Force | Unemployed |
| Less than High School | 1,315 (43.4%) | 373 (12.3%) |
| High School Diploma | 3,720 (62.6%) | 1,028 (17.3%) |
| College / Associate Degree | 4,227 (68.6%) | 419 (6.8%) |
| Bachelor's Degree or higher | 6,344 (87.8%) | 303 (4.2%) |
| Total | 15,607 (69.8%) | 1,945 (8.7%) |
Employment Occupations by Sex in Binghamton
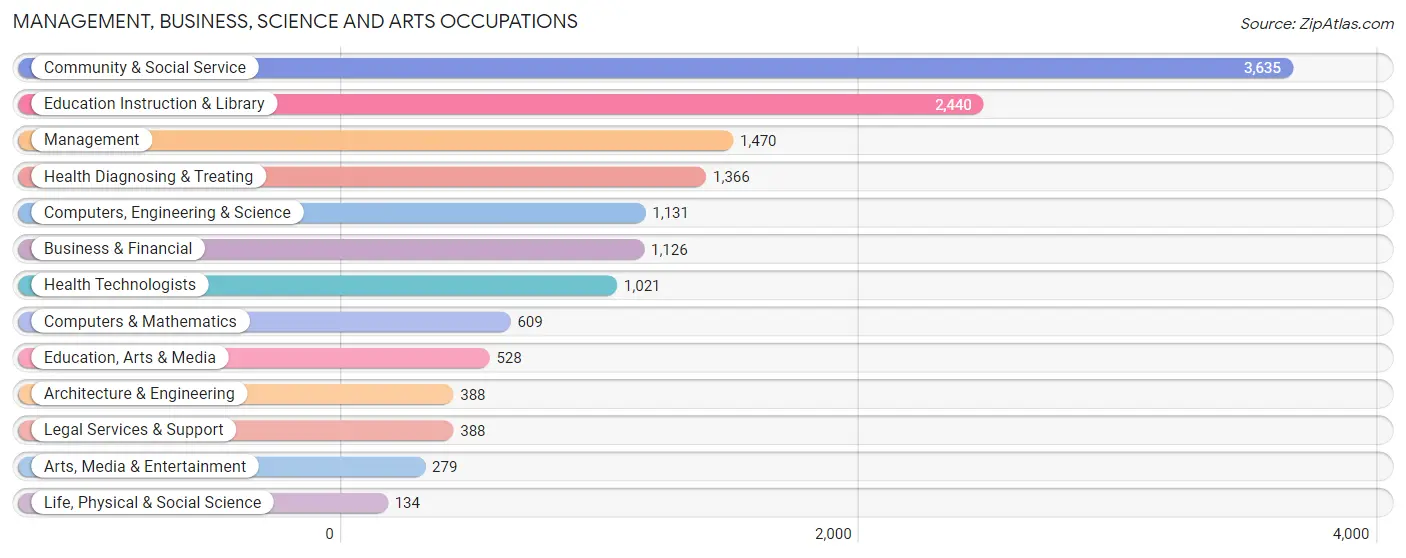
Management, Business, Science and Arts Occupations
The most common Management, Business, Science and Arts occupations in Binghamton are Community & Social Service (3,635 | 17.5%), Education Instruction & Library (2,440 | 11.8%), Management (1,470 | 7.1%), Health Diagnosing & Treating (1,366 | 6.6%), and Computers, Engineering & Science (1,131 | 5.4%).
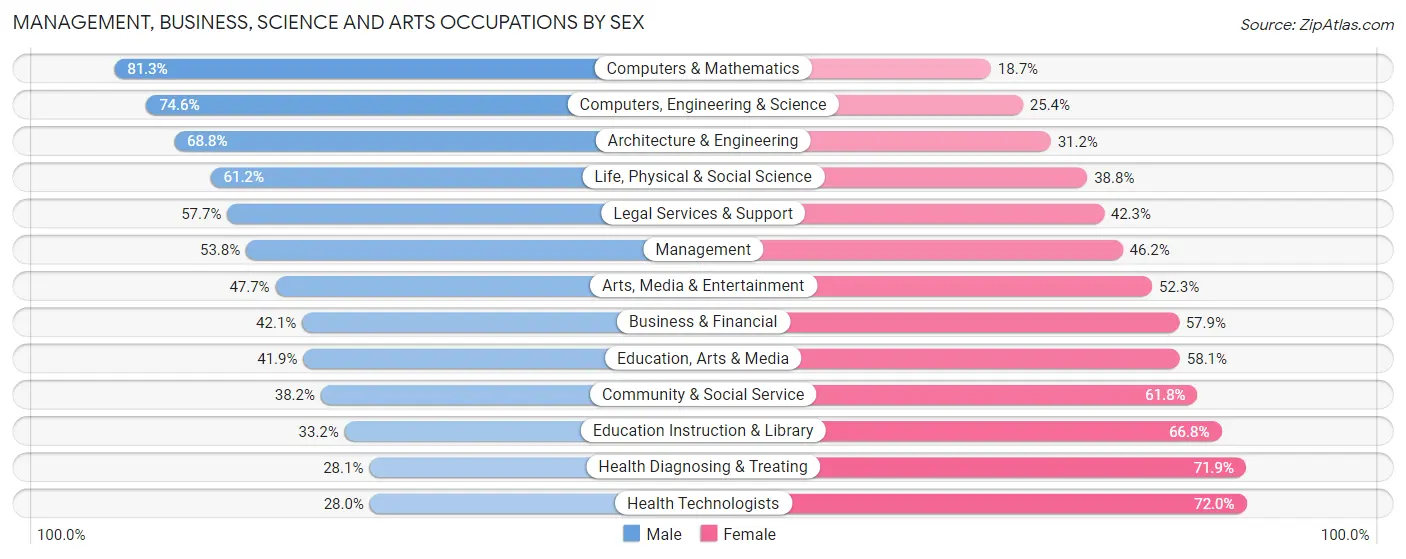
Management, Business, Science and Arts Occupations by Sex
Within the Management, Business, Science and Arts occupations in Binghamton, the most male-oriented occupations are Computers & Mathematics (81.3%), Computers, Engineering & Science (74.6%), and Architecture & Engineering (68.8%), while the most female-oriented occupations are Health Technologists (72.0%), Health Diagnosing & Treating (71.9%), and Education Instruction & Library (66.8%).
| Occupation | Male | Female |
| Management | 791 (53.8%) | 679 (46.2%) |
| Business & Financial | 474 (42.1%) | 652 (57.9%) |
| Computers, Engineering & Science | 844 (74.6%) | 287 (25.4%) |
| Computers & Mathematics | 495 (81.3%) | 114 (18.7%) |
| Architecture & Engineering | 267 (68.8%) | 121 (31.2%) |
| Life, Physical & Social Science | 82 (61.2%) | 52 (38.8%) |
| Community & Social Service | 1,389 (38.2%) | 2,246 (61.8%) |
| Education, Arts & Media | 221 (41.9%) | 307 (58.1%) |
| Legal Services & Support | 224 (57.7%) | 164 (42.3%) |
| Education Instruction & Library | 811 (33.2%) | 1,629 (66.8%) |
| Arts, Media & Entertainment | 133 (47.7%) | 146 (52.3%) |
| Health Diagnosing & Treating | 384 (28.1%) | 982 (71.9%) |
| Health Technologists | 286 (28.0%) | 735 (72.0%) |
| Total (Category) | 3,882 (44.5%) | 4,846 (55.5%) |
| Total (Overall) | 10,121 (48.8%) | 10,632 (51.2%) |
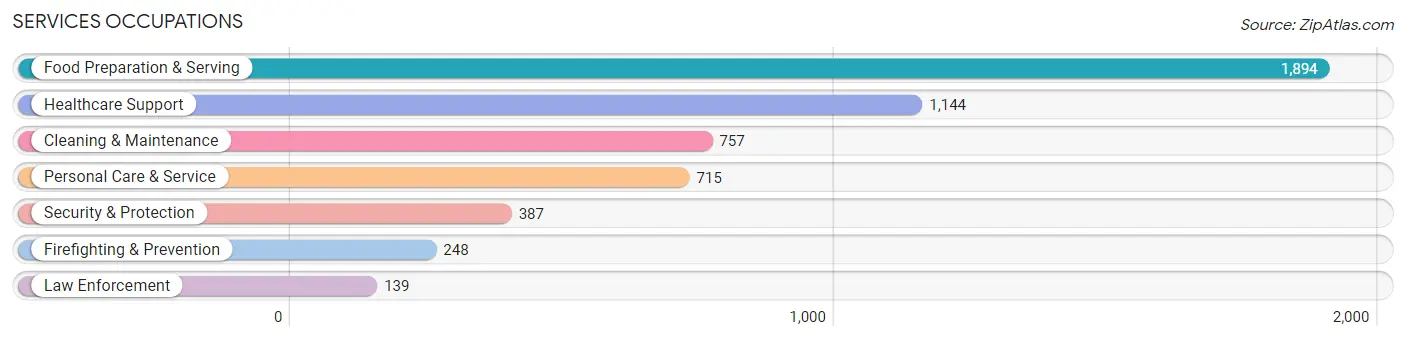
Services Occupations
The most common Services occupations in Binghamton are Food Preparation & Serving (1,894 | 9.1%), Healthcare Support (1,144 | 5.5%), Cleaning & Maintenance (757 | 3.6%), Personal Care & Service (715 | 3.5%), and Security & Protection (387 | 1.9%).
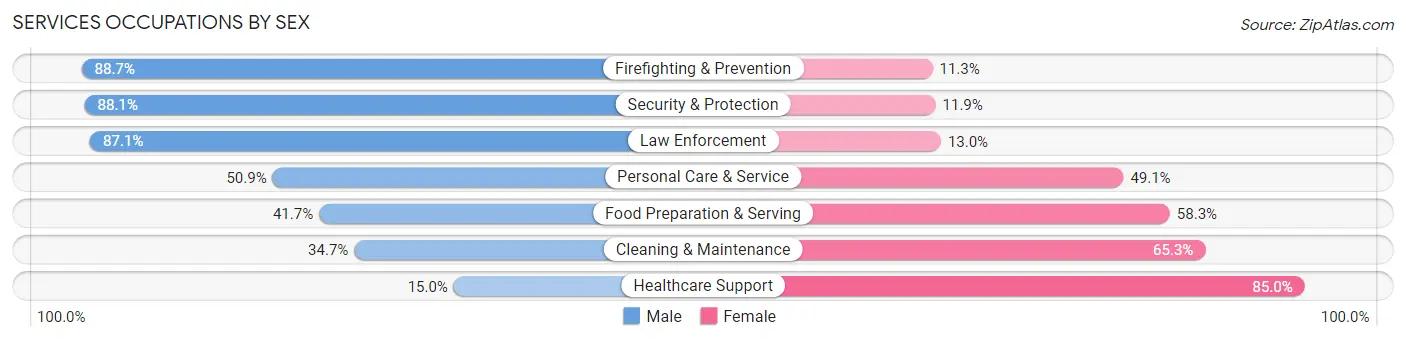
Services Occupations by Sex
Within the Services occupations in Binghamton, the most male-oriented occupations are Firefighting & Prevention (88.7%), Security & Protection (88.1%), and Law Enforcement (87.1%), while the most female-oriented occupations are Healthcare Support (85.0%), Cleaning & Maintenance (65.3%), and Food Preparation & Serving (58.3%).
| Occupation | Male | Female |
| Healthcare Support | 172 (15.0%) | 972 (85.0%) |
| Security & Protection | 341 (88.1%) | 46 (11.9%) |
| Firefighting & Prevention | 220 (88.7%) | 28 (11.3%) |
| Law Enforcement | 121 (87.1%) | 18 (13.0%) |
| Food Preparation & Serving | 790 (41.7%) | 1,104 (58.3%) |
| Cleaning & Maintenance | 263 (34.7%) | 494 (65.3%) |
| Personal Care & Service | 364 (50.9%) | 351 (49.1%) |
| Total (Category) | 1,930 (39.4%) | 2,967 (60.6%) |
| Total (Overall) | 10,121 (48.8%) | 10,632 (51.2%) |
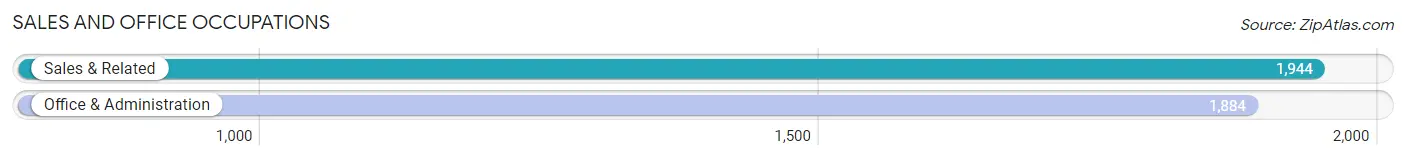
Sales and Office Occupations
The most common Sales and Office occupations in Binghamton are Sales & Related (1,944 | 9.4%), and Office & Administration (1,884 | 9.1%).
Sales and Office Occupations by Sex
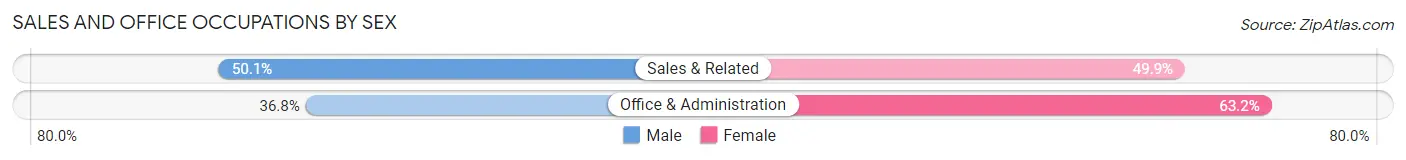
| Occupation | Male | Female |
| Sales & Related | 974 (50.1%) | 970 (49.9%) |
| Office & Administration | 693 (36.8%) | 1,191 (63.2%) |
| Total (Category) | 1,667 (43.5%) | 2,161 (56.5%) |
| Total (Overall) | 10,121 (48.8%) | 10,632 (51.2%) |
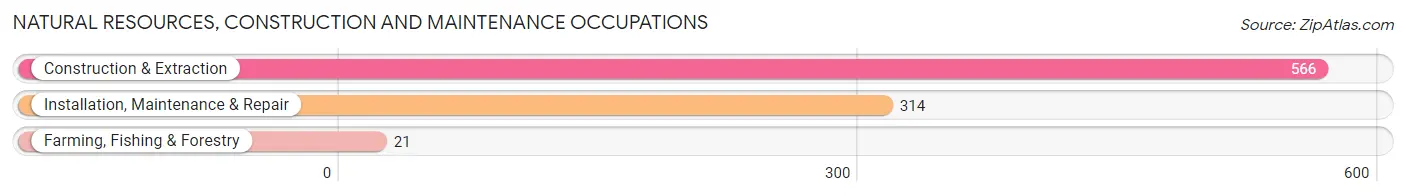
Natural Resources, Construction and Maintenance Occupations
The most common Natural Resources, Construction and Maintenance occupations in Binghamton are Construction & Extraction (566 | 2.7%), Installation, Maintenance & Repair (314 | 1.5%), and Farming, Fishing & Forestry (21 | 0.1%).
Natural Resources, Construction and Maintenance Occupations by Sex
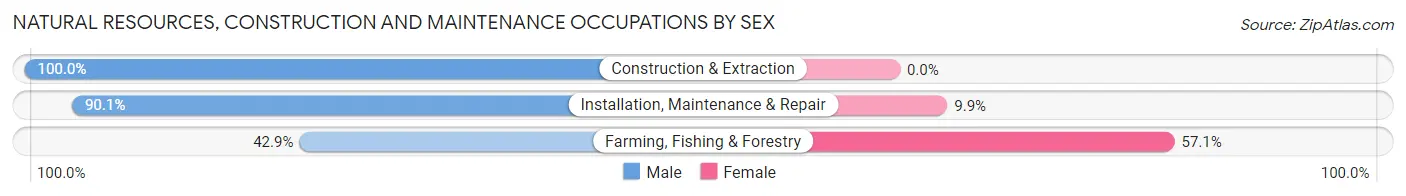
| Occupation | Male | Female |
| Farming, Fishing & Forestry | 9 (42.9%) | 12 (57.1%) |
| Construction & Extraction | 566 (100.0%) | 0 (0.0%) |
| Installation, Maintenance & Repair | 283 (90.1%) | 31 (9.9%) |
| Total (Category) | 858 (95.2%) | 43 (4.8%) |
| Total (Overall) | 10,121 (48.8%) | 10,632 (51.2%) |
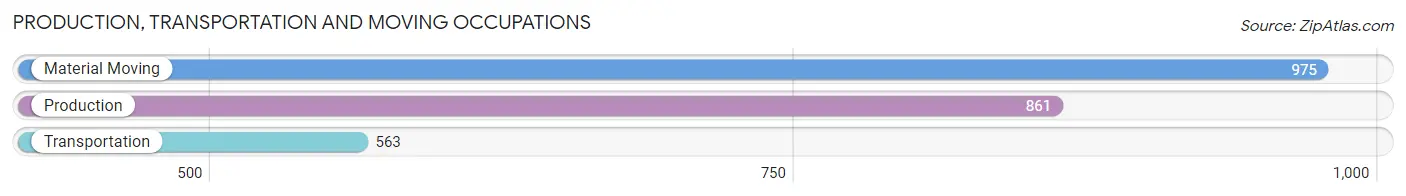
Production, Transportation and Moving Occupations
The most common Production, Transportation and Moving occupations in Binghamton are Material Moving (975 | 4.7%), Production (861 | 4.2%), and Transportation (563 | 2.7%).
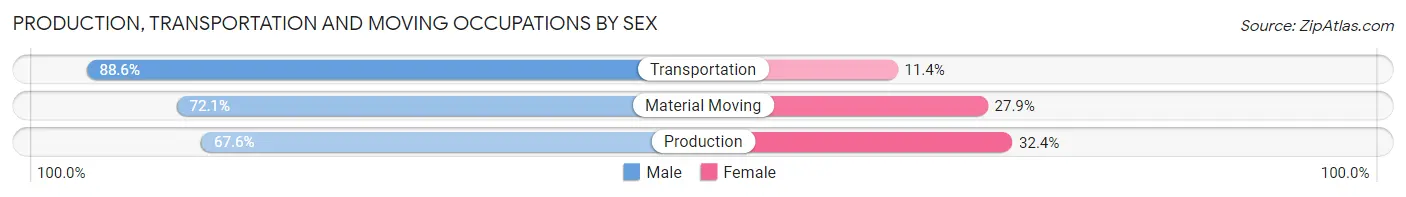
Production, Transportation and Moving Occupations by Sex
| Occupation | Male | Female |
| Production | 582 (67.6%) | 279 (32.4%) |
| Transportation | 499 (88.6%) | 64 (11.4%) |
| Material Moving | 703 (72.1%) | 272 (27.9%) |
| Total (Category) | 1,784 (74.4%) | 615 (25.6%) |
| Total (Overall) | 10,121 (48.8%) | 10,632 (51.2%) |
Employment Industries by Sex in Binghamton
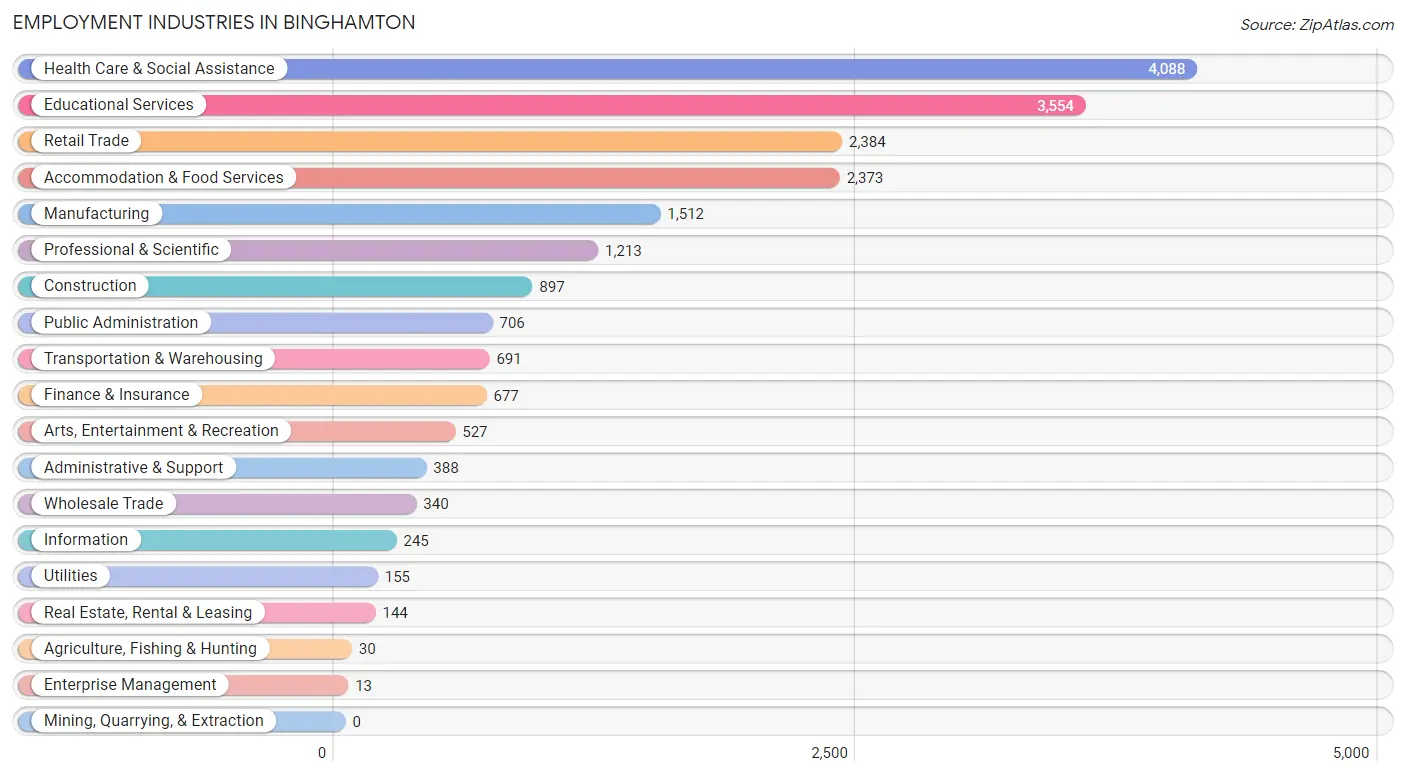
Employment Industries in Binghamton
The major employment industries in Binghamton include Health Care & Social Assistance (4,088 | 19.7%), Educational Services (3,554 | 17.1%), Retail Trade (2,384 | 11.5%), Accommodation & Food Services (2,373 | 11.4%), and Manufacturing (1,512 | 7.3%).
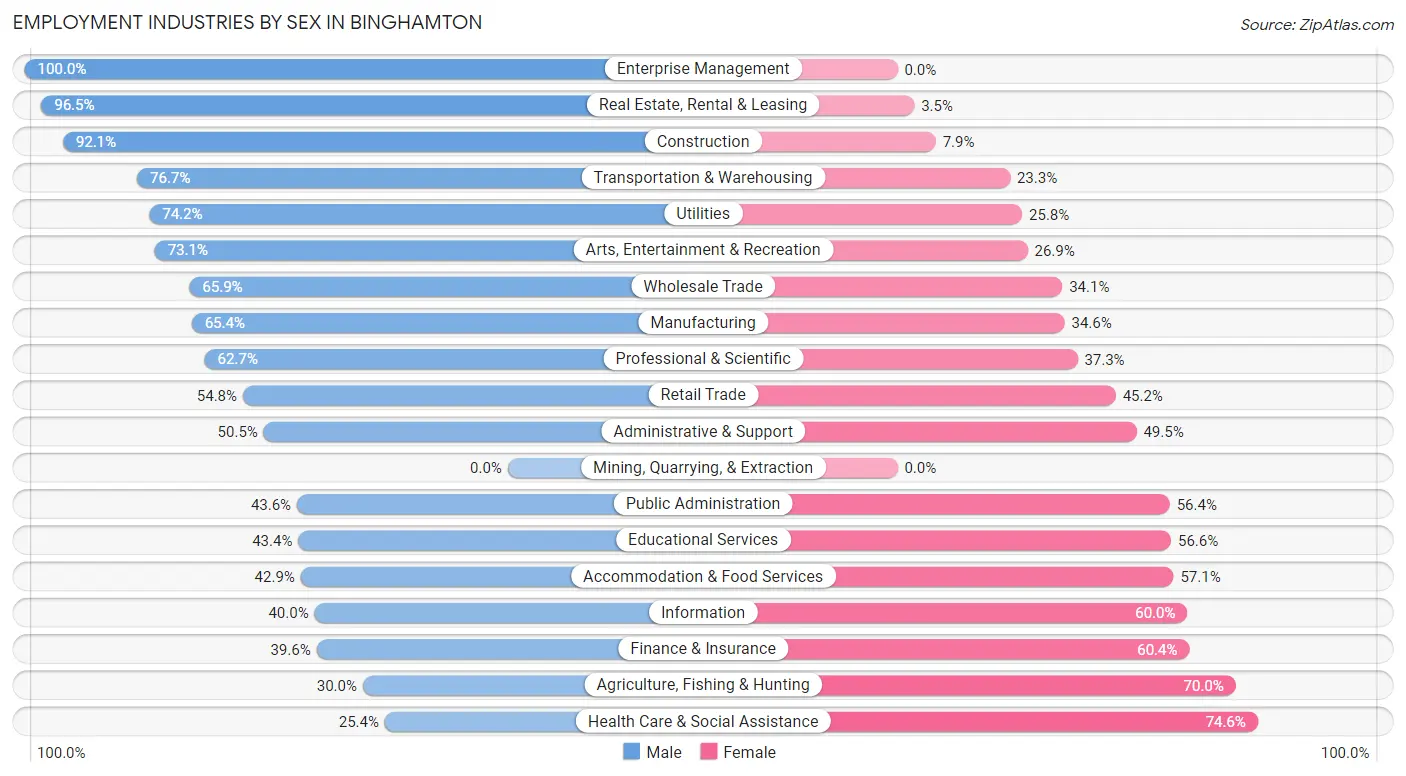
Employment Industries by Sex in Binghamton
The Binghamton industries that see more men than women are Enterprise Management (100.0%), Real Estate, Rental & Leasing (96.5%), and Construction (92.1%), whereas the industries that tend to have a higher number of women are Health Care & Social Assistance (74.6%), Agriculture, Fishing & Hunting (70.0%), and Finance & Insurance (60.4%).
| Industry | Male | Female |
| Agriculture, Fishing & Hunting | 9 (30.0%) | 21 (70.0%) |
| Mining, Quarrying, & Extraction | 0 (0.0%) | 0 (0.0%) |
| Construction | 826 (92.1%) | 71 (7.9%) |
| Manufacturing | 989 (65.4%) | 523 (34.6%) |
| Wholesale Trade | 224 (65.9%) | 116 (34.1%) |
| Retail Trade | 1,307 (54.8%) | 1,077 (45.2%) |
| Transportation & Warehousing | 530 (76.7%) | 161 (23.3%) |
| Utilities | 115 (74.2%) | 40 (25.8%) |
| Information | 98 (40.0%) | 147 (60.0%) |
| Finance & Insurance | 268 (39.6%) | 409 (60.4%) |
| Real Estate, Rental & Leasing | 139 (96.5%) | 5 (3.5%) |
| Professional & Scientific | 761 (62.7%) | 452 (37.3%) |
| Enterprise Management | 13 (100.0%) | 0 (0.0%) |
| Administrative & Support | 196 (50.5%) | 192 (49.5%) |
| Educational Services | 1,541 (43.4%) | 2,013 (56.6%) |
| Health Care & Social Assistance | 1,040 (25.4%) | 3,048 (74.6%) |
| Arts, Entertainment & Recreation | 385 (73.1%) | 142 (26.9%) |
| Accommodation & Food Services | 1,017 (42.9%) | 1,356 (57.1%) |
| Public Administration | 308 (43.6%) | 398 (56.4%) |
| Total | 10,121 (48.8%) | 10,632 (51.2%) |
Education in Binghamton
School Enrollment in Binghamton
The most common levels of schooling among the 13,755 students in Binghamton are college / undergraduate (5,470 | 39.8%), middle school (2,211 | 16.1%), and high school (1,925 | 14.0%).
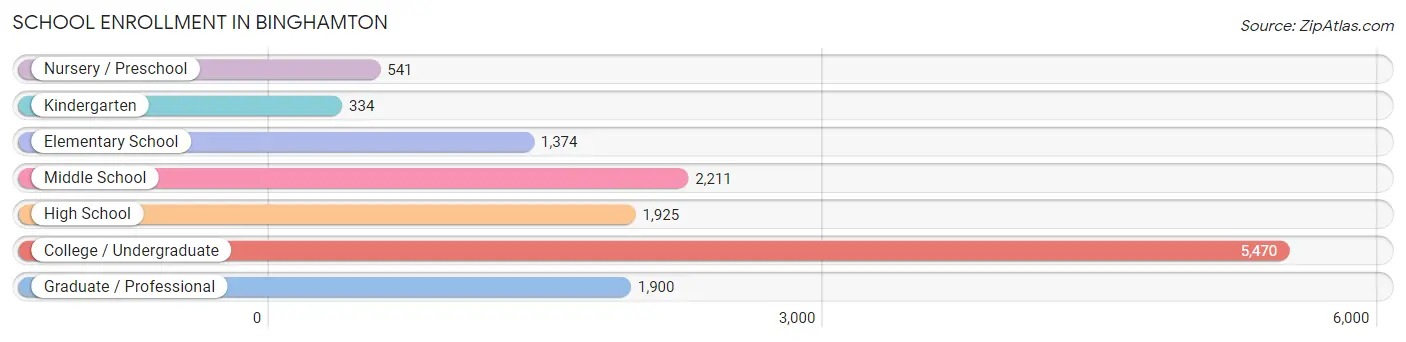
| School Level | # Students | % Students |
| Nursery / Preschool | 541 | 3.9% |
| Kindergarten | 334 | 2.4% |
| Elementary School | 1,374 | 10.0% |
| Middle School | 2,211 | 16.1% |
| High School | 1,925 | 14.0% |
| College / Undergraduate | 5,470 | 39.8% |
| Graduate / Professional | 1,900 | 13.8% |
| Total | 13,755 | 100.0% |
School Enrollment by Age by Funding Source in Binghamton
Out of a total of 13,755 students who are enrolled in schools in Binghamton, 1,623 (11.8%) attend a private institution, while the remaining 12,132 (88.2%) are enrolled in public schools. The age group of 3 to 4 year olds has the highest likelihood of being enrolled in private schools, with 246 (49.1% in the age bracket) enrolled. Conversely, the age group of 25 to 34 year olds has the lowest likelihood of being enrolled in a private school, with 1,080 (93.1% in the age bracket) attending a public institution.
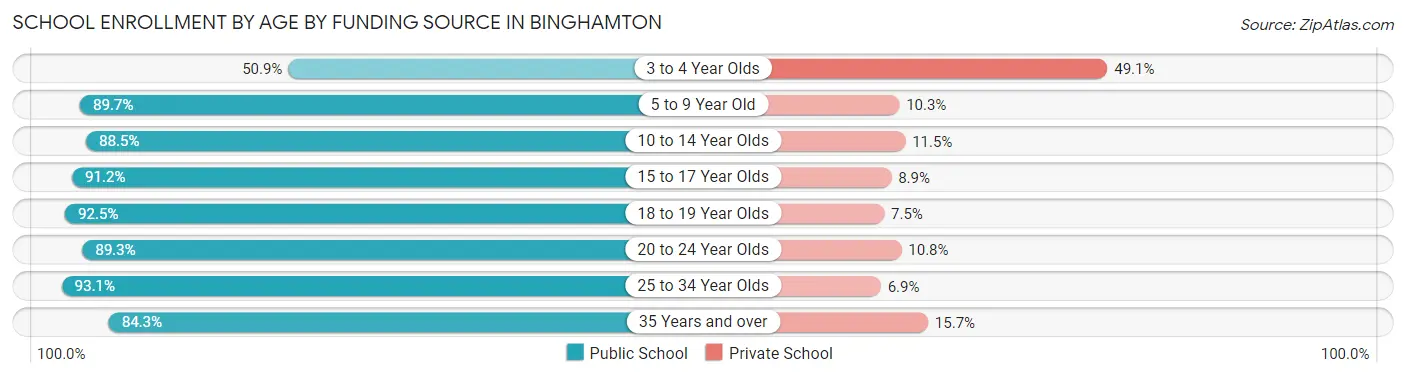
| Age Bracket | Public School | Private School |
| 3 to 4 Year Olds | 255 (50.9%) | 246 (49.1%) |
| 5 to 9 Year Old | 1,483 (89.7%) | 171 (10.3%) |
| 10 to 14 Year Olds | 2,287 (88.5%) | 296 (11.5%) |
| 15 to 17 Year Olds | 1,236 (91.1%) | 120 (8.8%) |
| 18 to 19 Year Olds | 774 (92.5%) | 63 (7.5%) |
| 20 to 24 Year Olds | 4,475 (89.2%) | 539 (10.7%) |
| 25 to 34 Year Olds | 1,080 (93.1%) | 80 (6.9%) |
| 35 Years and over | 548 (84.3%) | 102 (15.7%) |
| Total | 12,132 (88.2%) | 1,623 (11.8%) |
Educational Attainment by Field of Study in Binghamton
Social sciences (1,223 | 12.0%), science & technology (1,042 | 10.2%), education (972 | 9.5%), business (965 | 9.4%), and liberal arts & history (854 | 8.4%) are the most common fields of study among 10,222 individuals in Binghamton who have obtained a bachelor's degree or higher.
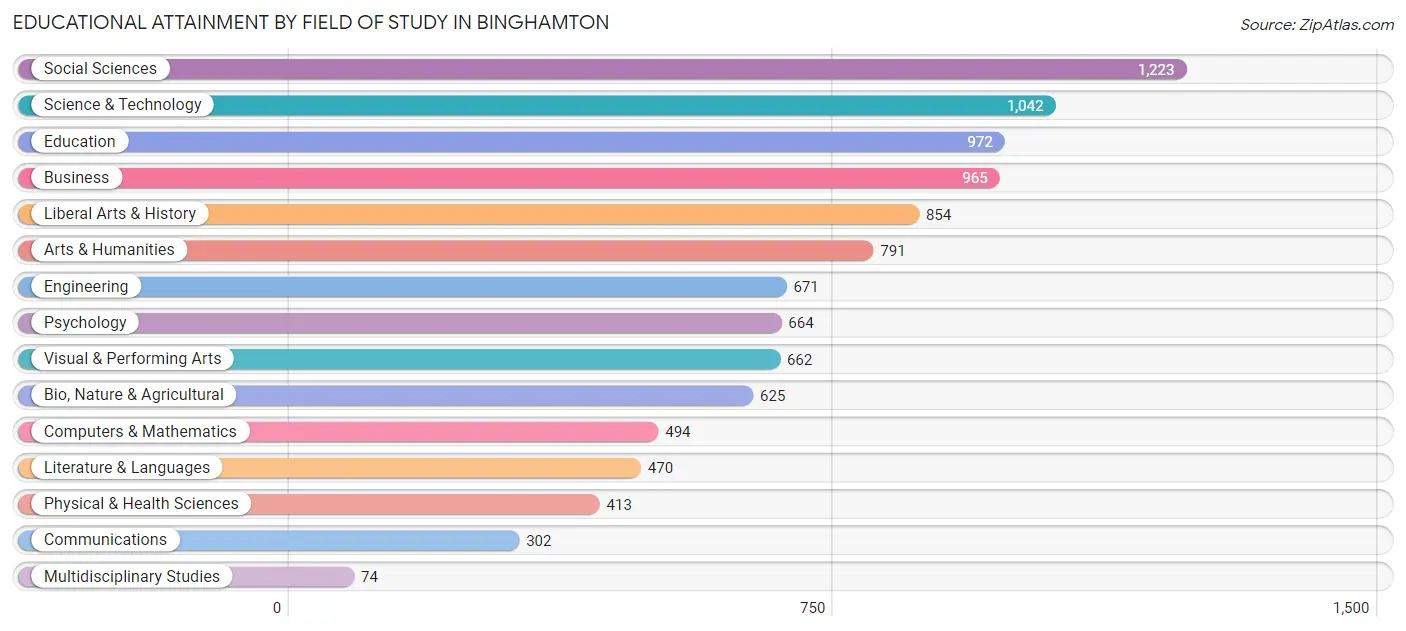
| Field of Study | # Graduates | % Graduates |
| Computers & Mathematics | 494 | 4.8% |
| Bio, Nature & Agricultural | 625 | 6.1% |
| Physical & Health Sciences | 413 | 4.0% |
| Psychology | 664 | 6.5% |
| Social Sciences | 1,223 | 12.0% |
| Engineering | 671 | 6.6% |
| Multidisciplinary Studies | 74 | 0.7% |
| Science & Technology | 1,042 | 10.2% |
| Business | 965 | 9.4% |
| Education | 972 | 9.5% |
| Literature & Languages | 470 | 4.6% |
| Liberal Arts & History | 854 | 8.4% |
| Visual & Performing Arts | 662 | 6.5% |
| Communications | 302 | 2.9% |
| Arts & Humanities | 791 | 7.7% |
| Total | 10,222 | 100.0% |
Transportation & Commute in Binghamton
Vehicle Availability by Sex in Binghamton
The most prevalent vehicle ownership categories in Binghamton are males with 2 vehicles (3,325, accounting for 33.7%) and females with 2 vehicles (3,635, making up 33.3%).
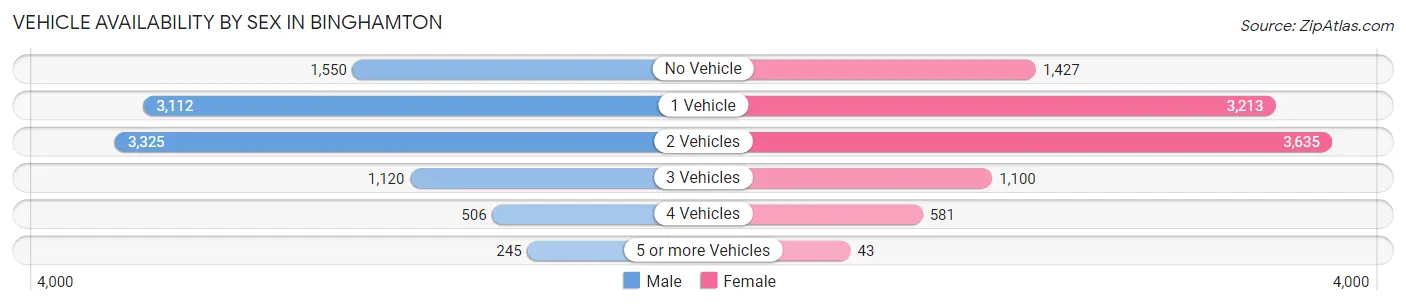
| Vehicles Available | Male | Female |
| No Vehicle | 1,550 (15.7%) | 1,427 (14.3%) |
| 1 Vehicle | 3,112 (31.6%) | 3,213 (32.1%) |
| 2 Vehicles | 3,325 (33.7%) | 3,635 (36.3%) |
| 3 Vehicles | 1,120 (11.4%) | 1,100 (11.0%) |
| 4 Vehicles | 506 (5.1%) | 581 (5.8%) |
| 5 or more Vehicles | 245 (2.5%) | 43 (0.4%) |
| Total | 9,858 (100.0%) | 9,999 (100.0%) |
Commute Time in Binghamton
The most frequently occuring commute durations in Binghamton are 10 to 14 minutes (4,926 commuters, 26.7%), 15 to 19 minutes (3,942 commuters, 21.3%), and 5 to 9 minutes (3,150 commuters, 17.0%).
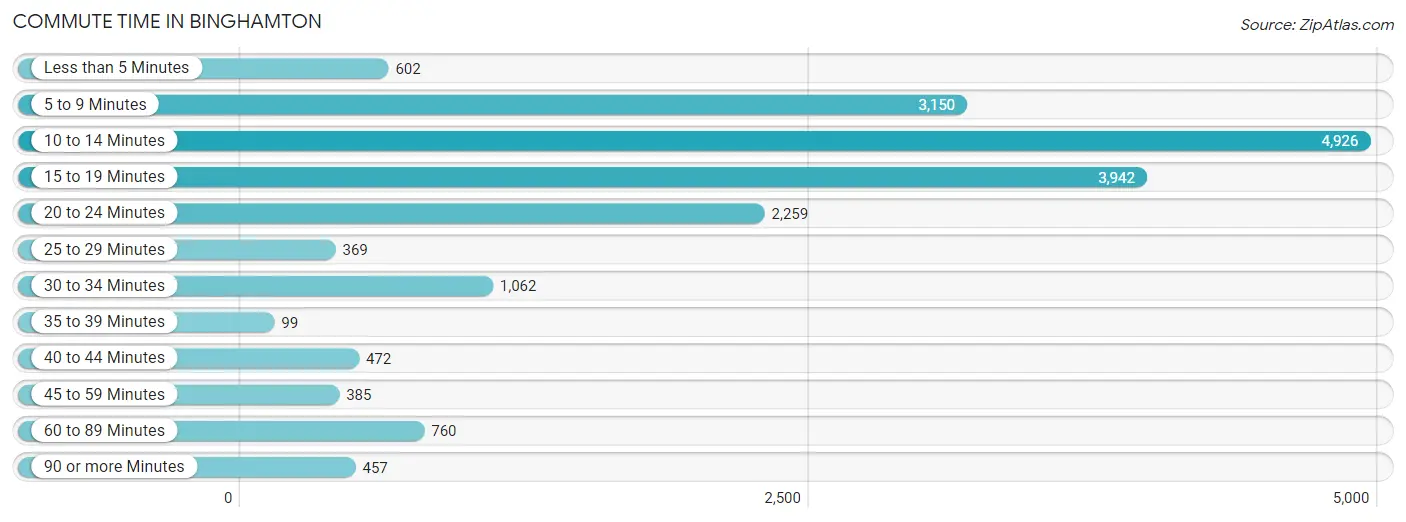
| Commute Time | # Commuters | % Commuters |
| Less than 5 Minutes | 602 | 3.3% |
| 5 to 9 Minutes | 3,150 | 17.0% |
| 10 to 14 Minutes | 4,926 | 26.7% |
| 15 to 19 Minutes | 3,942 | 21.3% |
| 20 to 24 Minutes | 2,259 | 12.2% |
| 25 to 29 Minutes | 369 | 2.0% |
| 30 to 34 Minutes | 1,062 | 5.8% |
| 35 to 39 Minutes | 99 | 0.5% |
| 40 to 44 Minutes | 472 | 2.5% |
| 45 to 59 Minutes | 385 | 2.1% |
| 60 to 89 Minutes | 760 | 4.1% |
| 90 or more Minutes | 457 | 2.5% |
Commute Time by Sex in Binghamton
The most common commute times in Binghamton are 10 to 14 minutes (2,509 commuters, 27.5%) for males and 10 to 14 minutes (2,417 commuters, 25.9%) for females.
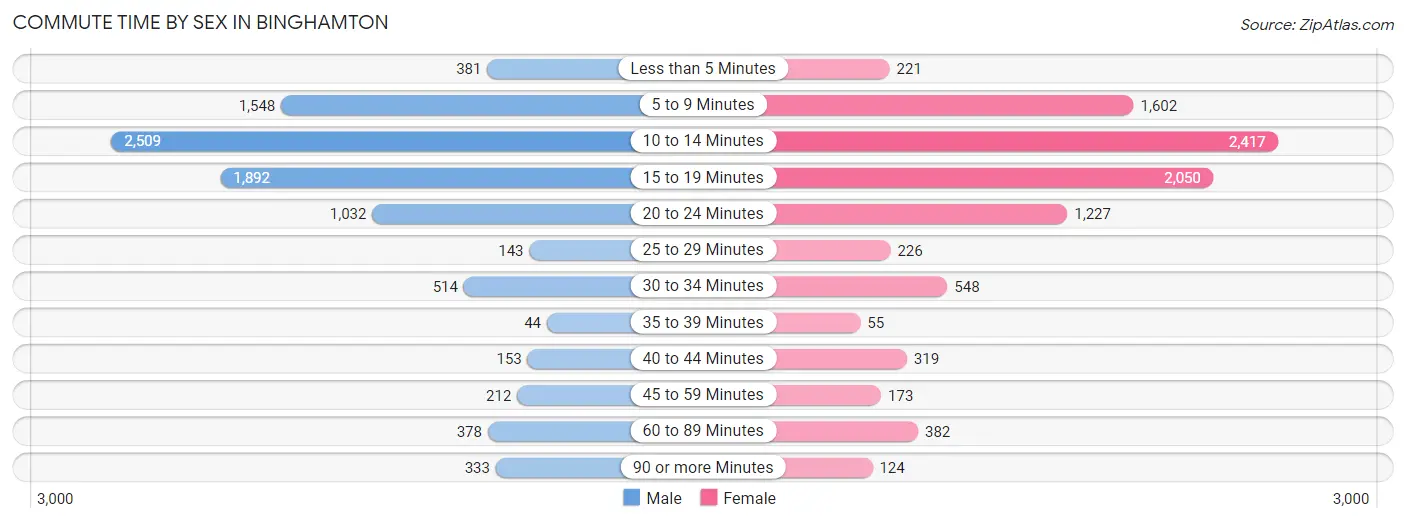
| Commute Time | Male | Female |
| Less than 5 Minutes | 381 (4.2%) | 221 (2.4%) |
| 5 to 9 Minutes | 1,548 (16.9%) | 1,602 (17.1%) |
| 10 to 14 Minutes | 2,509 (27.5%) | 2,417 (25.9%) |
| 15 to 19 Minutes | 1,892 (20.7%) | 2,050 (21.9%) |
| 20 to 24 Minutes | 1,032 (11.3%) | 1,227 (13.1%) |
| 25 to 29 Minutes | 143 (1.6%) | 226 (2.4%) |
| 30 to 34 Minutes | 514 (5.6%) | 548 (5.9%) |
| 35 to 39 Minutes | 44 (0.5%) | 55 (0.6%) |
| 40 to 44 Minutes | 153 (1.7%) | 319 (3.4%) |
| 45 to 59 Minutes | 212 (2.3%) | 173 (1.8%) |
| 60 to 89 Minutes | 378 (4.1%) | 382 (4.1%) |
| 90 or more Minutes | 333 (3.6%) | 124 (1.3%) |
Time of Departure to Work by Sex in Binghamton
The most frequent times of departure to work in Binghamton are 7:30 AM to 7:59 AM (1,322, 14.5%) for males and 7:00 AM to 7:29 AM (1,392, 14.9%) for females.
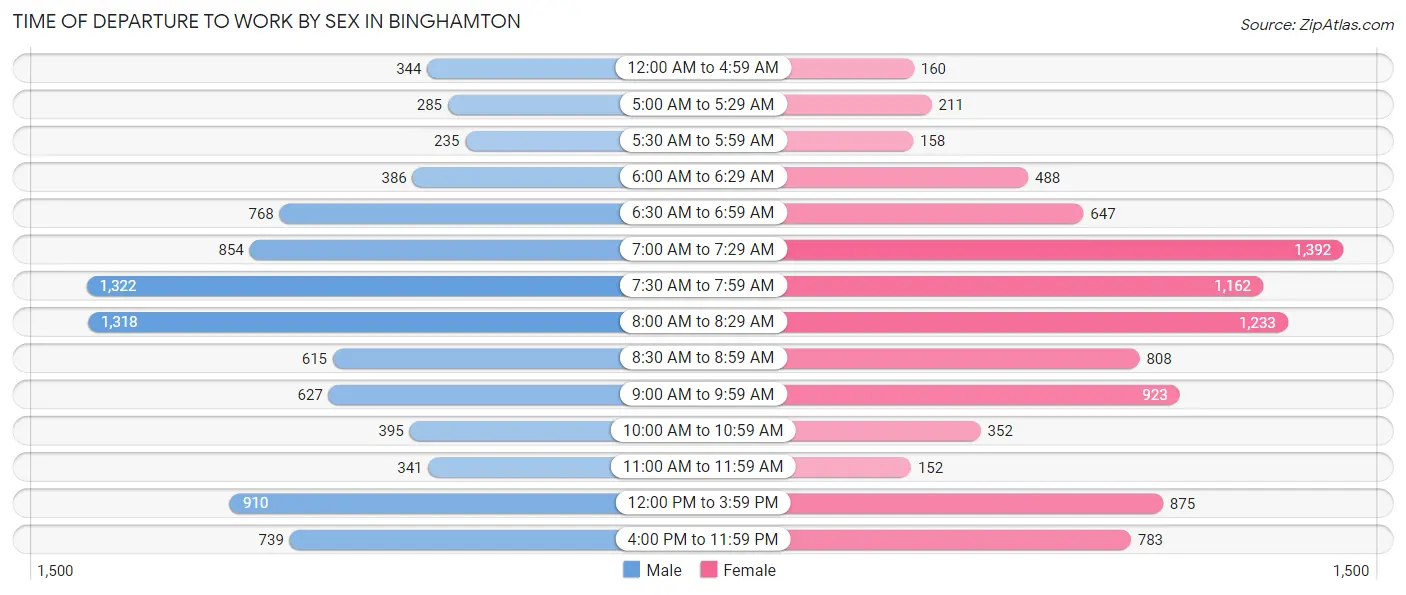
| Time of Departure | Male | Female |
| 12:00 AM to 4:59 AM | 344 (3.8%) | 160 (1.7%) |
| 5:00 AM to 5:29 AM | 285 (3.1%) | 211 (2.3%) |
| 5:30 AM to 5:59 AM | 235 (2.6%) | 158 (1.7%) |
| 6:00 AM to 6:29 AM | 386 (4.2%) | 488 (5.2%) |
| 6:30 AM to 6:59 AM | 768 (8.4%) | 647 (6.9%) |
| 7:00 AM to 7:29 AM | 854 (9.3%) | 1,392 (14.9%) |
| 7:30 AM to 7:59 AM | 1,322 (14.5%) | 1,162 (12.4%) |
| 8:00 AM to 8:29 AM | 1,318 (14.4%) | 1,233 (13.2%) |
| 8:30 AM to 8:59 AM | 615 (6.7%) | 808 (8.6%) |
| 9:00 AM to 9:59 AM | 627 (6.9%) | 923 (9.9%) |
| 10:00 AM to 10:59 AM | 395 (4.3%) | 352 (3.8%) |
| 11:00 AM to 11:59 AM | 341 (3.7%) | 152 (1.6%) |
| 12:00 PM to 3:59 PM | 910 (10.0%) | 875 (9.4%) |
| 4:00 PM to 11:59 PM | 739 (8.1%) | 783 (8.4%) |
| Total | 9,139 (100.0%) | 9,344 (100.0%) |
Housing Occupancy in Binghamton
Occupancy by Ownership in Binghamton
Of the total 20,935 dwellings in Binghamton, owner-occupied units account for 9,125 (43.6%), while renter-occupied units make up 11,810 (56.4%).
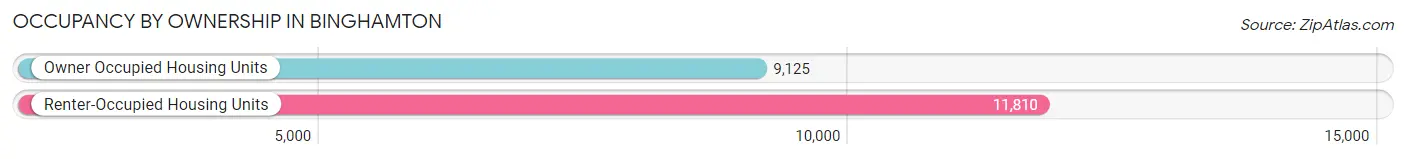
| Occupancy | # Housing Units | % Housing Units |
| Owner Occupied Housing Units | 9,125 | 43.6% |
| Renter-Occupied Housing Units | 11,810 | 56.4% |
| Total Occupied Housing Units | 20,935 | 100.0% |
Occupancy by Household Size in Binghamton
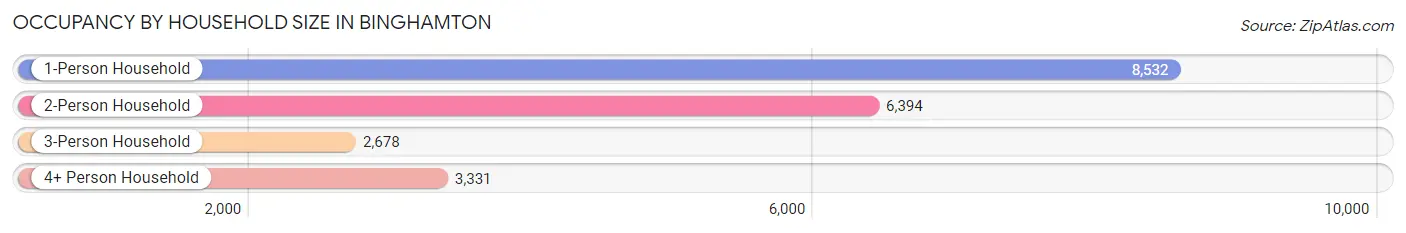
| Household Size | # Housing Units | % Housing Units |
| 1-Person Household | 8,532 | 40.7% |
| 2-Person Household | 6,394 | 30.5% |
| 3-Person Household | 2,678 | 12.8% |
| 4+ Person Household | 3,331 | 15.9% |
| Total Housing Units | 20,935 | 100.0% |
Occupancy by Ownership by Household Size in Binghamton
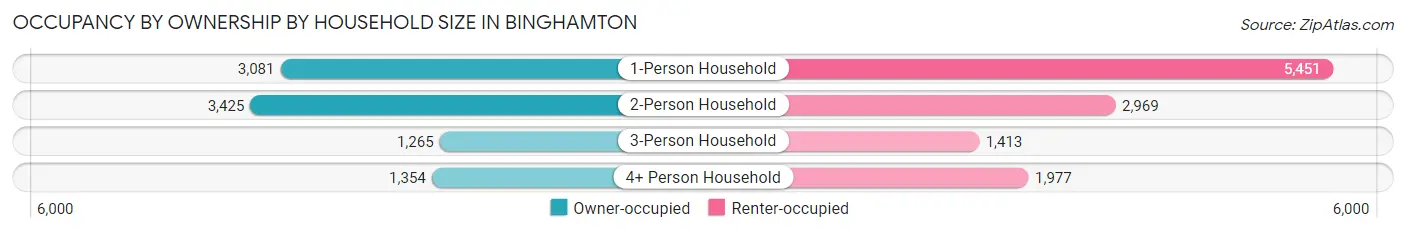
| Household Size | Owner-occupied | Renter-occupied |
| 1-Person Household | 3,081 (36.1%) | 5,451 (63.9%) |
| 2-Person Household | 3,425 (53.6%) | 2,969 (46.4%) |
| 3-Person Household | 1,265 (47.2%) | 1,413 (52.8%) |
| 4+ Person Household | 1,354 (40.6%) | 1,977 (59.4%) |
| Total Housing Units | 9,125 (43.6%) | 11,810 (56.4%) |
Occupancy by Educational Attainment in Binghamton
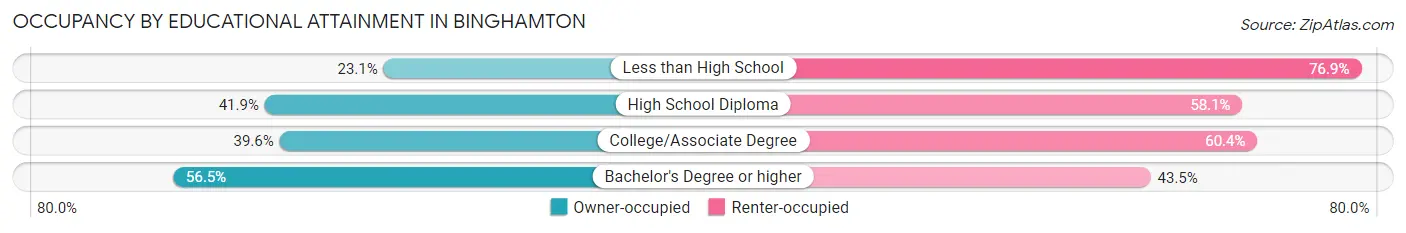
| Household Size | Owner-occupied | Renter-occupied |
| Less than High School | 562 (23.1%) | 1,874 (76.9%) |
| High School Diploma | 2,281 (41.9%) | 3,161 (58.1%) |
| College/Associate Degree | 2,553 (39.6%) | 3,901 (60.4%) |
| Bachelor's Degree or higher | 3,729 (56.5%) | 2,874 (43.5%) |
Occupancy by Age of Householder in Binghamton
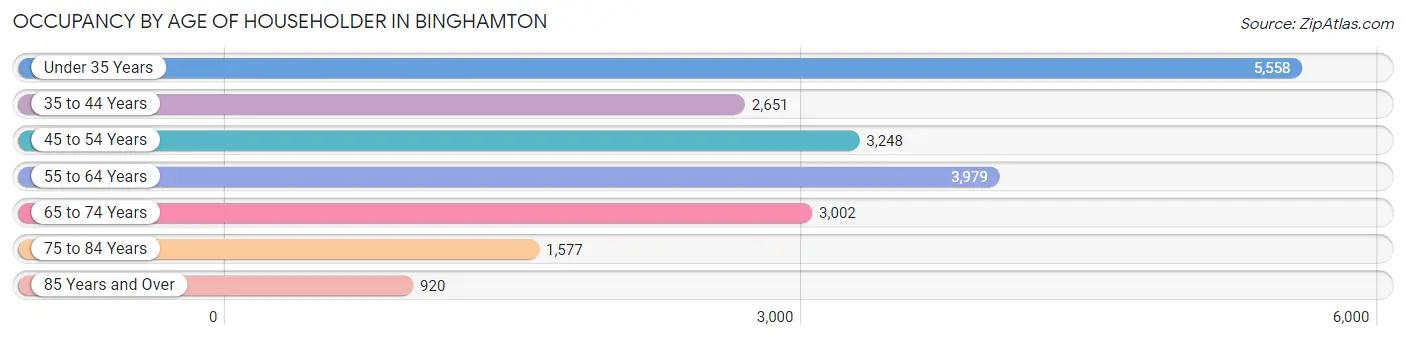
| Age Bracket | # Households | % Households |
| Under 35 Years | 5,558 | 26.6% |
| 35 to 44 Years | 2,651 | 12.7% |
| 45 to 54 Years | 3,248 | 15.5% |
| 55 to 64 Years | 3,979 | 19.0% |
| 65 to 74 Years | 3,002 | 14.3% |
| 75 to 84 Years | 1,577 | 7.5% |
| 85 Years and Over | 920 | 4.4% |
| Total | 20,935 | 100.0% |
Housing Finances in Binghamton
Median Income by Occupancy in Binghamton
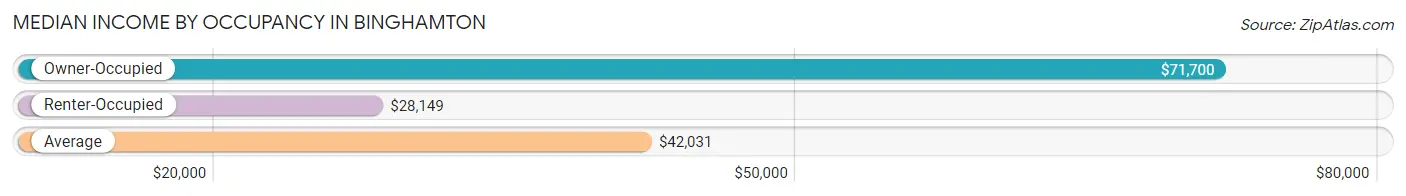
| Occupancy Type | # Households | Median Income |
| Owner-Occupied | 9,125 (43.6%) | $71,700 |
| Renter-Occupied | 11,810 (56.4%) | $28,149 |
| Average | 20,935 (100.0%) | $42,031 |
Occupancy by Householder Income Bracket in Binghamton
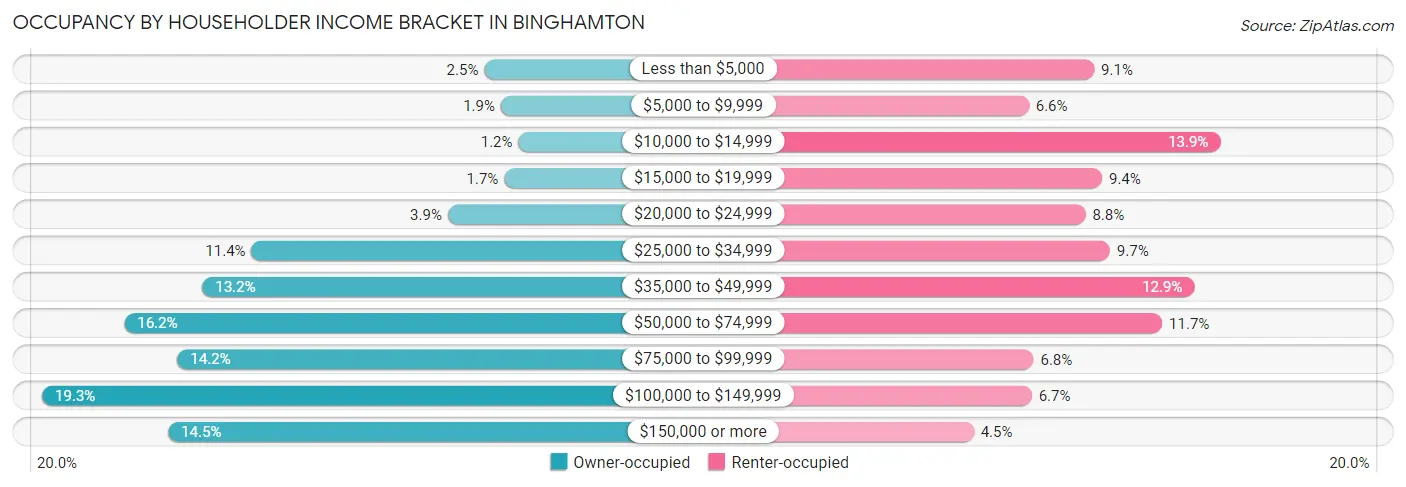
| Income Bracket | Owner-occupied | Renter-occupied |
| Less than $5,000 | 227 (2.5%) | 1,074 (9.1%) |
| $5,000 to $9,999 | 170 (1.9%) | 780 (6.6%) |
| $10,000 to $14,999 | 109 (1.2%) | 1,640 (13.9%) |
| $15,000 to $19,999 | 158 (1.7%) | 1,109 (9.4%) |
| $20,000 to $24,999 | 354 (3.9%) | 1,034 (8.8%) |
| $25,000 to $34,999 | 1,037 (11.4%) | 1,144 (9.7%) |
| $35,000 to $49,999 | 1,207 (13.2%) | 1,524 (12.9%) |
| $50,000 to $74,999 | 1,478 (16.2%) | 1,379 (11.7%) |
| $75,000 to $99,999 | 1,294 (14.2%) | 801 (6.8%) |
| $100,000 to $149,999 | 1,765 (19.3%) | 793 (6.7%) |
| $150,000 or more | 1,326 (14.5%) | 532 (4.5%) |
| Total | 9,125 (100.0%) | 11,810 (100.0%) |
Monthly Housing Cost Tiers in Binghamton
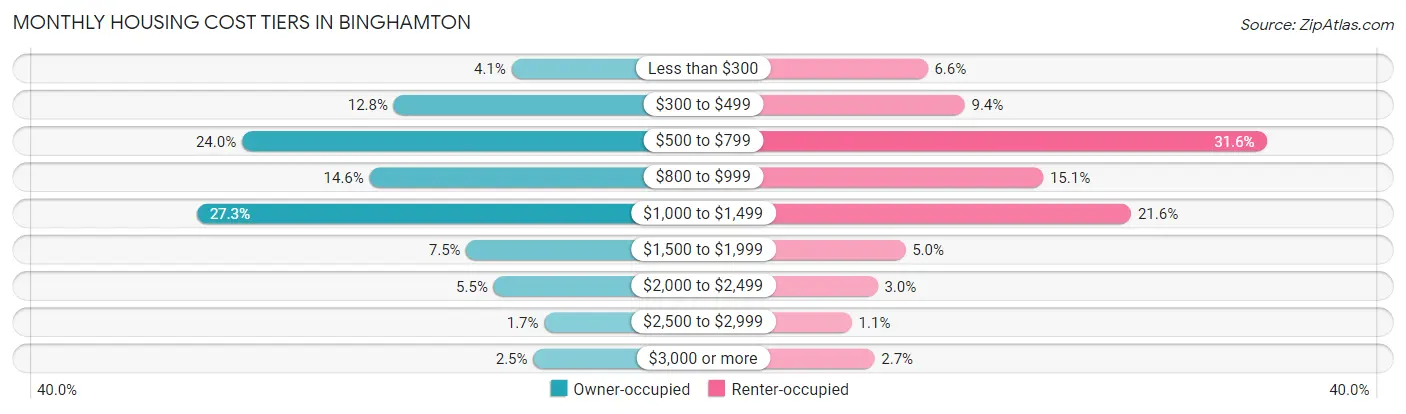
| Monthly Cost | Owner-occupied | Renter-occupied |
| Less than $300 | 377 (4.1%) | 783 (6.6%) |
| $300 to $499 | 1,169 (12.8%) | 1,105 (9.4%) |
| $500 to $799 | 2,189 (24.0%) | 3,731 (31.6%) |
| $800 to $999 | 1,331 (14.6%) | 1,788 (15.1%) |
| $1,000 to $1,499 | 2,493 (27.3%) | 2,553 (21.6%) |
| $1,500 to $1,999 | 681 (7.5%) | 589 (5.0%) |
| $2,000 to $2,499 | 497 (5.4%) | 348 (2.9%) |
| $2,500 to $2,999 | 157 (1.7%) | 124 (1.1%) |
| $3,000 or more | 231 (2.5%) | 321 (2.7%) |
| Total | 9,125 (100.0%) | 11,810 (100.0%) |
Physical Housing Characteristics in Binghamton
Housing Structures in Binghamton
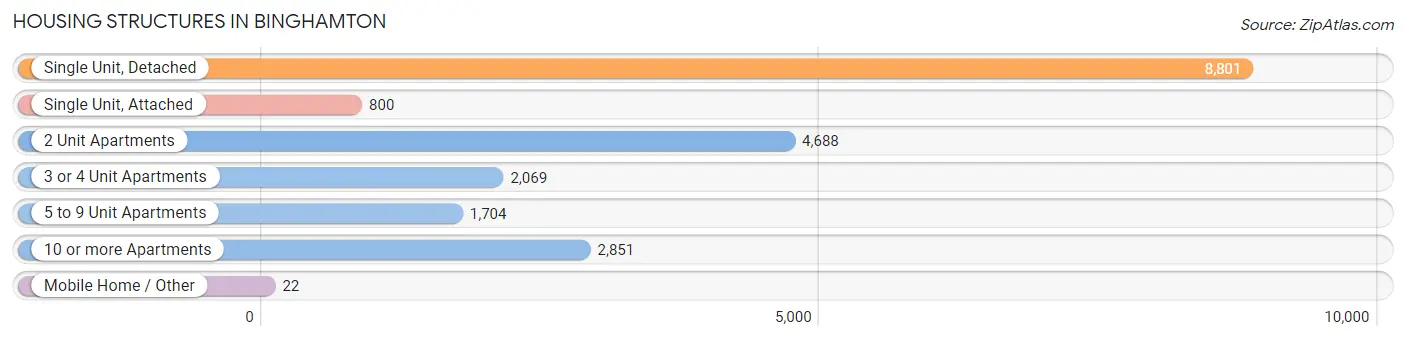
| Structure Type | # Housing Units | % Housing Units |
| Single Unit, Detached | 8,801 | 42.0% |
| Single Unit, Attached | 800 | 3.8% |
| 2 Unit Apartments | 4,688 | 22.4% |
| 3 or 4 Unit Apartments | 2,069 | 9.9% |
| 5 to 9 Unit Apartments | 1,704 | 8.1% |
| 10 or more Apartments | 2,851 | 13.6% |
| Mobile Home / Other | 22 | 0.1% |
| Total | 20,935 | 100.0% |
Housing Structures by Occupancy in Binghamton
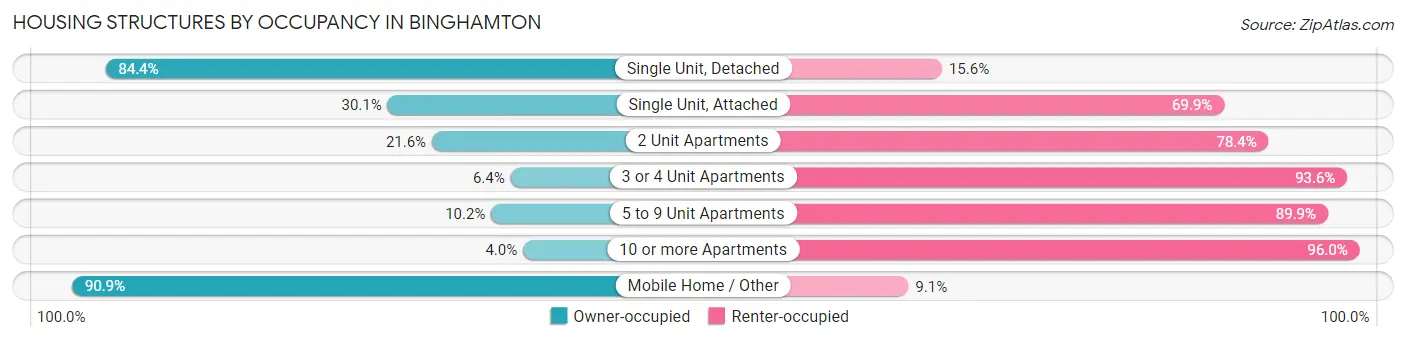
| Structure Type | Owner-occupied | Renter-occupied |
| Single Unit, Detached | 7,432 (84.4%) | 1,369 (15.6%) |
| Single Unit, Attached | 241 (30.1%) | 559 (69.9%) |
| 2 Unit Apartments | 1,011 (21.6%) | 3,677 (78.4%) |
| 3 or 4 Unit Apartments | 133 (6.4%) | 1,936 (93.6%) |
| 5 to 9 Unit Apartments | 173 (10.2%) | 1,531 (89.8%) |
| 10 or more Apartments | 115 (4.0%) | 2,736 (96.0%) |
| Mobile Home / Other | 20 (90.9%) | 2 (9.1%) |
| Total | 9,125 (43.6%) | 11,810 (56.4%) |
Housing Structures by Number of Rooms in Binghamton
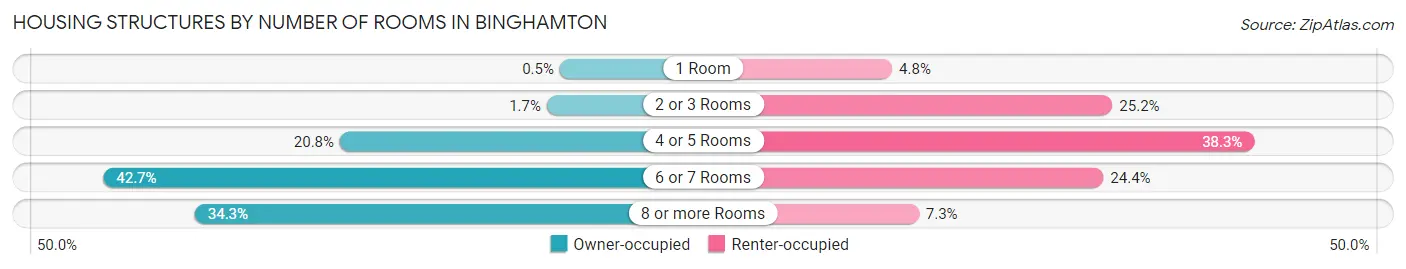
| Number of Rooms | Owner-occupied | Renter-occupied |
| 1 Room | 46 (0.5%) | 570 (4.8%) |
| 2 or 3 Rooms | 155 (1.7%) | 2,976 (25.2%) |
| 4 or 5 Rooms | 1,902 (20.8%) | 4,524 (38.3%) |
| 6 or 7 Rooms | 3,897 (42.7%) | 2,878 (24.4%) |
| 8 or more Rooms | 3,125 (34.3%) | 862 (7.3%) |
| Total | 9,125 (100.0%) | 11,810 (100.0%) |
Housing Structure by Heating Type in Binghamton
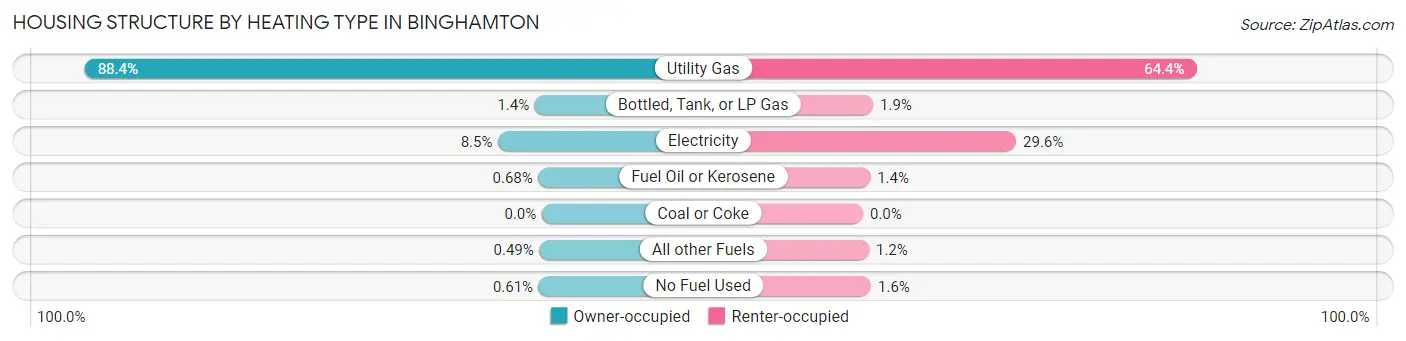
| Heating Type | Owner-occupied | Renter-occupied |
| Utility Gas | 8,064 (88.4%) | 7,604 (64.4%) |
| Bottled, Tank, or LP Gas | 125 (1.4%) | 229 (1.9%) |
| Electricity | 773 (8.5%) | 3,493 (29.6%) |
| Fuel Oil or Kerosene | 62 (0.7%) | 163 (1.4%) |
| Coal or Coke | 0 (0.0%) | 0 (0.0%) |
| All other Fuels | 45 (0.5%) | 137 (1.2%) |
| No Fuel Used | 56 (0.6%) | 184 (1.6%) |
| Total | 9,125 (100.0%) | 11,810 (100.0%) |
Household Vehicle Usage in Binghamton
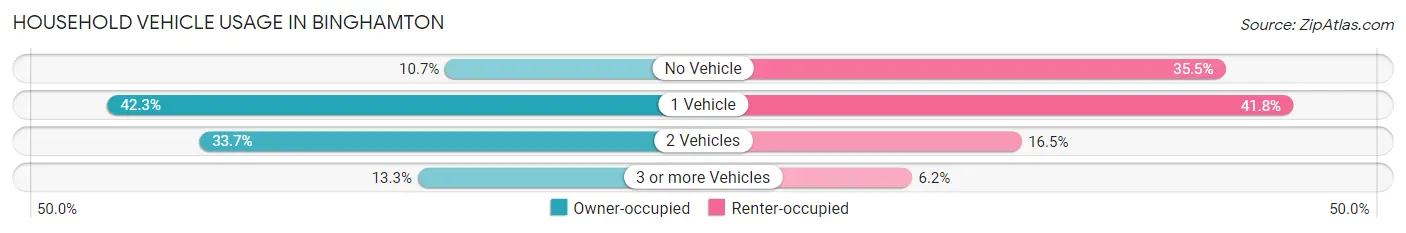
| Vehicles per Household | Owner-occupied | Renter-occupied |
| No Vehicle | 980 (10.7%) | 4,193 (35.5%) |
| 1 Vehicle | 3,856 (42.3%) | 4,939 (41.8%) |
| 2 Vehicles | 3,075 (33.7%) | 1,944 (16.5%) |
| 3 or more Vehicles | 1,214 (13.3%) | 734 (6.2%) |
| Total | 9,125 (100.0%) | 11,810 (100.0%) |
Real Estate & Mortgages in Binghamton
Real Estate and Mortgage Overview in Binghamton
| Characteristic | Without Mortgage | With Mortgage |
| Housing Units | 4,467 | 4,658 |
| Median Property Value | $110,000 | $125,800 |
| Median Household Income | $52,188 | $825 |
| Monthly Housing Costs | $619 | $231 |
| Real Estate Taxes | $3,246 | $54 |
Property Value by Mortgage Status in Binghamton
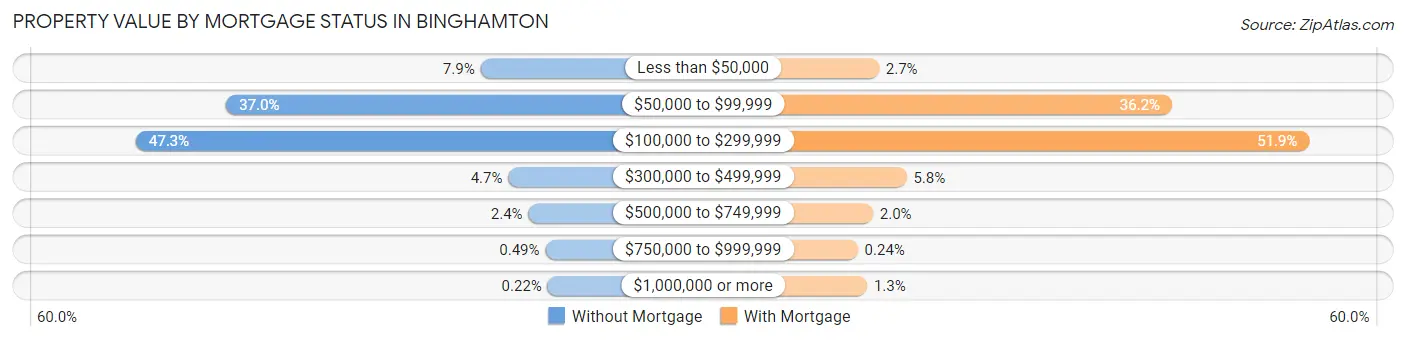
| Property Value | Without Mortgage | With Mortgage |
| Less than $50,000 | 353 (7.9%) | 124 (2.7%) |
| $50,000 to $99,999 | 1,651 (37.0%) | 1,684 (36.1%) |
| $100,000 to $299,999 | 2,112 (47.3%) | 2,415 (51.8%) |
| $300,000 to $499,999 | 211 (4.7%) | 271 (5.8%) |
| $500,000 to $749,999 | 108 (2.4%) | 92 (2.0%) |
| $750,000 to $999,999 | 22 (0.5%) | 11 (0.2%) |
| $1,000,000 or more | 10 (0.2%) | 61 (1.3%) |
| Total | 4,467 (100.0%) | 4,658 (100.0%) |
Household Income by Mortgage Status in Binghamton
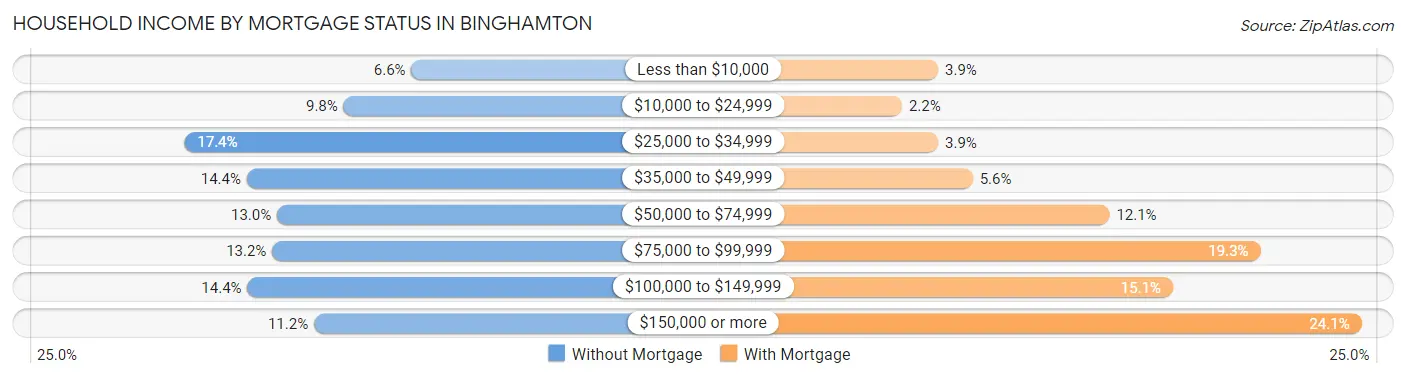
| Household Income | Without Mortgage | With Mortgage |
| Less than $10,000 | 294 (6.6%) | 183 (3.9%) |
| $10,000 to $24,999 | 438 (9.8%) | 103 (2.2%) |
| $25,000 to $34,999 | 777 (17.4%) | 183 (3.9%) |
| $35,000 to $49,999 | 644 (14.4%) | 260 (5.6%) |
| $50,000 to $74,999 | 580 (13.0%) | 563 (12.1%) |
| $75,000 to $99,999 | 590 (13.2%) | 898 (19.3%) |
| $100,000 to $149,999 | 643 (14.4%) | 704 (15.1%) |
| $150,000 or more | 501 (11.2%) | 1,122 (24.1%) |
| Total | 4,467 (100.0%) | 4,658 (100.0%) |
Property Value to Household Income Ratio in Binghamton
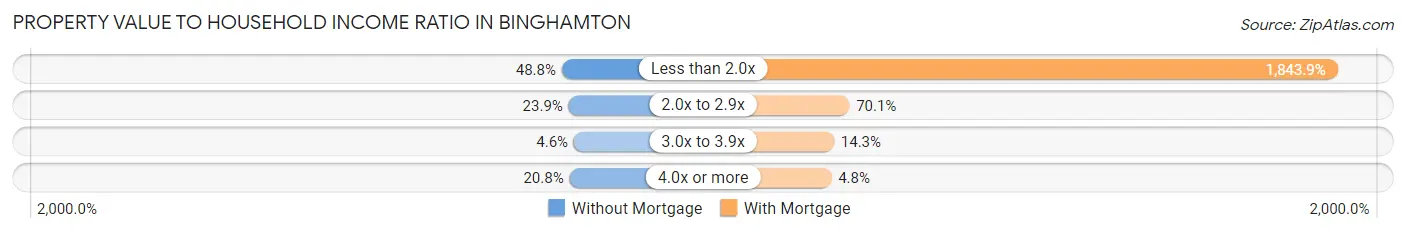
| Value-to-Income Ratio | Without Mortgage | With Mortgage |
| Less than 2.0x | 2,179 (48.8%) | 85,889 (1,843.9%) |
| 2.0x to 2.9x | 1,066 (23.9%) | 3,263 (70.1%) |
| 3.0x to 3.9x | 207 (4.6%) | 666 (14.3%) |
| 4.0x or more | 930 (20.8%) | 223 (4.8%) |
| Total | 4,467 (100.0%) | 4,658 (100.0%) |
Real Estate Taxes by Mortgage Status in Binghamton
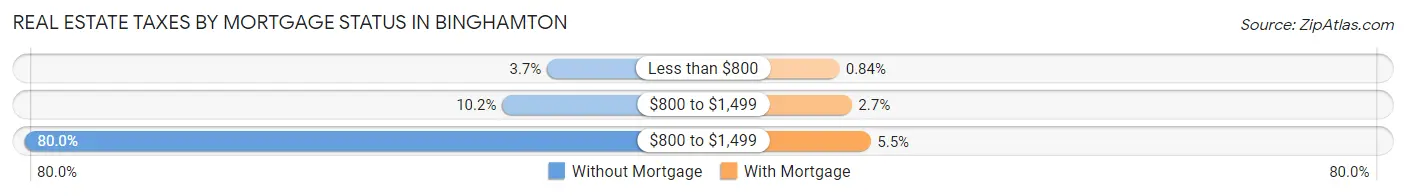
| Property Taxes | Without Mortgage | With Mortgage |
| Less than $800 | 163 (3.6%) | 39 (0.8%) |
| $800 to $1,499 | 456 (10.2%) | 125 (2.7%) |
| $800 to $1,499 | 3,573 (80.0%) | 254 (5.4%) |
| Total | 4,467 (100.0%) | 4,658 (100.0%) |
Health & Disability in Binghamton
Health Insurance Coverage by Age in Binghamton
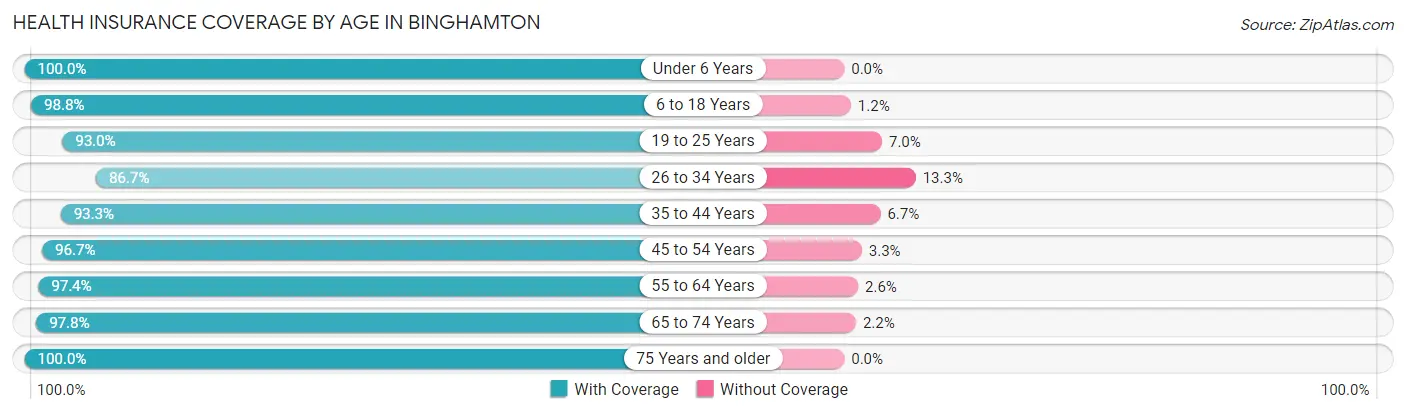
| Age Bracket | With Coverage | Without Coverage |
| Under 6 Years | 2,653 (100.0%) | 0 (0.0%) |
| 6 to 18 Years | 5,632 (98.8%) | 70 (1.2%) |
| 19 to 25 Years | 9,029 (93.0%) | 684 (7.0%) |
| 26 to 34 Years | 4,614 (86.7%) | 709 (13.3%) |
| 35 to 44 Years | 4,607 (93.3%) | 333 (6.7%) |
| 45 to 54 Years | 4,783 (96.7%) | 162 (3.3%) |
| 55 to 64 Years | 5,771 (97.4%) | 152 (2.6%) |
| 65 to 74 Years | 3,990 (97.8%) | 89 (2.2%) |
| 75 Years and older | 3,317 (100.0%) | 0 (0.0%) |
| Total | 44,396 (95.3%) | 2,199 (4.7%) |
Health Insurance Coverage by Citizenship Status in Binghamton
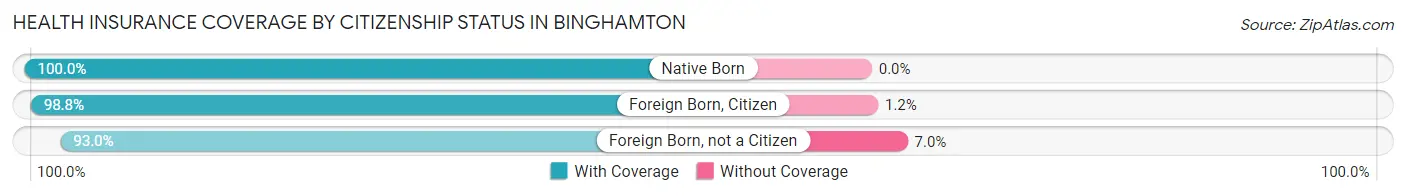
| Citizenship Status | With Coverage | Without Coverage |
| Native Born | 2,653 (100.0%) | 0 (0.0%) |
| Foreign Born, Citizen | 5,632 (98.8%) | 70 (1.2%) |
| Foreign Born, not a Citizen | 9,029 (93.0%) | 684 (7.0%) |
Health Insurance Coverage by Household Income in Binghamton
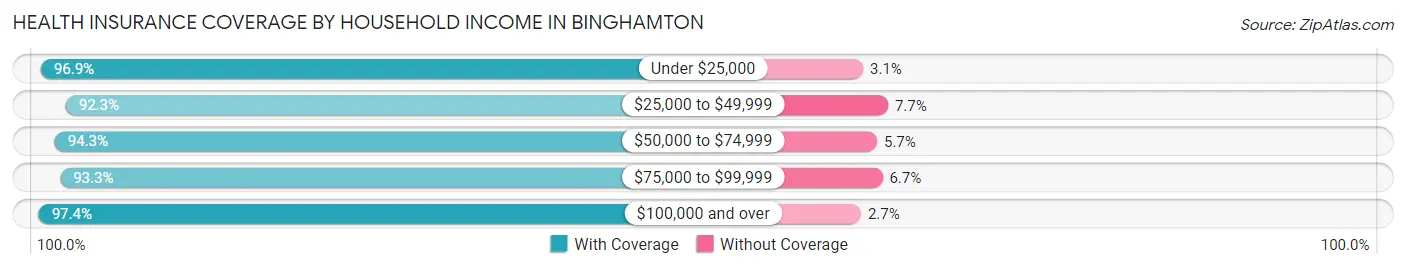
| Household Income | With Coverage | Without Coverage |
| Under $25,000 | 11,775 (96.9%) | 372 (3.1%) |
| $25,000 to $49,999 | 9,473 (92.3%) | 792 (7.7%) |
| $50,000 to $74,999 | 5,542 (94.3%) | 333 (5.7%) |
| $75,000 to $99,999 | 4,760 (93.3%) | 341 (6.7%) |
| $100,000 and over | 12,299 (97.4%) | 335 (2.6%) |
Public vs Private Health Insurance Coverage by Age in Binghamton
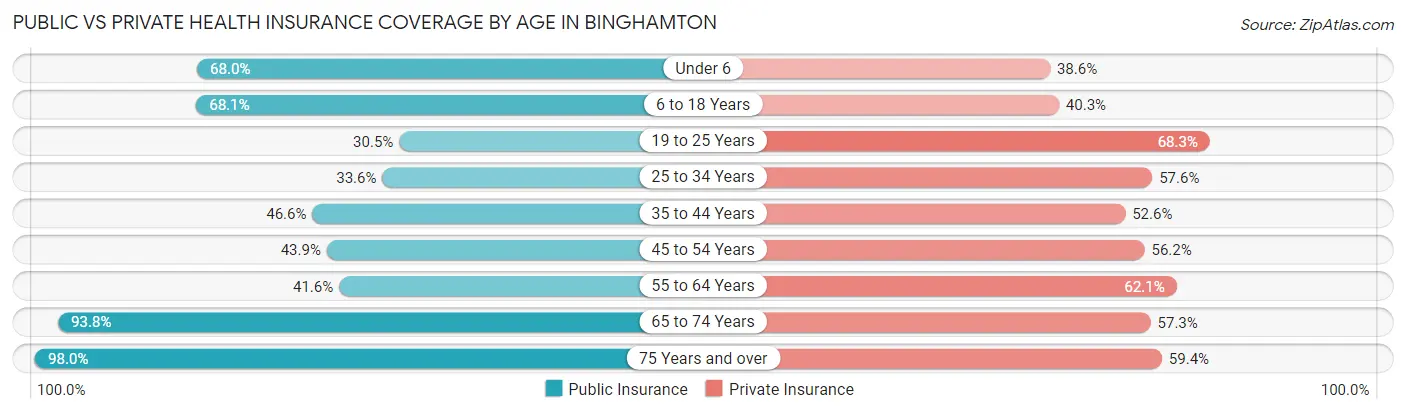
| Age Bracket | Public Insurance | Private Insurance |
| Under 6 | 1,803 (68.0%) | 1,025 (38.6%) |
| 6 to 18 Years | 3,884 (68.1%) | 2,298 (40.3%) |
| 19 to 25 Years | 2,961 (30.5%) | 6,633 (68.3%) |
| 25 to 34 Years | 1,789 (33.6%) | 3,067 (57.6%) |
| 35 to 44 Years | 2,302 (46.6%) | 2,599 (52.6%) |
| 45 to 54 Years | 2,172 (43.9%) | 2,779 (56.2%) |
| 55 to 64 Years | 2,466 (41.6%) | 3,680 (62.1%) |
| 65 to 74 Years | 3,826 (93.8%) | 2,338 (57.3%) |
| 75 Years and over | 3,252 (98.0%) | 1,971 (59.4%) |
| Total | 24,455 (52.5%) | 26,390 (56.6%) |
Disability Status by Sex by Age in Binghamton
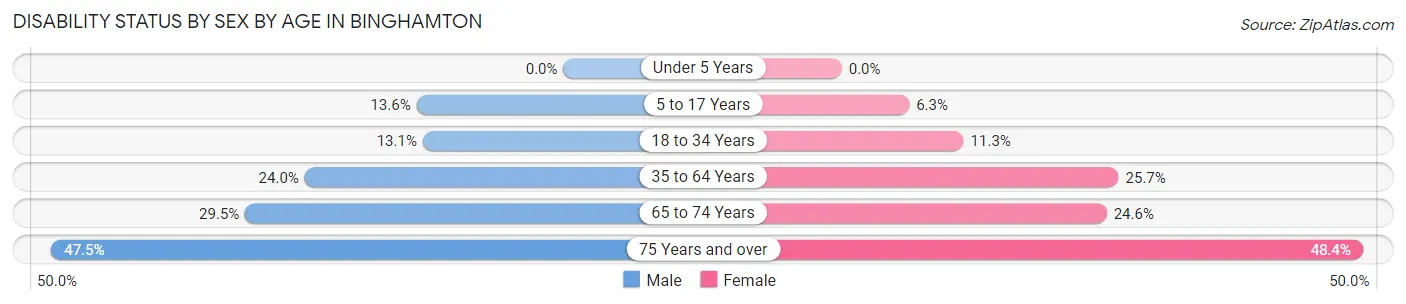
| Age Bracket | Male | Female |
| Under 5 Years | 0 (0.0%) | 0 (0.0%) |
| 5 to 17 Years | 366 (13.6%) | 187 (6.3%) |
| 18 to 34 Years | 1,043 (13.1%) | 840 (11.3%) |
| 35 to 64 Years | 1,815 (24.0%) | 2,119 (25.7%) |
| 65 to 74 Years | 549 (29.5%) | 546 (24.6%) |
| 75 Years and over | 624 (47.5%) | 969 (48.3%) |
Disability Class by Sex by Age in Binghamton
Disability Class: Hearing Difficulty
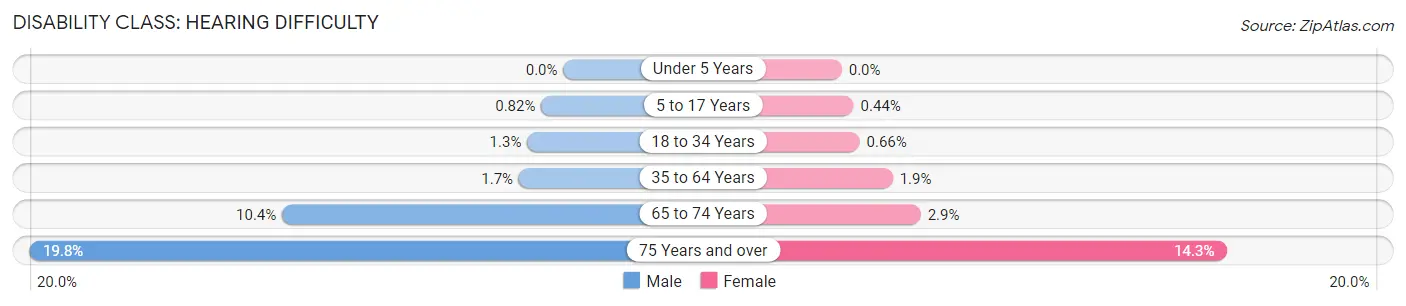
| Age Bracket | Male | Female |
| Under 5 Years | 0 (0.0%) | 0 (0.0%) |
| 5 to 17 Years | 22 (0.8%) | 13 (0.4%) |
| 18 to 34 Years | 107 (1.3%) | 49 (0.7%) |
| 35 to 64 Years | 125 (1.7%) | 156 (1.9%) |
| 65 to 74 Years | 194 (10.4%) | 65 (2.9%) |
| 75 Years and over | 260 (19.8%) | 286 (14.3%) |
Disability Class: Vision Difficulty
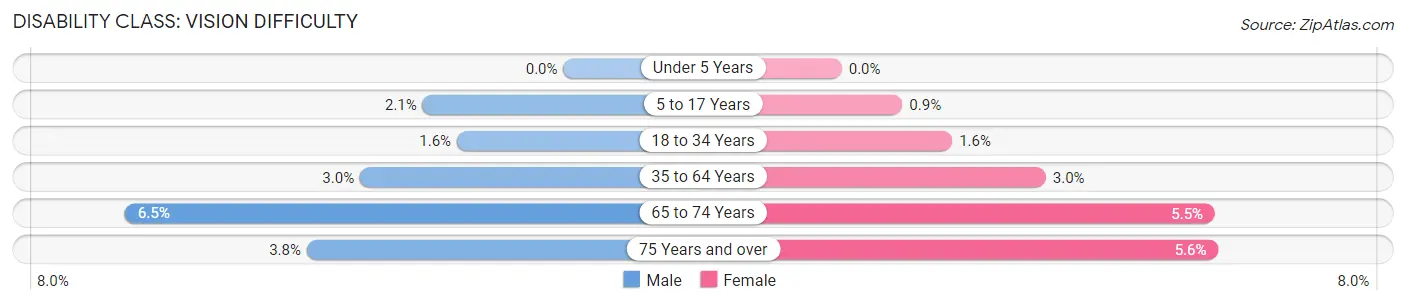
| Age Bracket | Male | Female |
| Under 5 Years | 0 (0.0%) | 0 (0.0%) |
| 5 to 17 Years | 56 (2.1%) | 27 (0.9%) |
| 18 to 34 Years | 126 (1.6%) | 122 (1.6%) |
| 35 to 64 Years | 228 (3.0%) | 250 (3.0%) |
| 65 to 74 Years | 121 (6.5%) | 123 (5.5%) |
| 75 Years and over | 50 (3.8%) | 112 (5.6%) |
Disability Class: Cognitive Difficulty
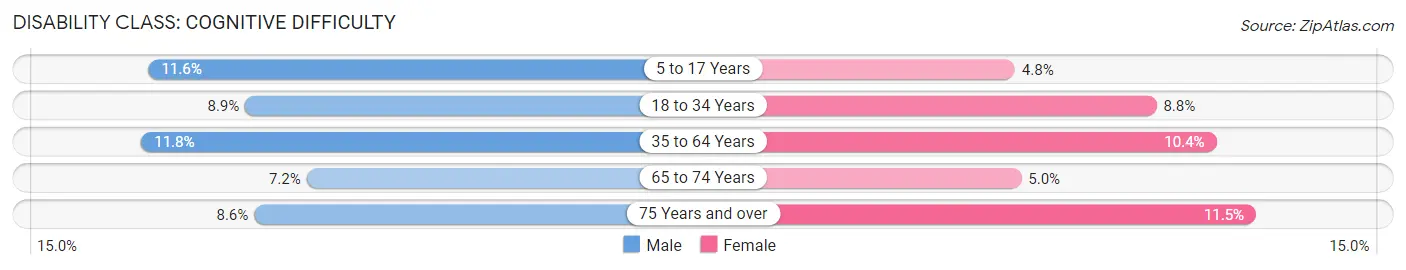
| Age Bracket | Male | Female |
| 5 to 17 Years | 310 (11.6%) | 144 (4.8%) |
| 18 to 34 Years | 708 (8.9%) | 651 (8.8%) |
| 35 to 64 Years | 888 (11.7%) | 860 (10.4%) |
| 65 to 74 Years | 133 (7.1%) | 111 (5.0%) |
| 75 Years and over | 113 (8.6%) | 231 (11.5%) |
Disability Class: Ambulatory Difficulty
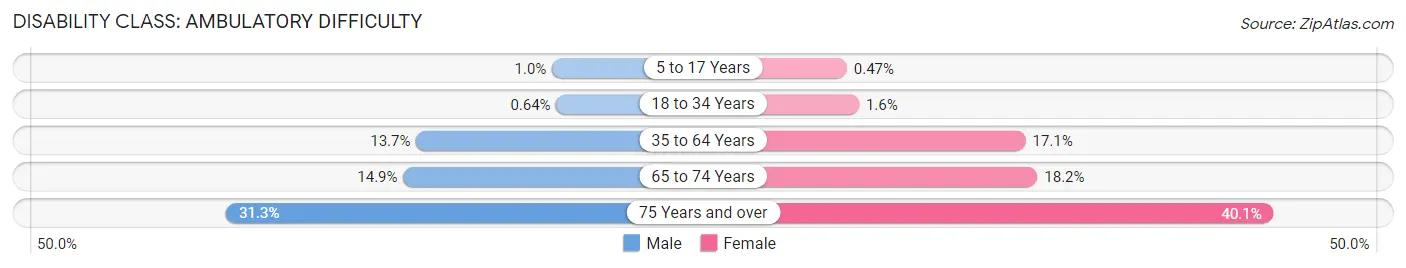
| Age Bracket | Male | Female |
| 5 to 17 Years | 28 (1.0%) | 14 (0.5%) |
| 18 to 34 Years | 51 (0.6%) | 118 (1.6%) |
| 35 to 64 Years | 1,032 (13.7%) | 1,407 (17.1%) |
| 65 to 74 Years | 276 (14.8%) | 403 (18.1%) |
| 75 Years and over | 411 (31.3%) | 803 (40.1%) |
Disability Class: Self-Care Difficulty
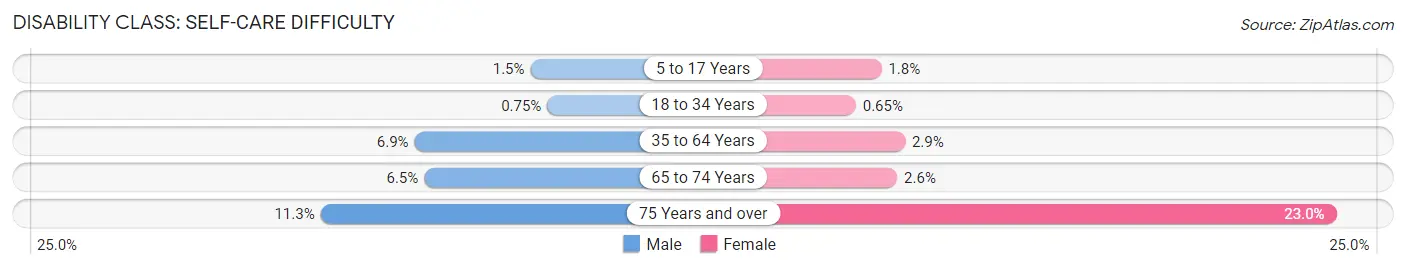
| Age Bracket | Male | Female |
| 5 to 17 Years | 41 (1.5%) | 55 (1.8%) |
| 18 to 34 Years | 60 (0.7%) | 48 (0.6%) |
| 35 to 64 Years | 522 (6.9%) | 242 (2.9%) |
| 65 to 74 Years | 120 (6.5%) | 57 (2.6%) |
| 75 Years and over | 148 (11.3%) | 460 (23.0%) |
Technology Access in Binghamton
Computing Device Access in Binghamton
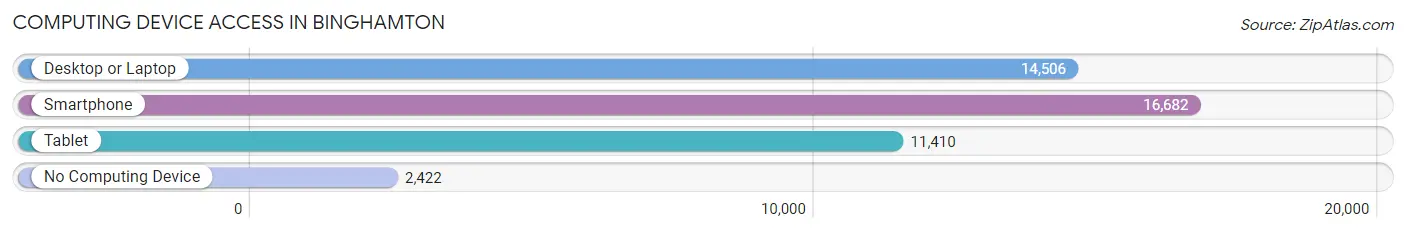
| Device Type | # Households | % Households |
| Desktop or Laptop | 14,506 | 69.3% |
| Smartphone | 16,682 | 79.7% |
| Tablet | 11,410 | 54.5% |
| No Computing Device | 2,422 | 11.6% |
| Total | 20,935 | 100.0% |
Internet Access in Binghamton
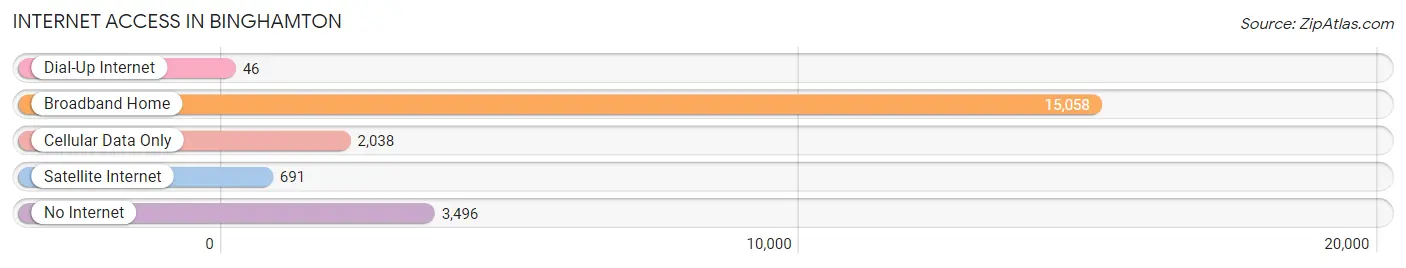
| Internet Type | # Households | % Households |
| Dial-Up Internet | 46 | 0.2% |
| Broadband Home | 15,058 | 71.9% |
| Cellular Data Only | 2,038 | 9.7% |
| Satellite Internet | 691 | 3.3% |
| No Internet | 3,496 | 16.7% |
| Total | 20,935 | 100.0% |
Binghamton Summary
Binghamton, NY is a city located in the Southern Tier of New York State. It is the county seat of Broome County and the principal city of the Binghamton Metropolitan Statistical Area. The city is situated in the Susquehanna River Valley, near the Pennsylvania border. Binghamton is the fifth-largest city in the state of New York, with a population of approximately 47,000 people as of the 2010 census.
History
The area that is now Binghamton was originally inhabited by the Iroquois Native American tribe. The first European settlers arrived in the area in the late 1790s, and the village of Binghamton was established in 1802. The village was named after William Bingham, a prominent landowner and politician.
In 1806, the village was incorporated as a town, and in 1867, it was incorporated as a city. During the 19th century, Binghamton experienced rapid growth and development, becoming an important industrial center. The city was home to several major industries, including the Endicott Johnson Shoe Company, the Link Aviation Company, and the IBM Corporation.
Geography
Binghamton is located in the Southern Tier of New York State, in the Susquehanna River Valley. The city is situated at the confluence of the Susquehanna and Chenango Rivers. The city covers an area of approximately 16.5 square miles, and is located approximately 100 miles southwest of Syracuse, NY and 150 miles northwest of Philadelphia, PA.
The city is located in a hilly region, with elevations ranging from 500 to 1,000 feet above sea level. The highest point in the city is Prospect Mountain, which has an elevation of 1,065 feet. The city is located in a humid continental climate zone, with cold, snowy winters and warm, humid summers.
Economy
Binghamton has a diverse economy, with a variety of industries represented. The city is home to several major employers, including the IBM Corporation, the Link Aviation Company, and the Endicott Johnson Shoe Company. The city is also home to several educational institutions, including Binghamton University, SUNY Broome Community College, and Davis College.
The city is also home to several major healthcare providers, including UHS Wilson Medical Center, Lourdes Hospital, and the Binghamton Psychiatric Center. The city is also home to several major retail outlets, including the Oakdale Mall and the Oakdale Plaza.
Demographics
As of the 2010 census, the population of Binghamton was 47,376. The city has a population density of 2,845 people per square mile. The racial makeup of the city was 87.3% White, 5.3% African American, 0.4% Native American, 2.2% Asian, 0.1% Pacific Islander, 1.7% from other races, and 2.9% from two or more races.
The median household income in the city was $35,945, and the median family income was $45,945. The per capita income in the city was $20,945. Approximately 17.3% of the population was below the poverty line. The city has a large student population, with approximately 20,000 students enrolled in the city's educational institutions.
Common Questions
What is Per Capita Income in Binghamton?
Per Capita income in Binghamton is $30,282.
What is the Median Family Income in Binghamton?
Median Family Income in Binghamton is $60,648.
What is the Median Household income in Binghamton?
Median Household Income in Binghamton is $42,031.
What is Income or Wage Gap in Binghamton?
Income or Wage Gap in Binghamton is 22.2%.
Women in Binghamton earn 77.8 cents for every dollar earned by a man.
What is Family Income Deficit in Binghamton?
Family Income Deficit in Binghamton is $11,290.
Families that are below poverty line in Binghamton earn $11,290 less on average than the poverty threshold level.
What is Inequality or Gini Index in Binghamton?
Inequality or Gini Index in Binghamton is 0.53.
What is the Total Population of Binghamton?
Total Population of Binghamton is 47,617.
What is the Total Male Population of Binghamton?
Total Male Population of Binghamton is 22,968.
What is the Total Female Population of Binghamton?
Total Female Population of Binghamton is 24,649.
What is the Ratio of Males per 100 Females in Binghamton?
There are 93.18 Males per 100 Females in Binghamton.
What is the Ratio of Females per 100 Males in Binghamton?
There are 107.32 Females per 100 Males in Binghamton.
What is the Median Population Age in Binghamton?
Median Population Age in Binghamton is 35.4 Years.
What is the Average Family Size in Binghamton
Average Family Size in Binghamton is 3.0 People.
What is the Average Household Size in Binghamton
Average Household Size in Binghamton is 2.2 People.
How Large is the Labor Force in Binghamton?
There are 23,089 People in the Labor Forcein in Binghamton.
What is the Percentage of People in the Labor Force in Binghamton?
56.8% of People are in the Labor Force in Binghamton.
What is the Unemployment Rate in Binghamton?
Unemployment Rate in Binghamton is 10.1%.