Moore, MT Map & Demographics
Moore Map
Moore Overview
$23,450
PER CAPITA INCOME
$44,271
AVG FAMILY INCOME
$44,271
AVG HOUSEHOLD INCOME
21.3%
WAGE / INCOME GAP [ % ]
78.7¢/ $1
WAGE / INCOME GAP [ $ ]
0.40
INEQUALITY / GINI INDEX
260
TOTAL POPULATION
137
MALE POPULATION
123
FEMALE POPULATION
111.38
MALES / 100 FEMALES
89.78
FEMALES / 100 MALES
47.5
MEDIAN AGE
2.5
AVG FAMILY SIZE
2.3
AVG HOUSEHOLD SIZE
112
LABOR FORCE [ PEOPLE ]
52.1%
PERCENT IN LABOR FORCE
1.8%
UNEMPLOYMENT RATE
Moore Zip Codes
Moore Area Codes
Income in Moore
Income Overview in Moore
Per Capita Income in Moore is $23,450, while median incomes of families and households are $44,271 and $44,271 respectively.
| Characteristic | Number | Measure |
| Per Capita Income | 260 | $23,450 |
| Median Family Income | 91 | $44,271 |
| Mean Family Income | 91 | $59,766 |
| Median Household Income | 115 | $44,271 |
| Mean Household Income | 115 | $57,708 |
| Income Deficit | 91 | $0 |
| Wage / Income Gap (%) | 260 | 21.28% |
| Wage / Income Gap ($) | 260 | 78.72¢ per $1 |
| Gini / Inequality Index | 260 | 0.40 |
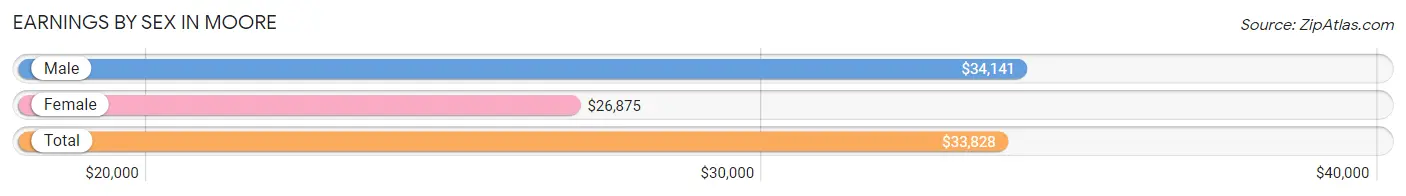
Earnings by Sex in Moore
Average Earnings in Moore are $33,828, $34,141 for men and $26,875 for women, a difference of 21.3%.
| Sex | Number | Average Earnings |
| Male | 73 (59.4%) | $34,141 |
| Female | 50 (40.6%) | $26,875 |
| Total | 123 (100.0%) | $33,828 |
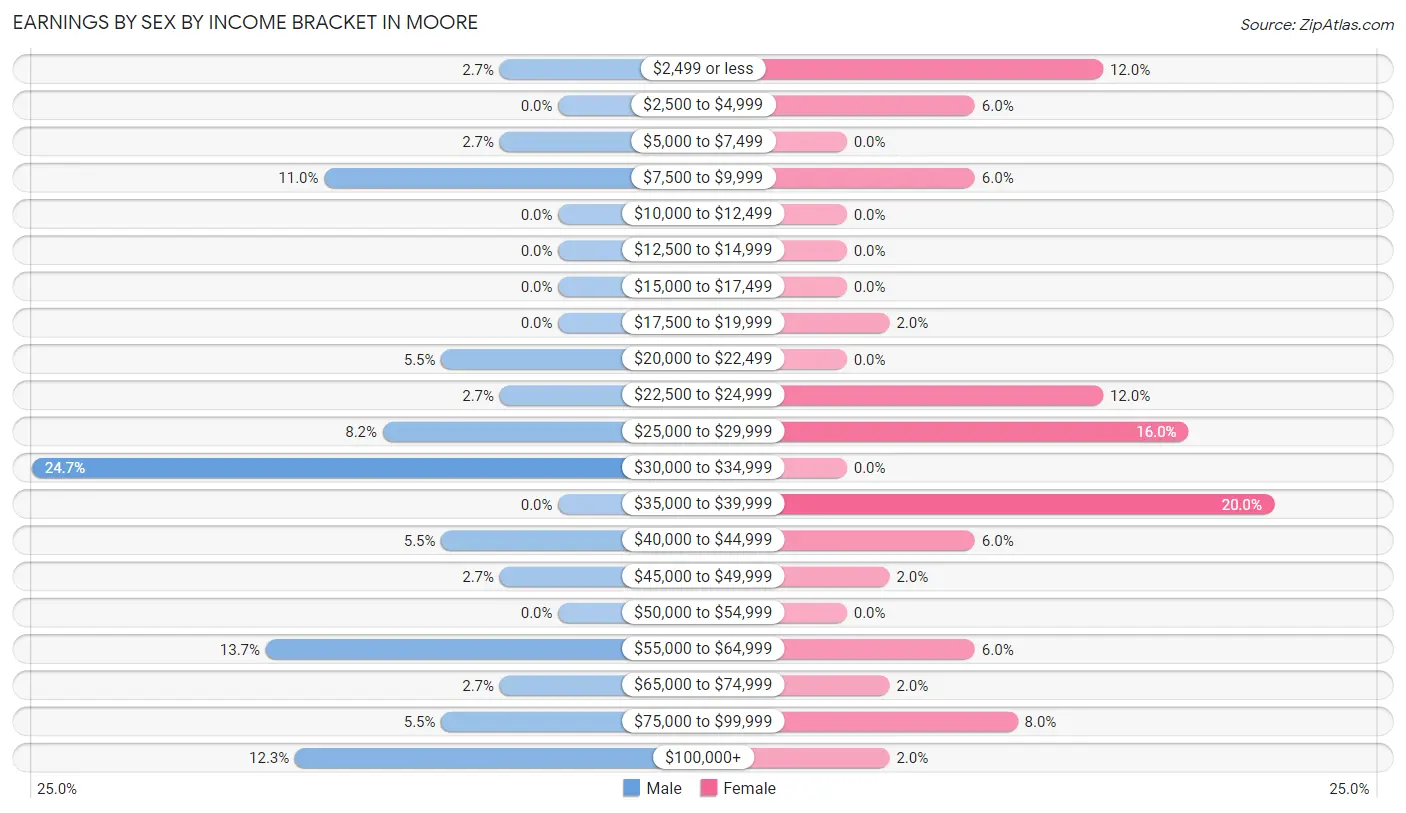
Earnings by Sex by Income Bracket in Moore
The most common earnings brackets in Moore are $30,000 to $34,999 for men (18 | 24.7%) and $35,000 to $39,999 for women (10 | 20.0%).
| Income | Male | Female |
| $2,499 or less | 2 (2.7%) | 6 (12.0%) |
| $2,500 to $4,999 | 0 (0.0%) | 3 (6.0%) |
| $5,000 to $7,499 | 2 (2.7%) | 0 (0.0%) |
| $7,500 to $9,999 | 8 (11.0%) | 3 (6.0%) |
| $10,000 to $12,499 | 0 (0.0%) | 0 (0.0%) |
| $12,500 to $14,999 | 0 (0.0%) | 0 (0.0%) |
| $15,000 to $17,499 | 0 (0.0%) | 0 (0.0%) |
| $17,500 to $19,999 | 0 (0.0%) | 1 (2.0%) |
| $20,000 to $22,499 | 4 (5.5%) | 0 (0.0%) |
| $22,500 to $24,999 | 2 (2.7%) | 6 (12.0%) |
| $25,000 to $29,999 | 6 (8.2%) | 8 (16.0%) |
| $30,000 to $34,999 | 18 (24.7%) | 0 (0.0%) |
| $35,000 to $39,999 | 0 (0.0%) | 10 (20.0%) |
| $40,000 to $44,999 | 4 (5.5%) | 3 (6.0%) |
| $45,000 to $49,999 | 2 (2.7%) | 1 (2.0%) |
| $50,000 to $54,999 | 0 (0.0%) | 0 (0.0%) |
| $55,000 to $64,999 | 10 (13.7%) | 3 (6.0%) |
| $65,000 to $74,999 | 2 (2.7%) | 1 (2.0%) |
| $75,000 to $99,999 | 4 (5.5%) | 4 (8.0%) |
| $100,000+ | 9 (12.3%) | 1 (2.0%) |
| Total | 73 (100.0%) | 50 (100.0%) |
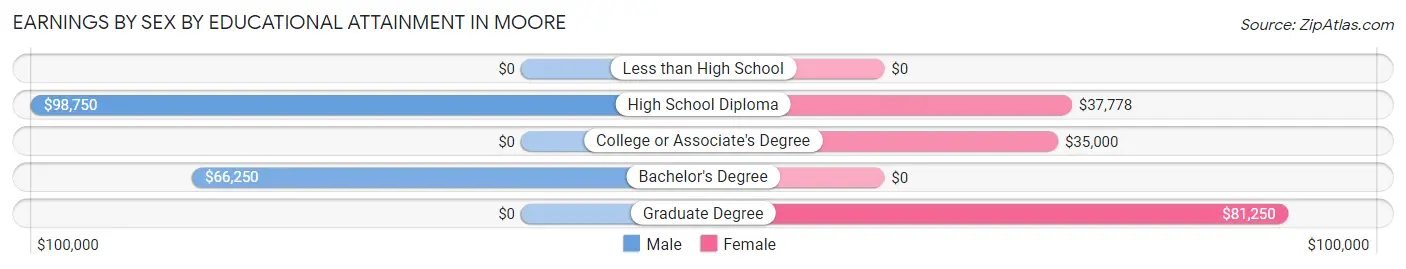
Earnings by Sex by Educational Attainment in Moore
Average earnings in Moore are $43,438 for men and $37,875 for women, a difference of 12.8%. Men with an educational attainment of high school diploma enjoy the highest average annual earnings of $98,750, while those with bachelor's degree education earn the least with $66,250. Women with an educational attainment of graduate degree earn the most with the average annual earnings of $81,250, while those with college or associate's degree education have the smallest earnings of $35,000.
| Educational Attainment | Male Income | Female Income |
| Less than High School | - | - |
| High School Diploma | $98,750 | $37,778 |
| College or Associate's Degree | - | - |
| Bachelor's Degree | $66,250 | $0 |
| Graduate Degree | - | - |
| Total | $43,438 | $37,875 |
Family Income in Moore
Family Income Brackets in Moore
According to the Moore family income data, there are 19 families falling into the $35,000 to $49,999 income range, which is the most common income bracket and makes up 20.9% of all families.
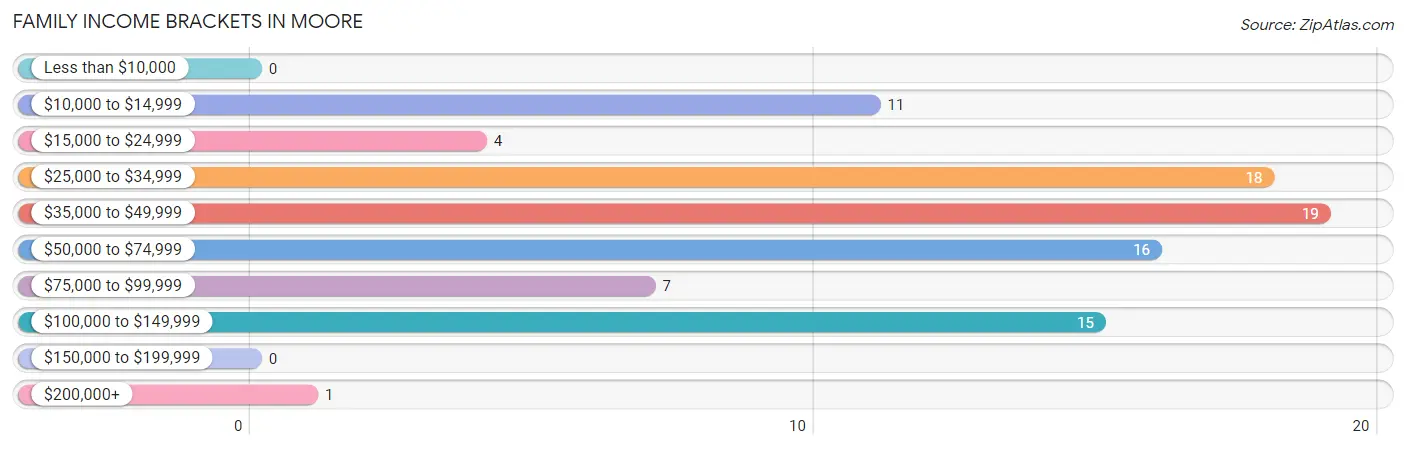
| Income Bracket | # Families | % Families |
| Less than $10,000 | 0 | 0.0% |
| $10,000 to $14,999 | 11 | 12.1% |
| $15,000 to $24,999 | 4 | 4.4% |
| $25,000 to $34,999 | 18 | 19.8% |
| $35,000 to $49,999 | 19 | 20.9% |
| $50,000 to $74,999 | 16 | 17.6% |
| $75,000 to $99,999 | 7 | 7.7% |
| $100,000 to $149,999 | 15 | 16.5% |
| $150,000 to $199,999 | 0 | 0.0% |
| $200,000+ | 1 | 1.1% |
Family Income by Famaliy Size in Moore
5-person families (3 | 3.3%) account for the highest median family income in Moore with $68,750 per family, while 2-person families (45 | 49.4%) have the highest median income of $21,640 per family member.
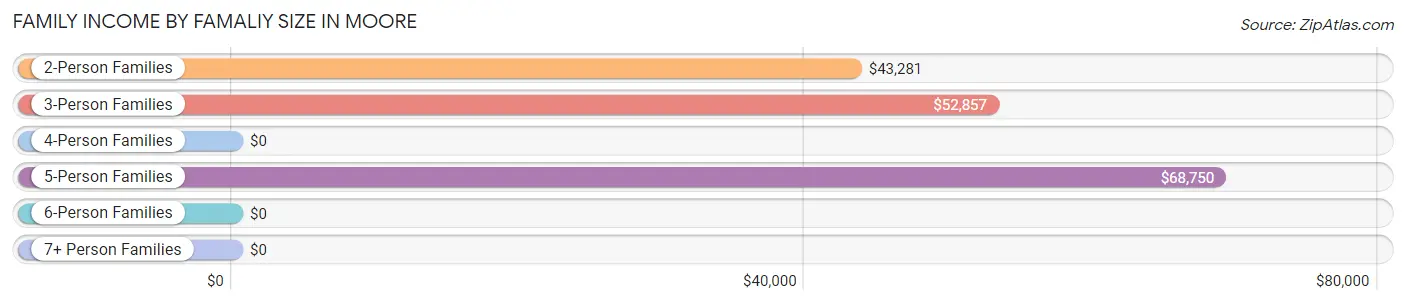
| Income Bracket | # Families | Median Income |
| 2-Person Families | 45 (49.4%) | $43,281 |
| 3-Person Families | 34 (37.4%) | $52,857 |
| 4-Person Families | 9 (9.9%) | $0 |
| 5-Person Families | 3 (3.3%) | $68,750 |
| 6-Person Families | 0 (0.0%) | $0 |
| 7+ Person Families | 0 (0.0%) | $0 |
| Total | 91 (100.0%) | $44,271 |
Family Income by Number of Earners in Moore
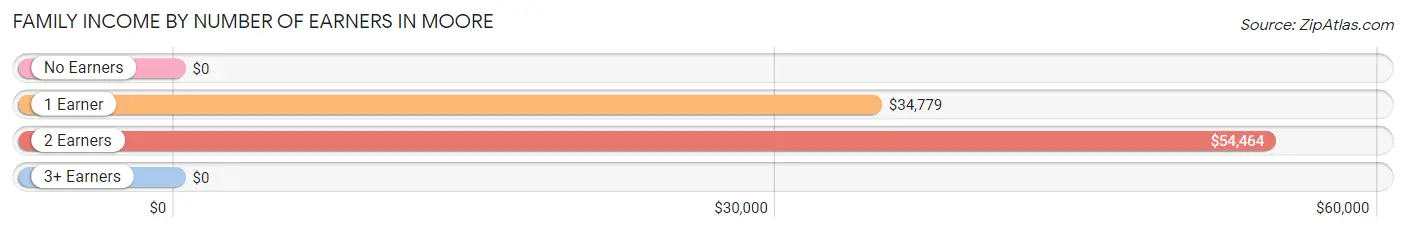
| Number of Earners | # Families | Median Income |
| No Earners | 15 (16.5%) | $0 |
| 1 Earner | 39 (42.9%) | $34,779 |
| 2 Earners | 37 (40.7%) | $54,464 |
| 3+ Earners | 0 (0.0%) | $0 |
| Total | 91 (100.0%) | $44,271 |
Household Income in Moore
Household Income Brackets in Moore
With 27 households falling in the category, the $35,000 to $49,999 income range is the most frequent in Moore, accounting for 23.5% of all households. In contrast, only 1 households (0.9%) fall into the $200,000+ income bracket, making it the least populous group.
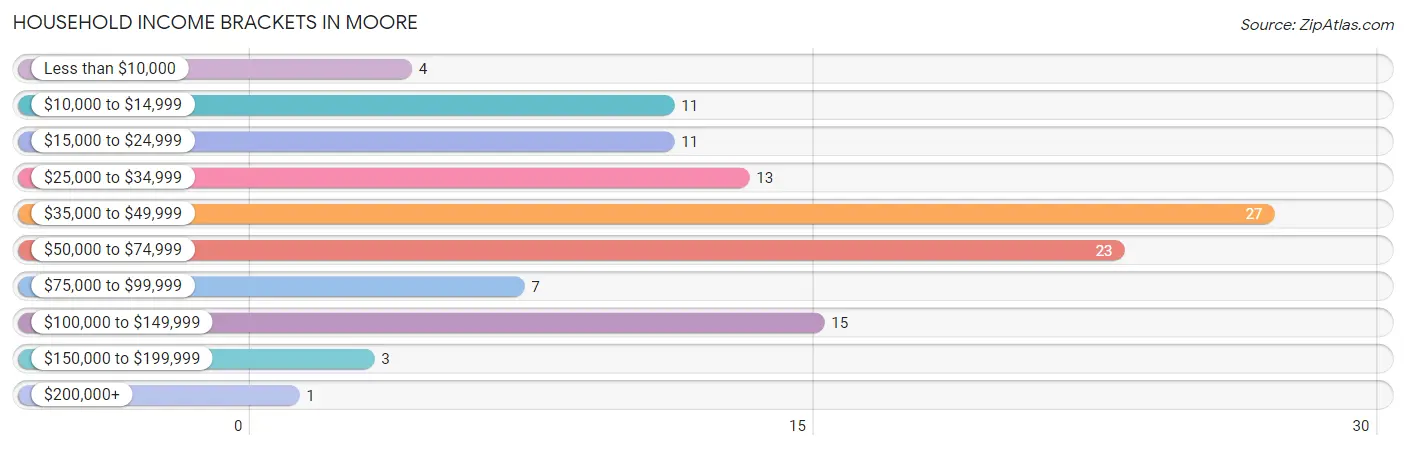
| Income Bracket | # Households | % Households |
| Less than $10,000 | 4 | 3.5% |
| $10,000 to $14,999 | 11 | 9.6% |
| $15,000 to $24,999 | 11 | 9.6% |
| $25,000 to $34,999 | 13 | 11.3% |
| $35,000 to $49,999 | 27 | 23.5% |
| $50,000 to $74,999 | 23 | 20.0% |
| $75,000 to $99,999 | 7 | 6.1% |
| $100,000 to $149,999 | 15 | 13.0% |
| $150,000 to $199,999 | 3 | 2.6% |
| $200,000+ | 1 | 0.9% |
Household Income by Householder Age in Moore
The median household income in Moore is $44,271, with the highest median household income of $81,000 found in the 45 to 64 years age bracket for the primary householder. A total of 38 households (33.0%) fall into this category. Meanwhile, the 15 to 24 years age bracket for the primary householder has the lowest median household income of $0, with 14 households (12.2%) in this group.
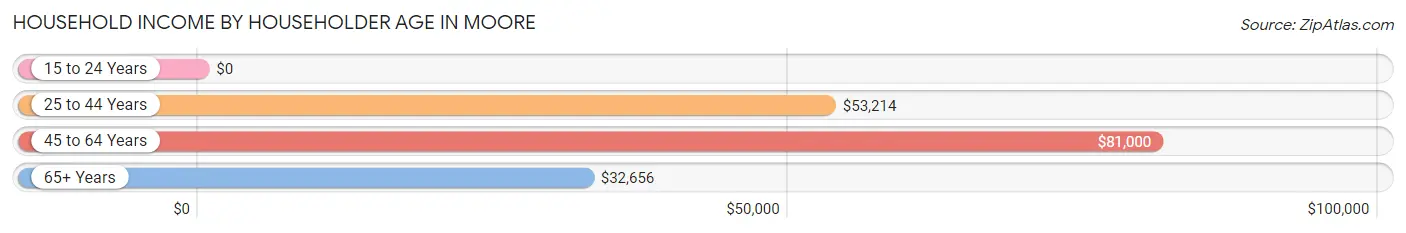
| Income Bracket | # Households | Median Income |
| 15 to 24 Years | 14 (12.2%) | $0 |
| 25 to 44 Years | 26 (22.6%) | $53,214 |
| 45 to 64 Years | 38 (33.0%) | $81,000 |
| 65+ Years | 37 (32.2%) | $32,656 |
| Total | 115 (100.0%) | $44,271 |
Poverty in Moore
Income Below Poverty by Sex and Age in Moore
With 18.2% poverty level for males and 22.8% for females among the residents of Moore, 75 year old and over males and 15 year old females are the most vulnerable to poverty, with 14 males (87.5%) and 6 females (100.0%) in their respective age groups living below the poverty level.
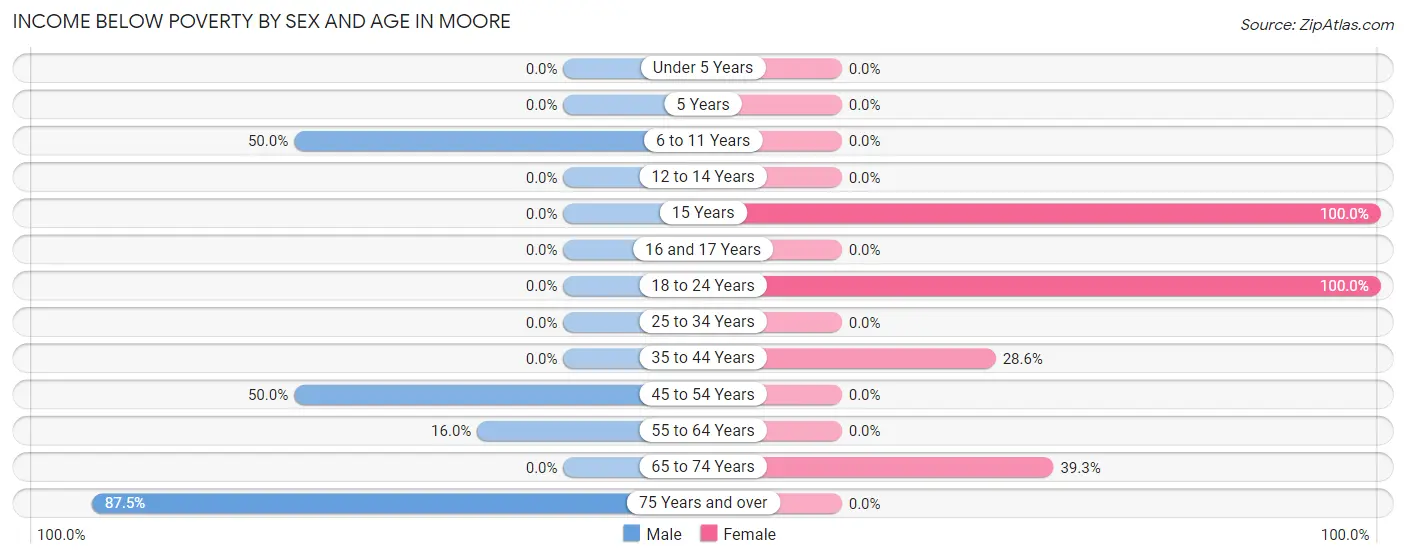
| Age Bracket | Male | Female |
| Under 5 Years | 0 (0.0%) | 0 (0.0%) |
| 5 Years | 0 (0.0%) | 0 (0.0%) |
| 6 to 11 Years | 3 (50.0%) | 0 (0.0%) |
| 12 to 14 Years | 0 (0.0%) | 0 (0.0%) |
| 15 Years | 0 (0.0%) | 6 (100.0%) |
| 16 and 17 Years | 0 (0.0%) | 0 (0.0%) |
| 18 to 24 Years | 0 (0.0%) | 7 (100.0%) |
| 25 to 34 Years | 0 (0.0%) | 0 (0.0%) |
| 35 to 44 Years | 0 (0.0%) | 4 (28.6%) |
| 45 to 54 Years | 4 (50.0%) | 0 (0.0%) |
| 55 to 64 Years | 4 (16.0%) | 0 (0.0%) |
| 65 to 74 Years | 0 (0.0%) | 11 (39.3%) |
| 75 Years and over | 14 (87.5%) | 0 (0.0%) |
| Total | 25 (18.2%) | 28 (22.8%) |
Income Above Poverty by Sex and Age in Moore
According to the poverty statistics in Moore, males aged under 5 years and females aged under 5 years are the age groups that are most secure financially, with 100.0% of males and 100.0% of females in these age groups living above the poverty line.
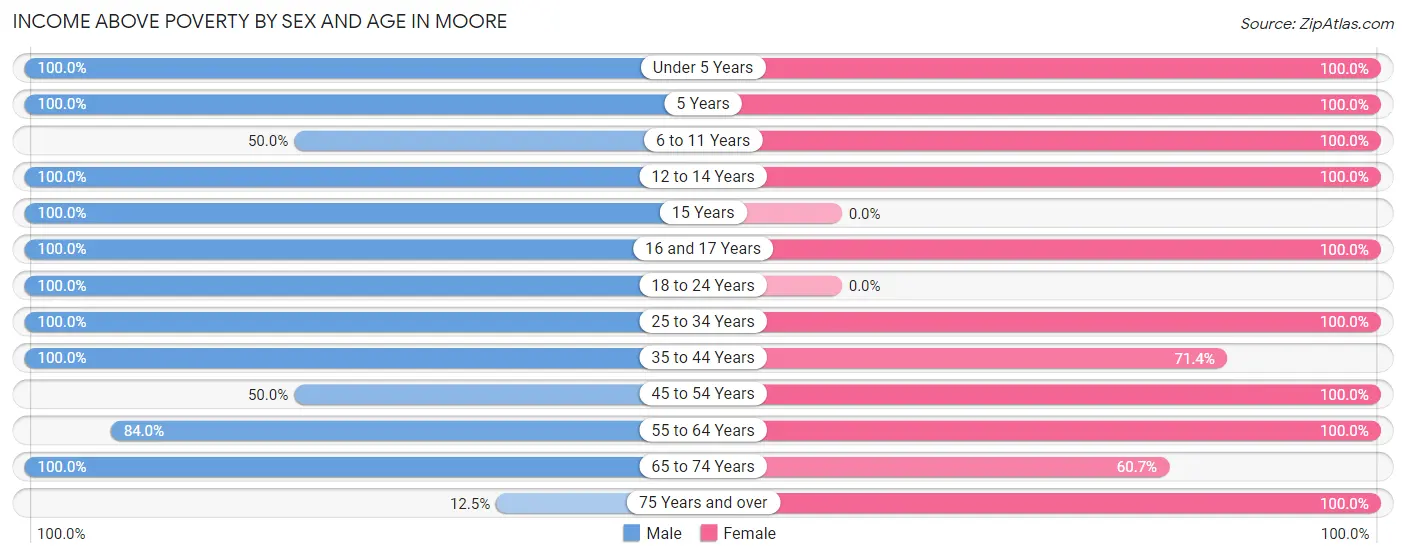
| Age Bracket | Male | Female |
| Under 5 Years | 7 (100.0%) | 11 (100.0%) |
| 5 Years | 3 (100.0%) | 2 (100.0%) |
| 6 to 11 Years | 3 (50.0%) | 4 (100.0%) |
| 12 to 14 Years | 1 (100.0%) | 3 (100.0%) |
| 15 Years | 2 (100.0%) | 0 (0.0%) |
| 16 and 17 Years | 3 (100.0%) | 2 (100.0%) |
| 18 to 24 Years | 27 (100.0%) | 0 (0.0%) |
| 25 to 34 Years | 6 (100.0%) | 10 (100.0%) |
| 35 to 44 Years | 14 (100.0%) | 10 (71.4%) |
| 45 to 54 Years | 4 (50.0%) | 18 (100.0%) |
| 55 to 64 Years | 21 (84.0%) | 6 (100.0%) |
| 65 to 74 Years | 19 (100.0%) | 17 (60.7%) |
| 75 Years and over | 2 (12.5%) | 12 (100.0%) |
| Total | 112 (81.8%) | 95 (77.2%) |
Income Below Poverty Among Married-Couple Families in Moore
The poverty statistics for married-couple families in Moore show that 15.1% or 11 of the total 73 families live below the poverty line. Families with no children have the highest poverty rate of 22.0%, comprising of 11 families. On the other hand, families with 1 or 2 children have the lowest poverty rate of 0.0%, which includes 0 families.
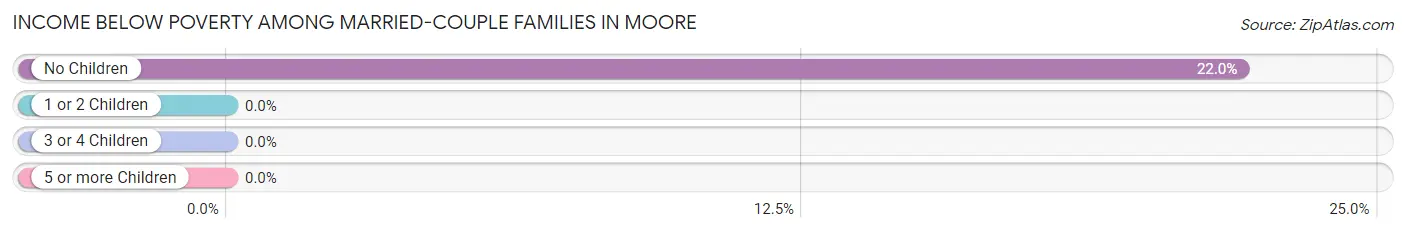
| Children | Above Poverty | Below Poverty |
| No Children | 39 (78.0%) | 11 (22.0%) |
| 1 or 2 Children | 21 (100.0%) | 0 (0.0%) |
| 3 or 4 Children | 2 (100.0%) | 0 (0.0%) |
| 5 or more Children | 0 (0.0%) | 0 (0.0%) |
| Total | 62 (84.9%) | 11 (15.1%) |
Income Below Poverty Among Single-Parent Households in Moore
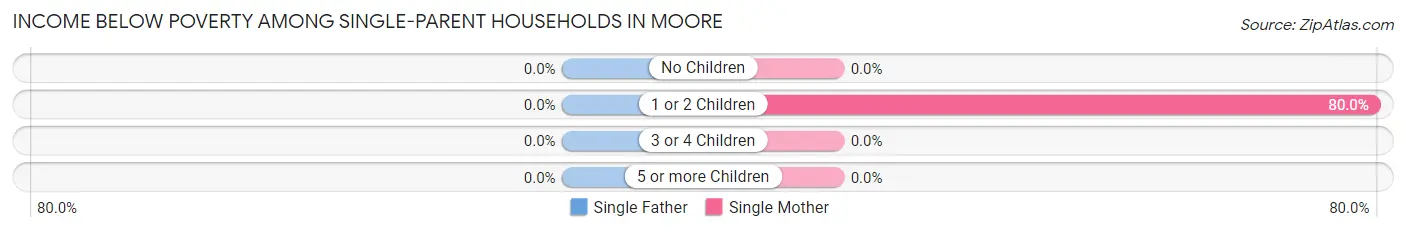
| Children | Single Father | Single Mother |
| No Children | 0 (0.0%) | 0 (0.0%) |
| 1 or 2 Children | 0 (0.0%) | 4 (80.0%) |
| 3 or 4 Children | 0 (0.0%) | 0 (0.0%) |
| 5 or more Children | 0 (0.0%) | 0 (0.0%) |
| Total | 0 (0.0%) | 4 (50.0%) |
Income Below Poverty Among Married-Couple vs Single-Parent Households in Moore
The poverty data for Moore shows that 11 of the married-couple family households (15.1%) and 4 of the single-parent households (22.2%) are living below the poverty level. Within the married-couple family households, those with no children have the highest poverty rate, with 11 households (22.0%) falling below the poverty line. Among the single-parent households, those with 1 or 2 children have the highest poverty rate, with 4 household (30.8%) living below poverty.
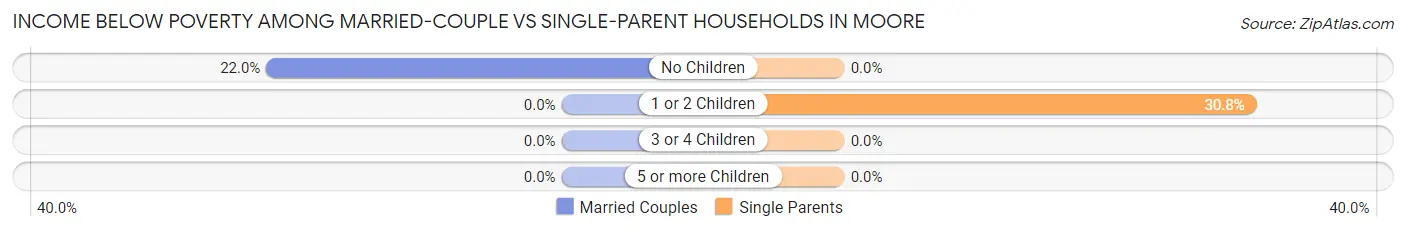
| Children | Married-Couple Families | Single-Parent Households |
| No Children | 11 (22.0%) | 0 (0.0%) |
| 1 or 2 Children | 0 (0.0%) | 4 (30.8%) |
| 3 or 4 Children | 0 (0.0%) | 0 (0.0%) |
| 5 or more Children | 0 (0.0%) | 0 (0.0%) |
| Total | 11 (15.1%) | 4 (22.2%) |
Race in Moore
The most populous races in Moore are White / Caucasian (219 | 84.2%), Two or more Races (41 | 15.8%), and Hispanic or Latino (16 | 6.1%).
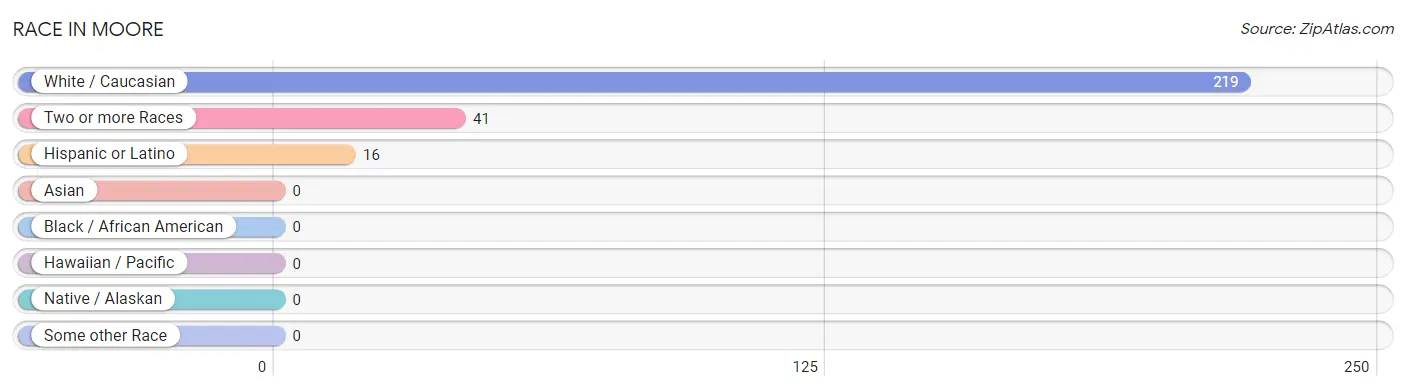
| Race | # Population | % Population |
| Asian | 0 | 0.0% |
| Black / African American | 0 | 0.0% |
| Hawaiian / Pacific | 0 | 0.0% |
| Hispanic or Latino | 16 | 6.1% |
| Native / Alaskan | 0 | 0.0% |
| White / Caucasian | 219 | 84.2% |
| Two or more Races | 41 | 15.8% |
| Some other Race | 0 | 0.0% |
| Total | 260 | 100.0% |
Ancestry in Moore
The most populous ancestries reported in Moore are German (66 | 25.4%), Irish (60 | 23.1%), American (28 | 10.8%), Norwegian (23 | 8.8%), and Croatian (22 | 8.5%), together accounting for 76.5% of all Moore residents.
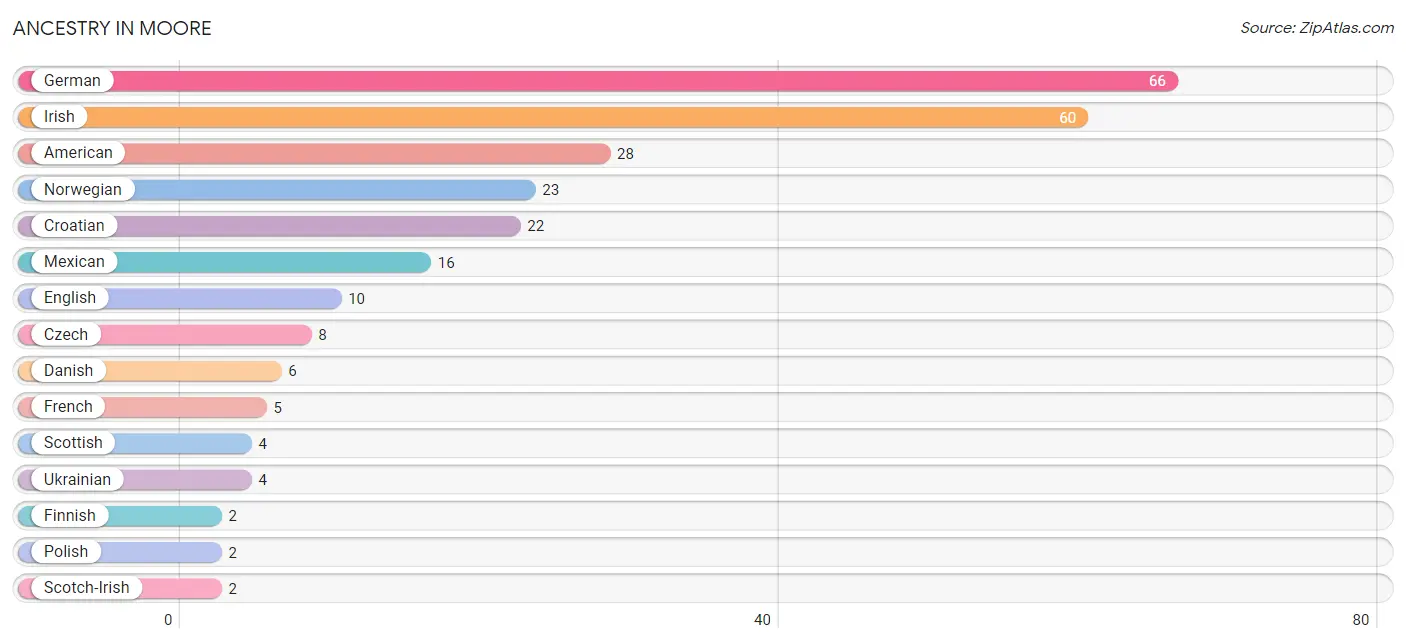
| Ancestry | # Population | % Population |
| American | 28 | 10.8% |
| Bulgarian | 1 | 0.4% |
| Croatian | 22 | 8.5% |
| Czech | 8 | 3.1% |
| Czechoslovakian | 1 | 0.4% |
| Danish | 6 | 2.3% |
| English | 10 | 3.8% |
| Finnish | 2 | 0.8% |
| French | 5 | 1.9% |
| French Canadian | 1 | 0.4% |
| German | 66 | 25.4% |
| Irish | 60 | 23.1% |
| Italian | 1 | 0.4% |
| Mexican | 16 | 6.1% |
| Norwegian | 23 | 8.8% |
| Polish | 2 | 0.8% |
| Scotch-Irish | 2 | 0.8% |
| Scottish | 4 | 1.5% |
| Swedish | 1 | 0.4% |
| Ukrainian | 4 | 1.5% | View All 20 Rows |
Immigrants in Moore

| Immigration Origin | # Population | % Population | View All 0 Rows |
Sex and Age in Moore
Sex and Age in Moore
The most populous age groups in Moore are 15 to 19 Years (18 | 13.1%) for men and 70 to 74 Years (21 | 17.1%) for women.
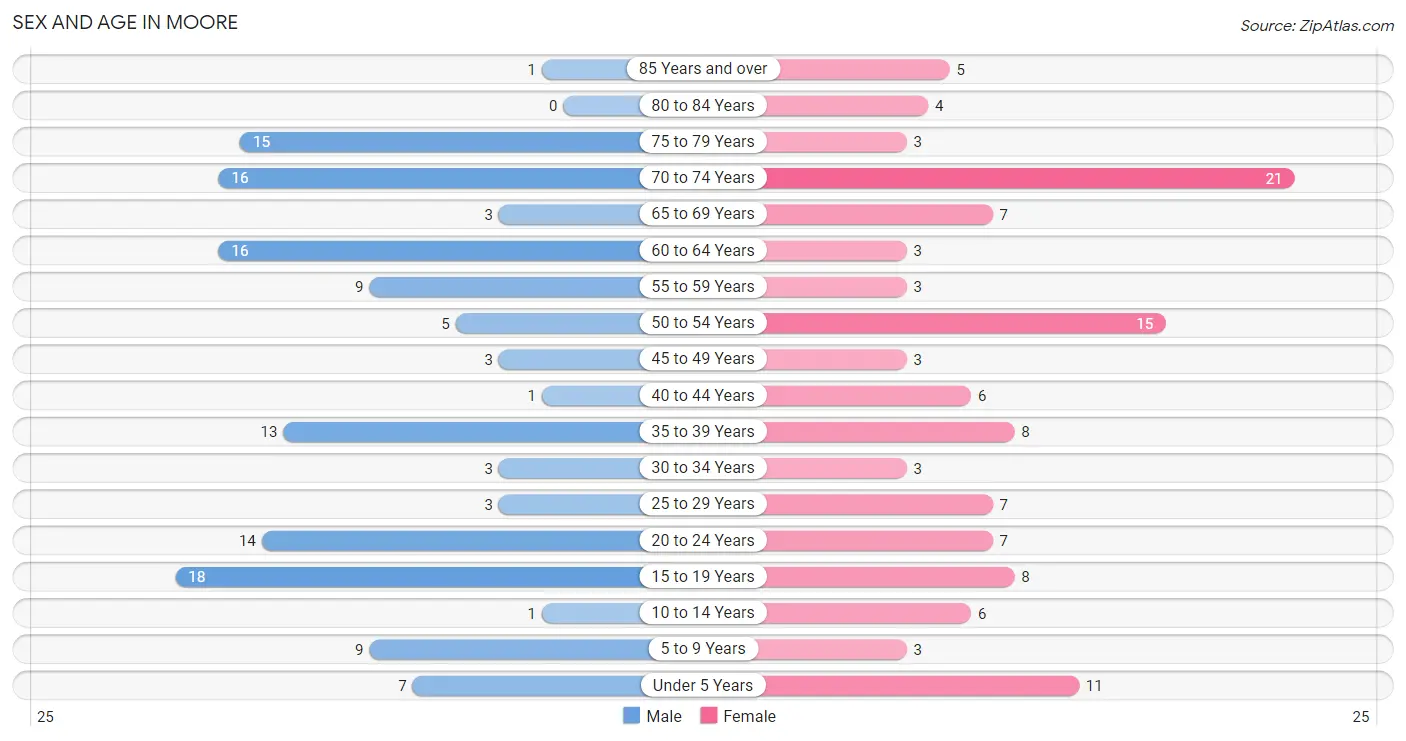
| Age Bracket | Male | Female |
| Under 5 Years | 7 (5.1%) | 11 (8.9%) |
| 5 to 9 Years | 9 (6.6%) | 3 (2.4%) |
| 10 to 14 Years | 1 (0.7%) | 6 (4.9%) |
| 15 to 19 Years | 18 (13.1%) | 8 (6.5%) |
| 20 to 24 Years | 14 (10.2%) | 7 (5.7%) |
| 25 to 29 Years | 3 (2.2%) | 7 (5.7%) |
| 30 to 34 Years | 3 (2.2%) | 3 (2.4%) |
| 35 to 39 Years | 13 (9.5%) | 8 (6.5%) |
| 40 to 44 Years | 1 (0.7%) | 6 (4.9%) |
| 45 to 49 Years | 3 (2.2%) | 3 (2.4%) |
| 50 to 54 Years | 5 (3.6%) | 15 (12.2%) |
| 55 to 59 Years | 9 (6.6%) | 3 (2.4%) |
| 60 to 64 Years | 16 (11.7%) | 3 (2.4%) |
| 65 to 69 Years | 3 (2.2%) | 7 (5.7%) |
| 70 to 74 Years | 16 (11.7%) | 21 (17.1%) |
| 75 to 79 Years | 15 (11.0%) | 3 (2.4%) |
| 80 to 84 Years | 0 (0.0%) | 4 (3.3%) |
| 85 Years and over | 1 (0.7%) | 5 (4.1%) |
| Total | 137 (100.0%) | 123 (100.0%) |
Families and Households in Moore
Median Family Size in Moore
The median family size in Moore is 2.45 persons per family, with single female/mother families (8 | 8.8%) accounting for the largest median family size of 2.63 persons per family. On the other hand, married-couple families (73 | 80.2%) represent the smallest median family size with 2.42 persons per family.
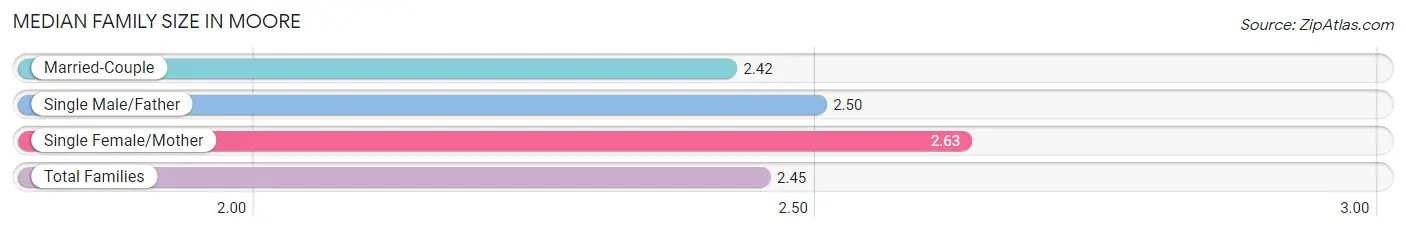
| Family Type | # Families | Family Size |
| Married-Couple | 73 (80.2%) | 2.42 |
| Single Male/Father | 10 (11.0%) | 2.50 |
| Single Female/Mother | 8 (8.8%) | 2.63 |
| Total Families | 91 (100.0%) | 2.45 |
Median Household Size in Moore
The median household size in Moore is 2.26 persons per household, with single male/father households (10 | 8.7%) accounting for the largest median household size of 3.3 persons per household. non-family households (24 | 20.9%) represent the smallest median household size with 1.04 persons per household.
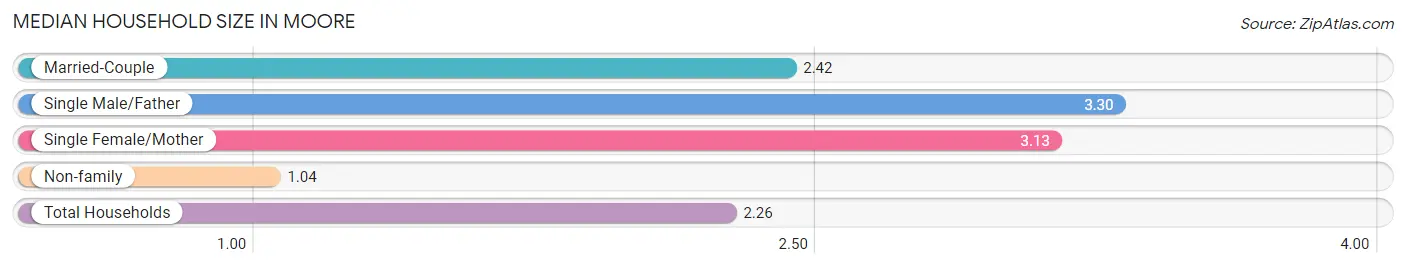
| Household Type | # Households | Household Size |
| Married-Couple | 73 (63.5%) | 2.42 |
| Single Male/Father | 10 (8.7%) | 3.30 |
| Single Female/Mother | 8 (7.0%) | 3.13 |
| Non-family | 24 (20.9%) | 1.04 |
| Total Households | 115 (100.0%) | 2.26 |
Household Size by Marriage Status in Moore
Out of a total of 115 households in Moore, 91 (79.1%) are family households, while 24 (20.9%) are nonfamily households. The most numerous type of family households are 2-person households, comprising 44, and the most common type of nonfamily households are 1-person households, comprising 22.
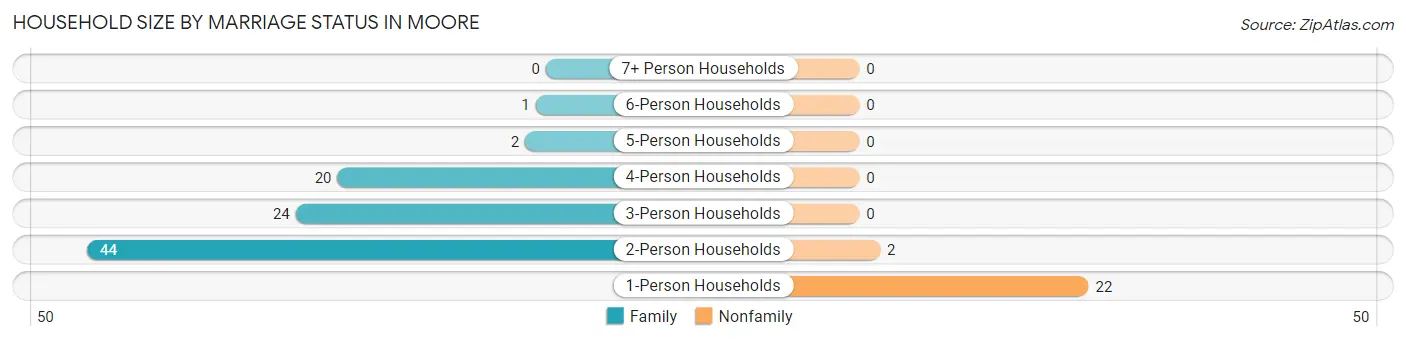
| Household Size | Family Households | Nonfamily Households |
| 1-Person Households | - | 22 (19.1%) |
| 2-Person Households | 44 (38.3%) | 2 (1.7%) |
| 3-Person Households | 24 (20.9%) | 0 (0.0%) |
| 4-Person Households | 20 (17.4%) | 0 (0.0%) |
| 5-Person Households | 2 (1.7%) | 0 (0.0%) |
| 6-Person Households | 1 (0.9%) | 0 (0.0%) |
| 7+ Person Households | 0 (0.0%) | 0 (0.0%) |
| Total | 91 (79.1%) | 24 (20.9%) |
Female Fertility in Moore
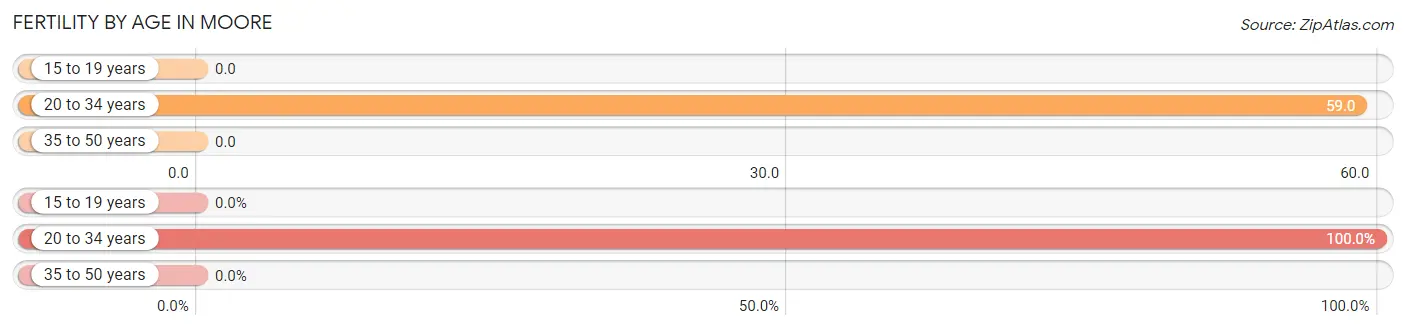
Fertility by Age in Moore
Average fertility rate in Moore is 24.0 births per 1,000 women. Women in the age bracket of 20 to 34 years have the highest fertility rate with 59.0 births per 1,000 women. Women in the age bracket of 20 to 34 years acount for 100.0% of all women with births.
| Age Bracket | Women with Births | Births / 1,000 Women |
| 15 to 19 years | 0 (0.0%) | 0.0 |
| 20 to 34 years | 1 (100.0%) | 59.0 |
| 35 to 50 years | 0 (0.0%) | 0.0 |
| Total | 1 (100.0%) | 24.0 |
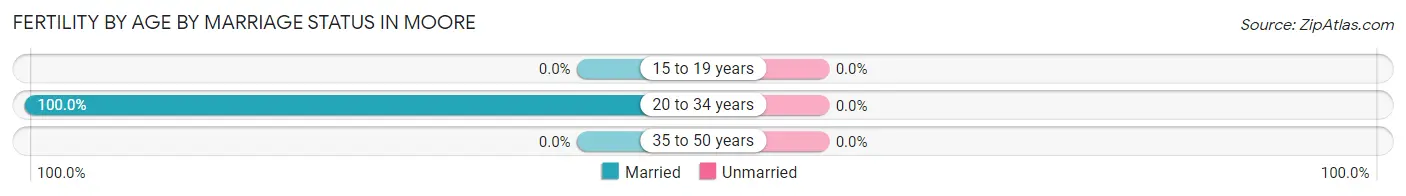
Fertility by Age by Marriage Status in Moore
| Age Bracket | Married | Unmarried |
| 15 to 19 years | 0 (0.0%) | 0 (0.0%) |
| 20 to 34 years | 1 (100.0%) | 0 (0.0%) |
| 35 to 50 years | 0 (0.0%) | 0 (0.0%) |
| Total | 1 (100.0%) | 0 (0.0%) |
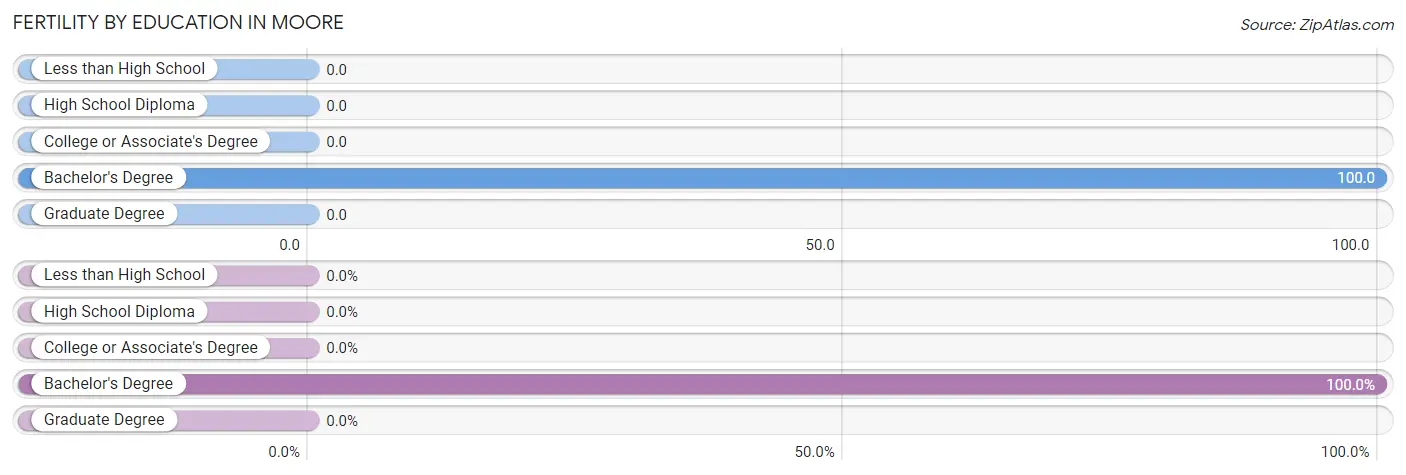
Fertility by Education in Moore
| Educational Attainment | Women with Births | Births / 1,000 Women |
| Less than High School | 0 (0.0%) | 0.0 |
| High School Diploma | 0 (0.0%) | 0.0 |
| College or Associate's Degree | 0 (0.0%) | 0.0 |
| Bachelor's Degree | 1 (100.0%) | 100.0 |
| Graduate Degree | 0 (0.0%) | 0.0 |
| Total | 1 (100.0%) | 24.0 |
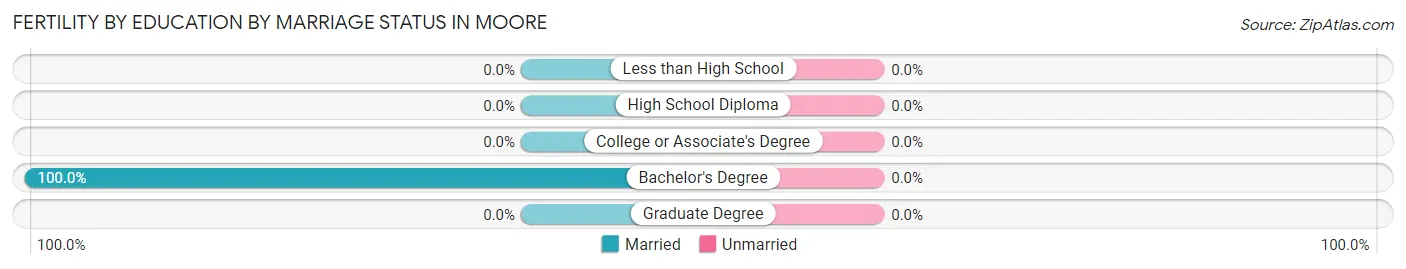
Fertility by Education by Marriage Status in Moore
| Educational Attainment | Married | Unmarried |
| Less than High School | 0 (0.0%) | 0 (0.0%) |
| High School Diploma | 0 (0.0%) | 0 (0.0%) |
| College or Associate's Degree | 0 (0.0%) | 0 (0.0%) |
| Bachelor's Degree | 1 (100.0%) | 0 (0.0%) |
| Graduate Degree | 0 (0.0%) | 0 (0.0%) |
| Total | 1 (100.0%) | 0 (0.0%) |
Employment Characteristics in Moore
Employment by Class of Employer in Moore
Among the 110 employed individuals in Moore, private company employees (70 | 63.6%), not-for-profit organizations (14 | 12.7%), and self-employed (not incorporated) (11 | 10.0%) make up the most common classes of employment.
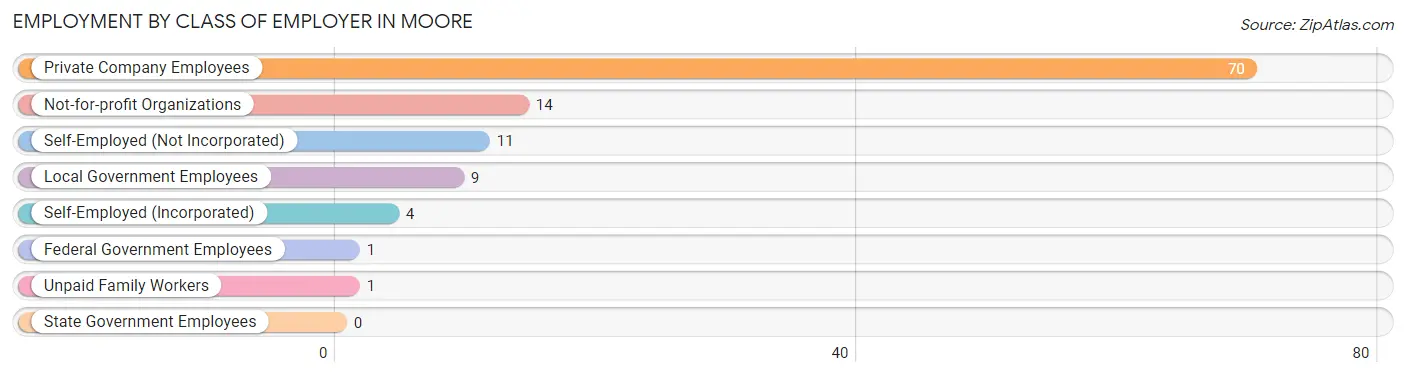
| Employer Class | # Employees | % Employees |
| Private Company Employees | 70 | 63.6% |
| Self-Employed (Incorporated) | 4 | 3.6% |
| Self-Employed (Not Incorporated) | 11 | 10.0% |
| Not-for-profit Organizations | 14 | 12.7% |
| Local Government Employees | 9 | 8.2% |
| State Government Employees | 0 | 0.0% |
| Federal Government Employees | 1 | 0.9% |
| Unpaid Family Workers | 1 | 0.9% |
| Total | 110 | 100.0% |
Employment Status by Age in Moore
According to the labor force statistics for Moore, out of the total population over 16 years of age (215), 52.1% or 112 individuals are in the labor force, with 1.8% or 2 of them unemployed. The age group with the highest labor force participation rate is 55 to 59 years, with 100.0% or 12 individuals in the labor force. Within the labor force, the 20 to 24 years age range has the highest percentage of unemployed individuals, with 11.1% or 2 of them being unemployed.
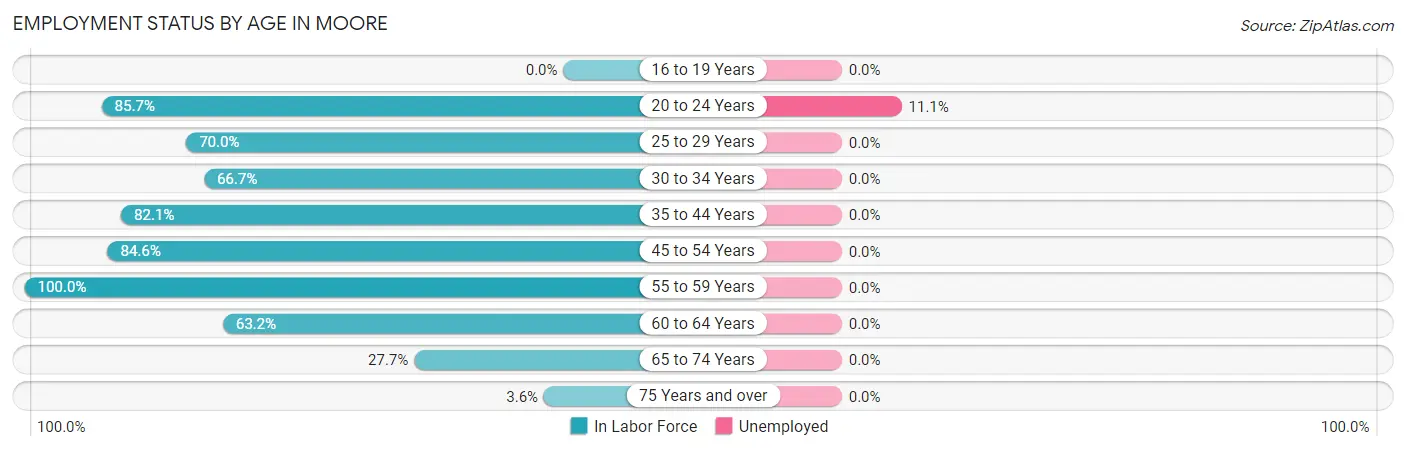
| Age Bracket | In Labor Force | Unemployed |
| 16 to 19 Years | 0 (0.0%) | 0 (0.0%) |
| 20 to 24 Years | 18 (85.7%) | 2 (11.1%) |
| 25 to 29 Years | 7 (70.0%) | 0 (0.0%) |
| 30 to 34 Years | 4 (66.7%) | 0 (0.0%) |
| 35 to 44 Years | 23 (82.1%) | 0 (0.0%) |
| 45 to 54 Years | 22 (84.6%) | 0 (0.0%) |
| 55 to 59 Years | 12 (100.0%) | 0 (0.0%) |
| 60 to 64 Years | 12 (63.2%) | 0 (0.0%) |
| 65 to 74 Years | 13 (27.7%) | 0 (0.0%) |
| 75 Years and over | 1 (3.6%) | 0 (0.0%) |
| Total | 112 (52.1%) | 2 (1.8%) |
Employment Status by Educational Attainment in Moore
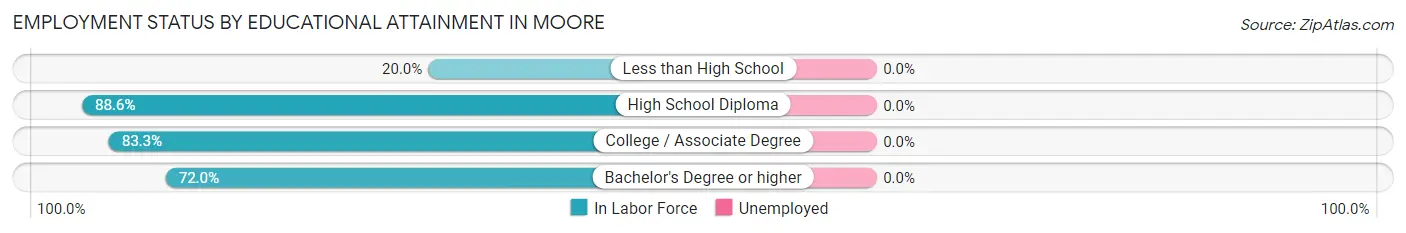
| Educational Attainment | In Labor Force | Unemployed |
| Less than High School | 1 (20.0%) | 0 (0.0%) |
| High School Diploma | 31 (88.6%) | 0 (0.0%) |
| College / Associate Degree | 30 (83.3%) | 0 (0.0%) |
| Bachelor's Degree or higher | 18 (72.0%) | 0 (0.0%) |
| Total | 80 (79.2%) | 0 (0.0%) |
Employment Occupations by Sex in Moore
Management, Business, Science and Arts Occupations
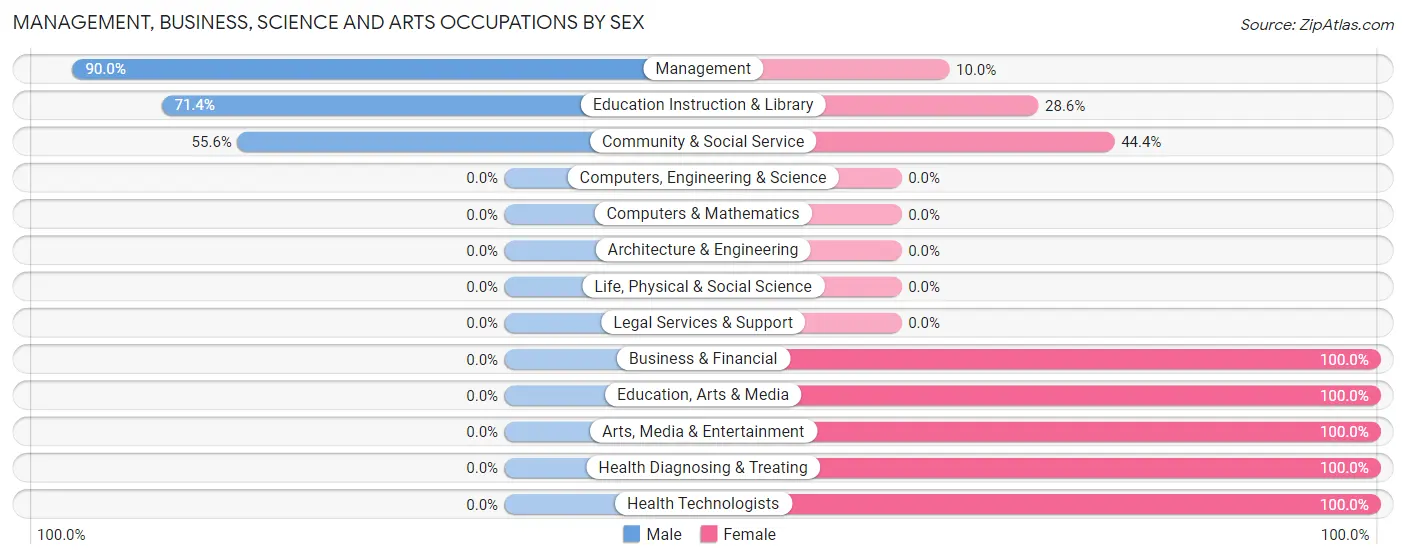
The most common Management, Business, Science and Arts occupations in Moore are Management (10 | 9.1%), Community & Social Service (9 | 8.2%), Education Instruction & Library (7 | 6.4%), Health Diagnosing & Treating (2 | 1.8%), and Health Technologists (2 | 1.8%).
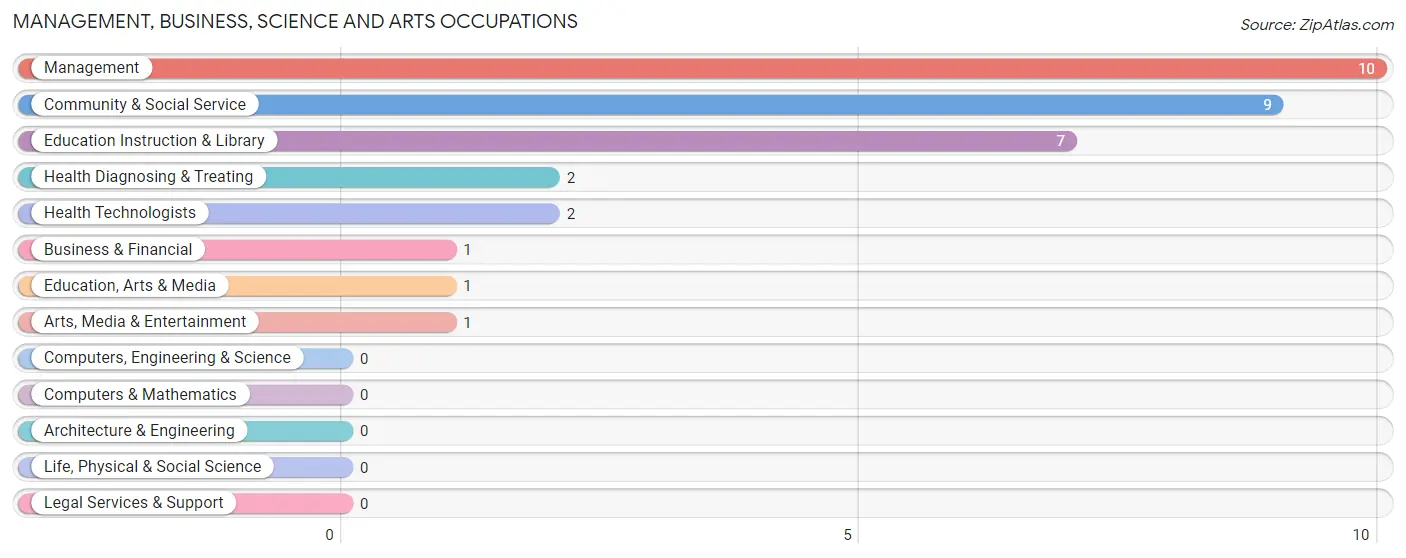
Management, Business, Science and Arts Occupations by Sex
Within the Management, Business, Science and Arts occupations in Moore, the most male-oriented occupations are Management (90.0%), Education Instruction & Library (71.4%), and Community & Social Service (55.6%), while the most female-oriented occupations are Business & Financial (100.0%), Education, Arts & Media (100.0%), and Arts, Media & Entertainment (100.0%).
| Occupation | Male | Female |
| Management | 9 (90.0%) | 1 (10.0%) |
| Business & Financial | 0 (0.0%) | 1 (100.0%) |
| Computers, Engineering & Science | 0 (0.0%) | 0 (0.0%) |
| Computers & Mathematics | 0 (0.0%) | 0 (0.0%) |
| Architecture & Engineering | 0 (0.0%) | 0 (0.0%) |
| Life, Physical & Social Science | 0 (0.0%) | 0 (0.0%) |
| Community & Social Service | 5 (55.6%) | 4 (44.4%) |
| Education, Arts & Media | 0 (0.0%) | 1 (100.0%) |
| Legal Services & Support | 0 (0.0%) | 0 (0.0%) |
| Education Instruction & Library | 5 (71.4%) | 2 (28.6%) |
| Arts, Media & Entertainment | 0 (0.0%) | 1 (100.0%) |
| Health Diagnosing & Treating | 0 (0.0%) | 2 (100.0%) |
| Health Technologists | 0 (0.0%) | 2 (100.0%) |
| Total (Category) | 14 (63.6%) | 8 (36.4%) |
| Total (Overall) | 70 (63.6%) | 40 (36.4%) |
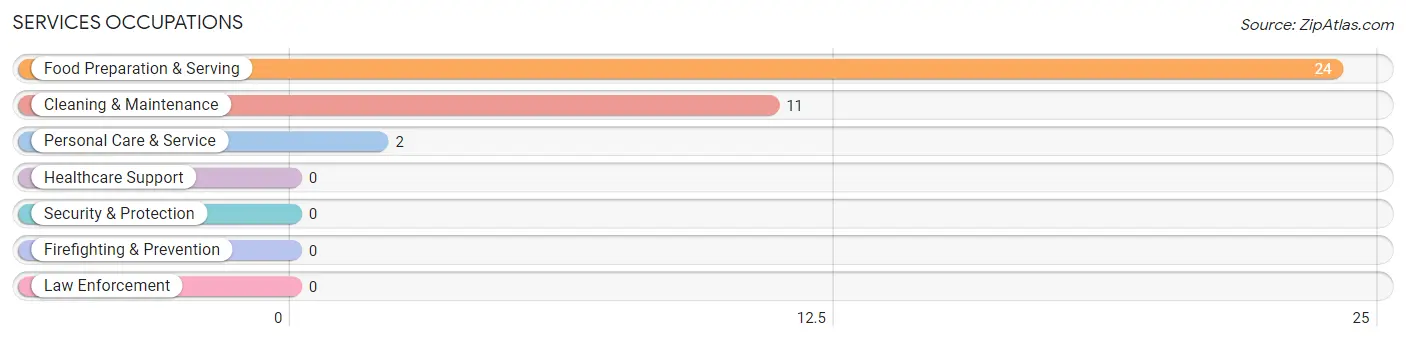
Services Occupations
The most common Services occupations in Moore are Food Preparation & Serving (24 | 21.8%), Cleaning & Maintenance (11 | 10.0%), and Personal Care & Service (2 | 1.8%).
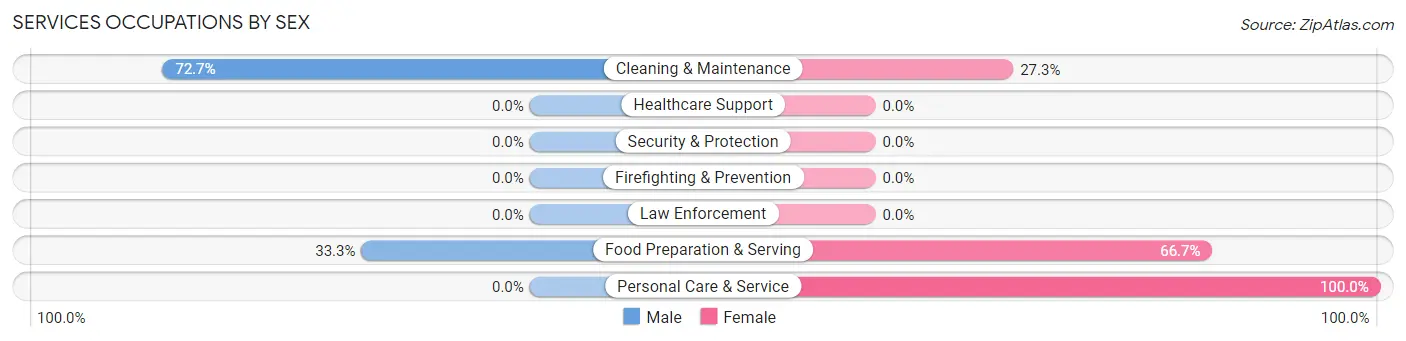
Services Occupations by Sex
Within the Services occupations in Moore, the most male-oriented occupations are Cleaning & Maintenance (72.7%), and Food Preparation & Serving (33.3%), while the most female-oriented occupations are Personal Care & Service (100.0%), Food Preparation & Serving (66.7%), and Cleaning & Maintenance (27.3%).
| Occupation | Male | Female |
| Healthcare Support | 0 (0.0%) | 0 (0.0%) |
| Security & Protection | 0 (0.0%) | 0 (0.0%) |
| Firefighting & Prevention | 0 (0.0%) | 0 (0.0%) |
| Law Enforcement | 0 (0.0%) | 0 (0.0%) |
| Food Preparation & Serving | 8 (33.3%) | 16 (66.7%) |
| Cleaning & Maintenance | 8 (72.7%) | 3 (27.3%) |
| Personal Care & Service | 0 (0.0%) | 2 (100.0%) |
| Total (Category) | 16 (43.2%) | 21 (56.8%) |
| Total (Overall) | 70 (63.6%) | 40 (36.4%) |
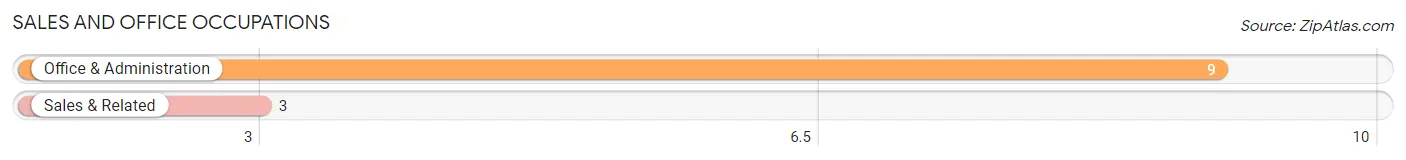
Sales and Office Occupations
The most common Sales and Office occupations in Moore are Office & Administration (9 | 8.2%), and Sales & Related (3 | 2.7%).
Sales and Office Occupations by Sex
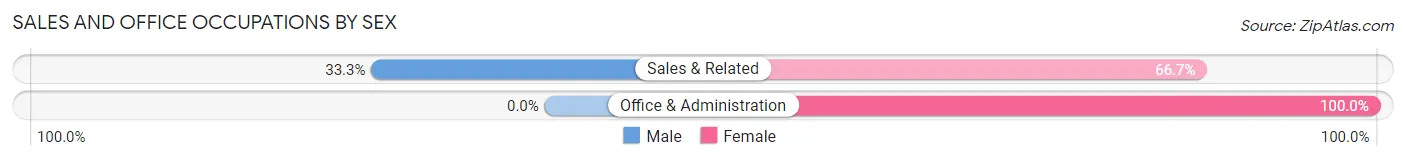
| Occupation | Male | Female |
| Sales & Related | 1 (33.3%) | 2 (66.7%) |
| Office & Administration | 0 (0.0%) | 9 (100.0%) |
| Total (Category) | 1 (8.3%) | 11 (91.7%) |
| Total (Overall) | 70 (63.6%) | 40 (36.4%) |
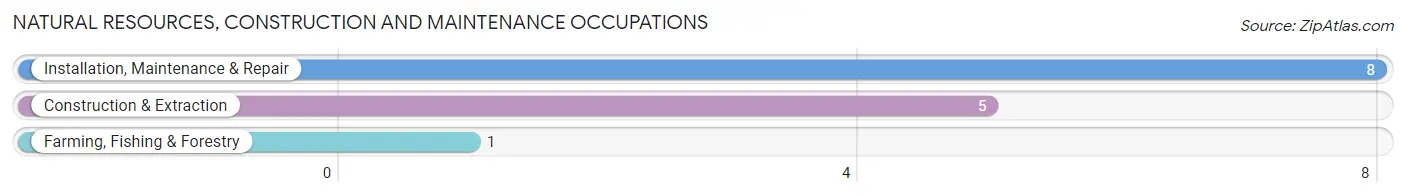
Natural Resources, Construction and Maintenance Occupations
The most common Natural Resources, Construction and Maintenance occupations in Moore are Installation, Maintenance & Repair (8 | 7.3%), Construction & Extraction (5 | 4.5%), and Farming, Fishing & Forestry (1 | 0.9%).
Natural Resources, Construction and Maintenance Occupations by Sex
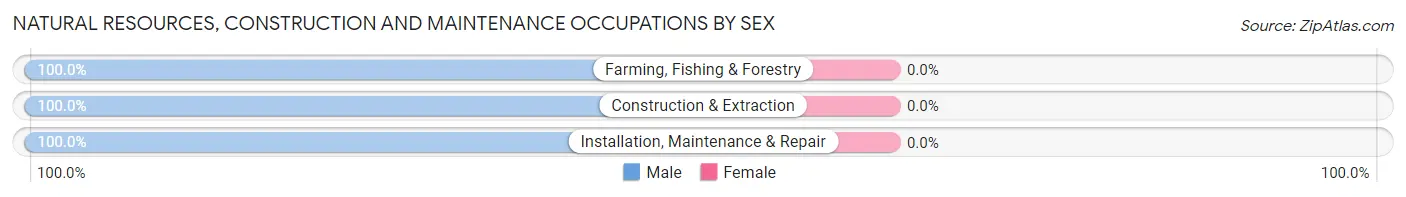
| Occupation | Male | Female |
| Farming, Fishing & Forestry | 1 (100.0%) | 0 (0.0%) |
| Construction & Extraction | 5 (100.0%) | 0 (0.0%) |
| Installation, Maintenance & Repair | 8 (100.0%) | 0 (0.0%) |
| Total (Category) | 14 (100.0%) | 0 (0.0%) |
| Total (Overall) | 70 (63.6%) | 40 (36.4%) |
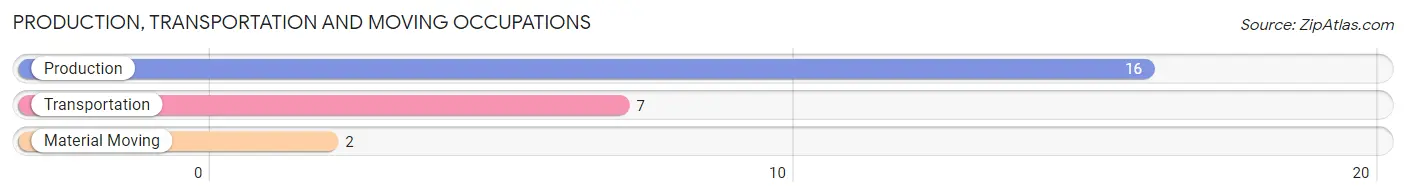
Production, Transportation and Moving Occupations
The most common Production, Transportation and Moving occupations in Moore are Production (16 | 14.5%), Transportation (7 | 6.4%), and Material Moving (2 | 1.8%).
Production, Transportation and Moving Occupations by Sex
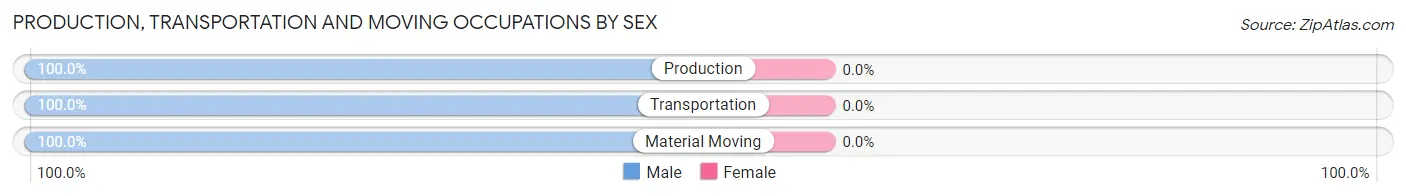
| Occupation | Male | Female |
| Production | 16 (100.0%) | 0 (0.0%) |
| Transportation | 7 (100.0%) | 0 (0.0%) |
| Material Moving | 2 (100.0%) | 0 (0.0%) |
| Total (Category) | 25 (100.0%) | 0 (0.0%) |
| Total (Overall) | 70 (63.6%) | 40 (36.4%) |
Employment Industries by Sex in Moore
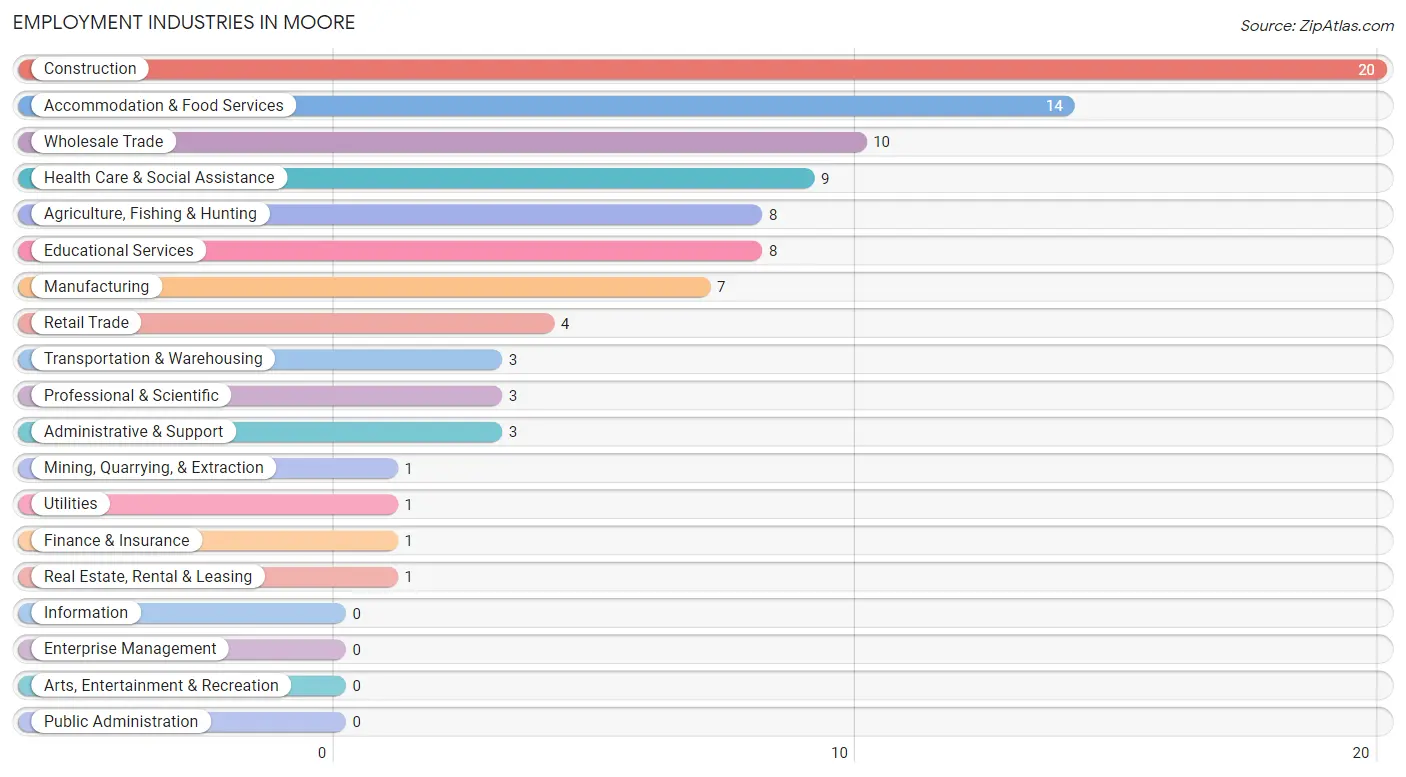
Employment Industries in Moore
The major employment industries in Moore include Construction (20 | 18.2%), Accommodation & Food Services (14 | 12.7%), Wholesale Trade (10 | 9.1%), Health Care & Social Assistance (9 | 8.2%), and Agriculture, Fishing & Hunting (8 | 7.3%).
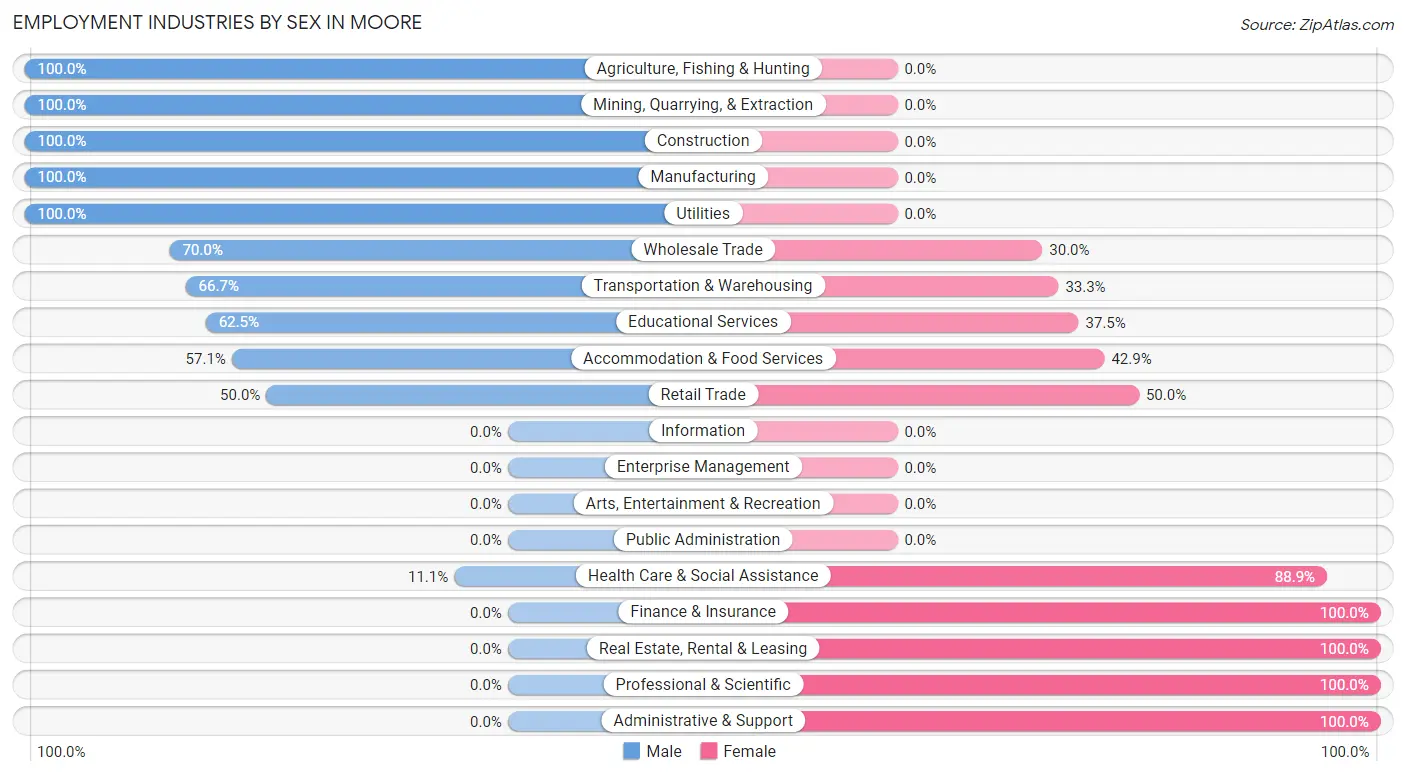
Employment Industries by Sex in Moore
The Moore industries that see more men than women are Agriculture, Fishing & Hunting (100.0%), Mining, Quarrying, & Extraction (100.0%), and Construction (100.0%), whereas the industries that tend to have a higher number of women are Finance & Insurance (100.0%), Real Estate, Rental & Leasing (100.0%), and Professional & Scientific (100.0%).
| Industry | Male | Female |
| Agriculture, Fishing & Hunting | 8 (100.0%) | 0 (0.0%) |
| Mining, Quarrying, & Extraction | 1 (100.0%) | 0 (0.0%) |
| Construction | 20 (100.0%) | 0 (0.0%) |
| Manufacturing | 7 (100.0%) | 0 (0.0%) |
| Wholesale Trade | 7 (70.0%) | 3 (30.0%) |
| Retail Trade | 2 (50.0%) | 2 (50.0%) |
| Transportation & Warehousing | 2 (66.7%) | 1 (33.3%) |
| Utilities | 1 (100.0%) | 0 (0.0%) |
| Information | 0 (0.0%) | 0 (0.0%) |
| Finance & Insurance | 0 (0.0%) | 1 (100.0%) |
| Real Estate, Rental & Leasing | 0 (0.0%) | 1 (100.0%) |
| Professional & Scientific | 0 (0.0%) | 3 (100.0%) |
| Enterprise Management | 0 (0.0%) | 0 (0.0%) |
| Administrative & Support | 0 (0.0%) | 3 (100.0%) |
| Educational Services | 5 (62.5%) | 3 (37.5%) |
| Health Care & Social Assistance | 1 (11.1%) | 8 (88.9%) |
| Arts, Entertainment & Recreation | 0 (0.0%) | 0 (0.0%) |
| Accommodation & Food Services | 8 (57.1%) | 6 (42.9%) |
| Public Administration | 0 (0.0%) | 0 (0.0%) |
| Total | 70 (63.6%) | 40 (36.4%) |
Education in Moore
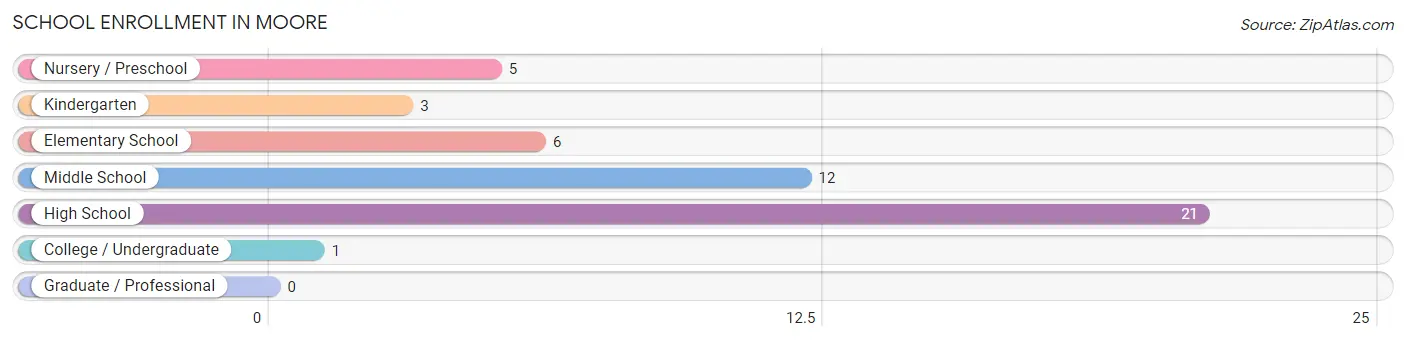
School Enrollment in Moore
The most common levels of schooling among the 48 students in Moore are high school (21 | 43.8%), middle school (12 | 25.0%), and elementary school (6 | 12.5%).
| School Level | # Students | % Students |
| Nursery / Preschool | 5 | 10.4% |
| Kindergarten | 3 | 6.2% |
| Elementary School | 6 | 12.5% |
| Middle School | 12 | 25.0% |
| High School | 21 | 43.8% |
| College / Undergraduate | 1 | 2.1% |
| Graduate / Professional | 0 | 0.0% |
| Total | 48 | 100.0% |
School Enrollment by Age by Funding Source in Moore
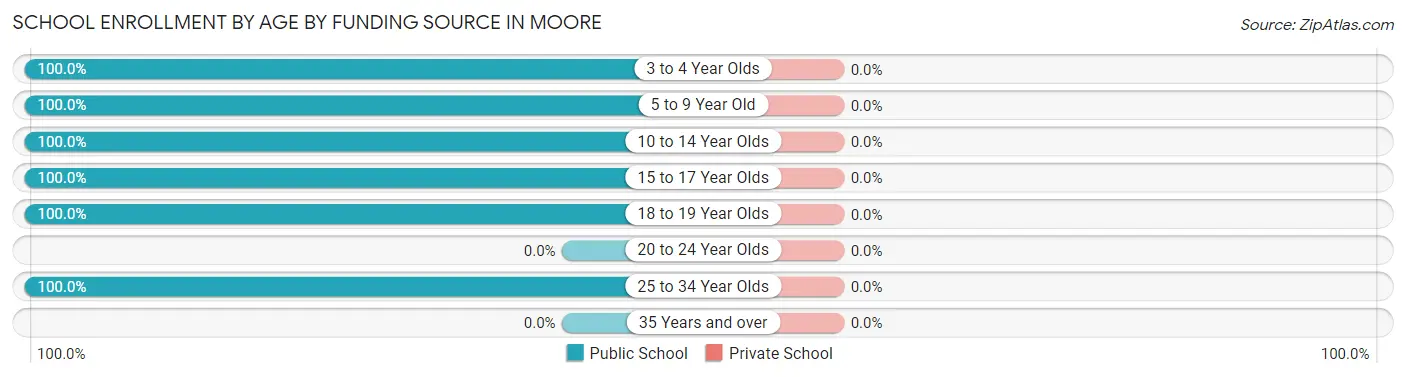
| Age Bracket | Public School | Private School |
| 3 to 4 Year Olds | 3 (100.0%) | 0 (0.0%) |
| 5 to 9 Year Old | 11 (100.0%) | 0 (0.0%) |
| 10 to 14 Year Olds | 7 (100.0%) | 0 (0.0%) |
| 15 to 17 Year Olds | 13 (100.0%) | 0 (0.0%) |
| 18 to 19 Year Olds | 13 (100.0%) | 0 (0.0%) |
| 20 to 24 Year Olds | 0 (0.0%) | 0 (0.0%) |
| 25 to 34 Year Olds | 1 (100.0%) | 0 (0.0%) |
| 35 Years and over | 0 (0.0%) | 0 (0.0%) |
| Total | 48 (100.0%) | 0 (0.0%) |
Educational Attainment by Field of Study in Moore
Education (7 | 23.3%), communications (5 | 16.7%), arts & humanities (5 | 16.7%), bio, nature & agricultural (4 | 13.3%), and science & technology (2 | 6.7%) are the most common fields of study among 30 individuals in Moore who have obtained a bachelor's degree or higher.
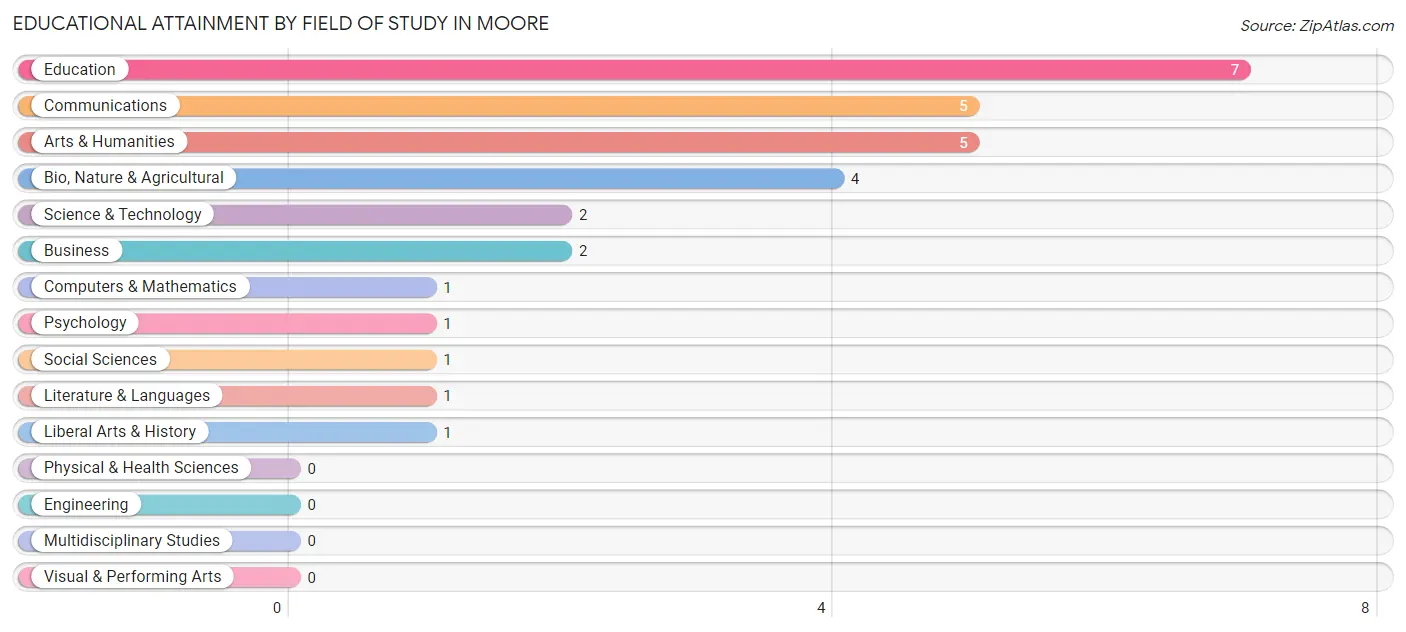
| Field of Study | # Graduates | % Graduates |
| Computers & Mathematics | 1 | 3.3% |
| Bio, Nature & Agricultural | 4 | 13.3% |
| Physical & Health Sciences | 0 | 0.0% |
| Psychology | 1 | 3.3% |
| Social Sciences | 1 | 3.3% |
| Engineering | 0 | 0.0% |
| Multidisciplinary Studies | 0 | 0.0% |
| Science & Technology | 2 | 6.7% |
| Business | 2 | 6.7% |
| Education | 7 | 23.3% |
| Literature & Languages | 1 | 3.3% |
| Liberal Arts & History | 1 | 3.3% |
| Visual & Performing Arts | 0 | 0.0% |
| Communications | 5 | 16.7% |
| Arts & Humanities | 5 | 16.7% |
| Total | 30 | 100.0% |
Transportation & Commute in Moore
Vehicle Availability by Sex in Moore
The most prevalent vehicle ownership categories in Moore are males with 2 vehicles (28, accounting for 40.0%) and females with 2 vehicles (20, making up 70.0%).
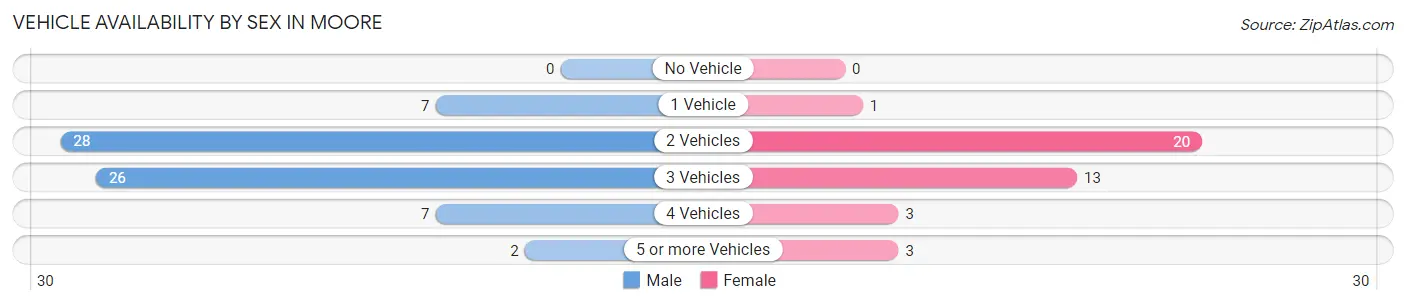
| Vehicles Available | Male | Female |
| No Vehicle | 0 (0.0%) | 0 (0.0%) |
| 1 Vehicle | 7 (10.0%) | 1 (2.5%) |
| 2 Vehicles | 28 (40.0%) | 20 (50.0%) |
| 3 Vehicles | 26 (37.1%) | 13 (32.5%) |
| 4 Vehicles | 7 (10.0%) | 3 (7.5%) |
| 5 or more Vehicles | 2 (2.9%) | 3 (7.5%) |
| Total | 70 (100.0%) | 40 (100.0%) |
Commute Time in Moore
The most frequently occuring commute durations in Moore are less than 5 minutes (25 commuters, 23.4%), 20 to 24 minutes (22 commuters, 20.6%), and 5 to 9 minutes (21 commuters, 19.6%).
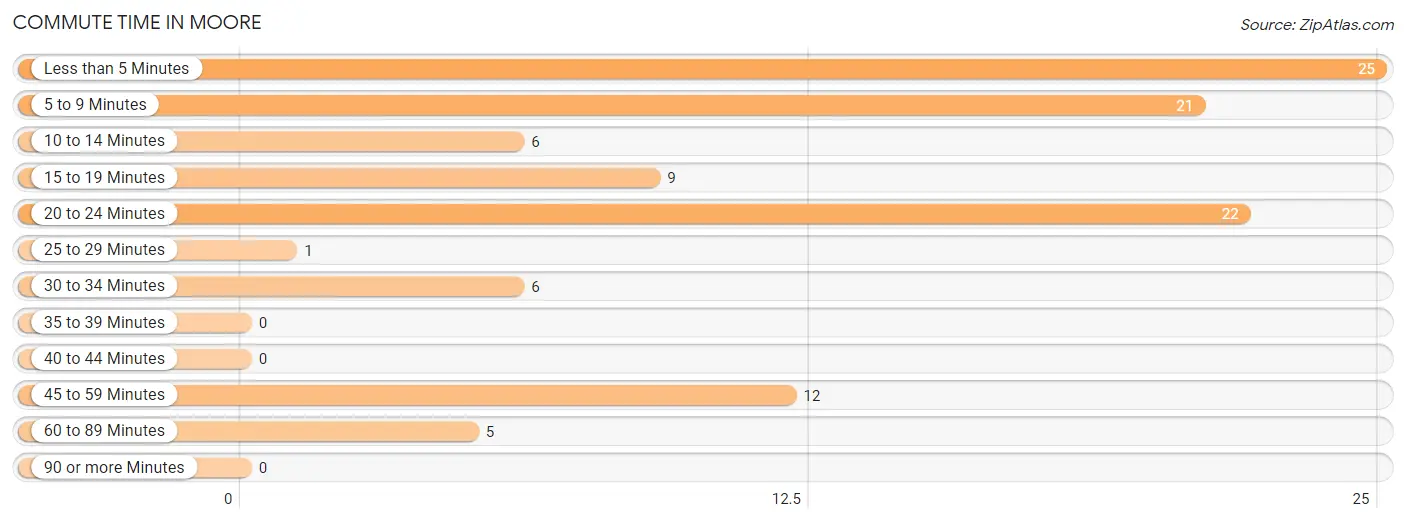
| Commute Time | # Commuters | % Commuters |
| Less than 5 Minutes | 25 | 23.4% |
| 5 to 9 Minutes | 21 | 19.6% |
| 10 to 14 Minutes | 6 | 5.6% |
| 15 to 19 Minutes | 9 | 8.4% |
| 20 to 24 Minutes | 22 | 20.6% |
| 25 to 29 Minutes | 1 | 0.9% |
| 30 to 34 Minutes | 6 | 5.6% |
| 35 to 39 Minutes | 0 | 0.0% |
| 40 to 44 Minutes | 0 | 0.0% |
| 45 to 59 Minutes | 12 | 11.2% |
| 60 to 89 Minutes | 5 | 4.7% |
| 90 or more Minutes | 0 | 0.0% |
Commute Time by Sex in Moore
The most common commute times in Moore are less than 5 minutes (18 commuters, 25.7%) for males and 20 to 24 minutes (12 commuters, 32.4%) for females.
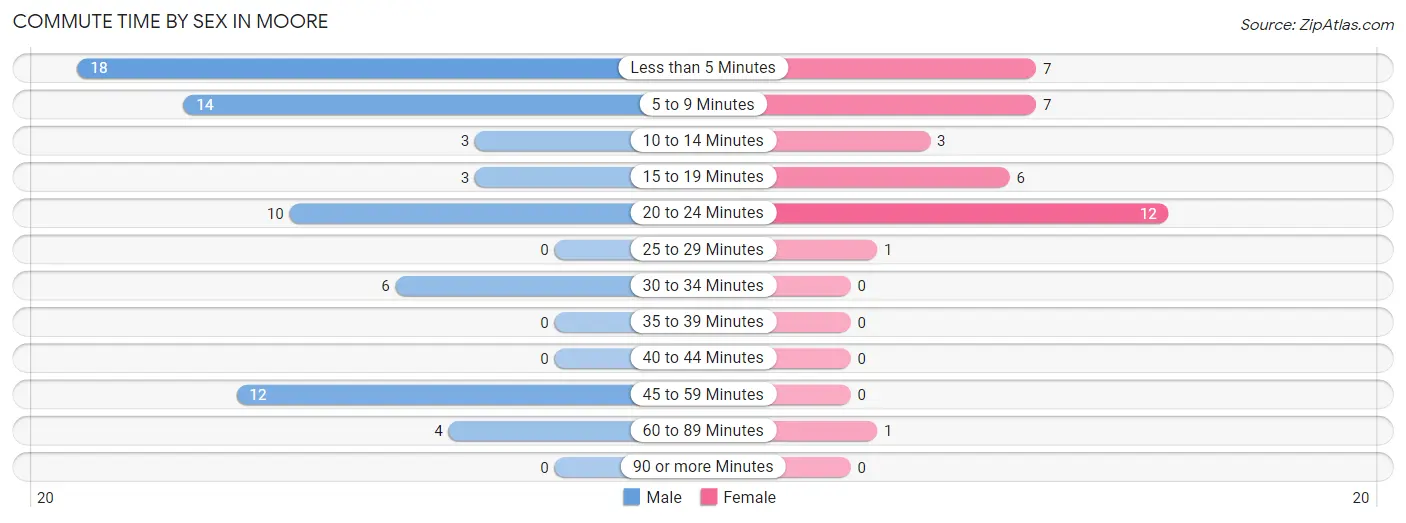
| Commute Time | Male | Female |
| Less than 5 Minutes | 18 (25.7%) | 7 (18.9%) |
| 5 to 9 Minutes | 14 (20.0%) | 7 (18.9%) |
| 10 to 14 Minutes | 3 (4.3%) | 3 (8.1%) |
| 15 to 19 Minutes | 3 (4.3%) | 6 (16.2%) |
| 20 to 24 Minutes | 10 (14.3%) | 12 (32.4%) |
| 25 to 29 Minutes | 0 (0.0%) | 1 (2.7%) |
| 30 to 34 Minutes | 6 (8.6%) | 0 (0.0%) |
| 35 to 39 Minutes | 0 (0.0%) | 0 (0.0%) |
| 40 to 44 Minutes | 0 (0.0%) | 0 (0.0%) |
| 45 to 59 Minutes | 12 (17.1%) | 0 (0.0%) |
| 60 to 89 Minutes | 4 (5.7%) | 1 (2.7%) |
| 90 or more Minutes | 0 (0.0%) | 0 (0.0%) |
Time of Departure to Work by Sex in Moore
The most frequent times of departure to work in Moore are 12:00 PM to 3:59 PM (14, 20.0%) for males and 11:00 AM to 11:59 AM (14, 37.8%) for females.
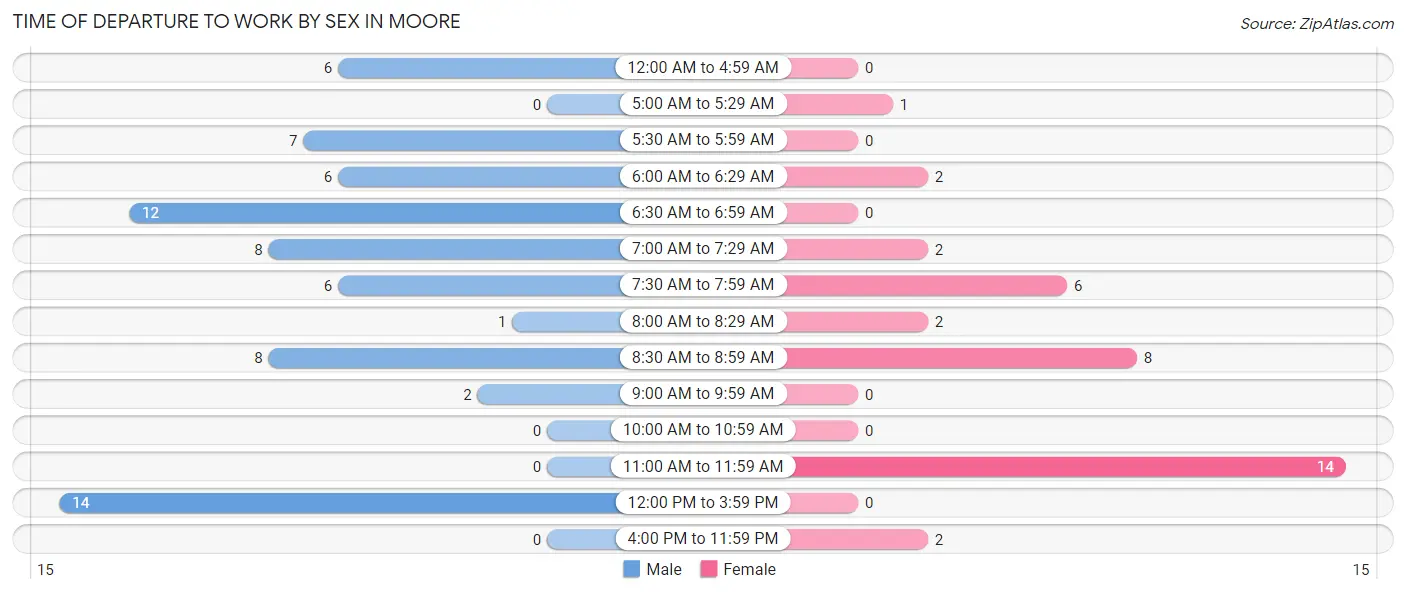
| Time of Departure | Male | Female |
| 12:00 AM to 4:59 AM | 6 (8.6%) | 0 (0.0%) |
| 5:00 AM to 5:29 AM | 0 (0.0%) | 1 (2.7%) |
| 5:30 AM to 5:59 AM | 7 (10.0%) | 0 (0.0%) |
| 6:00 AM to 6:29 AM | 6 (8.6%) | 2 (5.4%) |
| 6:30 AM to 6:59 AM | 12 (17.1%) | 0 (0.0%) |
| 7:00 AM to 7:29 AM | 8 (11.4%) | 2 (5.4%) |
| 7:30 AM to 7:59 AM | 6 (8.6%) | 6 (16.2%) |
| 8:00 AM to 8:29 AM | 1 (1.4%) | 2 (5.4%) |
| 8:30 AM to 8:59 AM | 8 (11.4%) | 8 (21.6%) |
| 9:00 AM to 9:59 AM | 2 (2.9%) | 0 (0.0%) |
| 10:00 AM to 10:59 AM | 0 (0.0%) | 0 (0.0%) |
| 11:00 AM to 11:59 AM | 0 (0.0%) | 14 (37.8%) |
| 12:00 PM to 3:59 PM | 14 (20.0%) | 0 (0.0%) |
| 4:00 PM to 11:59 PM | 0 (0.0%) | 2 (5.4%) |
| Total | 70 (100.0%) | 37 (100.0%) |
Housing Occupancy in Moore
Occupancy by Ownership in Moore
Of the total 115 dwellings in Moore, owner-occupied units account for 80 (69.6%), while renter-occupied units make up 35 (30.4%).
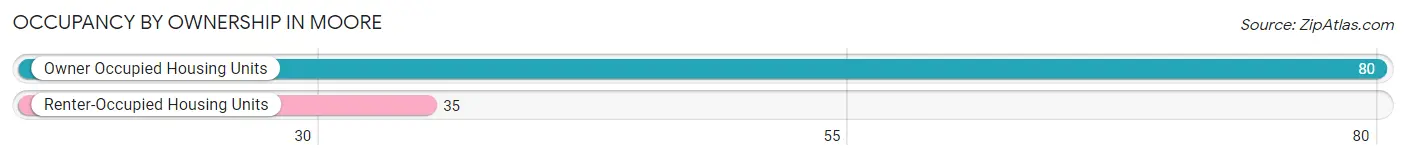
| Occupancy | # Housing Units | % Housing Units |
| Owner Occupied Housing Units | 80 | 69.6% |
| Renter-Occupied Housing Units | 35 | 30.4% |
| Total Occupied Housing Units | 115 | 100.0% |
Occupancy by Household Size in Moore
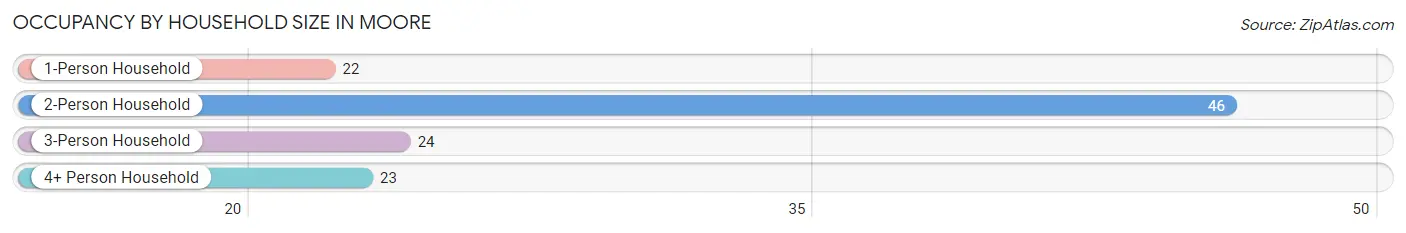
| Household Size | # Housing Units | % Housing Units |
| 1-Person Household | 22 | 19.1% |
| 2-Person Household | 46 | 40.0% |
| 3-Person Household | 24 | 20.9% |
| 4+ Person Household | 23 | 20.0% |
| Total Housing Units | 115 | 100.0% |
Occupancy by Ownership by Household Size in Moore
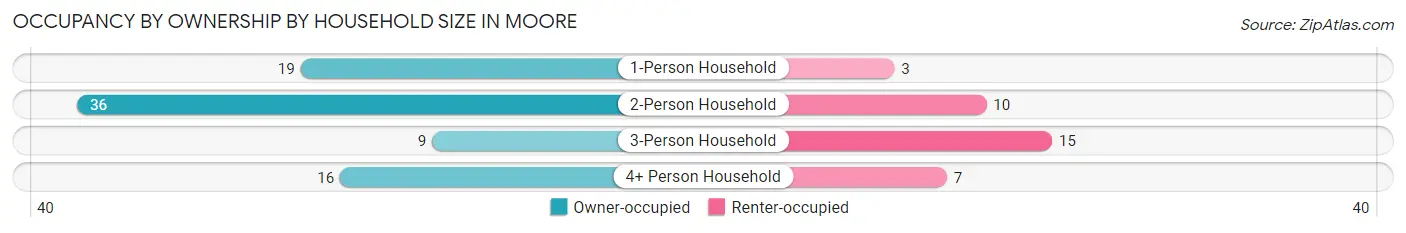
| Household Size | Owner-occupied | Renter-occupied |
| 1-Person Household | 19 (86.4%) | 3 (13.6%) |
| 2-Person Household | 36 (78.3%) | 10 (21.7%) |
| 3-Person Household | 9 (37.5%) | 15 (62.5%) |
| 4+ Person Household | 16 (69.6%) | 7 (30.4%) |
| Total Housing Units | 80 (69.6%) | 35 (30.4%) |
Occupancy by Educational Attainment in Moore
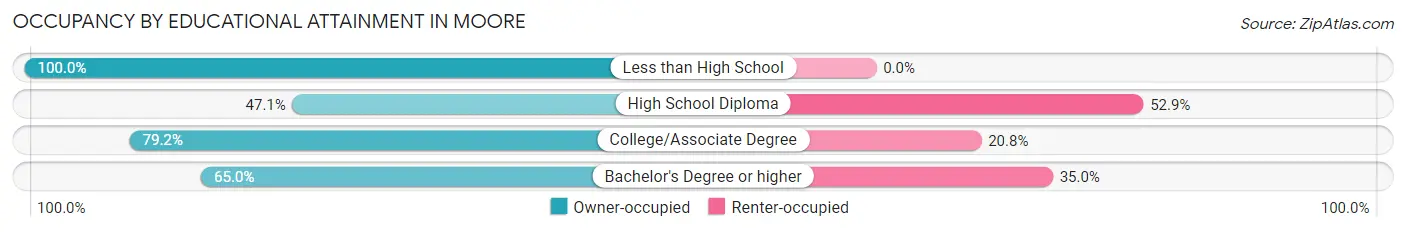
| Household Size | Owner-occupied | Renter-occupied |
| Less than High School | 13 (100.0%) | 0 (0.0%) |
| High School Diploma | 16 (47.1%) | 18 (52.9%) |
| College/Associate Degree | 38 (79.2%) | 10 (20.8%) |
| Bachelor's Degree or higher | 13 (65.0%) | 7 (35.0%) |
Occupancy by Age of Householder in Moore
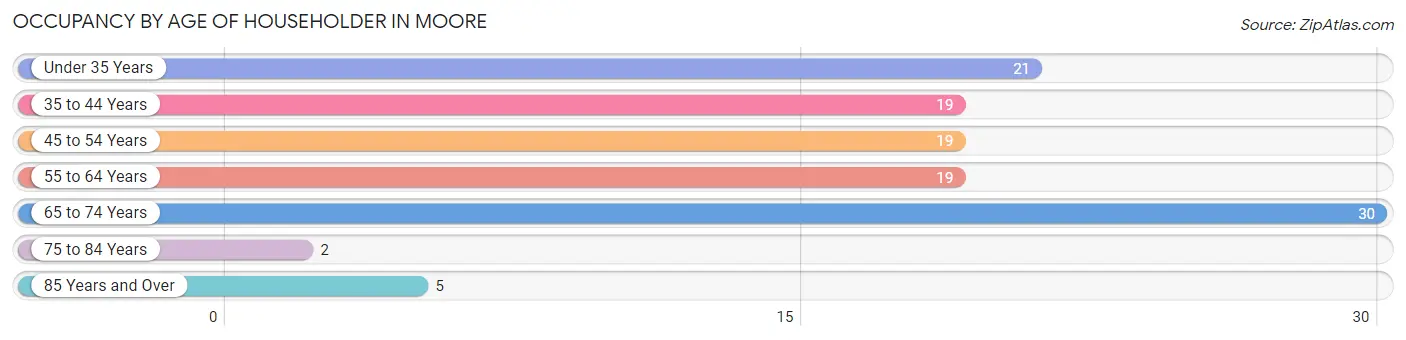
| Age Bracket | # Households | % Households |
| Under 35 Years | 21 | 18.3% |
| 35 to 44 Years | 19 | 16.5% |
| 45 to 54 Years | 19 | 16.5% |
| 55 to 64 Years | 19 | 16.5% |
| 65 to 74 Years | 30 | 26.1% |
| 75 to 84 Years | 2 | 1.7% |
| 85 Years and Over | 5 | 4.3% |
| Total | 115 | 100.0% |
Housing Finances in Moore
Median Income by Occupancy in Moore
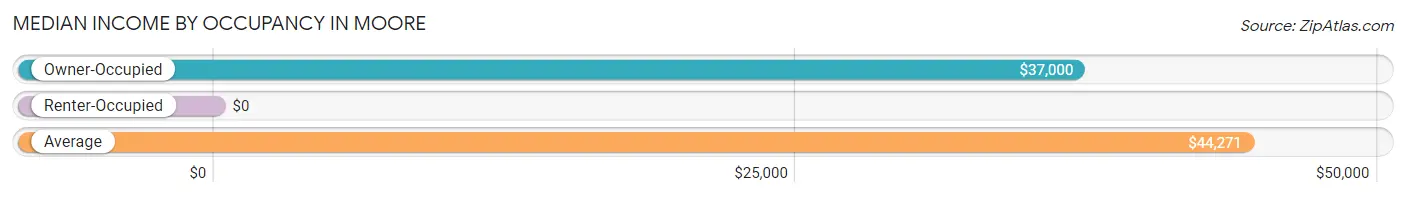
| Occupancy Type | # Households | Median Income |
| Owner-Occupied | 80 (69.6%) | $37,000 |
| Renter-Occupied | 35 (30.4%) | $0 |
| Average | 115 (100.0%) | $44,271 |
Occupancy by Householder Income Bracket in Moore
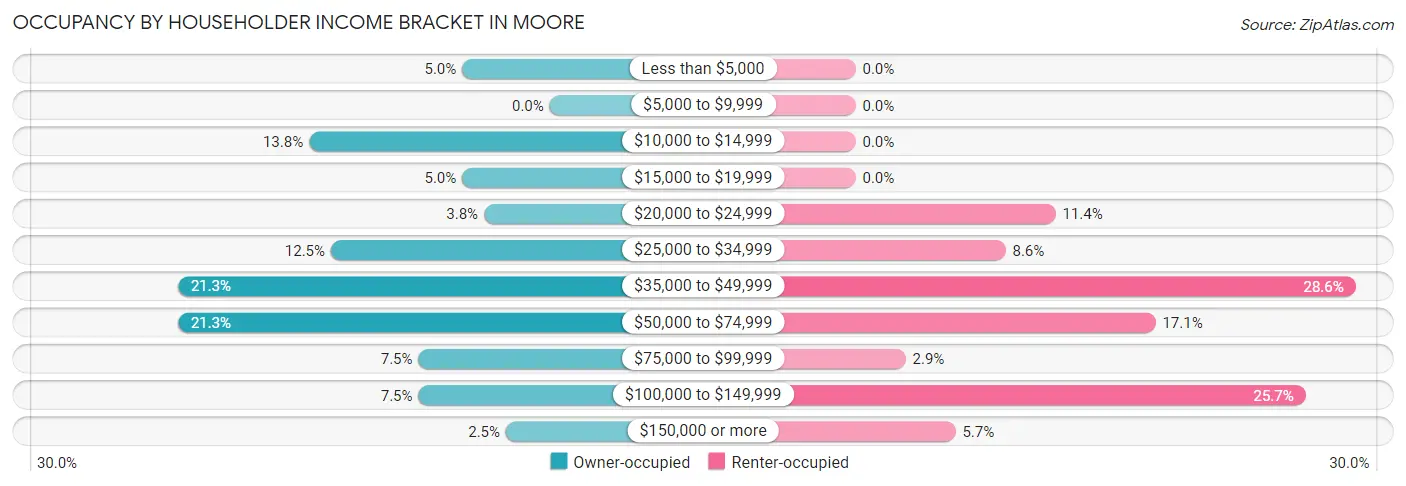
| Income Bracket | Owner-occupied | Renter-occupied |
| Less than $5,000 | 4 (5.0%) | 0 (0.0%) |
| $5,000 to $9,999 | 0 (0.0%) | 0 (0.0%) |
| $10,000 to $14,999 | 11 (13.8%) | 0 (0.0%) |
| $15,000 to $19,999 | 4 (5.0%) | 0 (0.0%) |
| $20,000 to $24,999 | 3 (3.7%) | 4 (11.4%) |
| $25,000 to $34,999 | 10 (12.5%) | 3 (8.6%) |
| $35,000 to $49,999 | 17 (21.2%) | 10 (28.6%) |
| $50,000 to $74,999 | 17 (21.2%) | 6 (17.1%) |
| $75,000 to $99,999 | 6 (7.5%) | 1 (2.9%) |
| $100,000 to $149,999 | 6 (7.5%) | 9 (25.7%) |
| $150,000 or more | 2 (2.5%) | 2 (5.7%) |
| Total | 80 (100.0%) | 35 (100.0%) |
Monthly Housing Cost Tiers in Moore
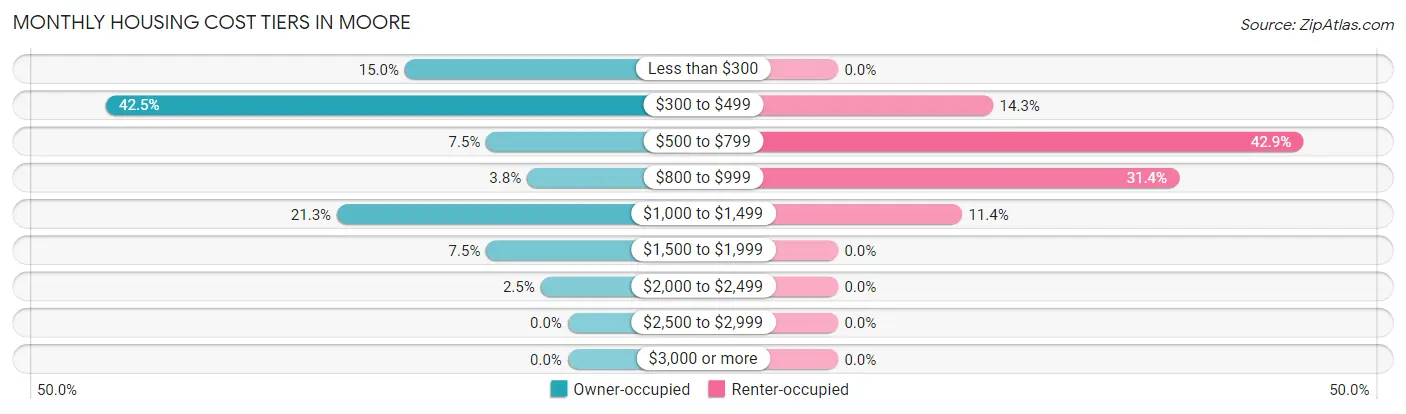
| Monthly Cost | Owner-occupied | Renter-occupied |
| Less than $300 | 12 (15.0%) | 0 (0.0%) |
| $300 to $499 | 34 (42.5%) | 5 (14.3%) |
| $500 to $799 | 6 (7.5%) | 15 (42.9%) |
| $800 to $999 | 3 (3.7%) | 11 (31.4%) |
| $1,000 to $1,499 | 17 (21.2%) | 4 (11.4%) |
| $1,500 to $1,999 | 6 (7.5%) | 0 (0.0%) |
| $2,000 to $2,499 | 2 (2.5%) | 0 (0.0%) |
| $2,500 to $2,999 | 0 (0.0%) | 0 (0.0%) |
| $3,000 or more | 0 (0.0%) | 0 (0.0%) |
| Total | 80 (100.0%) | 35 (100.0%) |
Physical Housing Characteristics in Moore
Housing Structures in Moore
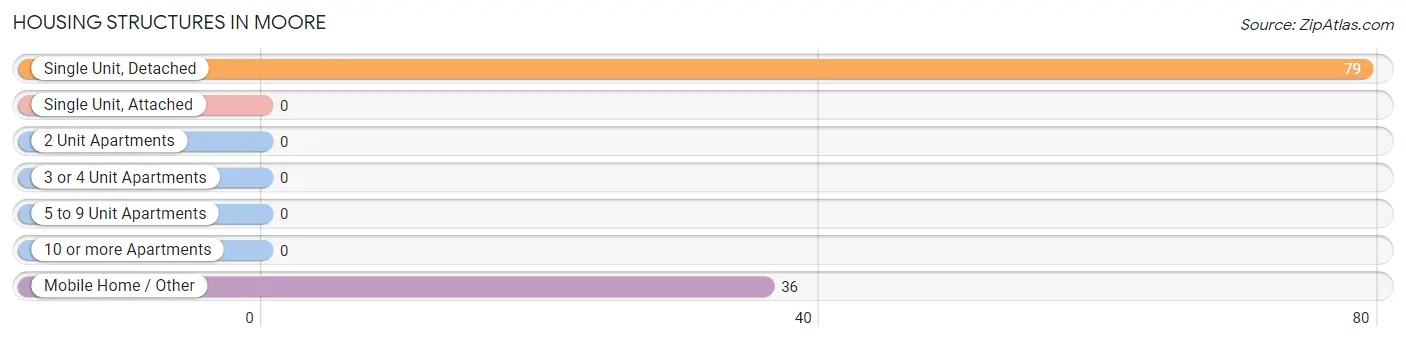
| Structure Type | # Housing Units | % Housing Units |
| Single Unit, Detached | 79 | 68.7% |
| Single Unit, Attached | 0 | 0.0% |
| 2 Unit Apartments | 0 | 0.0% |
| 3 or 4 Unit Apartments | 0 | 0.0% |
| 5 to 9 Unit Apartments | 0 | 0.0% |
| 10 or more Apartments | 0 | 0.0% |
| Mobile Home / Other | 36 | 31.3% |
| Total | 115 | 100.0% |
Housing Structures by Occupancy in Moore
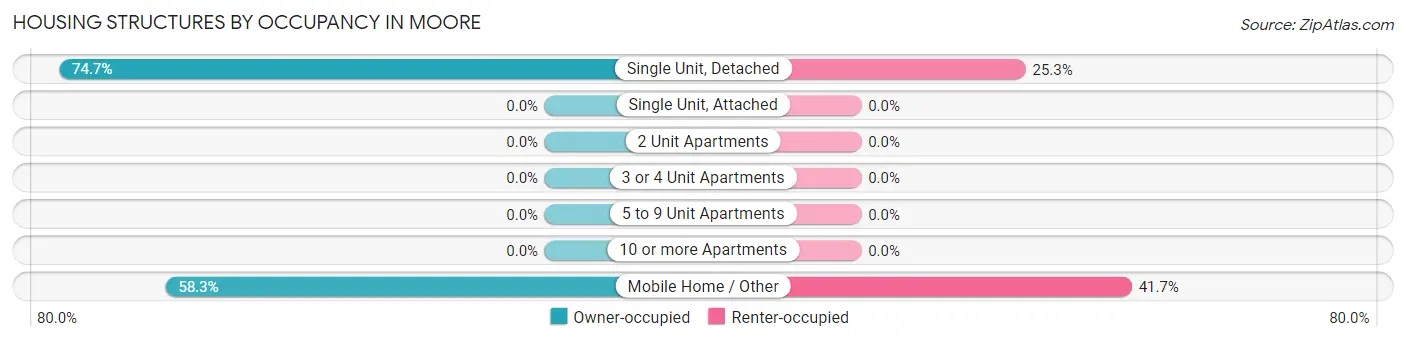
| Structure Type | Owner-occupied | Renter-occupied |
| Single Unit, Detached | 59 (74.7%) | 20 (25.3%) |
| Single Unit, Attached | 0 (0.0%) | 0 (0.0%) |
| 2 Unit Apartments | 0 (0.0%) | 0 (0.0%) |
| 3 or 4 Unit Apartments | 0 (0.0%) | 0 (0.0%) |
| 5 to 9 Unit Apartments | 0 (0.0%) | 0 (0.0%) |
| 10 or more Apartments | 0 (0.0%) | 0 (0.0%) |
| Mobile Home / Other | 21 (58.3%) | 15 (41.7%) |
| Total | 80 (69.6%) | 35 (30.4%) |
Housing Structures by Number of Rooms in Moore
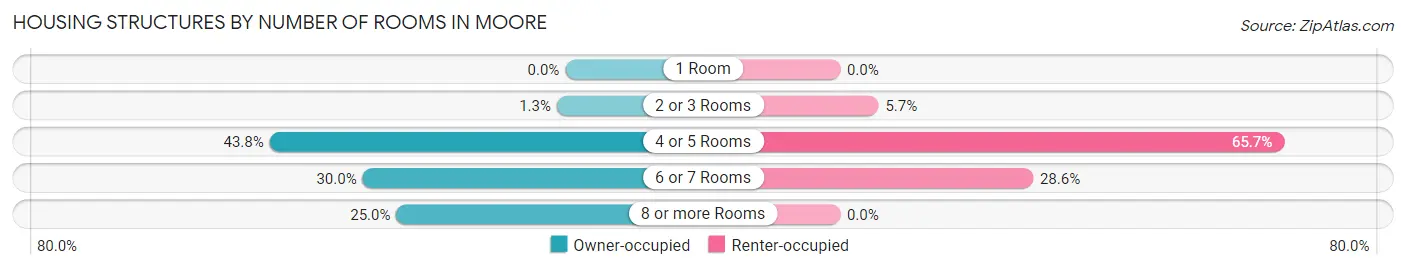
| Number of Rooms | Owner-occupied | Renter-occupied |
| 1 Room | 0 (0.0%) | 0 (0.0%) |
| 2 or 3 Rooms | 1 (1.3%) | 2 (5.7%) |
| 4 or 5 Rooms | 35 (43.8%) | 23 (65.7%) |
| 6 or 7 Rooms | 24 (30.0%) | 10 (28.6%) |
| 8 or more Rooms | 20 (25.0%) | 0 (0.0%) |
| Total | 80 (100.0%) | 35 (100.0%) |
Housing Structure by Heating Type in Moore
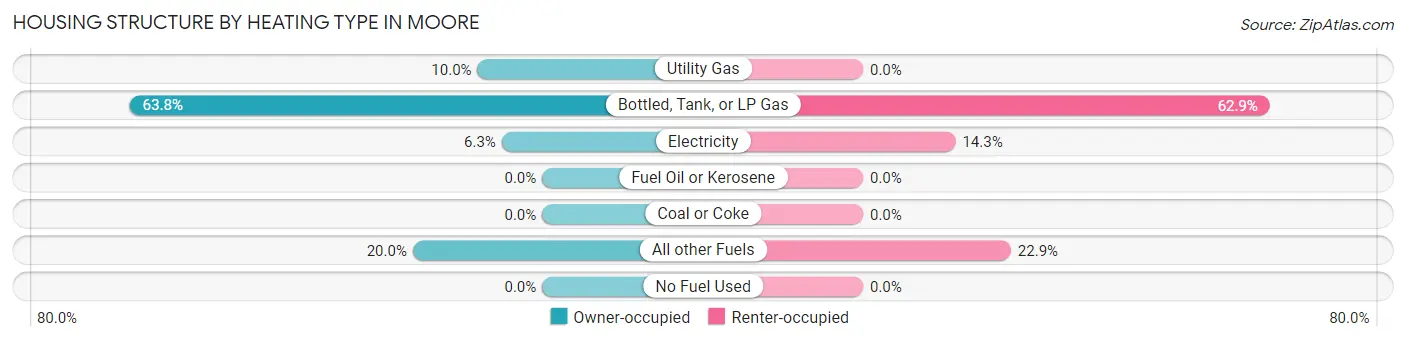
| Heating Type | Owner-occupied | Renter-occupied |
| Utility Gas | 8 (10.0%) | 0 (0.0%) |
| Bottled, Tank, or LP Gas | 51 (63.7%) | 22 (62.9%) |
| Electricity | 5 (6.2%) | 5 (14.3%) |
| Fuel Oil or Kerosene | 0 (0.0%) | 0 (0.0%) |
| Coal or Coke | 0 (0.0%) | 0 (0.0%) |
| All other Fuels | 16 (20.0%) | 8 (22.9%) |
| No Fuel Used | 0 (0.0%) | 0 (0.0%) |
| Total | 80 (100.0%) | 35 (100.0%) |
Household Vehicle Usage in Moore
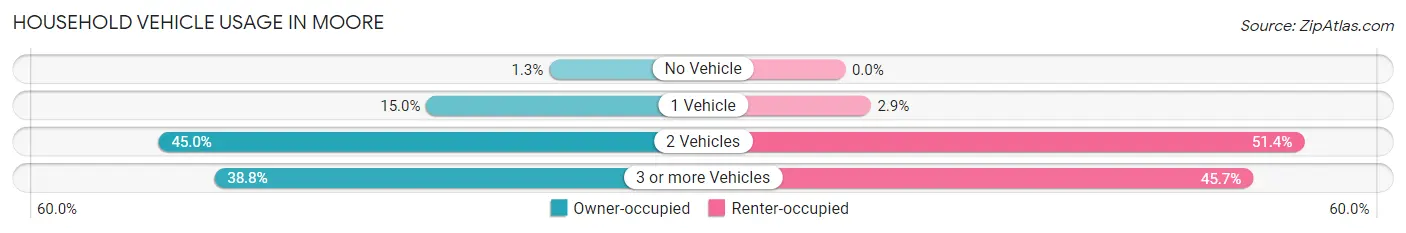
| Vehicles per Household | Owner-occupied | Renter-occupied |
| No Vehicle | 1 (1.3%) | 0 (0.0%) |
| 1 Vehicle | 12 (15.0%) | 1 (2.9%) |
| 2 Vehicles | 36 (45.0%) | 18 (51.4%) |
| 3 or more Vehicles | 31 (38.8%) | 16 (45.7%) |
| Total | 80 (100.0%) | 35 (100.0%) |
Real Estate & Mortgages in Moore
Real Estate and Mortgage Overview in Moore
| Characteristic | Without Mortgage | With Mortgage |
| Housing Units | 45 | 35 |
| Median Property Value | $121,600 | $143,800 |
| Median Household Income | $33,906 | $2 |
| Monthly Housing Costs | $333 | $0 |
| Real Estate Taxes | $665 | $0 |
Property Value by Mortgage Status in Moore
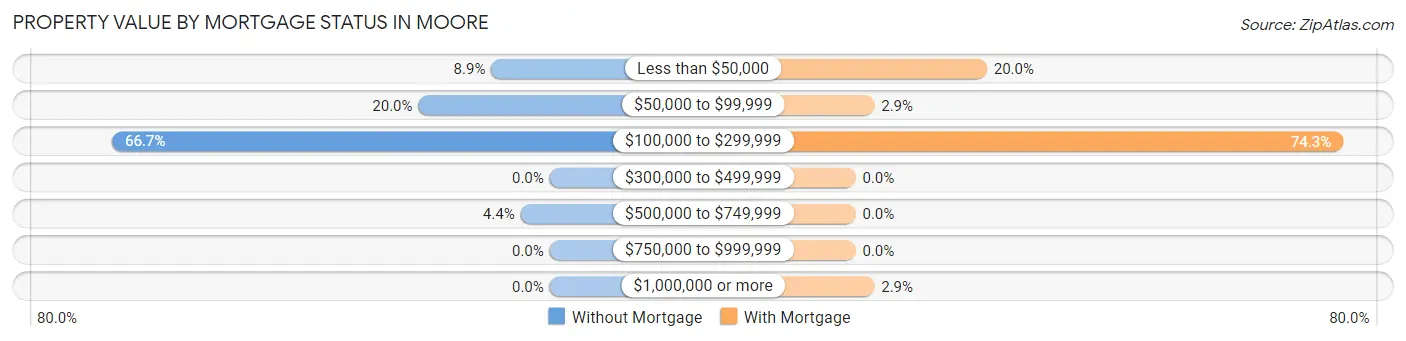
| Property Value | Without Mortgage | With Mortgage |
| Less than $50,000 | 4 (8.9%) | 7 (20.0%) |
| $50,000 to $99,999 | 9 (20.0%) | 1 (2.9%) |
| $100,000 to $299,999 | 30 (66.7%) | 26 (74.3%) |
| $300,000 to $499,999 | 0 (0.0%) | 0 (0.0%) |
| $500,000 to $749,999 | 2 (4.4%) | 0 (0.0%) |
| $750,000 to $999,999 | 0 (0.0%) | 0 (0.0%) |
| $1,000,000 or more | 0 (0.0%) | 1 (2.9%) |
| Total | 45 (100.0%) | 35 (100.0%) |
Household Income by Mortgage Status in Moore
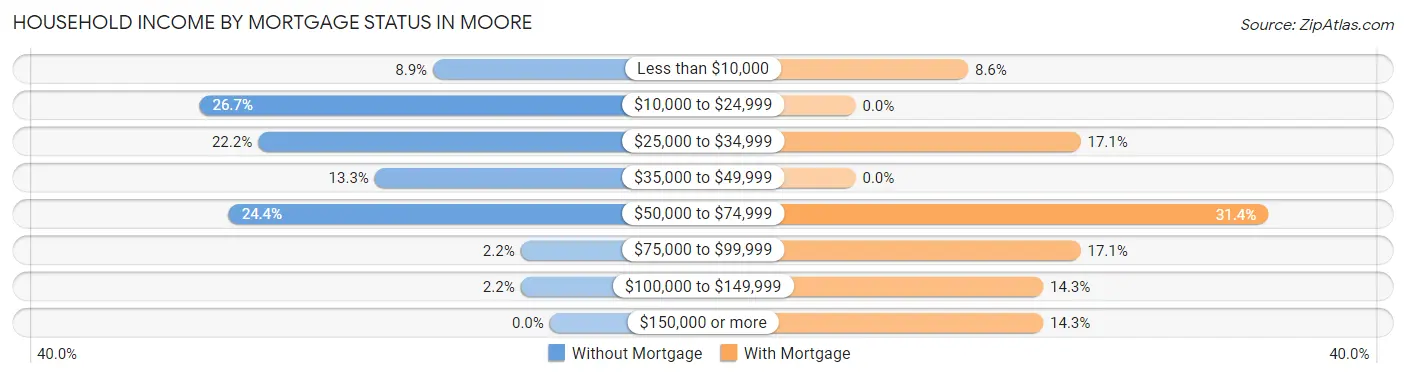
| Household Income | Without Mortgage | With Mortgage |
| Less than $10,000 | 4 (8.9%) | 3 (8.6%) |
| $10,000 to $24,999 | 12 (26.7%) | 0 (0.0%) |
| $25,000 to $34,999 | 10 (22.2%) | 6 (17.1%) |
| $35,000 to $49,999 | 6 (13.3%) | 0 (0.0%) |
| $50,000 to $74,999 | 11 (24.4%) | 11 (31.4%) |
| $75,000 to $99,999 | 1 (2.2%) | 6 (17.1%) |
| $100,000 to $149,999 | 1 (2.2%) | 5 (14.3%) |
| $150,000 or more | 0 (0.0%) | 5 (14.3%) |
| Total | 45 (100.0%) | 35 (100.0%) |
Property Value to Household Income Ratio in Moore
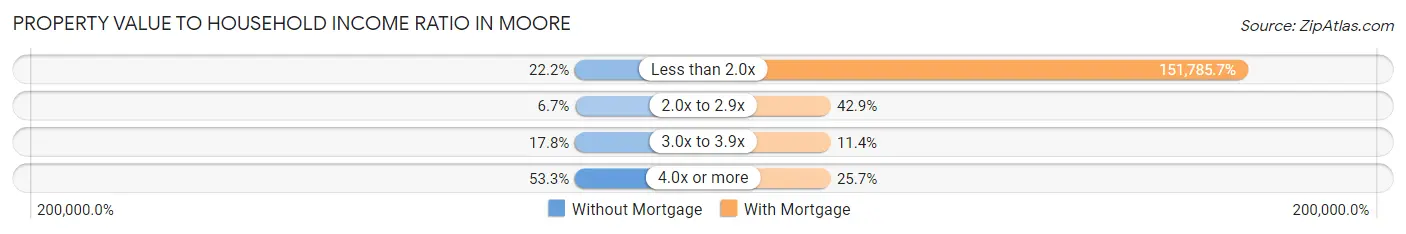
| Value-to-Income Ratio | Without Mortgage | With Mortgage |
| Less than 2.0x | 10 (22.2%) | 53,125 (151,785.7%) |
| 2.0x to 2.9x | 3 (6.7%) | 15 (42.9%) |
| 3.0x to 3.9x | 8 (17.8%) | 4 (11.4%) |
| 4.0x or more | 24 (53.3%) | 9 (25.7%) |
| Total | 45 (100.0%) | 35 (100.0%) |
Real Estate Taxes by Mortgage Status in Moore
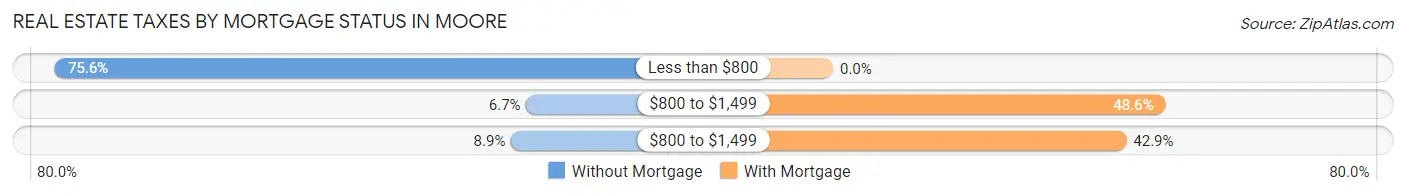
| Property Taxes | Without Mortgage | With Mortgage |
| Less than $800 | 34 (75.6%) | 0 (0.0%) |
| $800 to $1,499 | 3 (6.7%) | 17 (48.6%) |
| $800 to $1,499 | 4 (8.9%) | 15 (42.9%) |
| Total | 45 (100.0%) | 35 (100.0%) |
Health & Disability in Moore
Health Insurance Coverage by Age in Moore
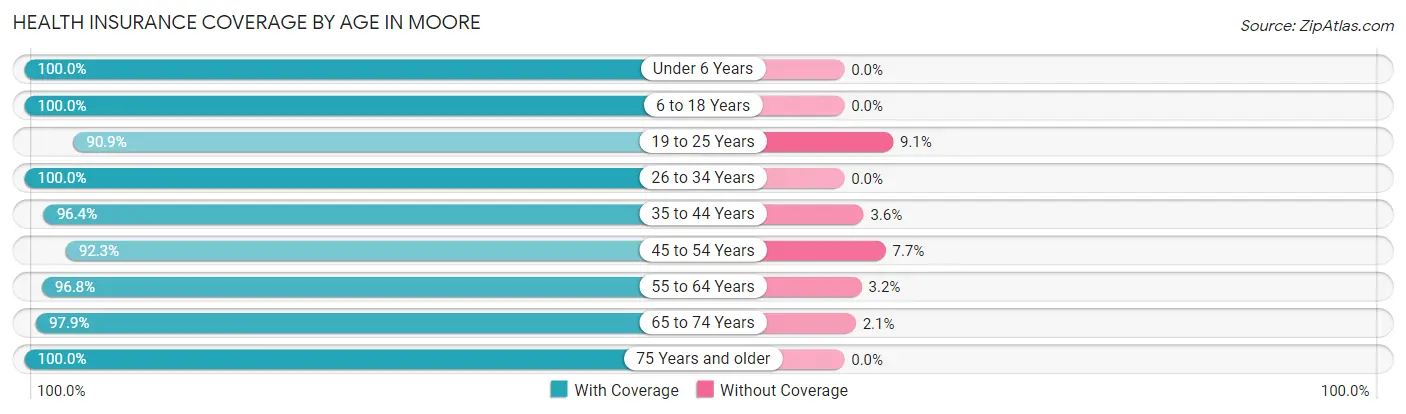
| Age Bracket | With Coverage | Without Coverage |
| Under 6 Years | 23 (100.0%) | 0 (0.0%) |
| 6 to 18 Years | 40 (100.0%) | 0 (0.0%) |
| 19 to 25 Years | 20 (90.9%) | 2 (9.1%) |
| 26 to 34 Years | 15 (100.0%) | 0 (0.0%) |
| 35 to 44 Years | 27 (96.4%) | 1 (3.6%) |
| 45 to 54 Years | 24 (92.3%) | 2 (7.7%) |
| 55 to 64 Years | 30 (96.8%) | 1 (3.2%) |
| 65 to 74 Years | 46 (97.9%) | 1 (2.1%) |
| 75 Years and older | 28 (100.0%) | 0 (0.0%) |
| Total | 253 (97.3%) | 7 (2.7%) |
Health Insurance Coverage by Citizenship Status in Moore
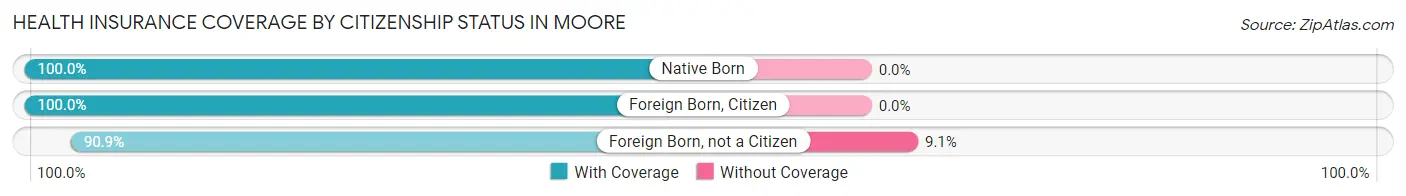
| Citizenship Status | With Coverage | Without Coverage |
| Native Born | 23 (100.0%) | 0 (0.0%) |
| Foreign Born, Citizen | 40 (100.0%) | 0 (0.0%) |
| Foreign Born, not a Citizen | 20 (90.9%) | 2 (9.1%) |
Health Insurance Coverage by Household Income in Moore
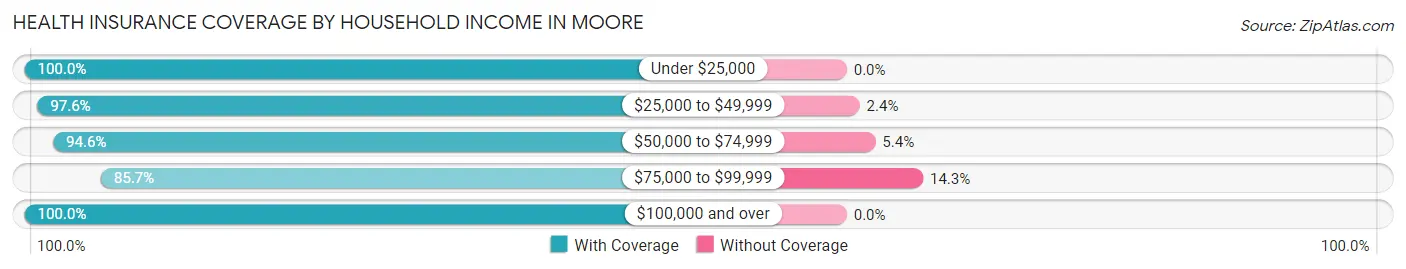
| Household Income | With Coverage | Without Coverage |
| Under $25,000 | 53 (100.0%) | 0 (0.0%) |
| $25,000 to $49,999 | 81 (97.6%) | 2 (2.4%) |
| $50,000 to $74,999 | 53 (94.6%) | 3 (5.4%) |
| $75,000 to $99,999 | 12 (85.7%) | 2 (14.3%) |
| $100,000 and over | 54 (100.0%) | 0 (0.0%) |
Public vs Private Health Insurance Coverage by Age in Moore
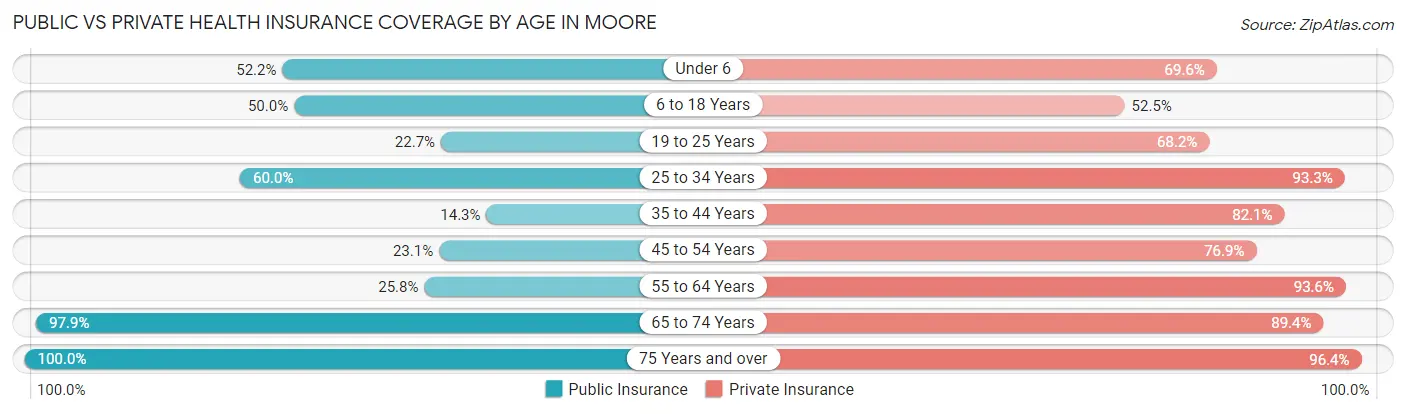
| Age Bracket | Public Insurance | Private Insurance |
| Under 6 | 12 (52.2%) | 16 (69.6%) |
| 6 to 18 Years | 20 (50.0%) | 21 (52.5%) |
| 19 to 25 Years | 5 (22.7%) | 15 (68.2%) |
| 25 to 34 Years | 9 (60.0%) | 14 (93.3%) |
| 35 to 44 Years | 4 (14.3%) | 23 (82.1%) |
| 45 to 54 Years | 6 (23.1%) | 20 (76.9%) |
| 55 to 64 Years | 8 (25.8%) | 29 (93.5%) |
| 65 to 74 Years | 46 (97.9%) | 42 (89.4%) |
| 75 Years and over | 28 (100.0%) | 27 (96.4%) |
| Total | 138 (53.1%) | 207 (79.6%) |
Disability Status by Sex by Age in Moore
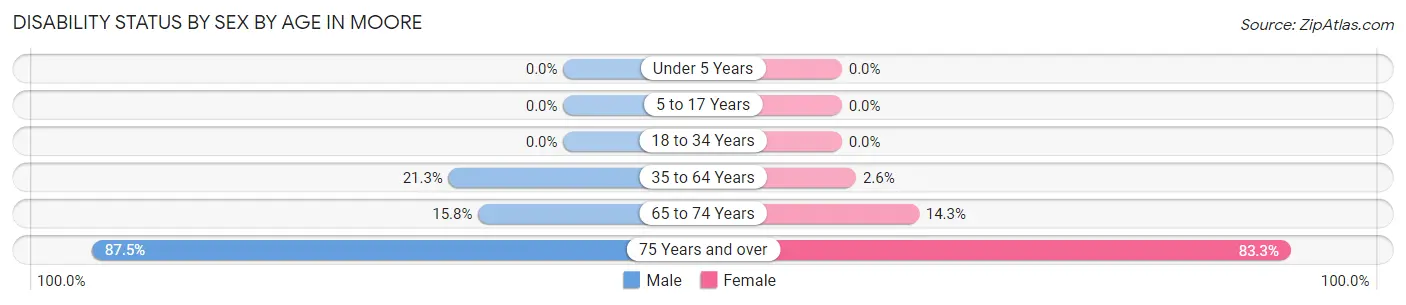
| Age Bracket | Male | Female |
| Under 5 Years | 0 (0.0%) | 0 (0.0%) |
| 5 to 17 Years | 0 (0.0%) | 0 (0.0%) |
| 18 to 34 Years | 0 (0.0%) | 0 (0.0%) |
| 35 to 64 Years | 10 (21.3%) | 1 (2.6%) |
| 65 to 74 Years | 3 (15.8%) | 4 (14.3%) |
| 75 Years and over | 14 (87.5%) | 10 (83.3%) |
Disability Class by Sex by Age in Moore
Disability Class: Hearing Difficulty
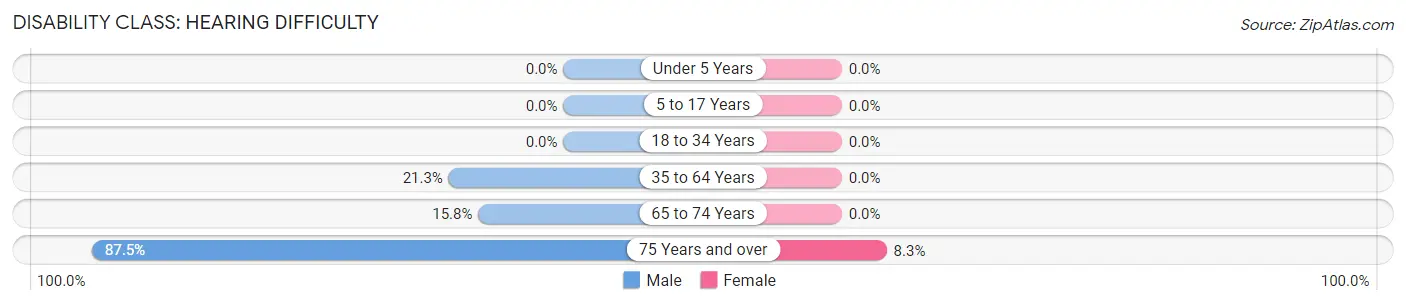
| Age Bracket | Male | Female |
| Under 5 Years | 0 (0.0%) | 0 (0.0%) |
| 5 to 17 Years | 0 (0.0%) | 0 (0.0%) |
| 18 to 34 Years | 0 (0.0%) | 0 (0.0%) |
| 35 to 64 Years | 10 (21.3%) | 0 (0.0%) |
| 65 to 74 Years | 3 (15.8%) | 0 (0.0%) |
| 75 Years and over | 14 (87.5%) | 1 (8.3%) |
Disability Class: Vision Difficulty
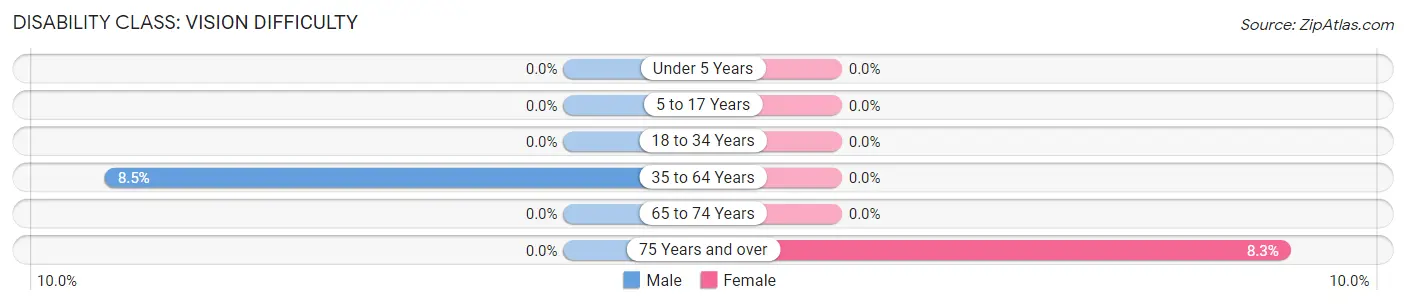
| Age Bracket | Male | Female |
| Under 5 Years | 0 (0.0%) | 0 (0.0%) |
| 5 to 17 Years | 0 (0.0%) | 0 (0.0%) |
| 18 to 34 Years | 0 (0.0%) | 0 (0.0%) |
| 35 to 64 Years | 4 (8.5%) | 0 (0.0%) |
| 65 to 74 Years | 0 (0.0%) | 0 (0.0%) |
| 75 Years and over | 0 (0.0%) | 1 (8.3%) |
Disability Class: Cognitive Difficulty
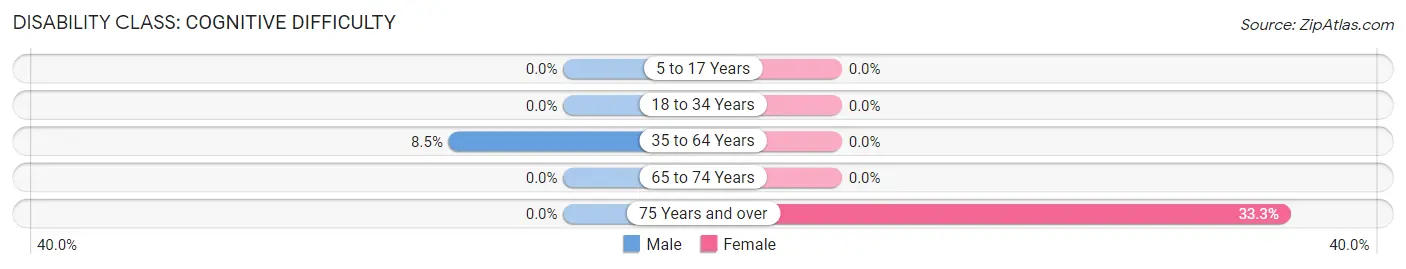
| Age Bracket | Male | Female |
| 5 to 17 Years | 0 (0.0%) | 0 (0.0%) |
| 18 to 34 Years | 0 (0.0%) | 0 (0.0%) |
| 35 to 64 Years | 4 (8.5%) | 0 (0.0%) |
| 65 to 74 Years | 0 (0.0%) | 0 (0.0%) |
| 75 Years and over | 0 (0.0%) | 4 (33.3%) |
Disability Class: Ambulatory Difficulty
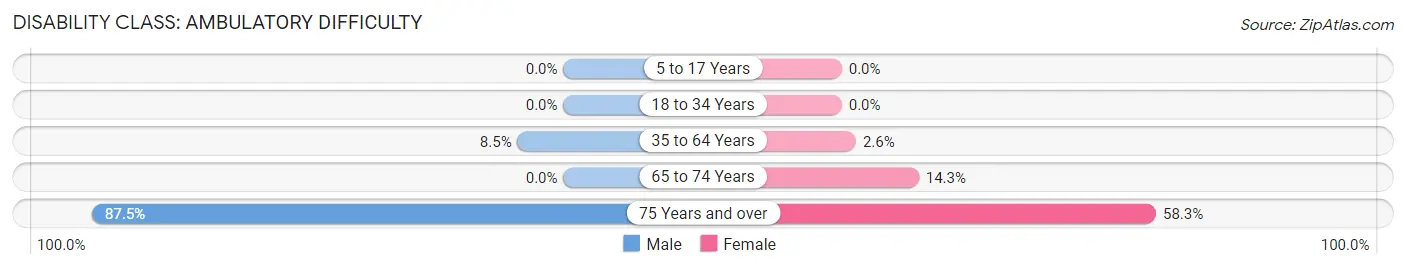
| Age Bracket | Male | Female |
| 5 to 17 Years | 0 (0.0%) | 0 (0.0%) |
| 18 to 34 Years | 0 (0.0%) | 0 (0.0%) |
| 35 to 64 Years | 4 (8.5%) | 1 (2.6%) |
| 65 to 74 Years | 0 (0.0%) | 4 (14.3%) |
| 75 Years and over | 14 (87.5%) | 7 (58.3%) |
Disability Class: Self-Care Difficulty
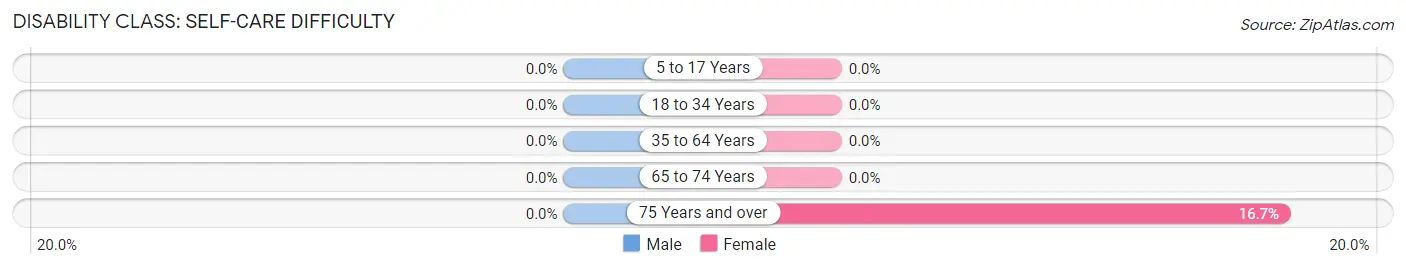
| Age Bracket | Male | Female |
| 5 to 17 Years | 0 (0.0%) | 0 (0.0%) |
| 18 to 34 Years | 0 (0.0%) | 0 (0.0%) |
| 35 to 64 Years | 0 (0.0%) | 0 (0.0%) |
| 65 to 74 Years | 0 (0.0%) | 0 (0.0%) |
| 75 Years and over | 0 (0.0%) | 2 (16.7%) |
Technology Access in Moore
Computing Device Access in Moore
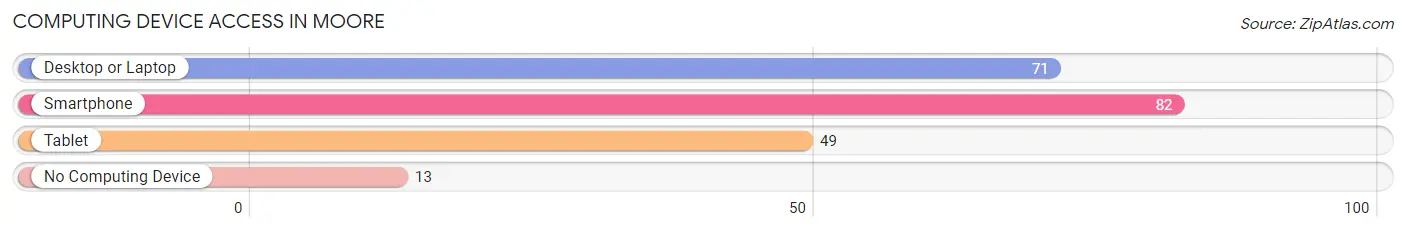
| Device Type | # Households | % Households |
| Desktop or Laptop | 71 | 61.7% |
| Smartphone | 82 | 71.3% |
| Tablet | 49 | 42.6% |
| No Computing Device | 13 | 11.3% |
| Total | 115 | 100.0% |
Internet Access in Moore
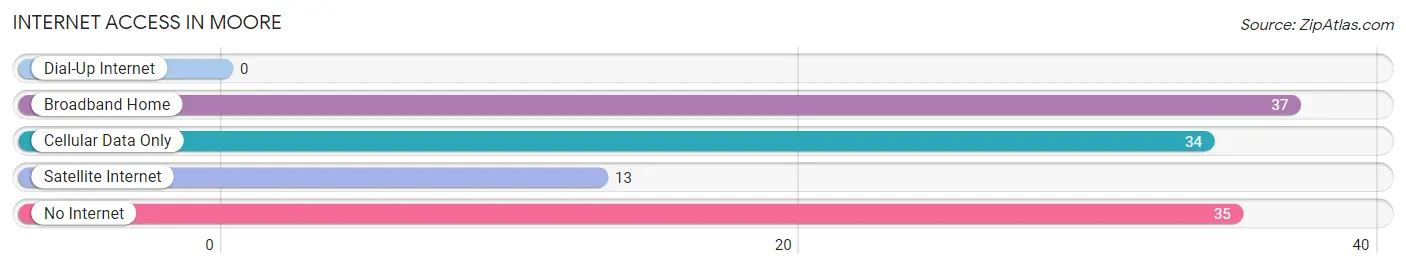
| Internet Type | # Households | % Households |
| Dial-Up Internet | 0 | 0.0% |
| Broadband Home | 37 | 32.2% |
| Cellular Data Only | 34 | 29.6% |
| Satellite Internet | 13 | 11.3% |
| No Internet | 35 | 30.4% |
| Total | 115 | 100.0% |
Moore Summary
Moore, Montana is a small town located in the western part of the state, approximately 20 miles south of the city of Missoula. The town was founded in 1883 and is home to a population of approximately 1,000 people. Moore is a rural community with a strong agricultural base, and is known for its scenic beauty and outdoor recreation opportunities.
History
Moore was founded in 1883 by a group of settlers from the Midwest. The town was named after the first postmaster, William Moore. The original settlers were primarily farmers and ranchers, and the town quickly grew to become a thriving agricultural community. In the early 1900s, the town was home to several businesses, including a general store, a blacksmith shop, and a hotel.
In the 1920s, the town began to experience a decline in population as many of the original settlers moved away. However, the town was revitalized in the 1950s when the nearby city of Missoula began to experience a population boom. This influx of new residents brought new businesses and services to Moore, and the town began to experience a period of growth and prosperity.
Geography
Moore is located in the western part of Montana, approximately 20 miles south of the city of Missoula. The town is situated in a valley surrounded by the Bitterroot Mountains to the east and the Sapphire Mountains to the west. The town is located at an elevation of 3,400 feet, and the climate is semi-arid with hot summers and cold winters.
Economy
Moore’s economy is primarily based on agriculture and tourism. The town is home to several farms and ranches, and the surrounding area is known for its production of hay, wheat, and other crops. The town is also home to several tourist attractions, including the Moore Historical Museum and the Moore Rodeo Grounds.
Demographics
As of the 2010 census, Moore had a population of 1,000 people. The racial makeup of the town was 95.2% White, 0.7% Native American, 0.3% Asian, 0.1% Pacific Islander, 0.1% from other races, and 3.7% from two or more races. The median household income was $37,500, and the median family income was $45,000. The per capita income was $19,000.
Moore is a small, rural town with a strong agricultural base and a rich history. The town is known for its scenic beauty and outdoor recreation opportunities, and is a popular destination for tourists and locals alike. Moore is a great place to live, work, and play, and is a great example of the beauty and charm of small-town Montana.
Common Questions
What is Per Capita Income in Moore?
Per Capita income in Moore is $23,450.
What is the Median Family Income in Moore?
Median Family Income in Moore is $44,271.
What is the Median Household income in Moore?
Median Household Income in Moore is $44,271.
What is Income or Wage Gap in Moore?
Income or Wage Gap in Moore is 21.3%.
Women in Moore earn 78.7 cents for every dollar earned by a man.
What is Inequality or Gini Index in Moore?
Inequality or Gini Index in Moore is 0.40.
What is the Total Population of Moore?
Total Population of Moore is 260.
What is the Total Male Population of Moore?
Total Male Population of Moore is 137.
What is the Total Female Population of Moore?
Total Female Population of Moore is 123.
What is the Ratio of Males per 100 Females in Moore?
There are 111.38 Males per 100 Females in Moore.
What is the Ratio of Females per 100 Males in Moore?
There are 89.78 Females per 100 Males in Moore.
What is the Median Population Age in Moore?
Median Population Age in Moore is 47.5 Years.
What is the Average Family Size in Moore
Average Family Size in Moore is 2.5 People.
What is the Average Household Size in Moore
Average Household Size in Moore is 2.3 People.
How Large is the Labor Force in Moore?
There are 112 People in the Labor Forcein in Moore.
What is the Percentage of People in the Labor Force in Moore?
52.1% of People are in the Labor Force in Moore.
What is the Unemployment Rate in Moore?
Unemployment Rate in Moore is 1.8%.