Lonepine, MT Map & Demographics
Lonepine Map
Lonepine Overview
$30,512
PER CAPITA INCOME
$73,438
AVG FAMILY INCOME
$62,500
AVG HOUSEHOLD INCOME
0.37
INEQUALITY / GINI INDEX
145
TOTAL POPULATION
98
MALE POPULATION
47
FEMALE POPULATION
208.51
MALES / 100 FEMALES
47.96
FEMALES / 100 MALES
54.1
MEDIAN AGE
2.2
AVG FAMILY SIZE
2.0
AVG HOUSEHOLD SIZE
67
LABOR FORCE [ PEOPLE ]
56.3%
PERCENT IN LABOR FORCE
6.0%
UNEMPLOYMENT RATE
Lonepine Zip Codes
Lonepine Area Codes
Income in Lonepine
Income Overview in Lonepine
Per Capita Income in Lonepine is $30,512, while median incomes of families and households are $73,438 and $62,500 respectively.
| Characteristic | Number | Measure |
| Per Capita Income | 145 | $30,512 |
| Median Family Income | 61 | $73,438 |
| Mean Family Income | 61 | $67,423 |
| Median Household Income | 74 | $62,500 |
| Mean Household Income | 74 | $60,392 |
| Income Deficit | 61 | $0 |
| Wage / Income Gap (%) | 145 | 0.00% |
| Wage / Income Gap ($) | 145 | 100.00¢ per $1 |
| Gini / Inequality Index | 145 | 0.37 |
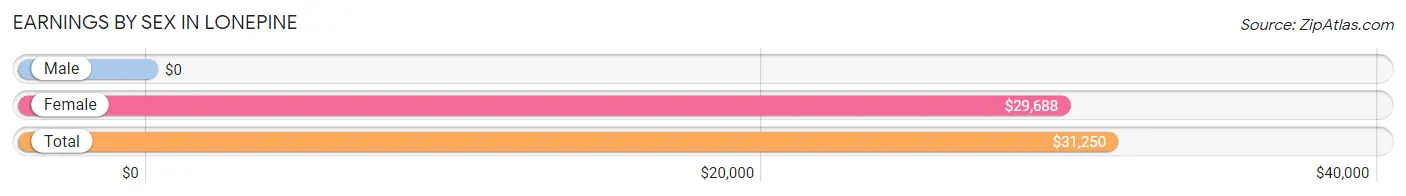
Earnings by Sex in Lonepine
| Sex | Number | Average Earnings |
| Male | 49 (62.8%) | $0 |
| Female | 29 (37.2%) | $29,688 |
| Total | 78 (100.0%) | $31,250 |
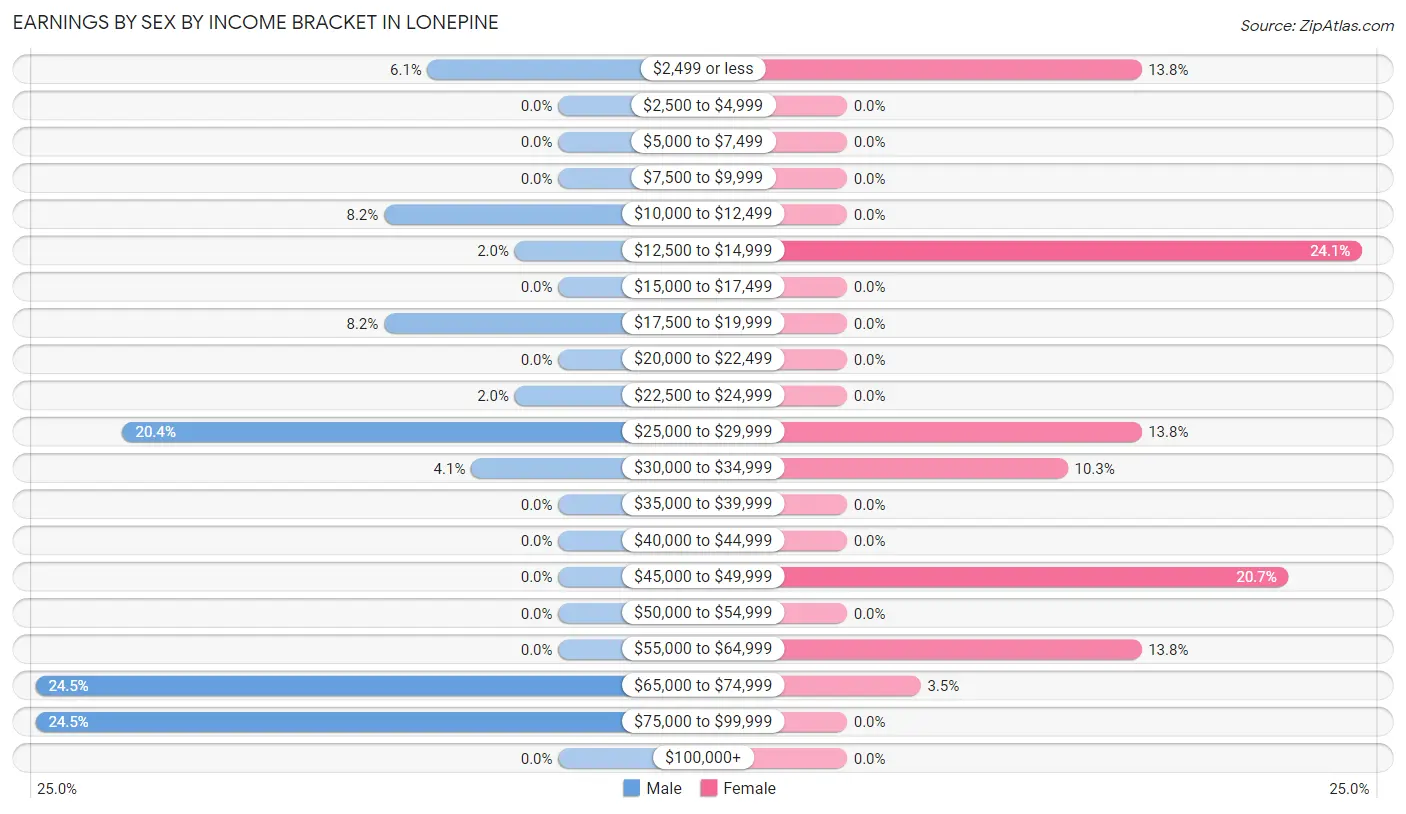
Earnings by Sex by Income Bracket in Lonepine
The most common earnings brackets in Lonepine are $65,000 to $74,999 for men (12 | 24.5%) and $12,500 to $14,999 for women (7 | 24.1%).
| Income | Male | Female |
| $2,499 or less | 3 (6.1%) | 4 (13.8%) |
| $2,500 to $4,999 | 0 (0.0%) | 0 (0.0%) |
| $5,000 to $7,499 | 0 (0.0%) | 0 (0.0%) |
| $7,500 to $9,999 | 0 (0.0%) | 0 (0.0%) |
| $10,000 to $12,499 | 4 (8.2%) | 0 (0.0%) |
| $12,500 to $14,999 | 1 (2.0%) | 7 (24.1%) |
| $15,000 to $17,499 | 0 (0.0%) | 0 (0.0%) |
| $17,500 to $19,999 | 4 (8.2%) | 0 (0.0%) |
| $20,000 to $22,499 | 0 (0.0%) | 0 (0.0%) |
| $22,500 to $24,999 | 1 (2.0%) | 0 (0.0%) |
| $25,000 to $29,999 | 10 (20.4%) | 4 (13.8%) |
| $30,000 to $34,999 | 2 (4.1%) | 3 (10.3%) |
| $35,000 to $39,999 | 0 (0.0%) | 0 (0.0%) |
| $40,000 to $44,999 | 0 (0.0%) | 0 (0.0%) |
| $45,000 to $49,999 | 0 (0.0%) | 6 (20.7%) |
| $50,000 to $54,999 | 0 (0.0%) | 0 (0.0%) |
| $55,000 to $64,999 | 0 (0.0%) | 4 (13.8%) |
| $65,000 to $74,999 | 12 (24.5%) | 1 (3.5%) |
| $75,000 to $99,999 | 12 (24.5%) | 0 (0.0%) |
| $100,000+ | 0 (0.0%) | 0 (0.0%) |
| Total | 49 (100.0%) | 29 (100.0%) |
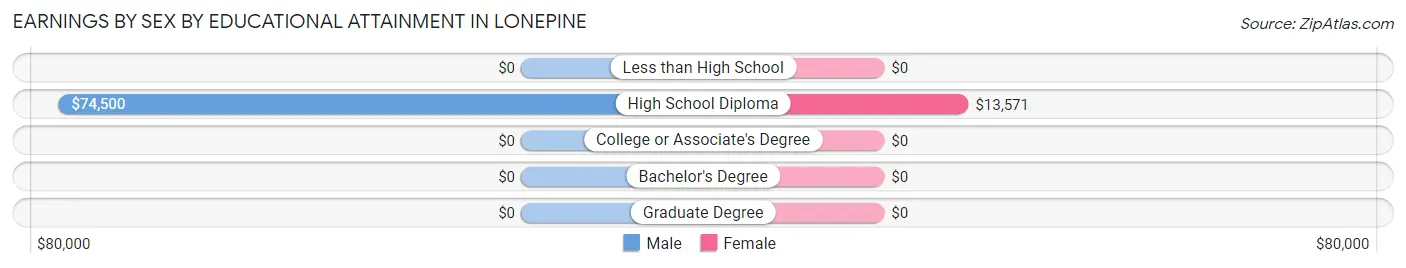
Earnings by Sex by Educational Attainment in Lonepine
| Educational Attainment | Male Income | Female Income |
| Less than High School | - | - |
| High School Diploma | $74,500 | $13,571 |
| College or Associate's Degree | - | - |
| Bachelor's Degree | - | - |
| Graduate Degree | - | - |
| Total | - | - |
Family Income in Lonepine
Family Income Brackets in Lonepine
According to the Lonepine family income data, there are 18 families falling into the $100,000 to $149,999 income range, which is the most common income bracket and makes up 29.5% of all families.
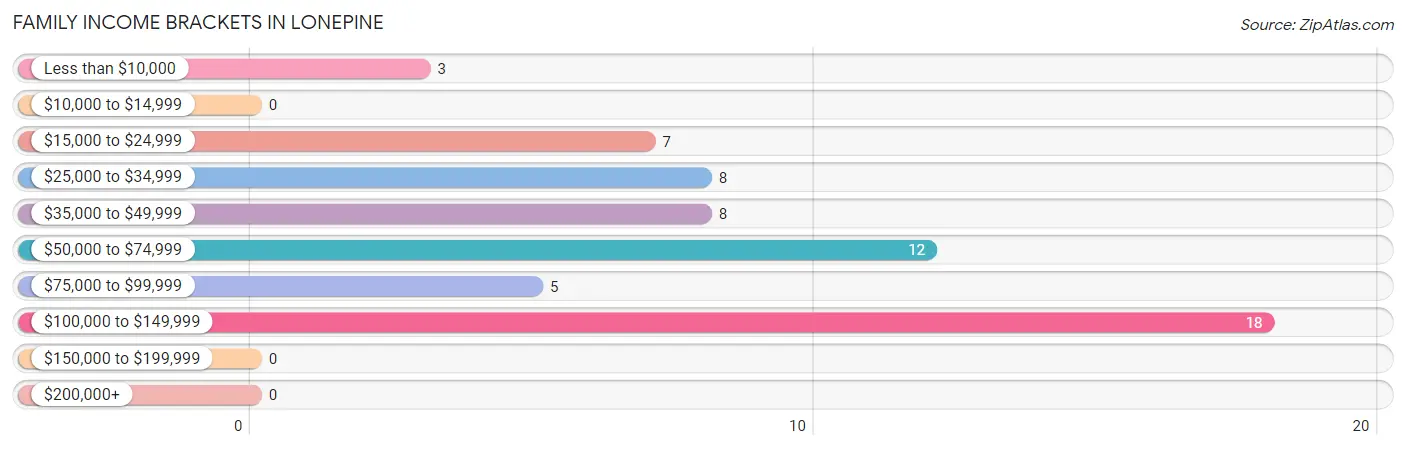
| Income Bracket | # Families | % Families |
| Less than $10,000 | 3 | 4.9% |
| $10,000 to $14,999 | 0 | 0.0% |
| $15,000 to $24,999 | 7 | 11.5% |
| $25,000 to $34,999 | 8 | 13.1% |
| $35,000 to $49,999 | 8 | 13.1% |
| $50,000 to $74,999 | 12 | 19.7% |
| $75,000 to $99,999 | 5 | 8.2% |
| $100,000 to $149,999 | 18 | 29.5% |
| $150,000 to $199,999 | 0 | 0.0% |
| $200,000+ | 0 | 0.0% |
Family Income by Famaliy Size in Lonepine
2-person families (37 | 60.7%) account for the highest median family income in Lonepine with $42,917 per family, while 2-person families (37 | 60.7%) have the highest median income of $21,458 per family member.
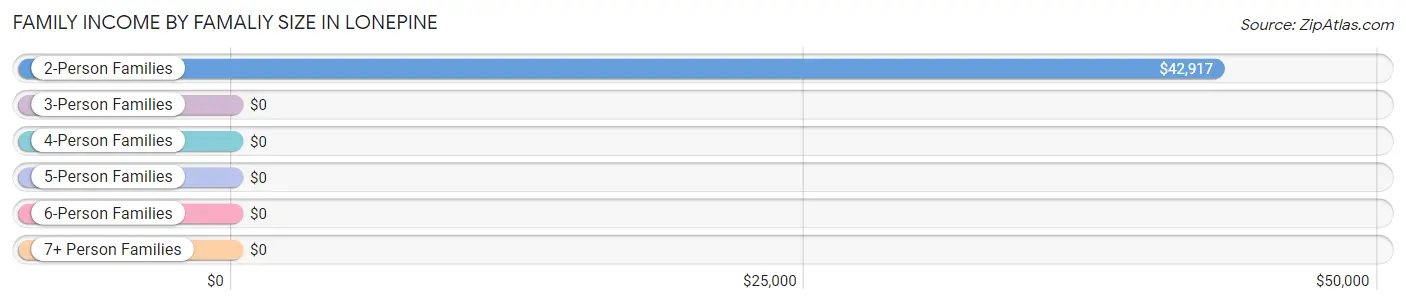
| Income Bracket | # Families | Median Income |
| 2-Person Families | 37 (60.7%) | $42,917 |
| 3-Person Families | 12 (19.7%) | $0 |
| 4-Person Families | 12 (19.7%) | $0 |
| 5-Person Families | 0 (0.0%) | $0 |
| 6-Person Families | 0 (0.0%) | $0 |
| 7+ Person Families | 0 (0.0%) | $0 |
| Total | 61 (100.0%) | $73,438 |
Family Income by Number of Earners in Lonepine
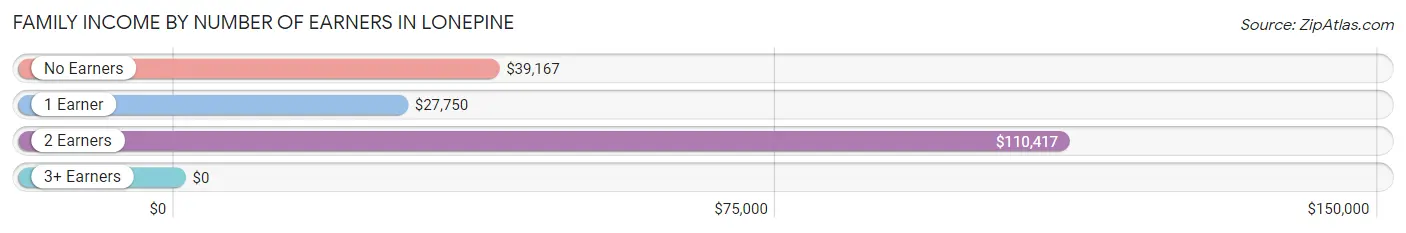
| Number of Earners | # Families | Median Income |
| No Earners | 10 (16.4%) | $39,167 |
| 1 Earner | 21 (34.4%) | $27,750 |
| 2 Earners | 30 (49.2%) | $110,417 |
| 3+ Earners | 0 (0.0%) | $0 |
| Total | 61 (100.0%) | $73,438 |
Household Income in Lonepine
Household Income Brackets in Lonepine
With 18 households falling in the category, the $100,000 to $149,999 income range is the most frequent in Lonepine, accounting for 24.3% of all households.
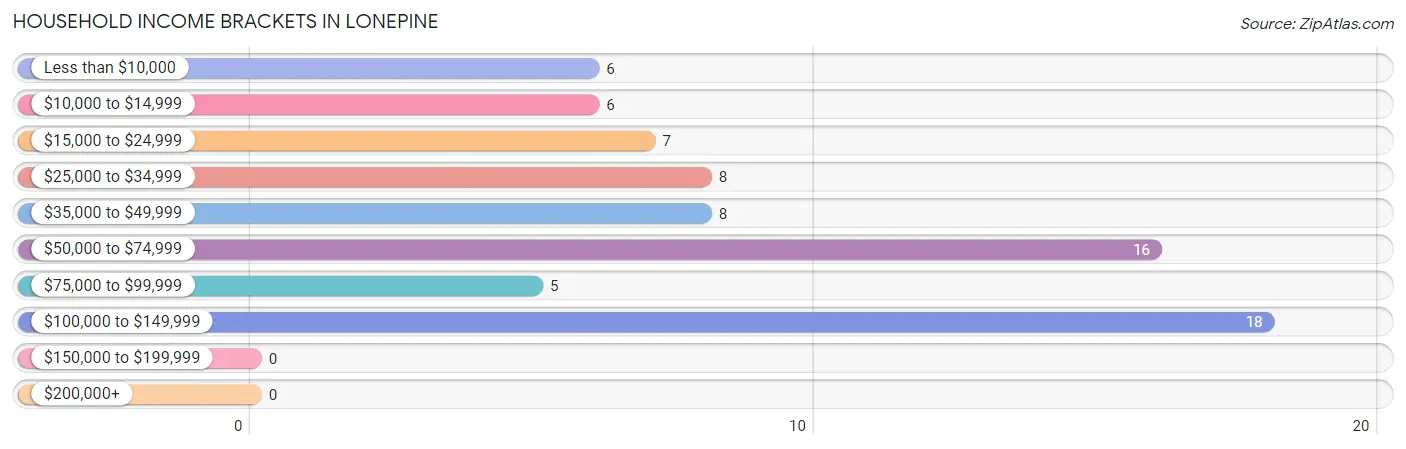
| Income Bracket | # Households | % Households |
| Less than $10,000 | 6 | 8.1% |
| $10,000 to $14,999 | 6 | 8.1% |
| $15,000 to $24,999 | 7 | 9.5% |
| $25,000 to $34,999 | 8 | 10.8% |
| $35,000 to $49,999 | 8 | 10.8% |
| $50,000 to $74,999 | 16 | 21.6% |
| $75,000 to $99,999 | 5 | 6.8% |
| $100,000 to $149,999 | 18 | 24.3% |
| $150,000 to $199,999 | 0 | 0.0% |
| $200,000+ | 0 | 0.0% |
Household Income by Householder Age in Lonepine
The median household income in Lonepine is $62,500, with the highest median household income of $92,500 found in the 25 to 44 years age bracket for the primary householder. A total of 24 households (32.4%) fall into this category.
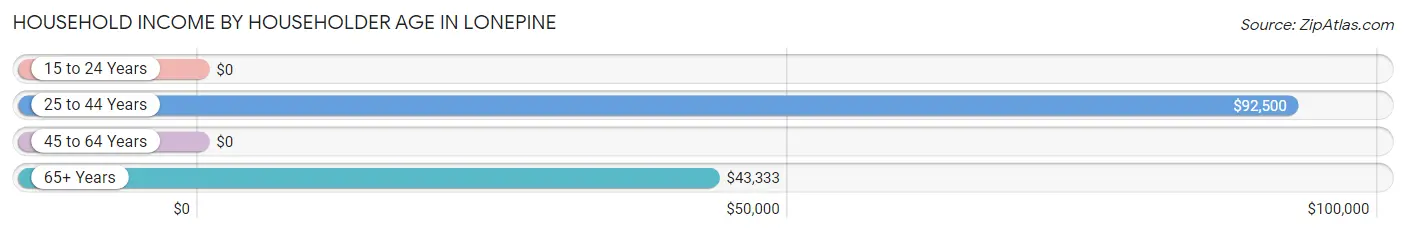
| Income Bracket | # Households | Median Income |
| 15 to 24 Years | 0 (0.0%) | $0 |
| 25 to 44 Years | 24 (32.4%) | $92,500 |
| 45 to 64 Years | 24 (32.4%) | $0 |
| 65+ Years | 26 (35.1%) | $43,333 |
| Total | 74 (100.0%) | $62,500 |
Poverty in Lonepine
Income Below Poverty by Sex and Age in Lonepine
With 16.3% poverty level for males and 12.8% for females among the residents of Lonepine, 6 to 11 year old males and 55 to 64 year old females are the most vulnerable to poverty, with 3 males (100.0%) and 3 females (21.4%) in their respective age groups living below the poverty level.
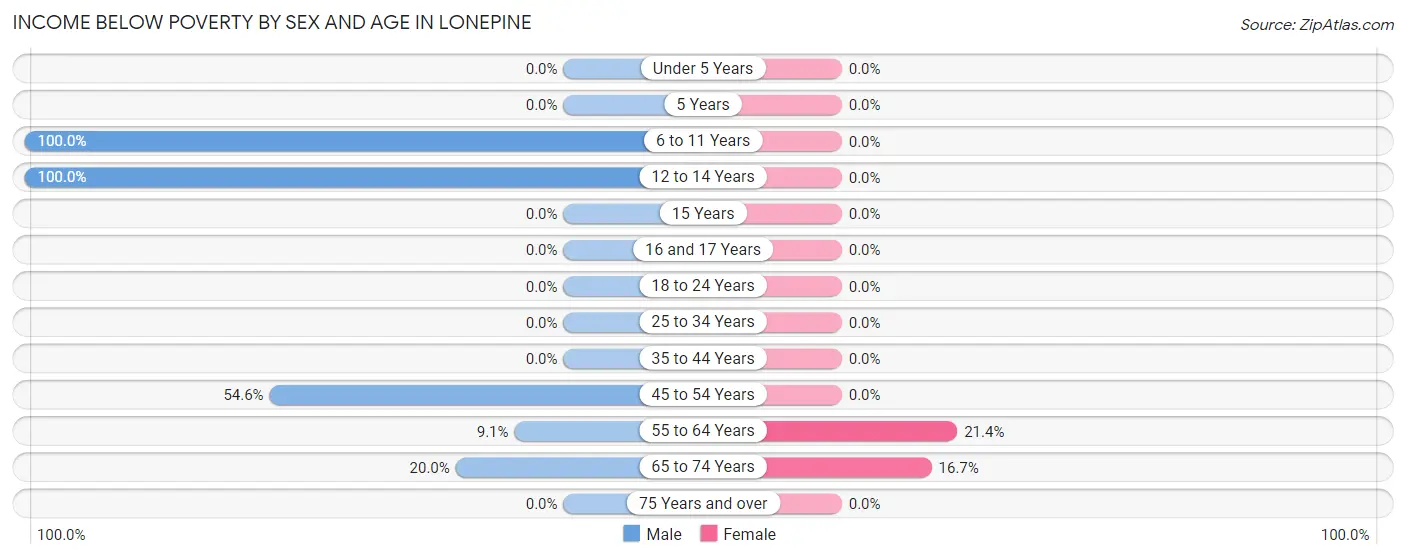
| Age Bracket | Male | Female |
| Under 5 Years | 0 (0.0%) | 0 (0.0%) |
| 5 Years | 0 (0.0%) | 0 (0.0%) |
| 6 to 11 Years | 3 (100.0%) | 0 (0.0%) |
| 12 to 14 Years | 3 (100.0%) | 0 (0.0%) |
| 15 Years | 0 (0.0%) | 0 (0.0%) |
| 16 and 17 Years | 0 (0.0%) | 0 (0.0%) |
| 18 to 24 Years | 0 (0.0%) | 0 (0.0%) |
| 25 to 34 Years | 0 (0.0%) | 0 (0.0%) |
| 35 to 44 Years | 0 (0.0%) | 0 (0.0%) |
| 45 to 54 Years | 6 (54.5%) | 0 (0.0%) |
| 55 to 64 Years | 1 (9.1%) | 3 (21.4%) |
| 65 to 74 Years | 3 (20.0%) | 3 (16.7%) |
| 75 Years and over | 0 (0.0%) | 0 (0.0%) |
| Total | 16 (16.3%) | 6 (12.8%) |
Income Above Poverty by Sex and Age in Lonepine
According to the poverty statistics in Lonepine, males aged under 5 years and females aged 25 to 34 years are the age groups that are most secure financially, with 100.0% of males and 100.0% of females in these age groups living above the poverty line.
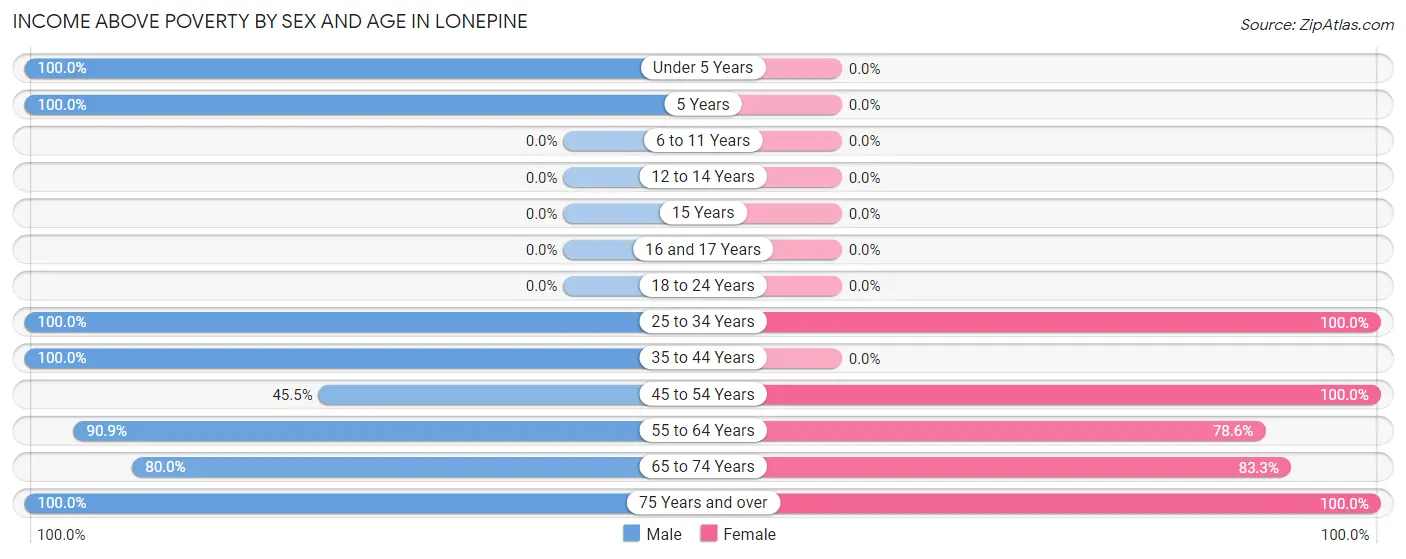
| Age Bracket | Male | Female |
| Under 5 Years | 16 (100.0%) | 0 (0.0%) |
| 5 Years | 4 (100.0%) | 0 (0.0%) |
| 6 to 11 Years | 0 (0.0%) | 0 (0.0%) |
| 12 to 14 Years | 0 (0.0%) | 0 (0.0%) |
| 15 Years | 0 (0.0%) | 0 (0.0%) |
| 16 and 17 Years | 0 (0.0%) | 0 (0.0%) |
| 18 to 24 Years | 0 (0.0%) | 0 (0.0%) |
| 25 to 34 Years | 21 (100.0%) | 10 (100.0%) |
| 35 to 44 Years | 5 (100.0%) | 0 (0.0%) |
| 45 to 54 Years | 5 (45.5%) | 3 (100.0%) |
| 55 to 64 Years | 10 (90.9%) | 11 (78.6%) |
| 65 to 74 Years | 12 (80.0%) | 15 (83.3%) |
| 75 Years and over | 9 (100.0%) | 2 (100.0%) |
| Total | 82 (83.7%) | 41 (87.2%) |
Income Below Poverty Among Married-Couple Families in Lonepine
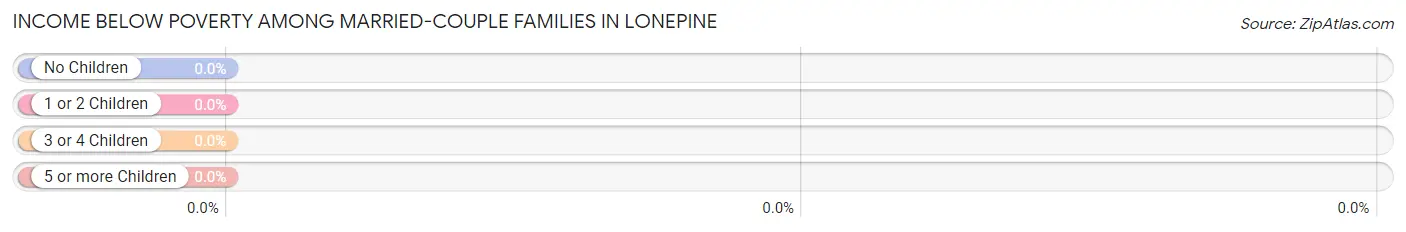
| Children | Above Poverty | Below Poverty |
| No Children | 29 (100.0%) | 0 (0.0%) |
| 1 or 2 Children | 21 (100.0%) | 0 (0.0%) |
| 3 or 4 Children | 0 (0.0%) | 0 (0.0%) |
| 5 or more Children | 0 (0.0%) | 0 (0.0%) |
| Total | 50 (100.0%) | 0 (0.0%) |
Income Below Poverty Among Single-Parent Households in Lonepine
According to the poverty data in Lonepine, 80.0% or 4 single-father households and 50.0% or 3 single-mother households are living below the poverty line. Among single-father households, those with 1 or 2 children have the highest poverty rate, with 4 households (100.0%) experiencing poverty. Likewise, among single-mother households, those with 1 or 2 children have the highest poverty rate, with 3 households (50.0%) falling below the poverty line.
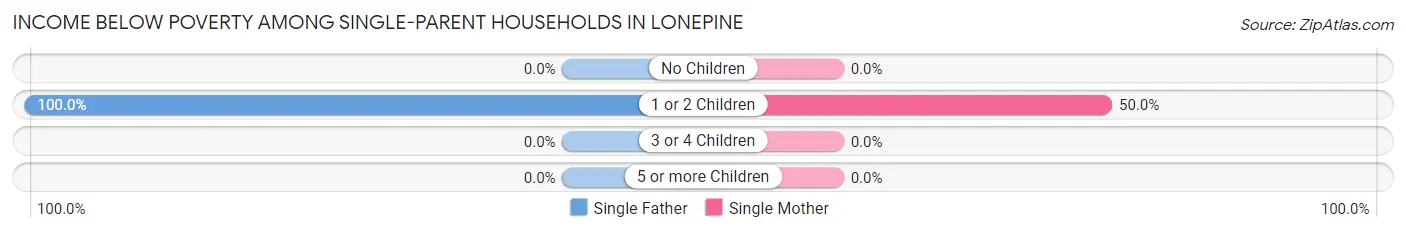
| Children | Single Father | Single Mother |
| No Children | 0 (0.0%) | 0 (0.0%) |
| 1 or 2 Children | 4 (100.0%) | 3 (50.0%) |
| 3 or 4 Children | 0 (0.0%) | 0 (0.0%) |
| 5 or more Children | 0 (0.0%) | 0 (0.0%) |
| Total | 4 (80.0%) | 3 (50.0%) |
Income Below Poverty Among Married-Couple vs Single-Parent Households in Lonepine
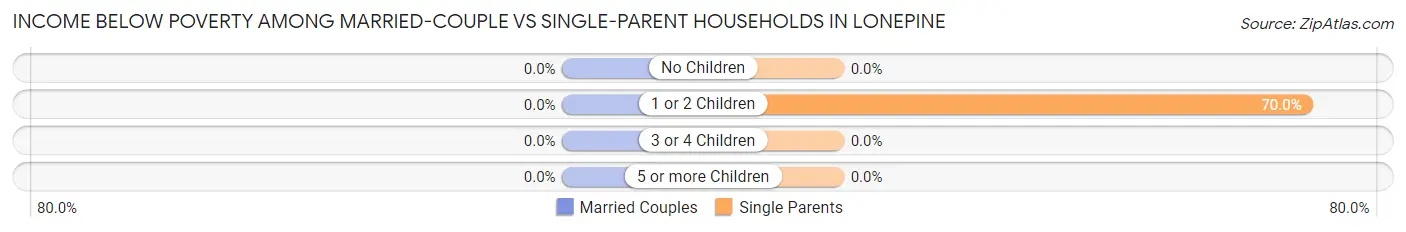
| Children | Married-Couple Families | Single-Parent Households |
| No Children | 0 (0.0%) | 0 (0.0%) |
| 1 or 2 Children | 0 (0.0%) | 7 (70.0%) |
| 3 or 4 Children | 0 (0.0%) | 0 (0.0%) |
| 5 or more Children | 0 (0.0%) | 0 (0.0%) |
| Total | 0 (0.0%) | 7 (63.6%) |
Race in Lonepine
The most populous races in Lonepine are White / Caucasian (137 | 94.5%), Native / Alaskan (6 | 4.1%), and Hispanic or Latino (4 | 2.8%).
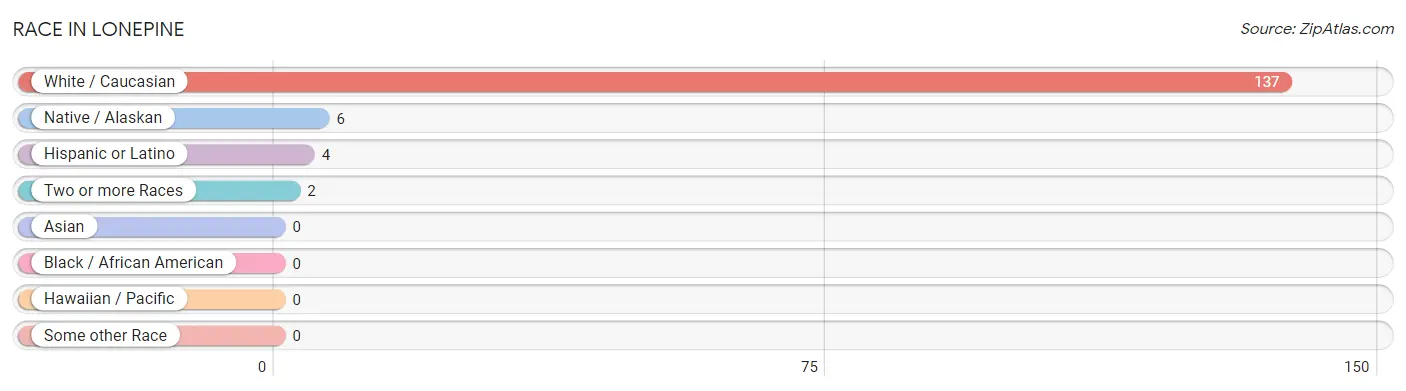
| Race | # Population | % Population |
| Asian | 0 | 0.0% |
| Black / African American | 0 | 0.0% |
| Hawaiian / Pacific | 0 | 0.0% |
| Hispanic or Latino | 4 | 2.8% |
| Native / Alaskan | 6 | 4.1% |
| White / Caucasian | 137 | 94.5% |
| Two or more Races | 2 | 1.4% |
| Some other Race | 0 | 0.0% |
| Total | 145 | 100.0% |
Ancestry in Lonepine
The most populous ancestries reported in Lonepine are German (35 | 24.1%), Irish (17 | 11.7%), English (11 | 7.6%), Scottish (11 | 7.6%), and Italian (9 | 6.2%), together accounting for 57.3% of all Lonepine residents.
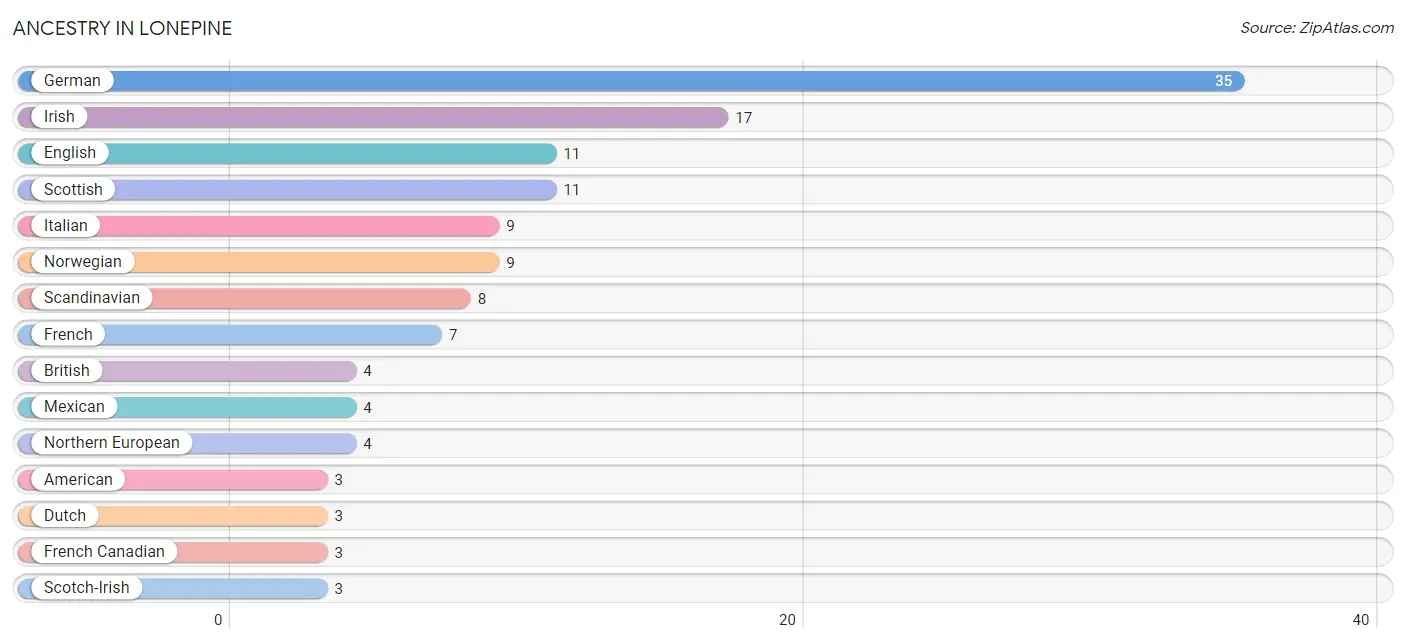
| Ancestry | # Population | % Population |
| American | 3 | 2.1% |
| Australian | 2 | 1.4% |
| British | 4 | 2.8% |
| Dutch | 3 | 2.1% |
| English | 11 | 7.6% |
| French | 7 | 4.8% |
| French Canadian | 3 | 2.1% |
| German | 35 | 24.1% |
| Irish | 17 | 11.7% |
| Italian | 9 | 6.2% |
| Mexican | 4 | 2.8% |
| Northern European | 4 | 2.8% |
| Norwegian | 9 | 6.2% |
| Scandinavian | 8 | 5.5% |
| Scotch-Irish | 3 | 2.1% |
| Scottish | 11 | 7.6% |
| Swedish | 3 | 2.1% |
| Welsh | 1 | 0.7% | View All 18 Rows |
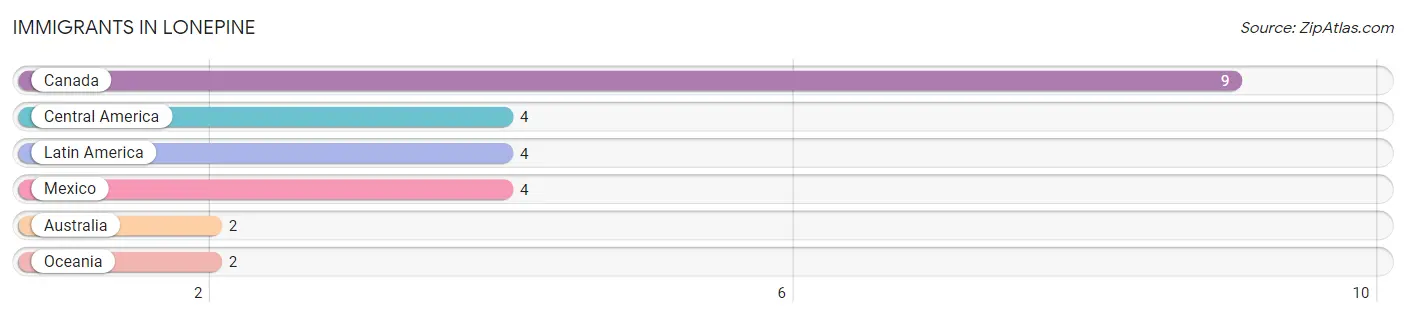
Immigrants in Lonepine
The most numerous immigrant groups reported in Lonepine came from Canada (9 | 6.2%), Central America (4 | 2.8%), Latin America (4 | 2.8%), Mexico (4 | 2.8%), and Australia (2 | 1.4%), together accounting for 15.9% of all Lonepine residents.
| Immigration Origin | # Population | % Population |
| Australia | 2 | 1.4% |
| Canada | 9 | 6.2% |
| Central America | 4 | 2.8% |
| Latin America | 4 | 2.8% |
| Mexico | 4 | 2.8% |
| Oceania | 2 | 1.4% | View All 6 Rows |
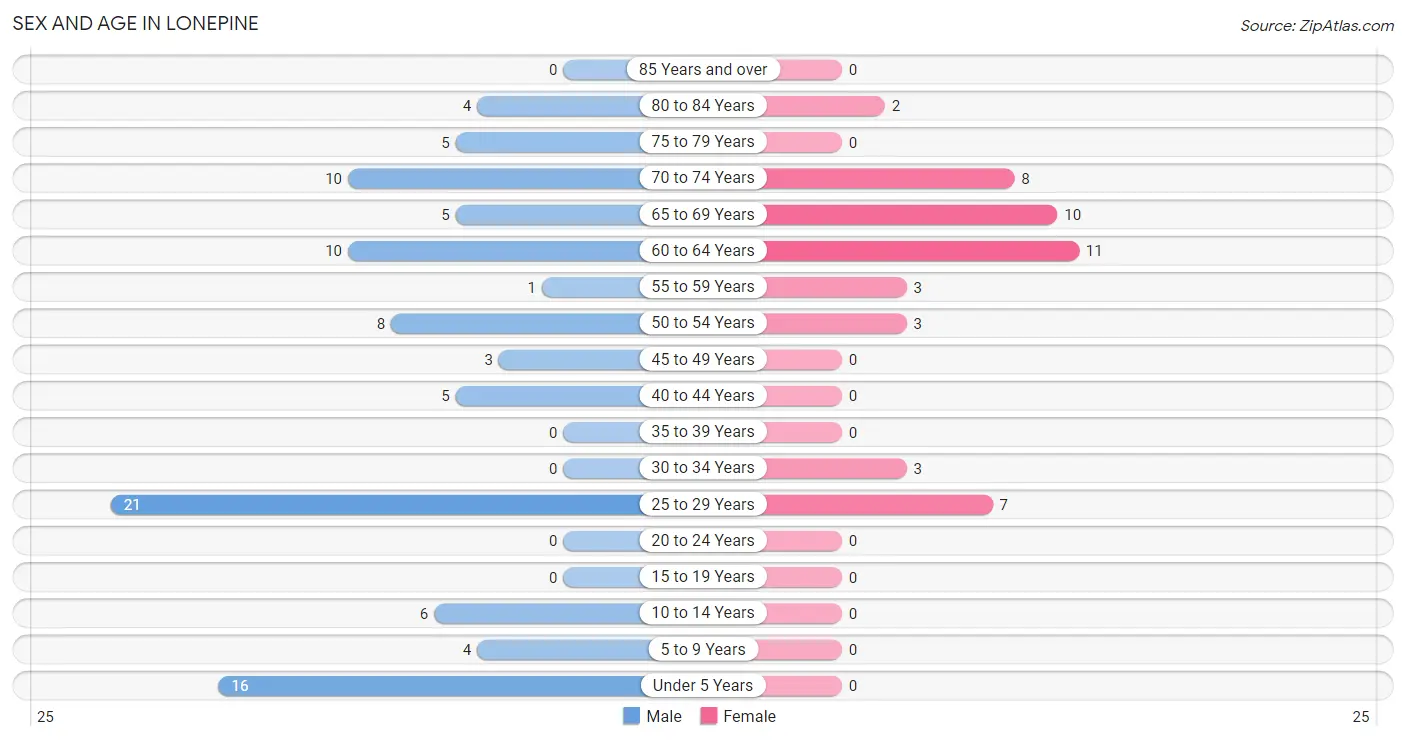
Sex and Age in Lonepine
Sex and Age in Lonepine
The most populous age groups in Lonepine are 25 to 29 Years (21 | 21.4%) for men and 60 to 64 Years (11 | 23.4%) for women.
| Age Bracket | Male | Female |
| Under 5 Years | 16 (16.3%) | 0 (0.0%) |
| 5 to 9 Years | 4 (4.1%) | 0 (0.0%) |
| 10 to 14 Years | 6 (6.1%) | 0 (0.0%) |
| 15 to 19 Years | 0 (0.0%) | 0 (0.0%) |
| 20 to 24 Years | 0 (0.0%) | 0 (0.0%) |
| 25 to 29 Years | 21 (21.4%) | 7 (14.9%) |
| 30 to 34 Years | 0 (0.0%) | 3 (6.4%) |
| 35 to 39 Years | 0 (0.0%) | 0 (0.0%) |
| 40 to 44 Years | 5 (5.1%) | 0 (0.0%) |
| 45 to 49 Years | 3 (3.1%) | 0 (0.0%) |
| 50 to 54 Years | 8 (8.2%) | 3 (6.4%) |
| 55 to 59 Years | 1 (1.0%) | 3 (6.4%) |
| 60 to 64 Years | 10 (10.2%) | 11 (23.4%) |
| 65 to 69 Years | 5 (5.1%) | 10 (21.3%) |
| 70 to 74 Years | 10 (10.2%) | 8 (17.0%) |
| 75 to 79 Years | 5 (5.1%) | 0 (0.0%) |
| 80 to 84 Years | 4 (4.1%) | 2 (4.3%) |
| 85 Years and over | 0 (0.0%) | 0 (0.0%) |
| Total | 98 (100.0%) | 47 (100.0%) |
Families and Households in Lonepine
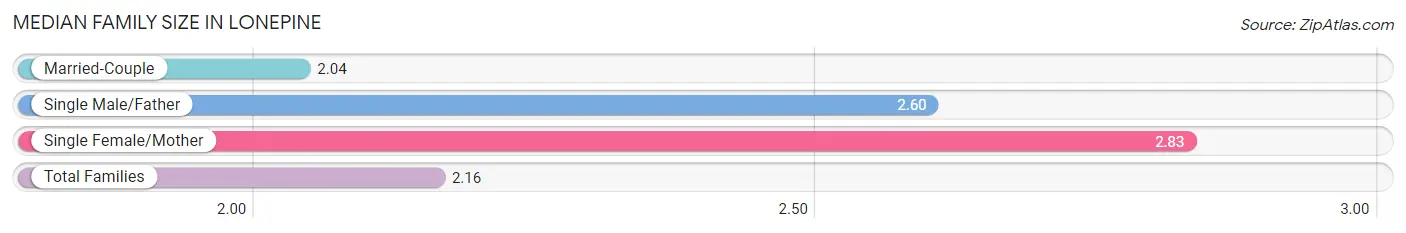
Median Family Size in Lonepine
The median family size in Lonepine is 2.16 persons per family, with single female/mother families (6 | 9.8%) accounting for the largest median family size of 2.83 persons per family. On the other hand, married-couple families (50 | 82.0%) represent the smallest median family size with 2.04 persons per family.
| Family Type | # Families | Family Size |
| Married-Couple | 50 (82.0%) | 2.04 |
| Single Male/Father | 5 (8.2%) | 2.60 |
| Single Female/Mother | 6 (9.8%) | 2.83 |
| Total Families | 61 (100.0%) | 2.16 |
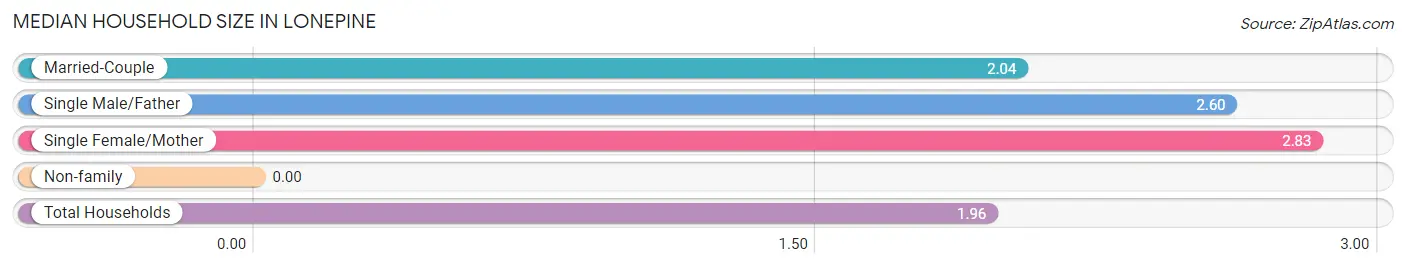
Median Household Size in Lonepine
| Household Type | # Households | Household Size |
| Married-Couple | 50 (67.6%) | 2.04 |
| Single Male/Father | 5 (6.8%) | 2.60 |
| Single Female/Mother | 6 (8.1%) | 2.83 |
| Non-family | 13 (17.6%) | - |
| Total Households | 74 (100.0%) | 1.96 |
Household Size by Marriage Status in Lonepine
Out of a total of 74 households in Lonepine, 61 (82.4%) are family households, while 13 (17.6%) are nonfamily households. The most numerous type of family households are 2-person households, comprising 37, and the most common type of nonfamily households are 1-person households, comprising 13.
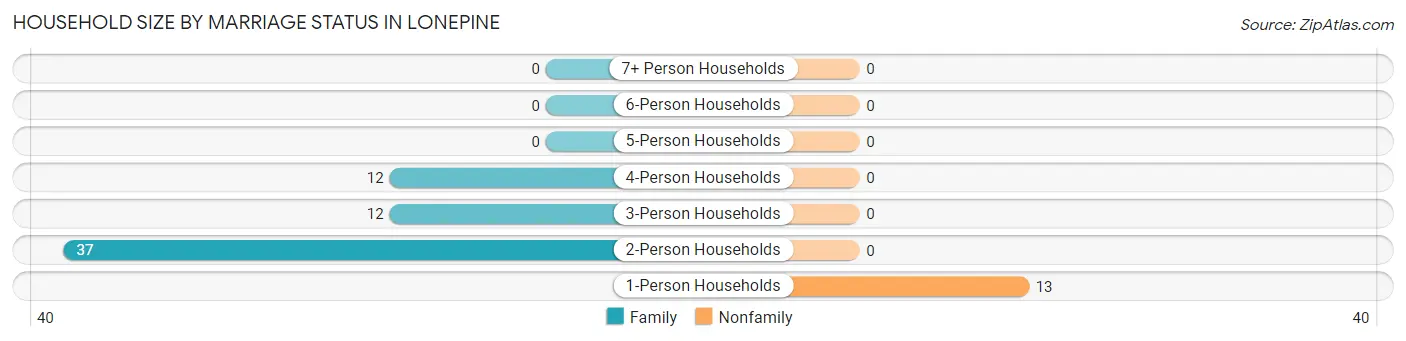
| Household Size | Family Households | Nonfamily Households |
| 1-Person Households | - | 13 (17.6%) |
| 2-Person Households | 37 (50.0%) | 0 (0.0%) |
| 3-Person Households | 12 (16.2%) | 0 (0.0%) |
| 4-Person Households | 12 (16.2%) | 0 (0.0%) |
| 5-Person Households | 0 (0.0%) | 0 (0.0%) |
| 6-Person Households | 0 (0.0%) | 0 (0.0%) |
| 7+ Person Households | 0 (0.0%) | 0 (0.0%) |
| Total | 61 (82.4%) | 13 (17.6%) |
Female Fertility in Lonepine
Fertility by Age in Lonepine
Average fertility rate in Lonepine is 300.0 births per 1,000 women. Women in the age bracket of 20 to 34 years have the highest fertility rate with 300.0 births per 1,000 women. Women in the age bracket of 20 to 34 years acount for 100.0% of all women with births.
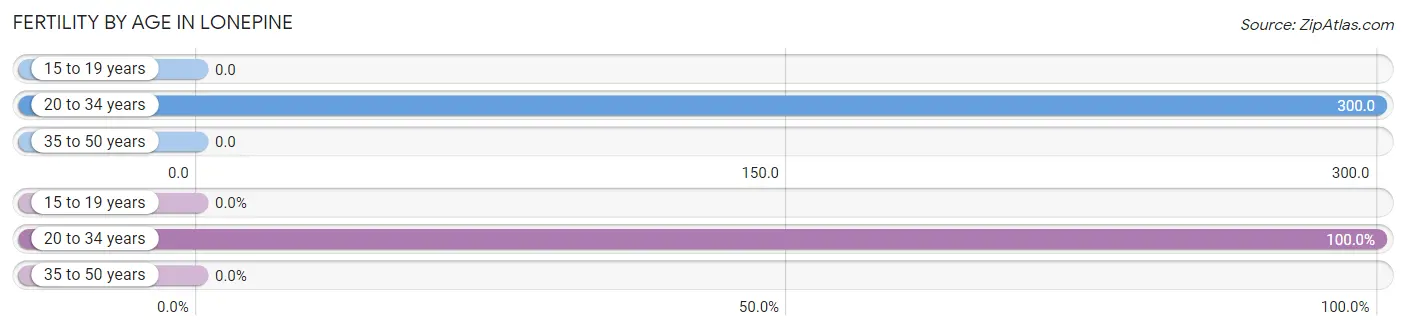
| Age Bracket | Women with Births | Births / 1,000 Women |
| 15 to 19 years | 0 (0.0%) | 0.0 |
| 20 to 34 years | 3 (100.0%) | 300.0 |
| 35 to 50 years | 0 (0.0%) | 0.0 |
| Total | 3 (100.0%) | 300.0 |
Fertility by Age by Marriage Status in Lonepine
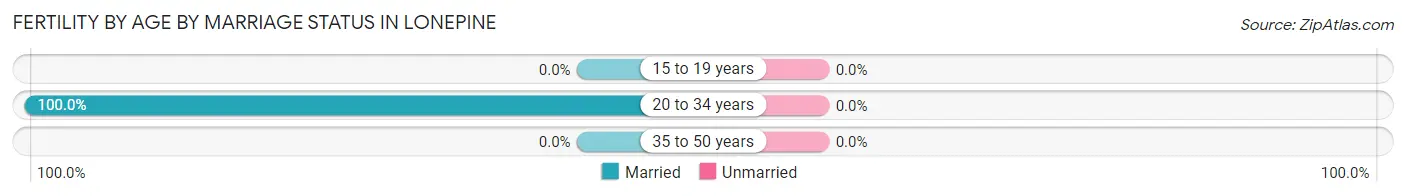
| Age Bracket | Married | Unmarried |
| 15 to 19 years | 0 (0.0%) | 0 (0.0%) |
| 20 to 34 years | 3 (100.0%) | 0 (0.0%) |
| 35 to 50 years | 0 (0.0%) | 0 (0.0%) |
| Total | 3 (100.0%) | 0 (0.0%) |
Fertility by Education in Lonepine
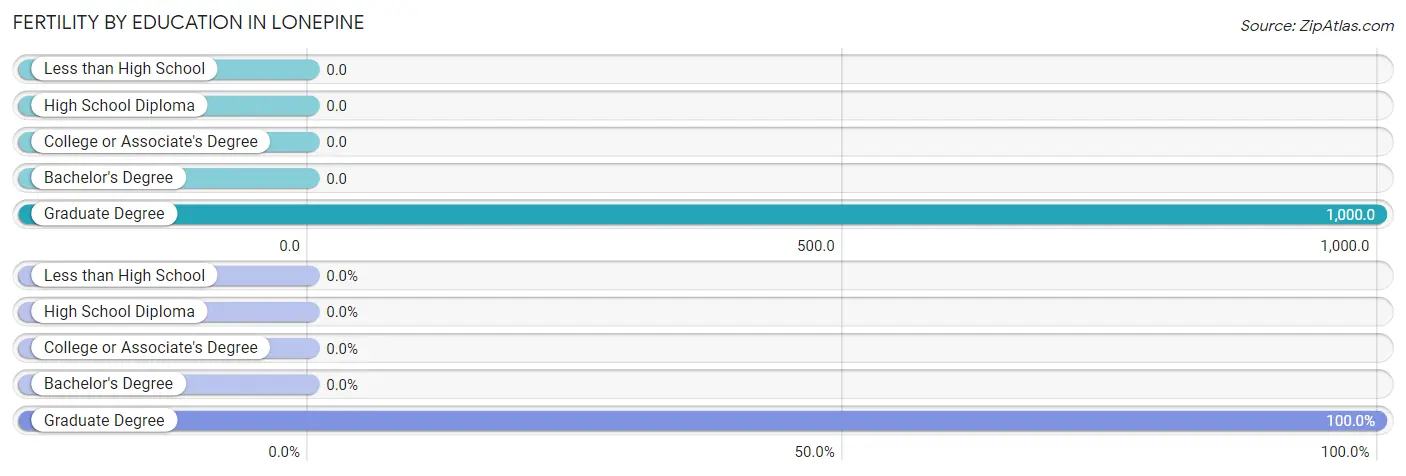
| Educational Attainment | Women with Births | Births / 1,000 Women |
| Less than High School | 0 (0.0%) | 0.0 |
| High School Diploma | 0 (0.0%) | 0.0 |
| College or Associate's Degree | 0 (0.0%) | 0.0 |
| Bachelor's Degree | 0 (0.0%) | 0.0 |
| Graduate Degree | 3 (100.0%) | 1,000.0 |
| Total | 3 (100.0%) | 300.0 |
Fertility by Education by Marriage Status in Lonepine
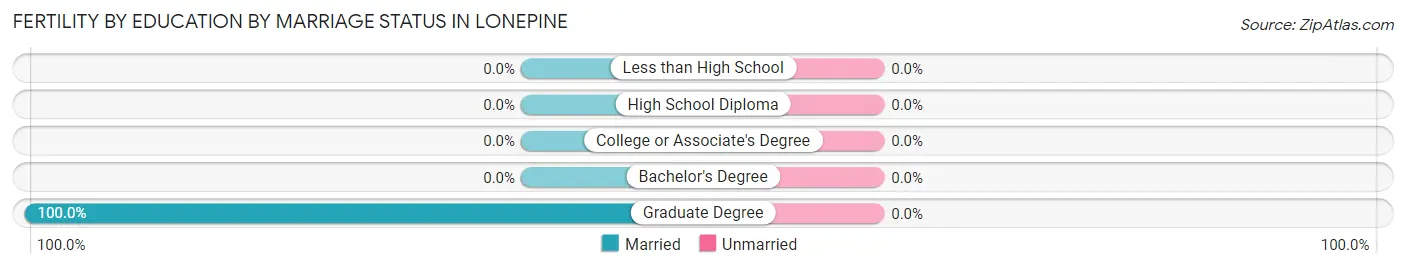
| Educational Attainment | Married | Unmarried |
| Less than High School | 0 (0.0%) | 0 (0.0%) |
| High School Diploma | 0 (0.0%) | 0 (0.0%) |
| College or Associate's Degree | 0 (0.0%) | 0 (0.0%) |
| Bachelor's Degree | 0 (0.0%) | 0 (0.0%) |
| Graduate Degree | 3 (100.0%) | 0 (0.0%) |
| Total | 3 (100.0%) | 0 (0.0%) |
Employment Characteristics in Lonepine
Employment by Class of Employer in Lonepine
Among the 63 employed individuals in Lonepine, private company employees (44 | 69.8%), self-employed (not incorporated) (18 | 28.6%), and federal government employees (1 | 1.6%) make up the most common classes of employment.
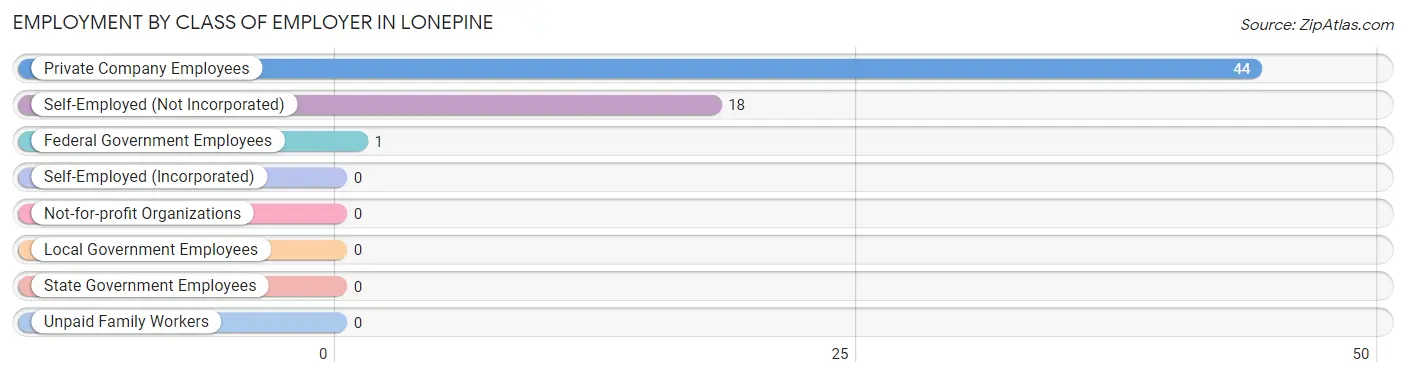
| Employer Class | # Employees | % Employees |
| Private Company Employees | 44 | 69.8% |
| Self-Employed (Incorporated) | 0 | 0.0% |
| Self-Employed (Not Incorporated) | 18 | 28.6% |
| Not-for-profit Organizations | 0 | 0.0% |
| Local Government Employees | 0 | 0.0% |
| State Government Employees | 0 | 0.0% |
| Federal Government Employees | 1 | 1.6% |
| Unpaid Family Workers | 0 | 0.0% |
| Total | 63 | 100.0% |
Employment Status by Age in Lonepine
According to the labor force statistics for Lonepine, out of the total population over 16 years of age (119), 56.3% or 67 individuals are in the labor force, with 6.0% or 4 of them unemployed. The age group with the highest labor force participation rate is 25 to 29 years, with 100.0% or 28 individuals in the labor force. Within the labor force, the 45 to 54 years age range has the highest percentage of unemployed individuals, with 36.4% or 4 of them being unemployed.
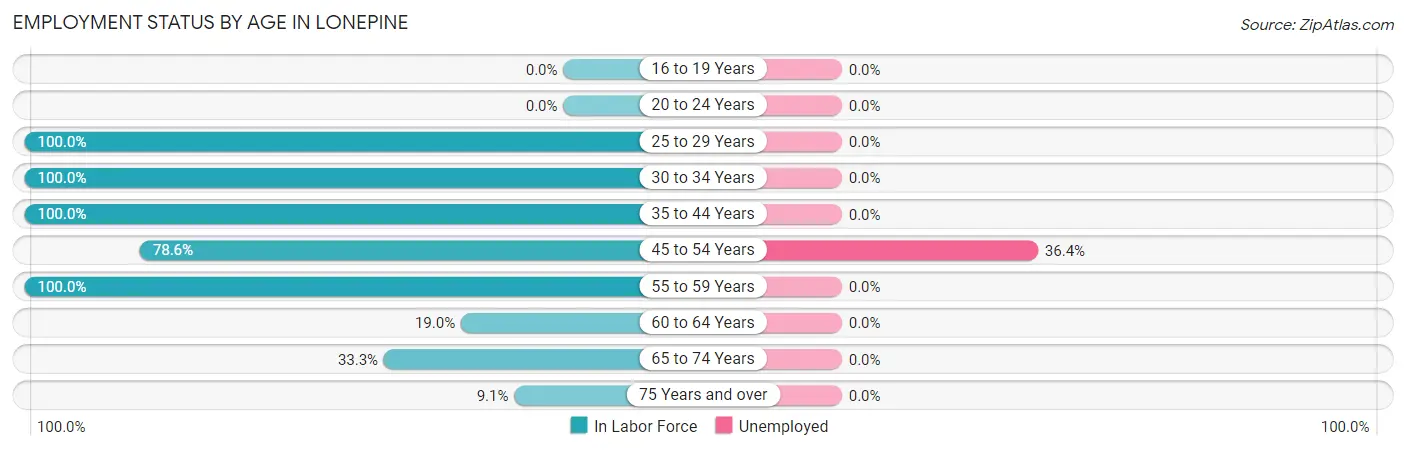
| Age Bracket | In Labor Force | Unemployed |
| 16 to 19 Years | 0 (0.0%) | 0 (0.0%) |
| 20 to 24 Years | 0 (0.0%) | 0 (0.0%) |
| 25 to 29 Years | 28 (100.0%) | 0 (0.0%) |
| 30 to 34 Years | 3 (100.0%) | 0 (0.0%) |
| 35 to 44 Years | 5 (100.0%) | 0 (0.0%) |
| 45 to 54 Years | 11 (78.6%) | 4 (36.4%) |
| 55 to 59 Years | 4 (100.0%) | 0 (0.0%) |
| 60 to 64 Years | 4 (19.0%) | 0 (0.0%) |
| 65 to 74 Years | 11 (33.3%) | 0 (0.0%) |
| 75 Years and over | 1 (9.1%) | 0 (0.0%) |
| Total | 67 (56.3%) | 4 (6.0%) |
Employment Status by Educational Attainment in Lonepine
According to labor force statistics for Lonepine, 73.3% of individuals (55) out of the total population between 25 and 64 years of age (75) are in the labor force, with 7.3% or 4 of them being unemployed. The group with the highest labor force participation rate are those with the educational attainment of bachelor's degree or higher, with 100.0% or 25 individuals in the labor force. Within the labor force, individuals with high school diploma education have the highest percentage of unemployment, with 16.7% or 4 of them being unemployed.
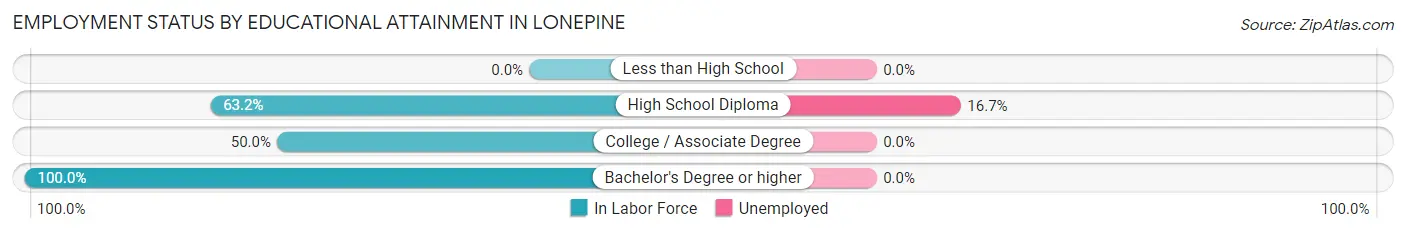
| Educational Attainment | In Labor Force | Unemployed |
| Less than High School | 0 (0.0%) | 0 (0.0%) |
| High School Diploma | 24 (63.2%) | 6 (16.7%) |
| College / Associate Degree | 6 (50.0%) | 0 (0.0%) |
| Bachelor's Degree or higher | 25 (100.0%) | 0 (0.0%) |
| Total | 55 (73.3%) | 5 (7.3%) |
Employment Occupations by Sex in Lonepine
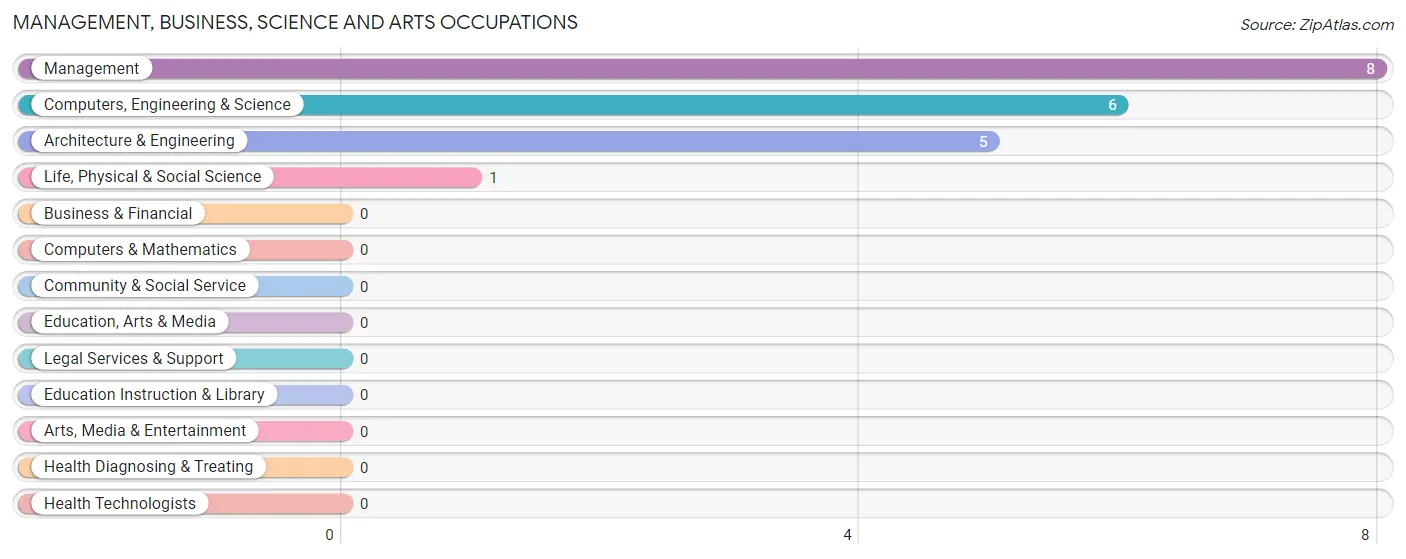
Management, Business, Science and Arts Occupations
The most common Management, Business, Science and Arts occupations in Lonepine are Management (8 | 12.7%), Computers, Engineering & Science (6 | 9.5%), Architecture & Engineering (5 | 7.9%), and Life, Physical & Social Science (1 | 1.6%).
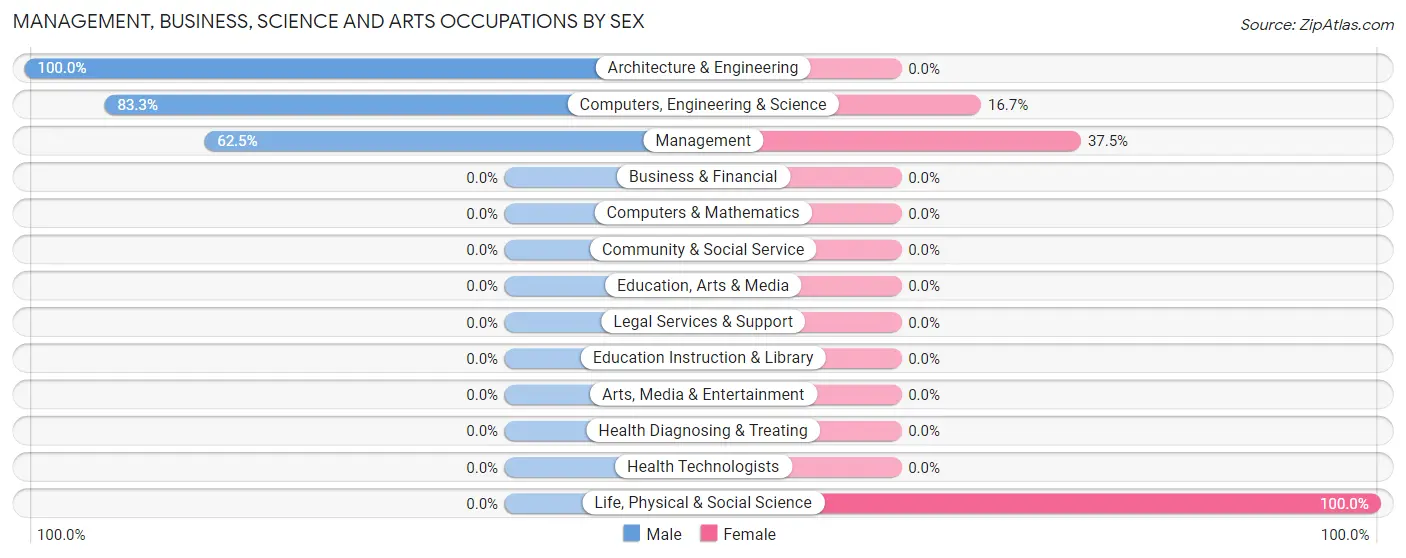
Management, Business, Science and Arts Occupations by Sex
Within the Management, Business, Science and Arts occupations in Lonepine, the most male-oriented occupations are Architecture & Engineering (100.0%), Computers, Engineering & Science (83.3%), and Management (62.5%), while the most female-oriented occupations are Life, Physical & Social Science (100.0%), Management (37.5%), and Computers, Engineering & Science (16.7%).
| Occupation | Male | Female |
| Management | 5 (62.5%) | 3 (37.5%) |
| Business & Financial | 0 (0.0%) | 0 (0.0%) |
| Computers, Engineering & Science | 5 (83.3%) | 1 (16.7%) |
| Computers & Mathematics | 0 (0.0%) | 0 (0.0%) |
| Architecture & Engineering | 5 (100.0%) | 0 (0.0%) |
| Life, Physical & Social Science | 0 (0.0%) | 1 (100.0%) |
| Community & Social Service | 0 (0.0%) | 0 (0.0%) |
| Education, Arts & Media | 0 (0.0%) | 0 (0.0%) |
| Legal Services & Support | 0 (0.0%) | 0 (0.0%) |
| Education Instruction & Library | 0 (0.0%) | 0 (0.0%) |
| Arts, Media & Entertainment | 0 (0.0%) | 0 (0.0%) |
| Health Diagnosing & Treating | 0 (0.0%) | 0 (0.0%) |
| Health Technologists | 0 (0.0%) | 0 (0.0%) |
| Total (Category) | 10 (71.4%) | 4 (28.6%) |
| Total (Overall) | 38 (60.3%) | 25 (39.7%) |
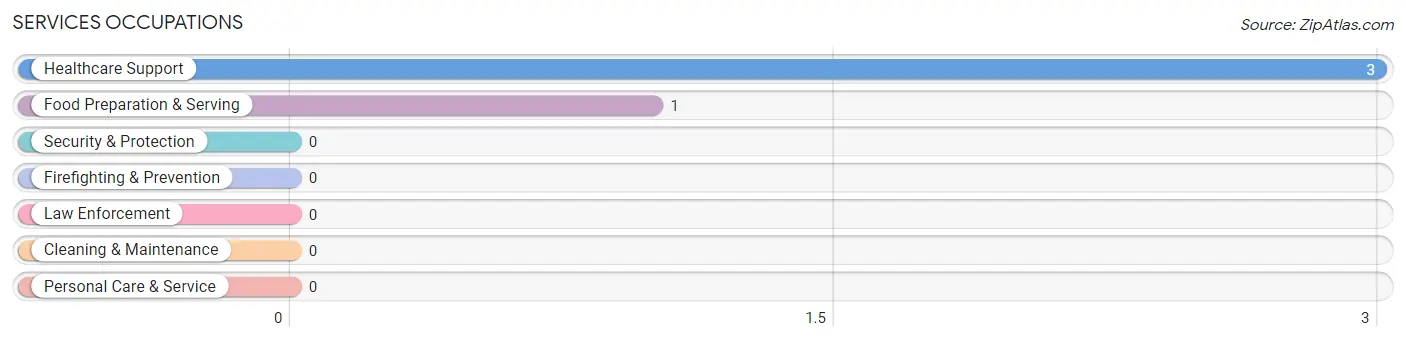
Services Occupations
The most common Services occupations in Lonepine are Healthcare Support (3 | 4.8%), and Food Preparation & Serving (1 | 1.6%).
Services Occupations by Sex
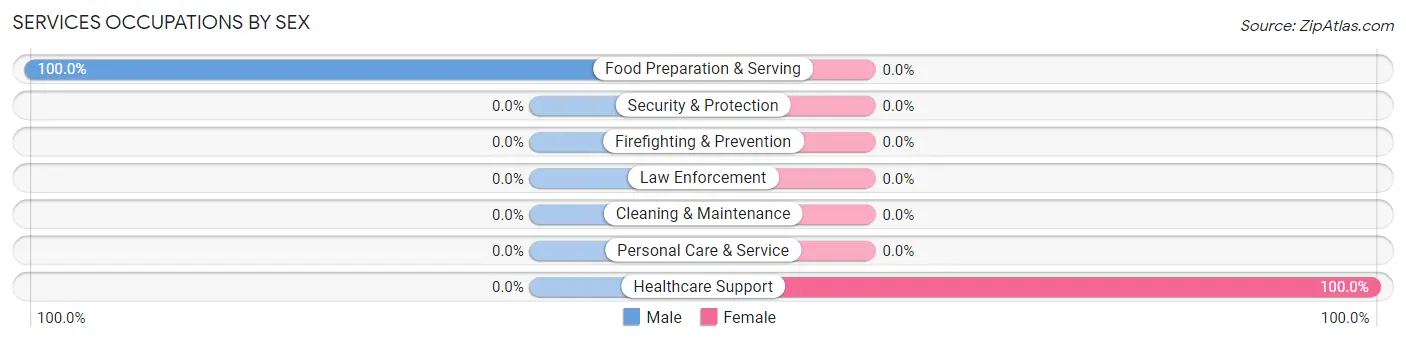
| Occupation | Male | Female |
| Healthcare Support | 0 (0.0%) | 3 (100.0%) |
| Security & Protection | 0 (0.0%) | 0 (0.0%) |
| Firefighting & Prevention | 0 (0.0%) | 0 (0.0%) |
| Law Enforcement | 0 (0.0%) | 0 (0.0%) |
| Food Preparation & Serving | 1 (100.0%) | 0 (0.0%) |
| Cleaning & Maintenance | 0 (0.0%) | 0 (0.0%) |
| Personal Care & Service | 0 (0.0%) | 0 (0.0%) |
| Total (Category) | 1 (25.0%) | 3 (75.0%) |
| Total (Overall) | 38 (60.3%) | 25 (39.7%) |
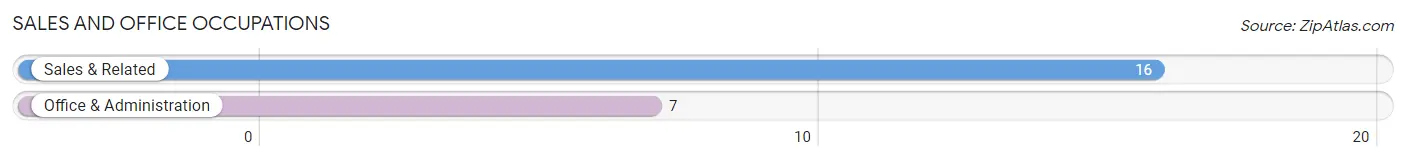
Sales and Office Occupations
The most common Sales and Office occupations in Lonepine are Sales & Related (16 | 25.4%), and Office & Administration (7 | 11.1%).
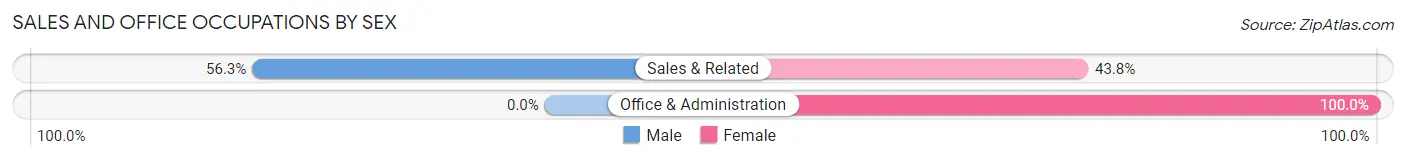
Sales and Office Occupations by Sex
| Occupation | Male | Female |
| Sales & Related | 9 (56.2%) | 7 (43.8%) |
| Office & Administration | 0 (0.0%) | 7 (100.0%) |
| Total (Category) | 9 (39.1%) | 14 (60.9%) |
| Total (Overall) | 38 (60.3%) | 25 (39.7%) |
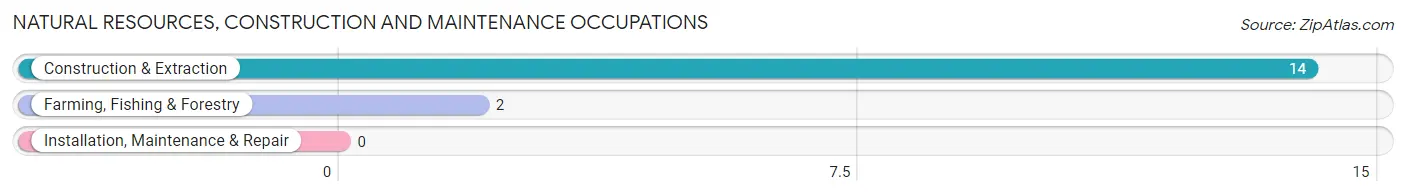
Natural Resources, Construction and Maintenance Occupations
The most common Natural Resources, Construction and Maintenance occupations in Lonepine are Construction & Extraction (14 | 22.2%), and Farming, Fishing & Forestry (2 | 3.2%).
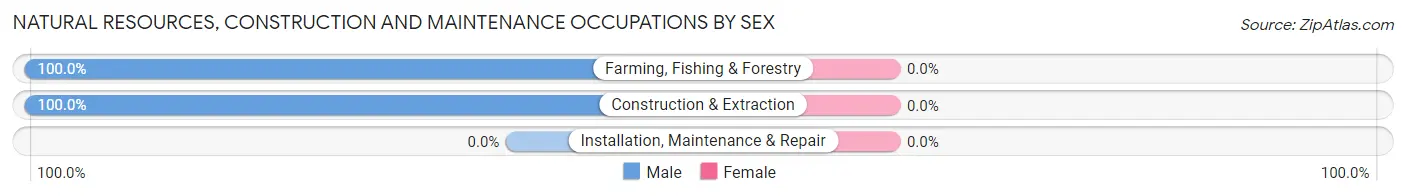
Natural Resources, Construction and Maintenance Occupations by Sex
| Occupation | Male | Female |
| Farming, Fishing & Forestry | 2 (100.0%) | 0 (0.0%) |
| Construction & Extraction | 14 (100.0%) | 0 (0.0%) |
| Installation, Maintenance & Repair | 0 (0.0%) | 0 (0.0%) |
| Total (Category) | 16 (100.0%) | 0 (0.0%) |
| Total (Overall) | 38 (60.3%) | 25 (39.7%) |
Production, Transportation and Moving Occupations
The most common Production, Transportation and Moving occupations in Lonepine are Production (4 | 6.4%), and Transportation (2 | 3.2%).
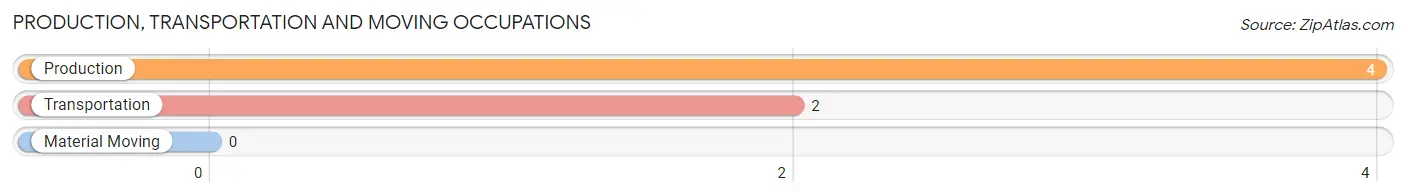
Production, Transportation and Moving Occupations by Sex
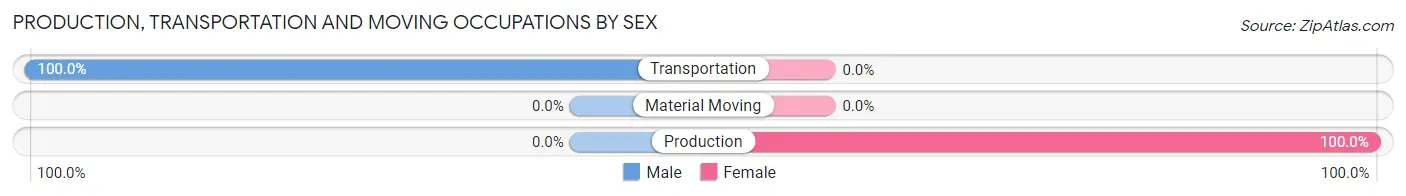
| Occupation | Male | Female |
| Production | 0 (0.0%) | 4 (100.0%) |
| Transportation | 2 (100.0%) | 0 (0.0%) |
| Material Moving | 0 (0.0%) | 0 (0.0%) |
| Total (Category) | 2 (33.3%) | 4 (66.7%) |
| Total (Overall) | 38 (60.3%) | 25 (39.7%) |
Employment Industries by Sex in Lonepine
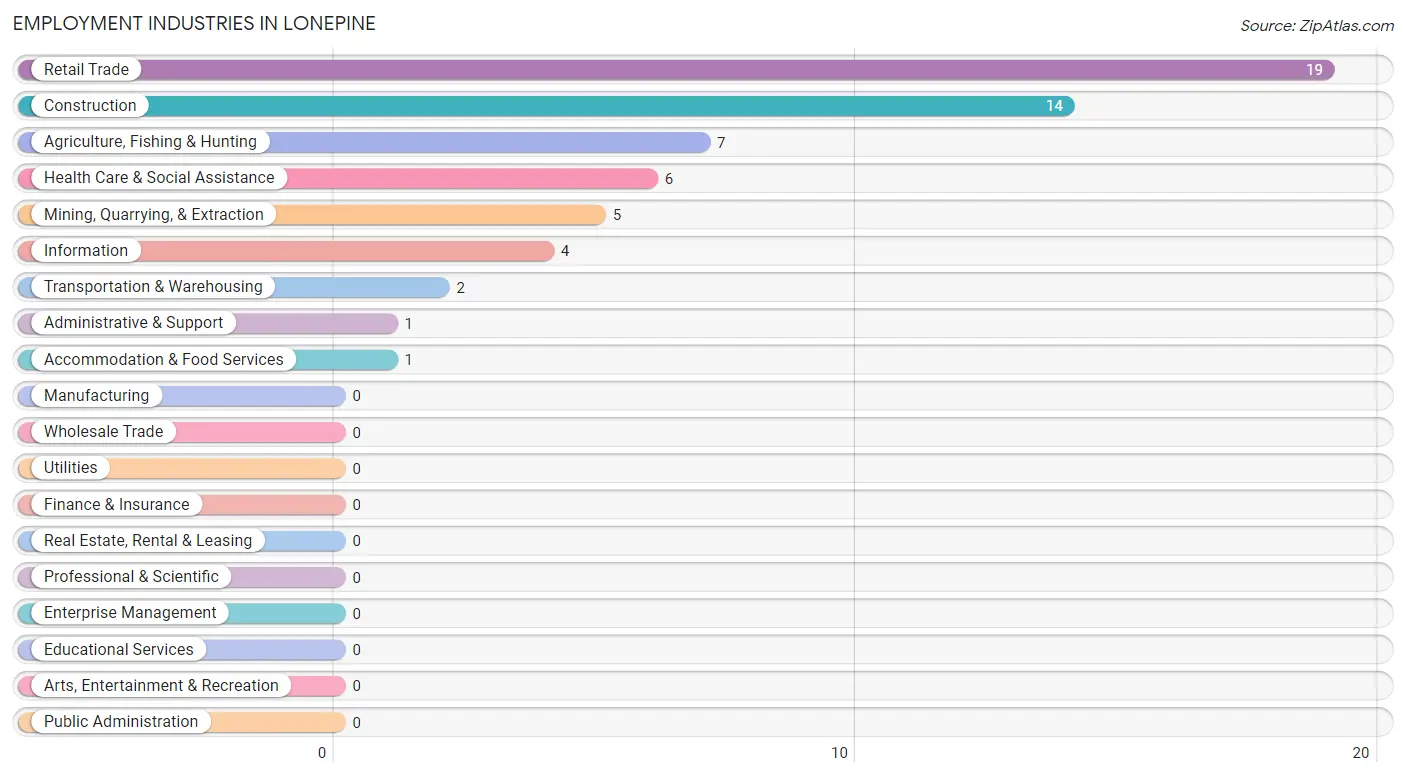
Employment Industries in Lonepine
The major employment industries in Lonepine include Retail Trade (19 | 30.2%), Construction (14 | 22.2%), Agriculture, Fishing & Hunting (7 | 11.1%), Health Care & Social Assistance (6 | 9.5%), and Mining, Quarrying, & Extraction (5 | 7.9%).
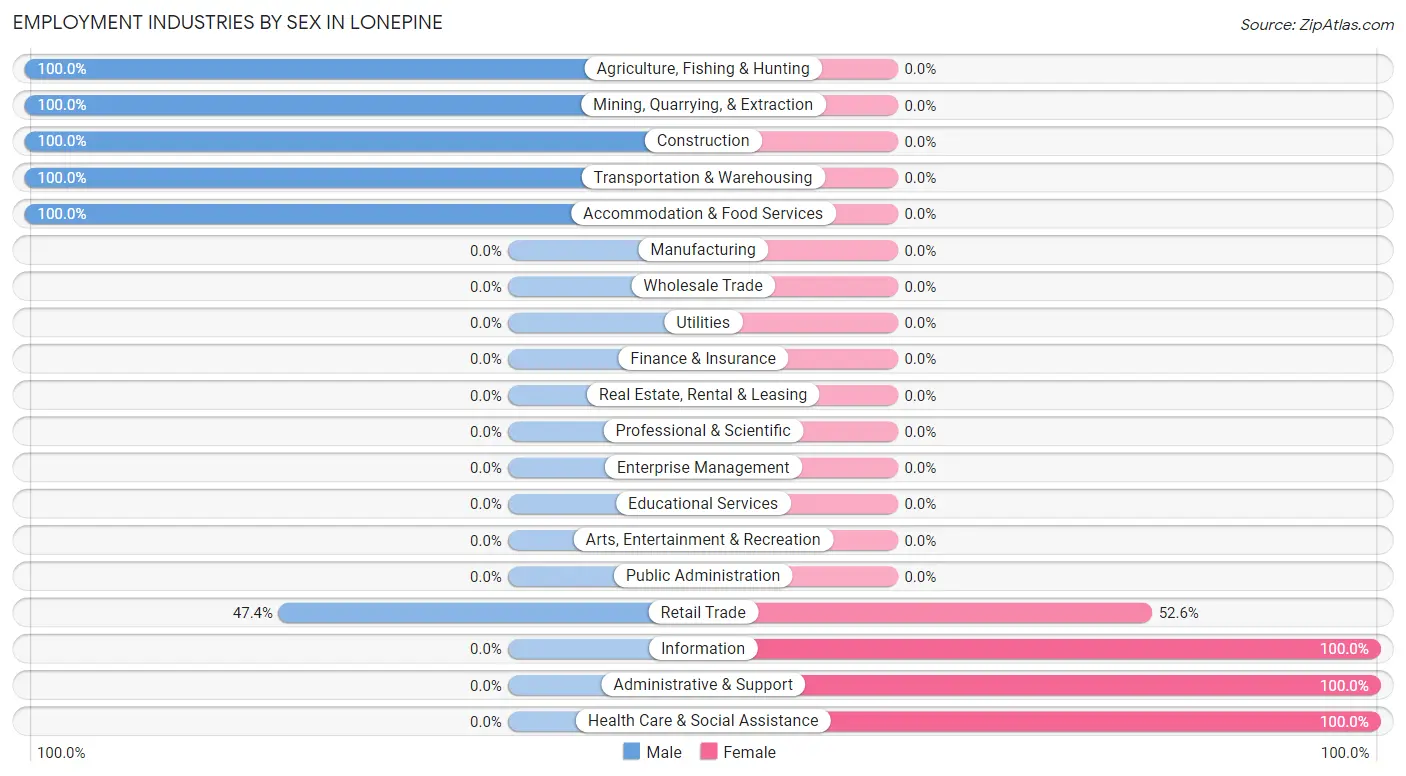
Employment Industries by Sex in Lonepine
The Lonepine industries that see more men than women are Agriculture, Fishing & Hunting (100.0%), Mining, Quarrying, & Extraction (100.0%), and Construction (100.0%), whereas the industries that tend to have a higher number of women are Information (100.0%), Administrative & Support (100.0%), and Health Care & Social Assistance (100.0%).
| Industry | Male | Female |
| Agriculture, Fishing & Hunting | 7 (100.0%) | 0 (0.0%) |
| Mining, Quarrying, & Extraction | 5 (100.0%) | 0 (0.0%) |
| Construction | 14 (100.0%) | 0 (0.0%) |
| Manufacturing | 0 (0.0%) | 0 (0.0%) |
| Wholesale Trade | 0 (0.0%) | 0 (0.0%) |
| Retail Trade | 9 (47.4%) | 10 (52.6%) |
| Transportation & Warehousing | 2 (100.0%) | 0 (0.0%) |
| Utilities | 0 (0.0%) | 0 (0.0%) |
| Information | 0 (0.0%) | 4 (100.0%) |
| Finance & Insurance | 0 (0.0%) | 0 (0.0%) |
| Real Estate, Rental & Leasing | 0 (0.0%) | 0 (0.0%) |
| Professional & Scientific | 0 (0.0%) | 0 (0.0%) |
| Enterprise Management | 0 (0.0%) | 0 (0.0%) |
| Administrative & Support | 0 (0.0%) | 1 (100.0%) |
| Educational Services | 0 (0.0%) | 0 (0.0%) |
| Health Care & Social Assistance | 0 (0.0%) | 6 (100.0%) |
| Arts, Entertainment & Recreation | 0 (0.0%) | 0 (0.0%) |
| Accommodation & Food Services | 1 (100.0%) | 0 (0.0%) |
| Public Administration | 0 (0.0%) | 0 (0.0%) |
| Total | 38 (60.3%) | 25 (39.7%) |
Education in Lonepine
School Enrollment in Lonepine
The most common levels of schooling among the 14 students in Lonepine are nursery / preschool (8 | 57.1%), elementary school (3 | 21.4%), and middle school (3 | 21.4%).
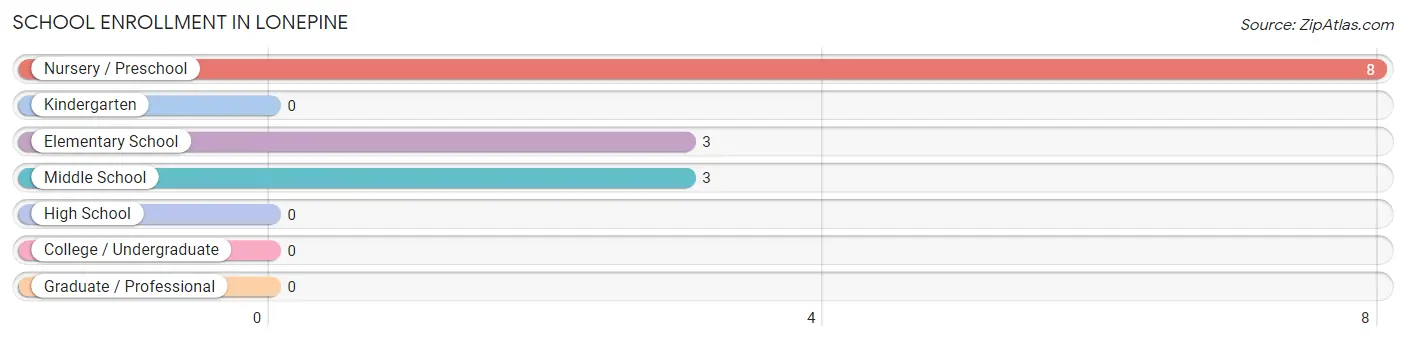
| School Level | # Students | % Students |
| Nursery / Preschool | 8 | 57.1% |
| Kindergarten | 0 | 0.0% |
| Elementary School | 3 | 21.4% |
| Middle School | 3 | 21.4% |
| High School | 0 | 0.0% |
| College / Undergraduate | 0 | 0.0% |
| Graduate / Professional | 0 | 0.0% |
| Total | 14 | 100.0% |
School Enrollment by Age by Funding Source in Lonepine
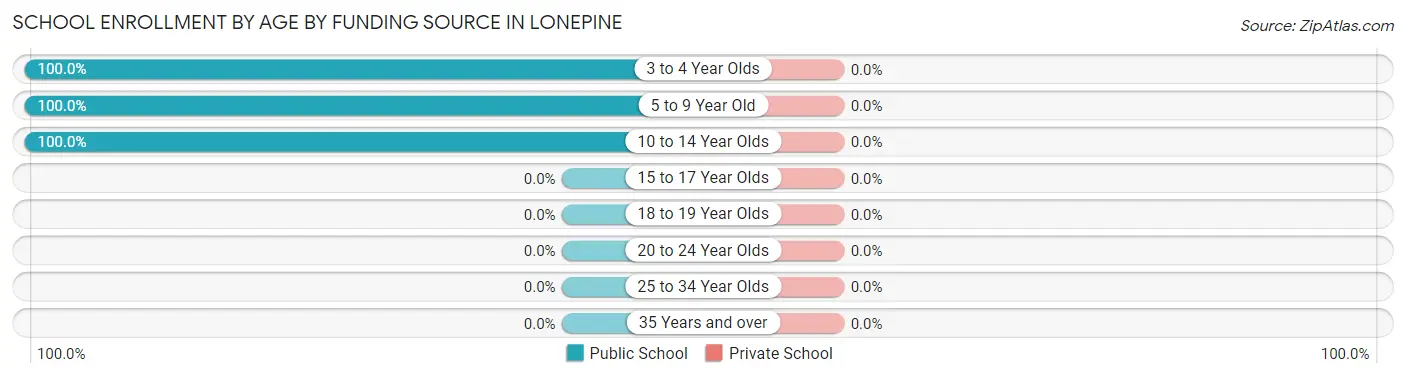
| Age Bracket | Public School | Private School |
| 3 to 4 Year Olds | 4 (100.0%) | 0 (0.0%) |
| 5 to 9 Year Old | 4 (100.0%) | 0 (0.0%) |
| 10 to 14 Year Olds | 6 (100.0%) | 0 (0.0%) |
| 15 to 17 Year Olds | 0 (0.0%) | 0 (0.0%) |
| 18 to 19 Year Olds | 0 (0.0%) | 0 (0.0%) |
| 20 to 24 Year Olds | 0 (0.0%) | 0 (0.0%) |
| 25 to 34 Year Olds | 0 (0.0%) | 0 (0.0%) |
| 35 Years and over | 0 (0.0%) | 0 (0.0%) |
| Total | 14 (100.0%) | 0 (0.0%) |
Educational Attainment by Field of Study in Lonepine
Bio, nature & agricultural (9 | 33.3%), education (7 | 25.9%), engineering (5 | 18.5%), business (3 | 11.1%), and physical & health sciences (2 | 7.4%) are the most common fields of study among 27 individuals in Lonepine who have obtained a bachelor's degree or higher.
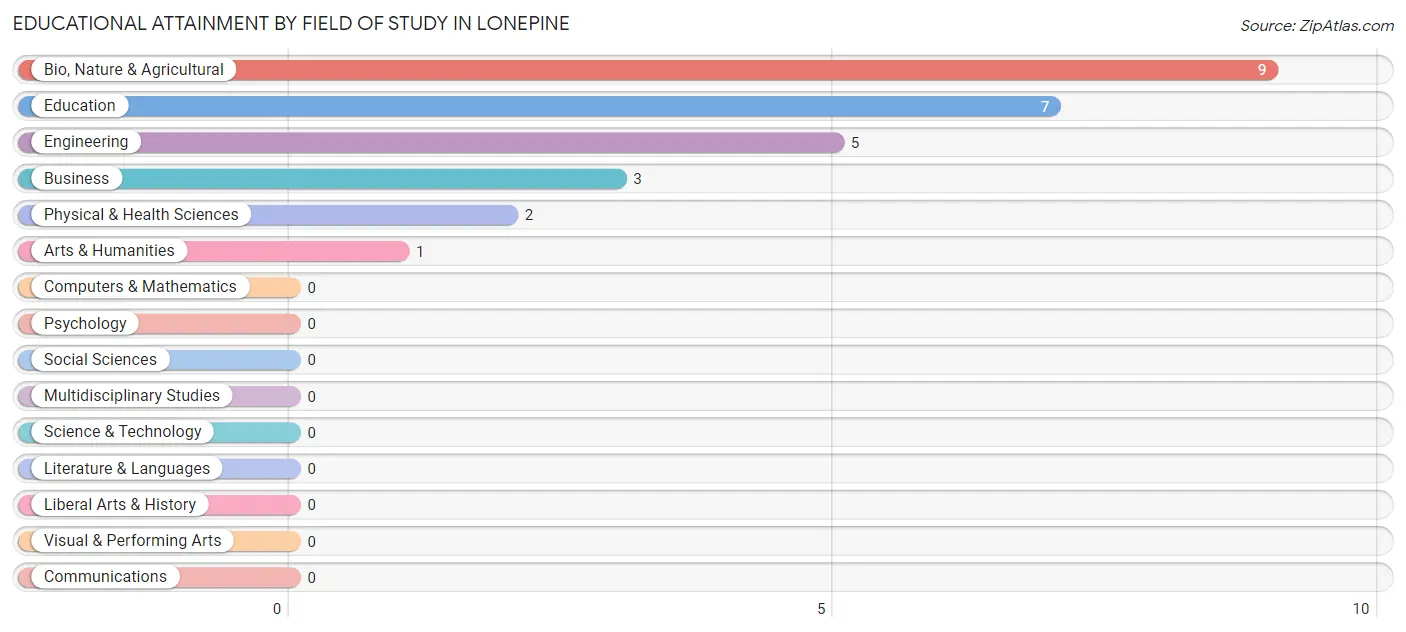
| Field of Study | # Graduates | % Graduates |
| Computers & Mathematics | 0 | 0.0% |
| Bio, Nature & Agricultural | 9 | 33.3% |
| Physical & Health Sciences | 2 | 7.4% |
| Psychology | 0 | 0.0% |
| Social Sciences | 0 | 0.0% |
| Engineering | 5 | 18.5% |
| Multidisciplinary Studies | 0 | 0.0% |
| Science & Technology | 0 | 0.0% |
| Business | 3 | 11.1% |
| Education | 7 | 25.9% |
| Literature & Languages | 0 | 0.0% |
| Liberal Arts & History | 0 | 0.0% |
| Visual & Performing Arts | 0 | 0.0% |
| Communications | 0 | 0.0% |
| Arts & Humanities | 1 | 3.7% |
| Total | 27 | 100.0% |
Transportation & Commute in Lonepine
Vehicle Availability by Sex in Lonepine
The most prevalent vehicle ownership categories in Lonepine are males with 3 vehicles (18, accounting for 47.4%) and females with 3 vehicles (6, making up 72.0%).
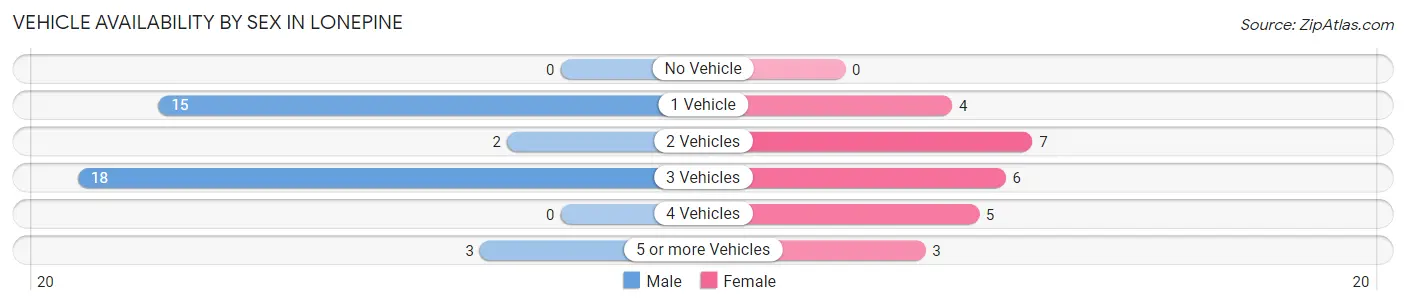
| Vehicles Available | Male | Female |
| No Vehicle | 0 (0.0%) | 0 (0.0%) |
| 1 Vehicle | 15 (39.5%) | 4 (16.0%) |
| 2 Vehicles | 2 (5.3%) | 7 (28.0%) |
| 3 Vehicles | 18 (47.4%) | 6 (24.0%) |
| 4 Vehicles | 0 (0.0%) | 5 (20.0%) |
| 5 or more Vehicles | 3 (7.9%) | 3 (12.0%) |
| Total | 38 (100.0%) | 25 (100.0%) |
Commute Time in Lonepine
The most frequently occuring commute durations in Lonepine are 5 to 9 minutes (12 commuters, 24.0%), 10 to 14 minutes (9 commuters, 18.0%), and 15 to 19 minutes (9 commuters, 18.0%).
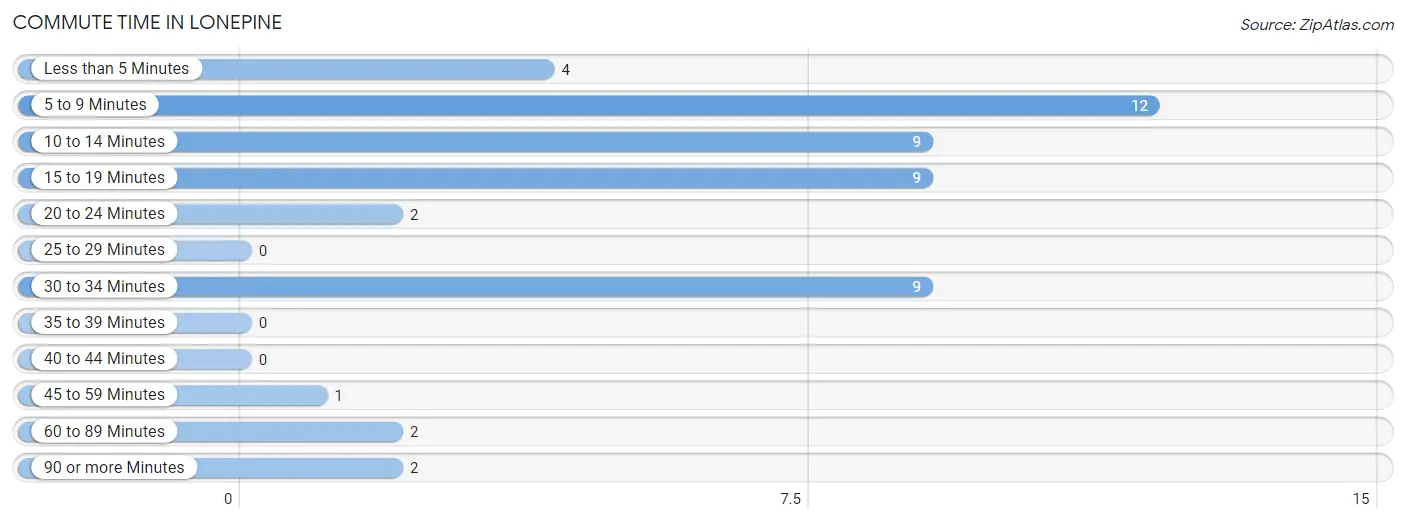
| Commute Time | # Commuters | % Commuters |
| Less than 5 Minutes | 4 | 8.0% |
| 5 to 9 Minutes | 12 | 24.0% |
| 10 to 14 Minutes | 9 | 18.0% |
| 15 to 19 Minutes | 9 | 18.0% |
| 20 to 24 Minutes | 2 | 4.0% |
| 25 to 29 Minutes | 0 | 0.0% |
| 30 to 34 Minutes | 9 | 18.0% |
| 35 to 39 Minutes | 0 | 0.0% |
| 40 to 44 Minutes | 0 | 0.0% |
| 45 to 59 Minutes | 1 | 2.0% |
| 60 to 89 Minutes | 2 | 4.0% |
| 90 or more Minutes | 2 | 4.0% |
Commute Time by Sex in Lonepine
The most common commute times in Lonepine are 5 to 9 minutes (12 commuters, 41.4%) for males and 30 to 34 minutes (9 commuters, 42.9%) for females.
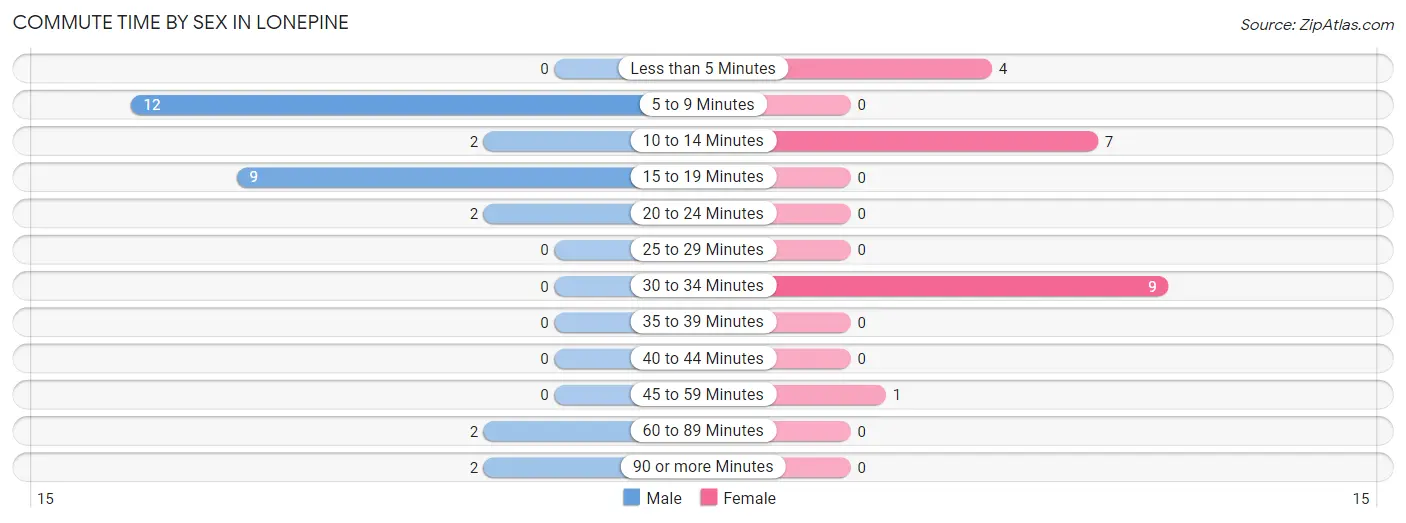
| Commute Time | Male | Female |
| Less than 5 Minutes | 0 (0.0%) | 4 (19.1%) |
| 5 to 9 Minutes | 12 (41.4%) | 0 (0.0%) |
| 10 to 14 Minutes | 2 (6.9%) | 7 (33.3%) |
| 15 to 19 Minutes | 9 (31.0%) | 0 (0.0%) |
| 20 to 24 Minutes | 2 (6.9%) | 0 (0.0%) |
| 25 to 29 Minutes | 0 (0.0%) | 0 (0.0%) |
| 30 to 34 Minutes | 0 (0.0%) | 9 (42.9%) |
| 35 to 39 Minutes | 0 (0.0%) | 0 (0.0%) |
| 40 to 44 Minutes | 0 (0.0%) | 0 (0.0%) |
| 45 to 59 Minutes | 0 (0.0%) | 1 (4.8%) |
| 60 to 89 Minutes | 2 (6.9%) | 0 (0.0%) |
| 90 or more Minutes | 2 (6.9%) | 0 (0.0%) |
Time of Departure to Work by Sex in Lonepine
The most frequent times of departure to work in Lonepine are 10:00 AM to 10:59 AM (12, 41.4%) for males and 7:00 AM to 7:29 AM (7, 33.3%) for females.
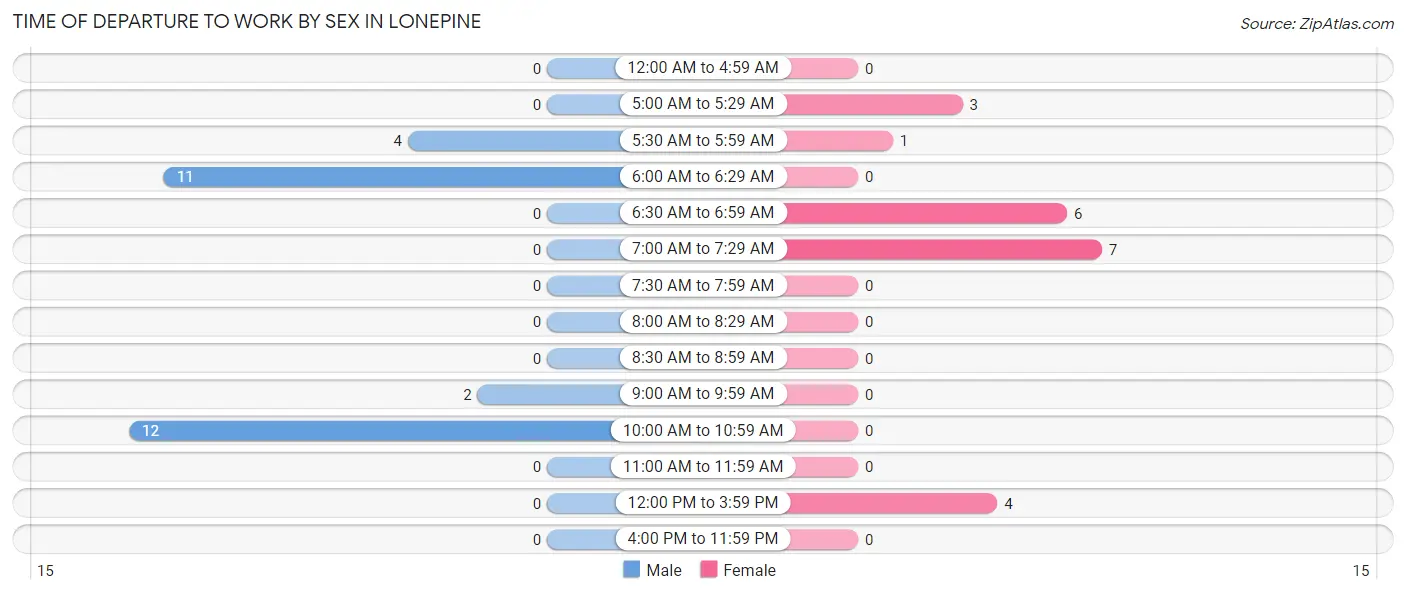
| Time of Departure | Male | Female |
| 12:00 AM to 4:59 AM | 0 (0.0%) | 0 (0.0%) |
| 5:00 AM to 5:29 AM | 0 (0.0%) | 3 (14.3%) |
| 5:30 AM to 5:59 AM | 4 (13.8%) | 1 (4.8%) |
| 6:00 AM to 6:29 AM | 11 (37.9%) | 0 (0.0%) |
| 6:30 AM to 6:59 AM | 0 (0.0%) | 6 (28.6%) |
| 7:00 AM to 7:29 AM | 0 (0.0%) | 7 (33.3%) |
| 7:30 AM to 7:59 AM | 0 (0.0%) | 0 (0.0%) |
| 8:00 AM to 8:29 AM | 0 (0.0%) | 0 (0.0%) |
| 8:30 AM to 8:59 AM | 0 (0.0%) | 0 (0.0%) |
| 9:00 AM to 9:59 AM | 2 (6.9%) | 0 (0.0%) |
| 10:00 AM to 10:59 AM | 12 (41.4%) | 0 (0.0%) |
| 11:00 AM to 11:59 AM | 0 (0.0%) | 0 (0.0%) |
| 12:00 PM to 3:59 PM | 0 (0.0%) | 4 (19.1%) |
| 4:00 PM to 11:59 PM | 0 (0.0%) | 0 (0.0%) |
| Total | 29 (100.0%) | 21 (100.0%) |
Housing Occupancy in Lonepine
Occupancy by Ownership in Lonepine
Of the total 74 dwellings in Lonepine, owner-occupied units account for 51 (68.9%), while renter-occupied units make up 23 (31.1%).
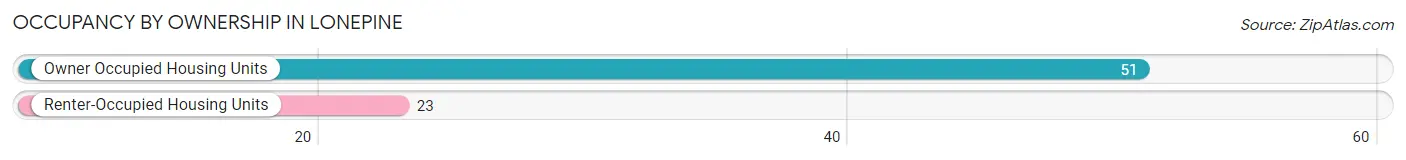
| Occupancy | # Housing Units | % Housing Units |
| Owner Occupied Housing Units | 51 | 68.9% |
| Renter-Occupied Housing Units | 23 | 31.1% |
| Total Occupied Housing Units | 74 | 100.0% |
Occupancy by Household Size in Lonepine
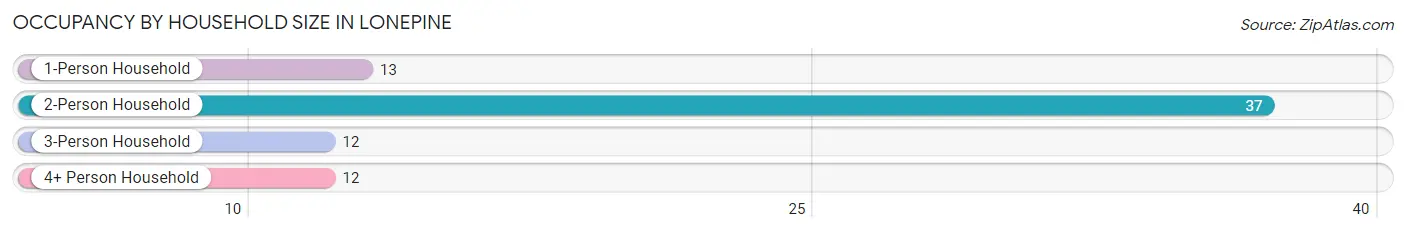
| Household Size | # Housing Units | % Housing Units |
| 1-Person Household | 13 | 17.6% |
| 2-Person Household | 37 | 50.0% |
| 3-Person Household | 12 | 16.2% |
| 4+ Person Household | 12 | 16.2% |
| Total Housing Units | 74 | 100.0% |
Occupancy by Ownership by Household Size in Lonepine
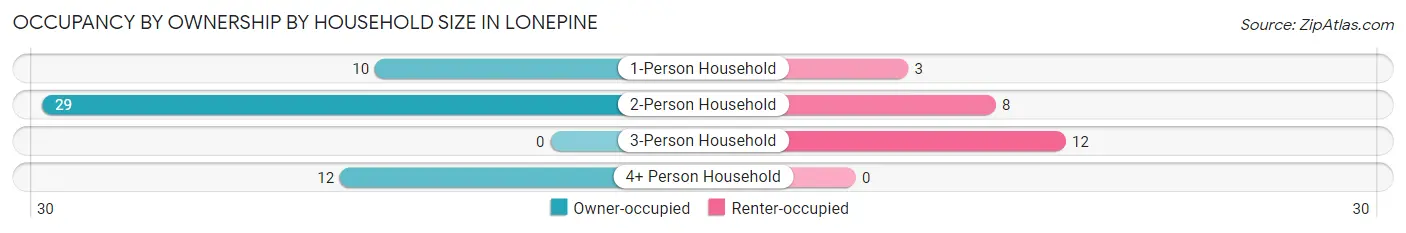
| Household Size | Owner-occupied | Renter-occupied |
| 1-Person Household | 10 (76.9%) | 3 (23.1%) |
| 2-Person Household | 29 (78.4%) | 8 (21.6%) |
| 3-Person Household | 0 (0.0%) | 12 (100.0%) |
| 4+ Person Household | 12 (100.0%) | 0 (0.0%) |
| Total Housing Units | 51 (68.9%) | 23 (31.1%) |
Occupancy by Educational Attainment in Lonepine
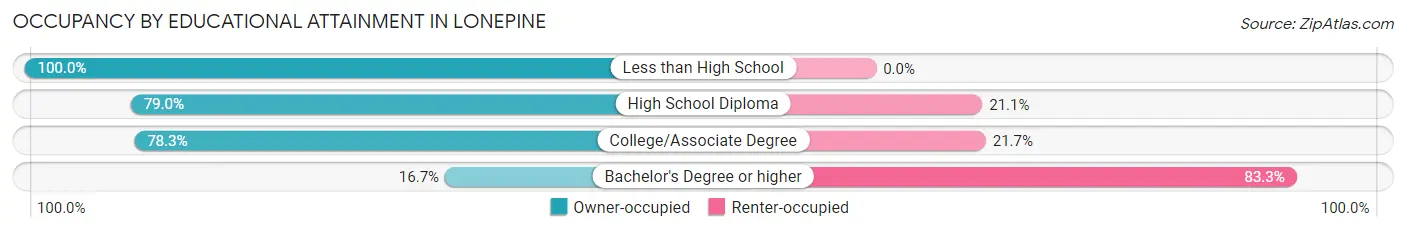
| Household Size | Owner-occupied | Renter-occupied |
| Less than High School | 1 (100.0%) | 0 (0.0%) |
| High School Diploma | 30 (78.9%) | 8 (21.0%) |
| College/Associate Degree | 18 (78.3%) | 5 (21.7%) |
| Bachelor's Degree or higher | 2 (16.7%) | 10 (83.3%) |
Occupancy by Age of Householder in Lonepine
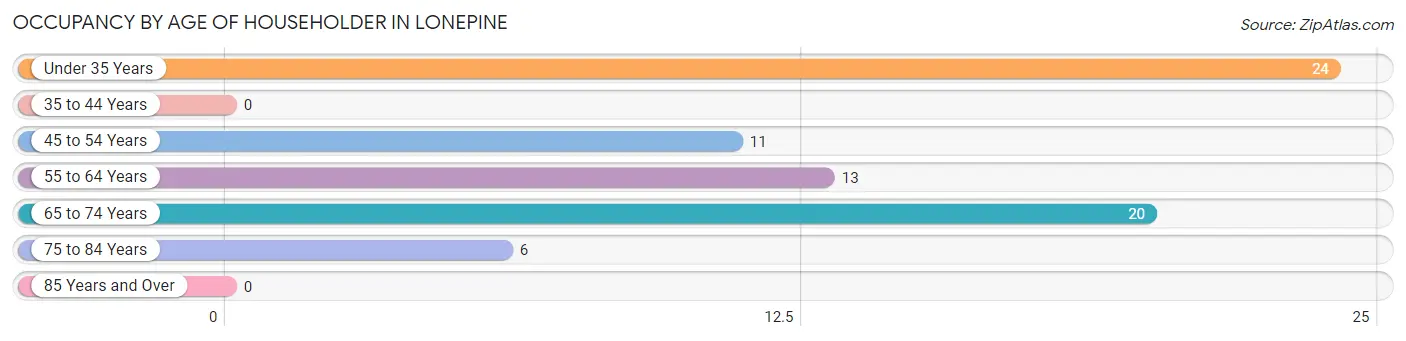
| Age Bracket | # Households | % Households |
| Under 35 Years | 24 | 32.4% |
| 35 to 44 Years | 0 | 0.0% |
| 45 to 54 Years | 11 | 14.9% |
| 55 to 64 Years | 13 | 17.6% |
| 65 to 74 Years | 20 | 27.0% |
| 75 to 84 Years | 6 | 8.1% |
| 85 Years and Over | 0 | 0.0% |
| Total | 74 | 100.0% |
Housing Finances in Lonepine
Median Income by Occupancy in Lonepine
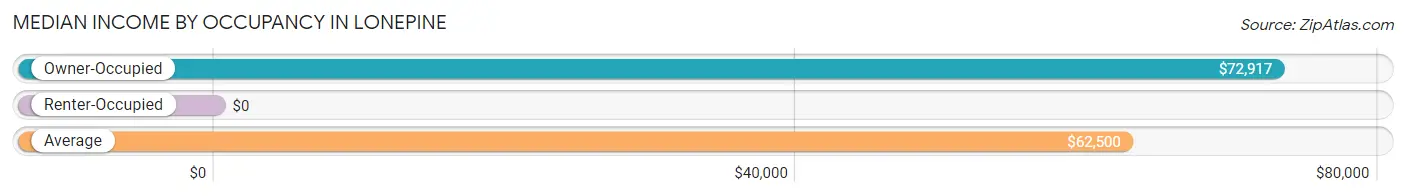
| Occupancy Type | # Households | Median Income |
| Owner-Occupied | 51 (68.9%) | $72,917 |
| Renter-Occupied | 23 (31.1%) | $0 |
| Average | 74 (100.0%) | $62,500 |
Occupancy by Householder Income Bracket in Lonepine
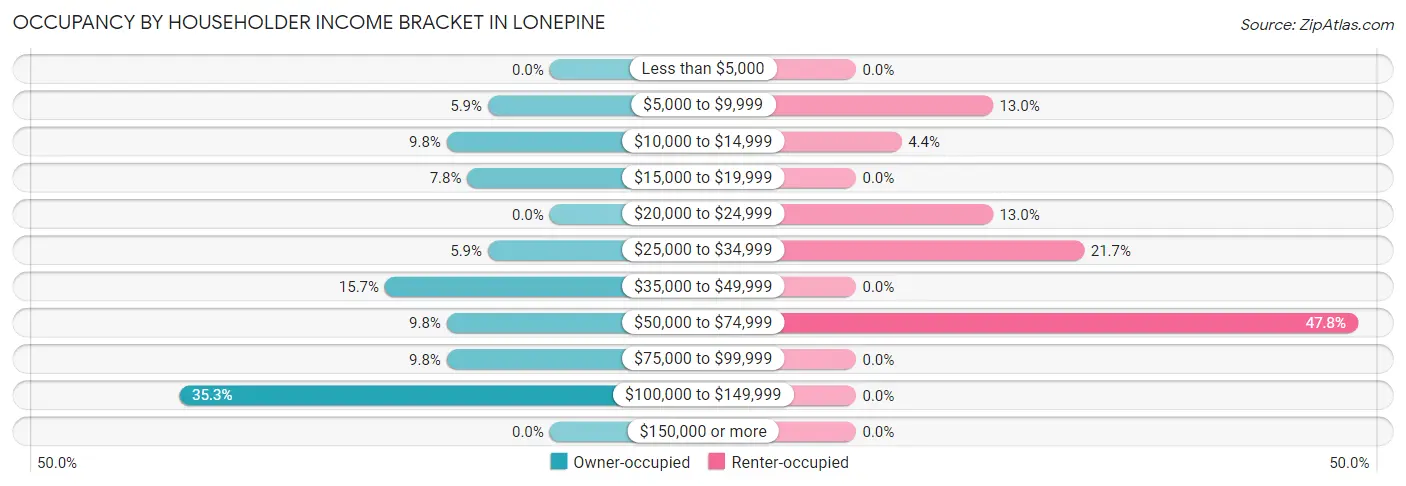
| Income Bracket | Owner-occupied | Renter-occupied |
| Less than $5,000 | 0 (0.0%) | 0 (0.0%) |
| $5,000 to $9,999 | 3 (5.9%) | 3 (13.0%) |
| $10,000 to $14,999 | 5 (9.8%) | 1 (4.3%) |
| $15,000 to $19,999 | 4 (7.8%) | 0 (0.0%) |
| $20,000 to $24,999 | 0 (0.0%) | 3 (13.0%) |
| $25,000 to $34,999 | 3 (5.9%) | 5 (21.7%) |
| $35,000 to $49,999 | 8 (15.7%) | 0 (0.0%) |
| $50,000 to $74,999 | 5 (9.8%) | 11 (47.8%) |
| $75,000 to $99,999 | 5 (9.8%) | 0 (0.0%) |
| $100,000 to $149,999 | 18 (35.3%) | 0 (0.0%) |
| $150,000 or more | 0 (0.0%) | 0 (0.0%) |
| Total | 51 (100.0%) | 23 (100.0%) |
Monthly Housing Cost Tiers in Lonepine
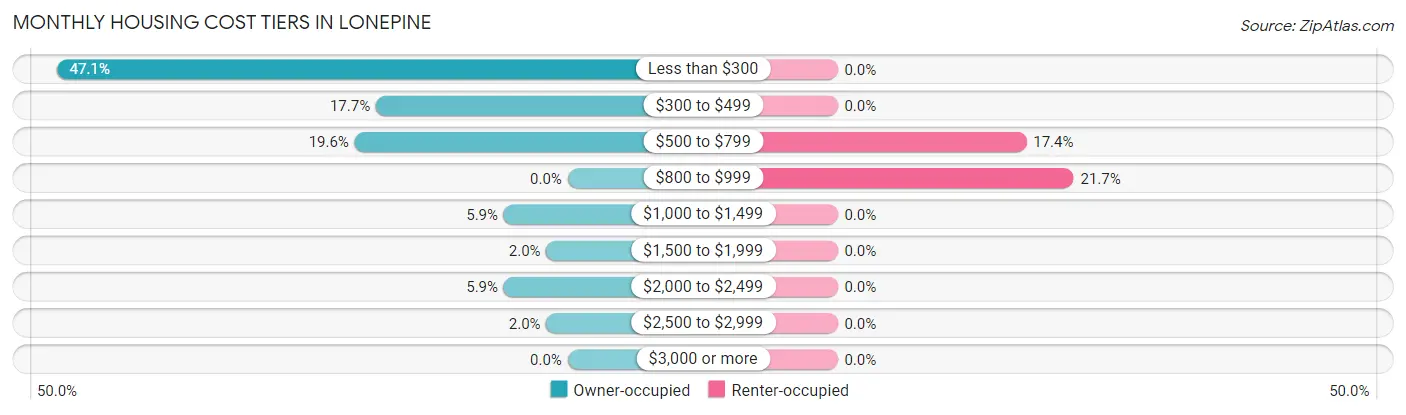
| Monthly Cost | Owner-occupied | Renter-occupied |
| Less than $300 | 24 (47.1%) | 0 (0.0%) |
| $300 to $499 | 9 (17.6%) | 0 (0.0%) |
| $500 to $799 | 10 (19.6%) | 4 (17.4%) |
| $800 to $999 | 0 (0.0%) | 5 (21.7%) |
| $1,000 to $1,499 | 3 (5.9%) | 0 (0.0%) |
| $1,500 to $1,999 | 1 (2.0%) | 0 (0.0%) |
| $2,000 to $2,499 | 3 (5.9%) | 0 (0.0%) |
| $2,500 to $2,999 | 1 (2.0%) | 0 (0.0%) |
| $3,000 or more | 0 (0.0%) | 0 (0.0%) |
| Total | 51 (100.0%) | 23 (100.0%) |
Physical Housing Characteristics in Lonepine
Housing Structures in Lonepine
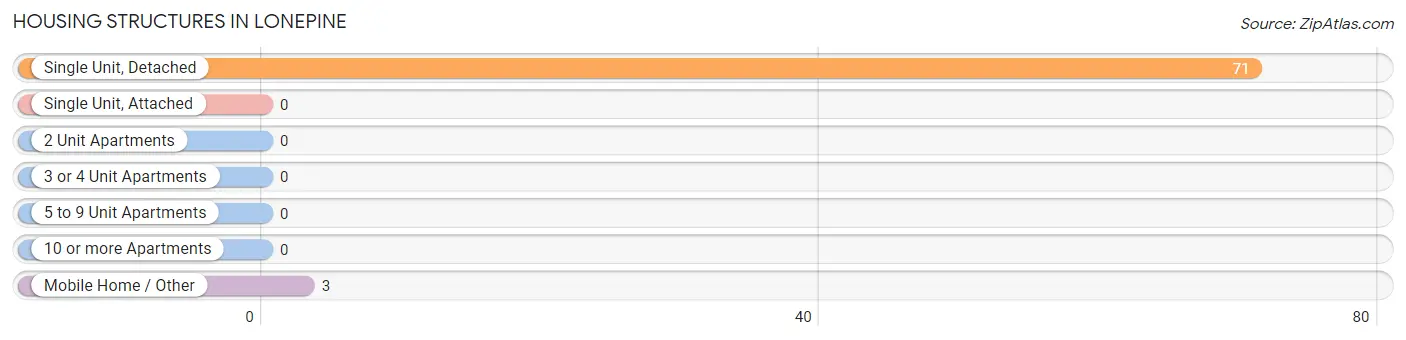
| Structure Type | # Housing Units | % Housing Units |
| Single Unit, Detached | 71 | 96.0% |
| Single Unit, Attached | 0 | 0.0% |
| 2 Unit Apartments | 0 | 0.0% |
| 3 or 4 Unit Apartments | 0 | 0.0% |
| 5 to 9 Unit Apartments | 0 | 0.0% |
| 10 or more Apartments | 0 | 0.0% |
| Mobile Home / Other | 3 | 4.1% |
| Total | 74 | 100.0% |
Housing Structures by Occupancy in Lonepine
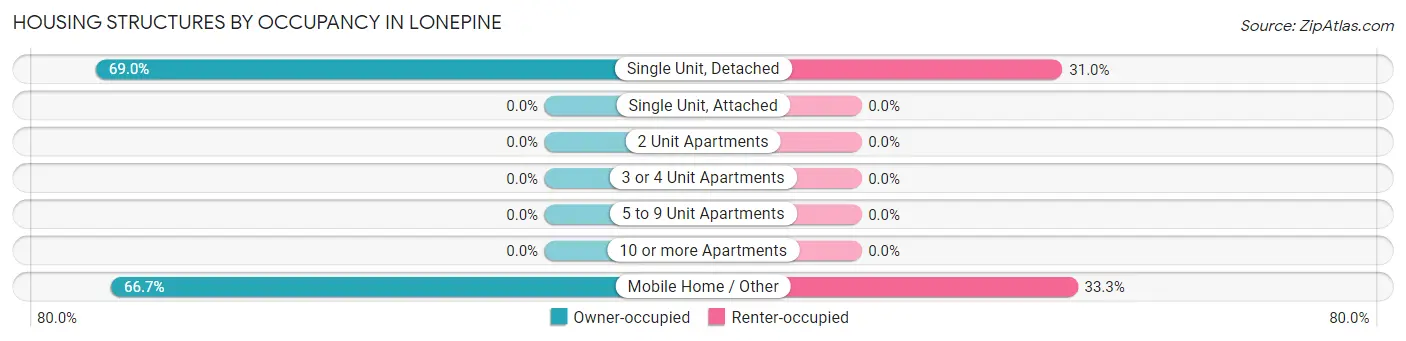
| Structure Type | Owner-occupied | Renter-occupied |
| Single Unit, Detached | 49 (69.0%) | 22 (31.0%) |
| Single Unit, Attached | 0 (0.0%) | 0 (0.0%) |
| 2 Unit Apartments | 0 (0.0%) | 0 (0.0%) |
| 3 or 4 Unit Apartments | 0 (0.0%) | 0 (0.0%) |
| 5 to 9 Unit Apartments | 0 (0.0%) | 0 (0.0%) |
| 10 or more Apartments | 0 (0.0%) | 0 (0.0%) |
| Mobile Home / Other | 2 (66.7%) | 1 (33.3%) |
| Total | 51 (68.9%) | 23 (31.1%) |
Housing Structures by Number of Rooms in Lonepine
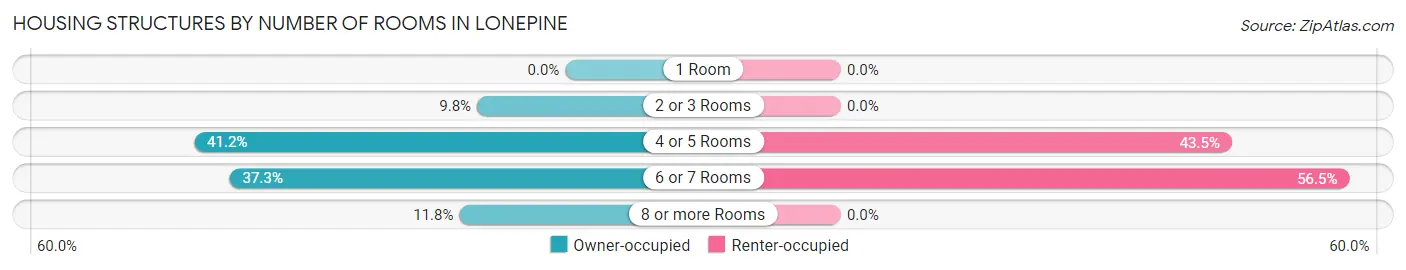
| Number of Rooms | Owner-occupied | Renter-occupied |
| 1 Room | 0 (0.0%) | 0 (0.0%) |
| 2 or 3 Rooms | 5 (9.8%) | 0 (0.0%) |
| 4 or 5 Rooms | 21 (41.2%) | 10 (43.5%) |
| 6 or 7 Rooms | 19 (37.2%) | 13 (56.5%) |
| 8 or more Rooms | 6 (11.8%) | 0 (0.0%) |
| Total | 51 (100.0%) | 23 (100.0%) |
Housing Structure by Heating Type in Lonepine
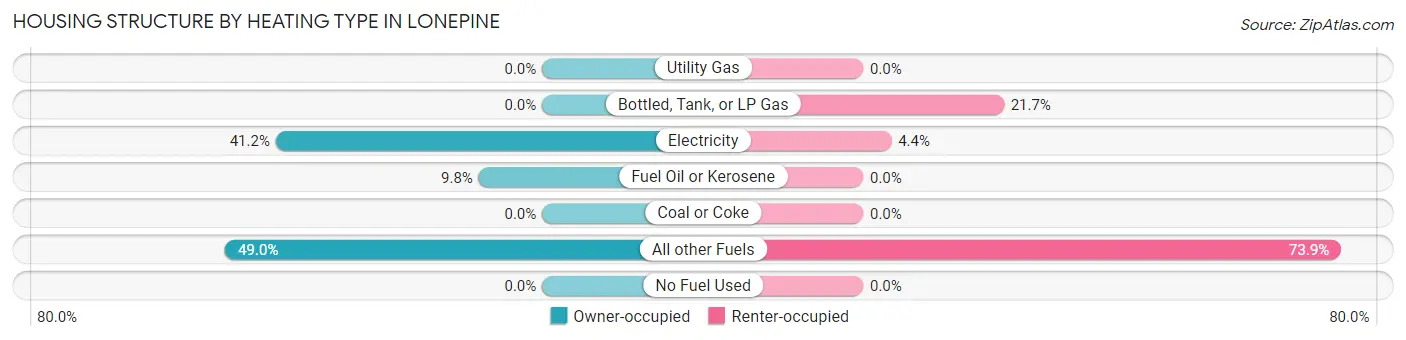
| Heating Type | Owner-occupied | Renter-occupied |
| Utility Gas | 0 (0.0%) | 0 (0.0%) |
| Bottled, Tank, or LP Gas | 0 (0.0%) | 5 (21.7%) |
| Electricity | 21 (41.2%) | 1 (4.3%) |
| Fuel Oil or Kerosene | 5 (9.8%) | 0 (0.0%) |
| Coal or Coke | 0 (0.0%) | 0 (0.0%) |
| All other Fuels | 25 (49.0%) | 17 (73.9%) |
| No Fuel Used | 0 (0.0%) | 0 (0.0%) |
| Total | 51 (100.0%) | 23 (100.0%) |
Household Vehicle Usage in Lonepine
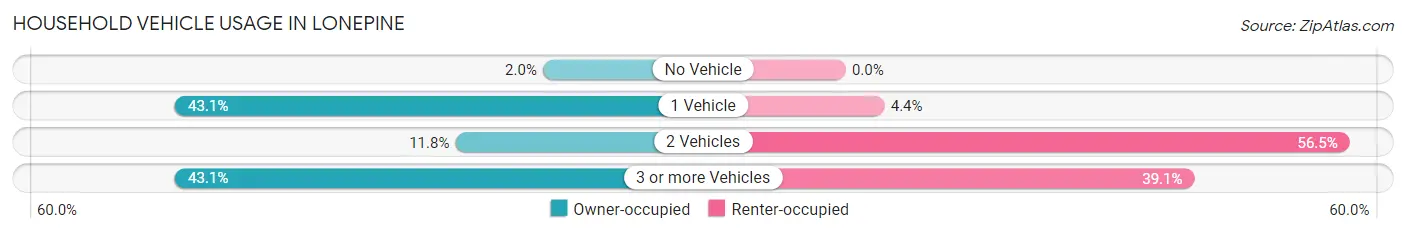
| Vehicles per Household | Owner-occupied | Renter-occupied |
| No Vehicle | 1 (2.0%) | 0 (0.0%) |
| 1 Vehicle | 22 (43.1%) | 1 (4.3%) |
| 2 Vehicles | 6 (11.8%) | 13 (56.5%) |
| 3 or more Vehicles | 22 (43.1%) | 9 (39.1%) |
| Total | 51 (100.0%) | 23 (100.0%) |
Real Estate & Mortgages in Lonepine
Real Estate and Mortgage Overview in Lonepine
| Characteristic | Without Mortgage | With Mortgage |
| Housing Units | 44 | 7 |
| Median Property Value | $150,000 | $375,000 |
| Median Household Income | - | - |
| Monthly Housing Costs | $293 | $0 |
| Real Estate Taxes | $1,150 | $0 |
Property Value by Mortgage Status in Lonepine
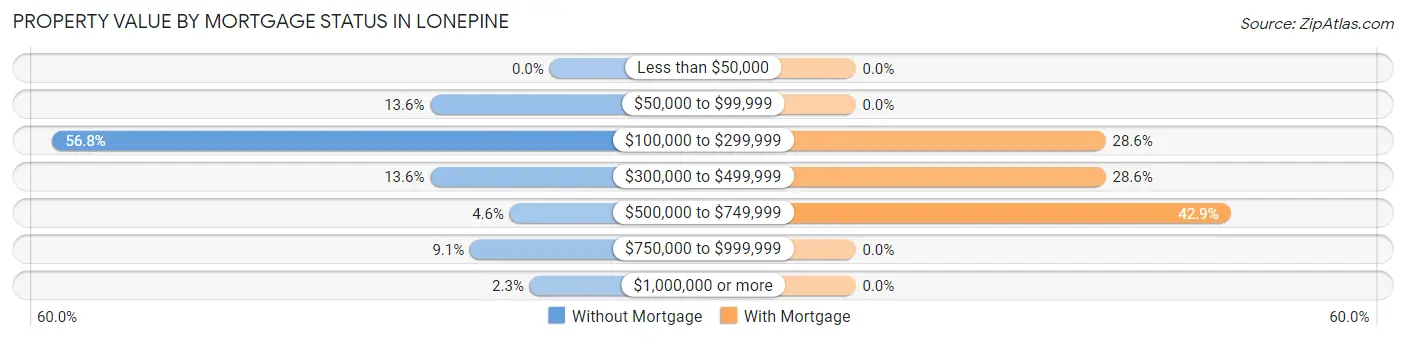
| Property Value | Without Mortgage | With Mortgage |
| Less than $50,000 | 0 (0.0%) | 0 (0.0%) |
| $50,000 to $99,999 | 6 (13.6%) | 0 (0.0%) |
| $100,000 to $299,999 | 25 (56.8%) | 2 (28.6%) |
| $300,000 to $499,999 | 6 (13.6%) | 2 (28.6%) |
| $500,000 to $749,999 | 2 (4.5%) | 3 (42.9%) |
| $750,000 to $999,999 | 4 (9.1%) | 0 (0.0%) |
| $1,000,000 or more | 1 (2.3%) | 0 (0.0%) |
| Total | 44 (100.0%) | 7 (100.0%) |
Household Income by Mortgage Status in Lonepine
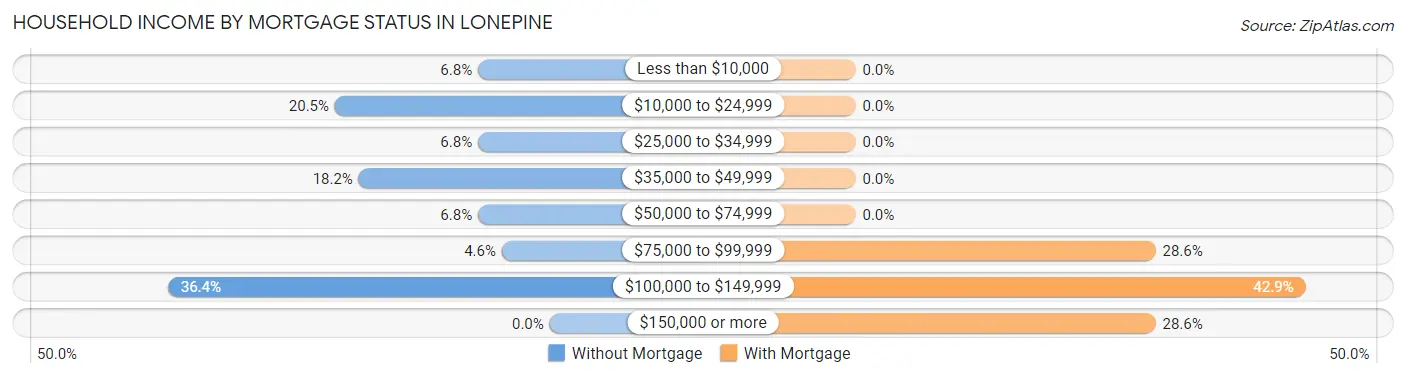
| Household Income | Without Mortgage | With Mortgage |
| Less than $10,000 | 3 (6.8%) | 0 (0.0%) |
| $10,000 to $24,999 | 9 (20.4%) | 0 (0.0%) |
| $25,000 to $34,999 | 3 (6.8%) | 0 (0.0%) |
| $35,000 to $49,999 | 8 (18.2%) | 0 (0.0%) |
| $50,000 to $74,999 | 3 (6.8%) | 0 (0.0%) |
| $75,000 to $99,999 | 2 (4.5%) | 2 (28.6%) |
| $100,000 to $149,999 | 16 (36.4%) | 3 (42.9%) |
| $150,000 or more | 0 (0.0%) | 2 (28.6%) |
| Total | 44 (100.0%) | 7 (100.0%) |
Property Value to Household Income Ratio in Lonepine
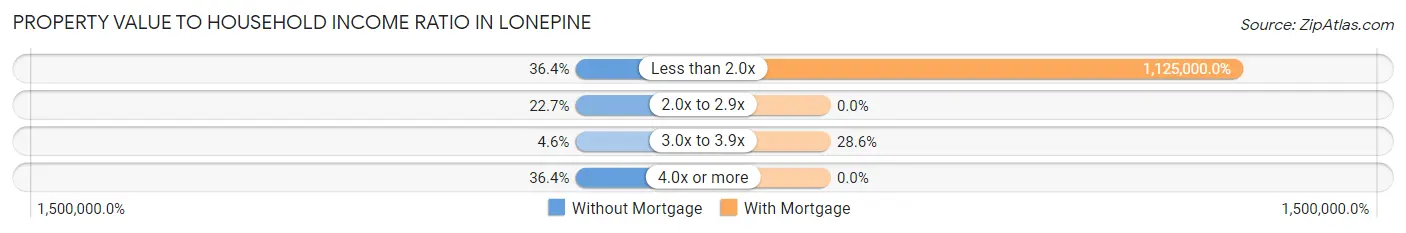
| Value-to-Income Ratio | Without Mortgage | With Mortgage |
| Less than 2.0x | 16 (36.4%) | 78,750 (1,125,000.0%) |
| 2.0x to 2.9x | 10 (22.7%) | 0 (0.0%) |
| 3.0x to 3.9x | 2 (4.5%) | 2 (28.6%) |
| 4.0x or more | 16 (36.4%) | 0 (0.0%) |
| Total | 44 (100.0%) | 7 (100.0%) |
Real Estate Taxes by Mortgage Status in Lonepine
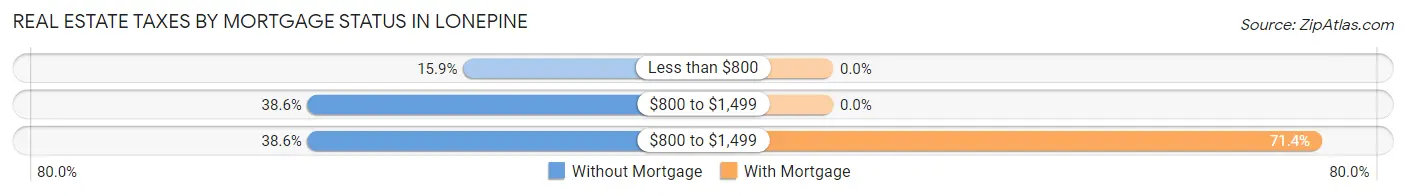
| Property Taxes | Without Mortgage | With Mortgage |
| Less than $800 | 7 (15.9%) | 0 (0.0%) |
| $800 to $1,499 | 17 (38.6%) | 0 (0.0%) |
| $800 to $1,499 | 17 (38.6%) | 5 (71.4%) |
| Total | 44 (100.0%) | 7 (100.0%) |
Health & Disability in Lonepine
Health Insurance Coverage by Age in Lonepine
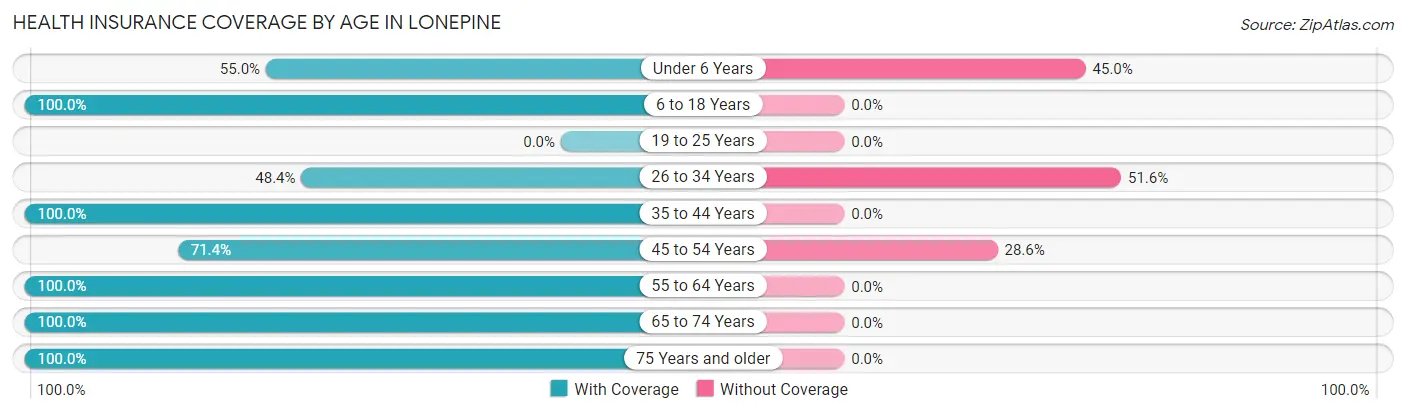
| Age Bracket | With Coverage | Without Coverage |
| Under 6 Years | 11 (55.0%) | 9 (45.0%) |
| 6 to 18 Years | 6 (100.0%) | 0 (0.0%) |
| 19 to 25 Years | 0 (0.0%) | 0 (0.0%) |
| 26 to 34 Years | 15 (48.4%) | 16 (51.6%) |
| 35 to 44 Years | 5 (100.0%) | 0 (0.0%) |
| 45 to 54 Years | 10 (71.4%) | 4 (28.6%) |
| 55 to 64 Years | 25 (100.0%) | 0 (0.0%) |
| 65 to 74 Years | 33 (100.0%) | 0 (0.0%) |
| 75 Years and older | 11 (100.0%) | 0 (0.0%) |
| Total | 116 (80.0%) | 29 (20.0%) |
Health Insurance Coverage by Citizenship Status in Lonepine
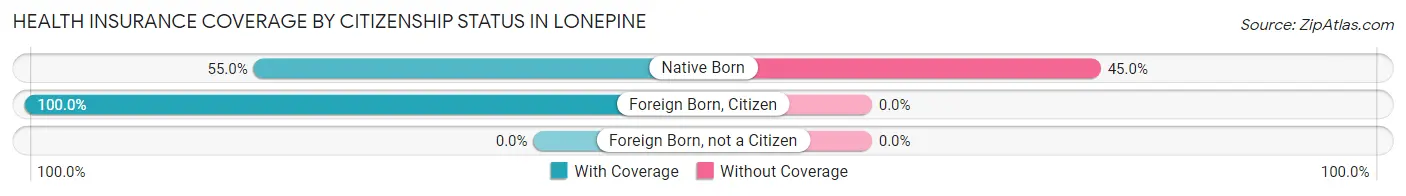
| Citizenship Status | With Coverage | Without Coverage |
| Native Born | 11 (55.0%) | 9 (45.0%) |
| Foreign Born, Citizen | 6 (100.0%) | 0 (0.0%) |
| Foreign Born, not a Citizen | 0 (0.0%) | 0 (0.0%) |
Health Insurance Coverage by Household Income in Lonepine
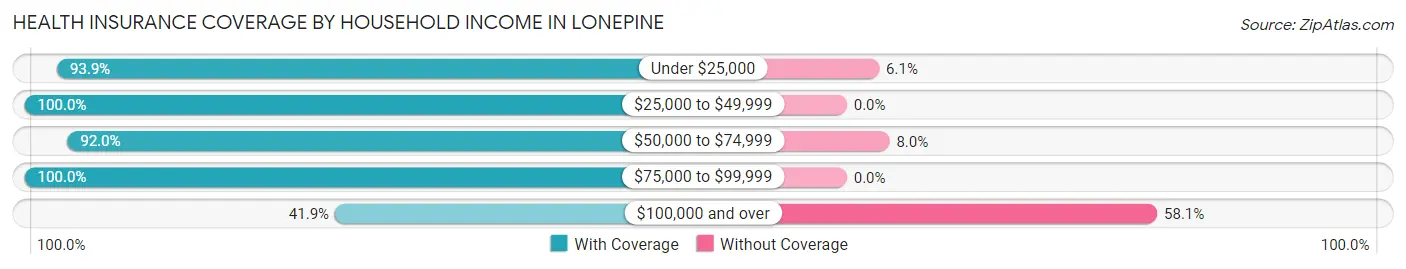
| Household Income | With Coverage | Without Coverage |
| Under $25,000 | 31 (93.9%) | 2 (6.1%) |
| $25,000 to $49,999 | 33 (100.0%) | 0 (0.0%) |
| $50,000 to $74,999 | 23 (92.0%) | 2 (8.0%) |
| $75,000 to $99,999 | 11 (100.0%) | 0 (0.0%) |
| $100,000 and over | 18 (41.9%) | 25 (58.1%) |
Public vs Private Health Insurance Coverage by Age in Lonepine
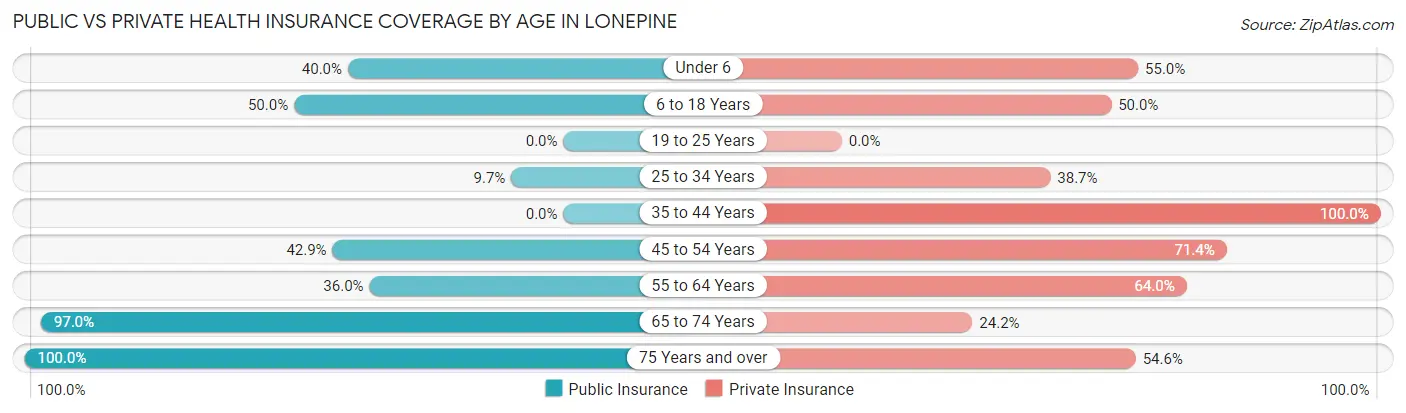
| Age Bracket | Public Insurance | Private Insurance |
| Under 6 | 8 (40.0%) | 11 (55.0%) |
| 6 to 18 Years | 3 (50.0%) | 3 (50.0%) |
| 19 to 25 Years | 0 (0.0%) | 0 (0.0%) |
| 25 to 34 Years | 3 (9.7%) | 12 (38.7%) |
| 35 to 44 Years | 0 (0.0%) | 5 (100.0%) |
| 45 to 54 Years | 6 (42.9%) | 10 (71.4%) |
| 55 to 64 Years | 9 (36.0%) | 16 (64.0%) |
| 65 to 74 Years | 32 (97.0%) | 8 (24.2%) |
| 75 Years and over | 11 (100.0%) | 6 (54.5%) |
| Total | 72 (49.7%) | 71 (49.0%) |
Disability Status by Sex by Age in Lonepine
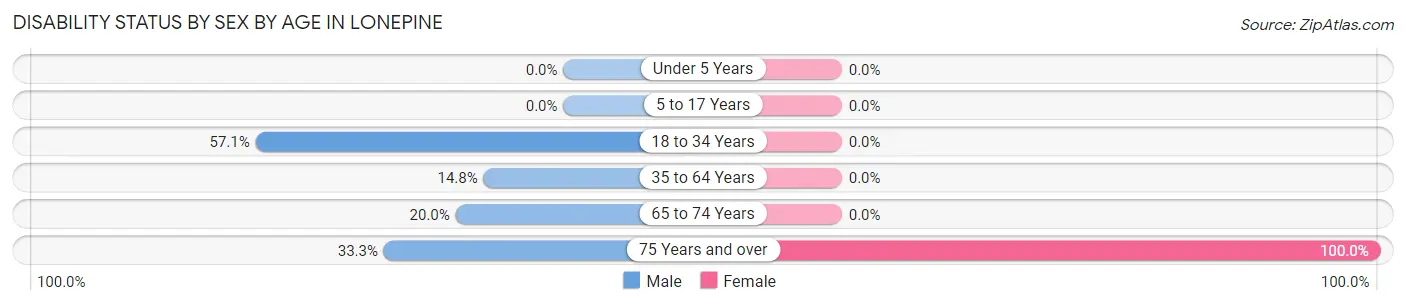
| Age Bracket | Male | Female |
| Under 5 Years | 0 (0.0%) | 0 (0.0%) |
| 5 to 17 Years | 0 (0.0%) | 0 (0.0%) |
| 18 to 34 Years | 12 (57.1%) | 0 (0.0%) |
| 35 to 64 Years | 4 (14.8%) | 0 (0.0%) |
| 65 to 74 Years | 3 (20.0%) | 0 (0.0%) |
| 75 Years and over | 3 (33.3%) | 2 (100.0%) |
Disability Class by Sex by Age in Lonepine
Disability Class: Hearing Difficulty
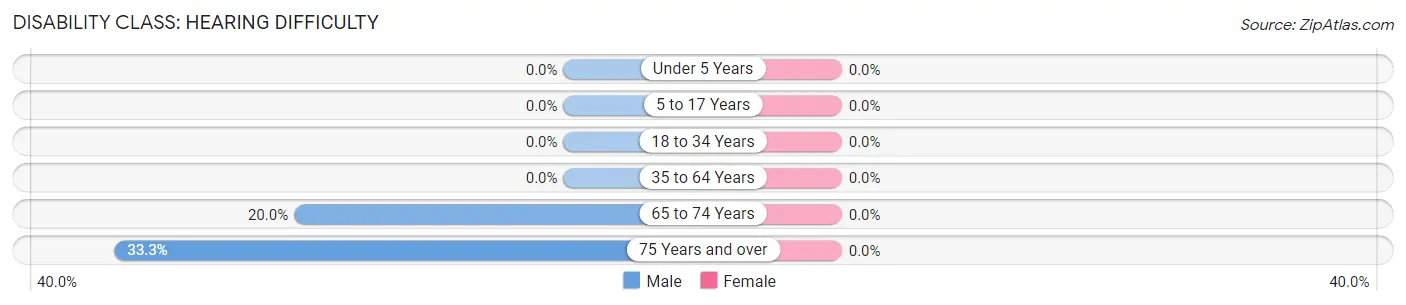
| Age Bracket | Male | Female |
| Under 5 Years | 0 (0.0%) | 0 (0.0%) |
| 5 to 17 Years | 0 (0.0%) | 0 (0.0%) |
| 18 to 34 Years | 0 (0.0%) | 0 (0.0%) |
| 35 to 64 Years | 0 (0.0%) | 0 (0.0%) |
| 65 to 74 Years | 3 (20.0%) | 0 (0.0%) |
| 75 Years and over | 3 (33.3%) | 0 (0.0%) |
Disability Class: Vision Difficulty
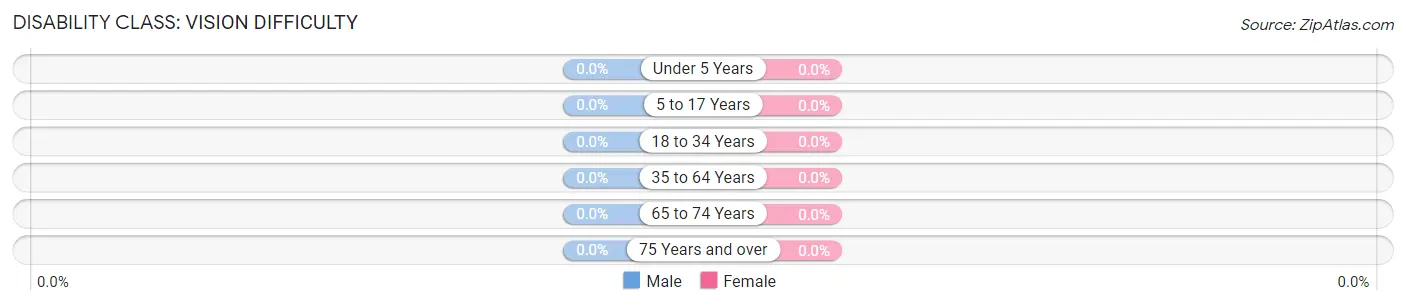
| Age Bracket | Male | Female |
| Under 5 Years | 0 (0.0%) | 0 (0.0%) |
| 5 to 17 Years | 0 (0.0%) | 0 (0.0%) |
| 18 to 34 Years | 0 (0.0%) | 0 (0.0%) |
| 35 to 64 Years | 0 (0.0%) | 0 (0.0%) |
| 65 to 74 Years | 0 (0.0%) | 0 (0.0%) |
| 75 Years and over | 0 (0.0%) | 0 (0.0%) |
Disability Class: Cognitive Difficulty
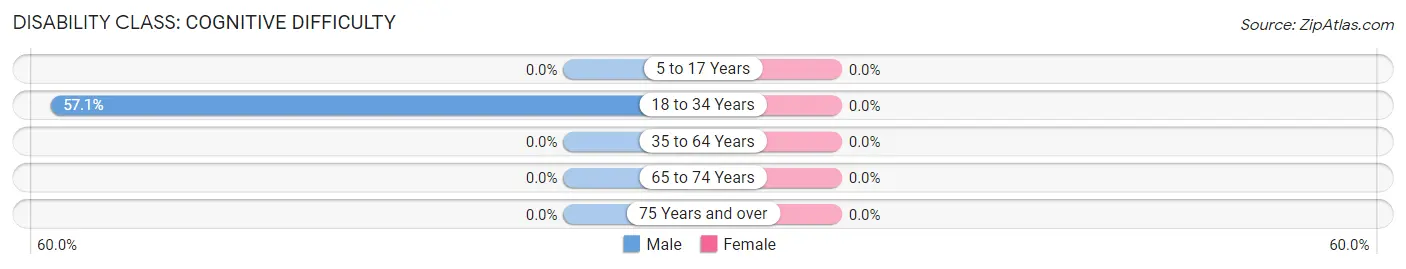
| Age Bracket | Male | Female |
| 5 to 17 Years | 0 (0.0%) | 0 (0.0%) |
| 18 to 34 Years | 12 (57.1%) | 0 (0.0%) |
| 35 to 64 Years | 0 (0.0%) | 0 (0.0%) |
| 65 to 74 Years | 0 (0.0%) | 0 (0.0%) |
| 75 Years and over | 0 (0.0%) | 0 (0.0%) |
Disability Class: Ambulatory Difficulty
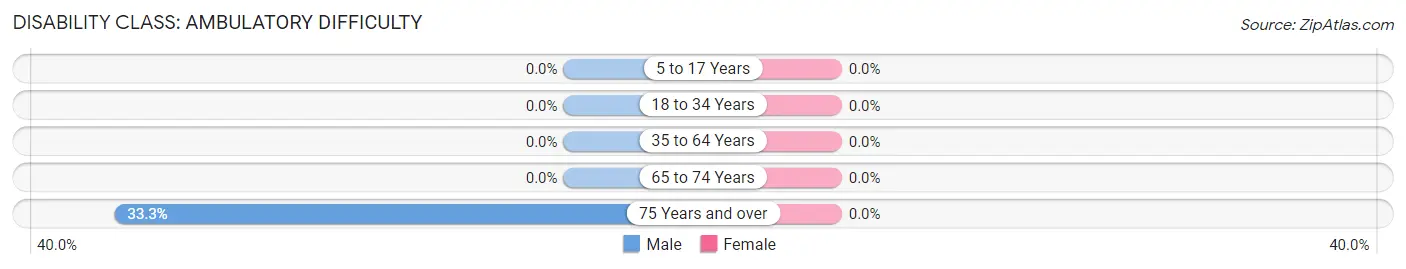
| Age Bracket | Male | Female |
| 5 to 17 Years | 0 (0.0%) | 0 (0.0%) |
| 18 to 34 Years | 0 (0.0%) | 0 (0.0%) |
| 35 to 64 Years | 0 (0.0%) | 0 (0.0%) |
| 65 to 74 Years | 0 (0.0%) | 0 (0.0%) |
| 75 Years and over | 3 (33.3%) | 0 (0.0%) |
Disability Class: Self-Care Difficulty
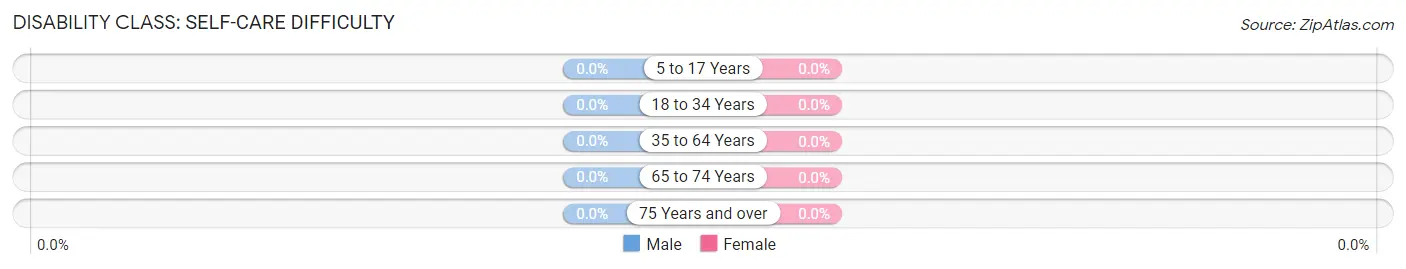
| Age Bracket | Male | Female |
| 5 to 17 Years | 0 (0.0%) | 0 (0.0%) |
| 18 to 34 Years | 0 (0.0%) | 0 (0.0%) |
| 35 to 64 Years | 0 (0.0%) | 0 (0.0%) |
| 65 to 74 Years | 0 (0.0%) | 0 (0.0%) |
| 75 Years and over | 0 (0.0%) | 0 (0.0%) |
Technology Access in Lonepine
Computing Device Access in Lonepine
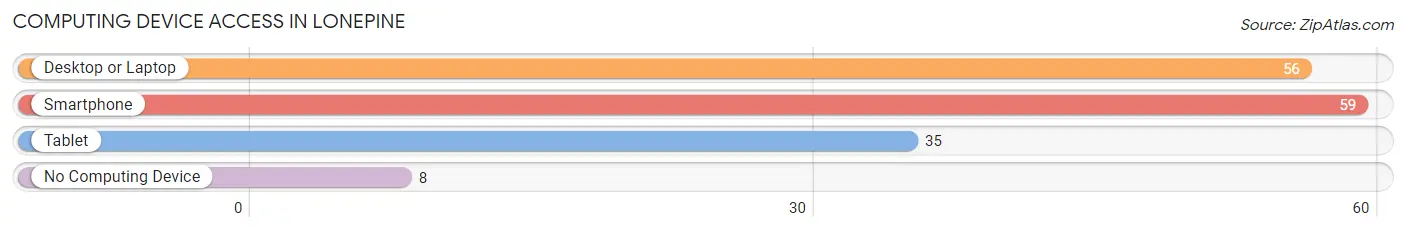
| Device Type | # Households | % Households |
| Desktop or Laptop | 56 | 75.7% |
| Smartphone | 59 | 79.7% |
| Tablet | 35 | 47.3% |
| No Computing Device | 8 | 10.8% |
| Total | 74 | 100.0% |
Internet Access in Lonepine
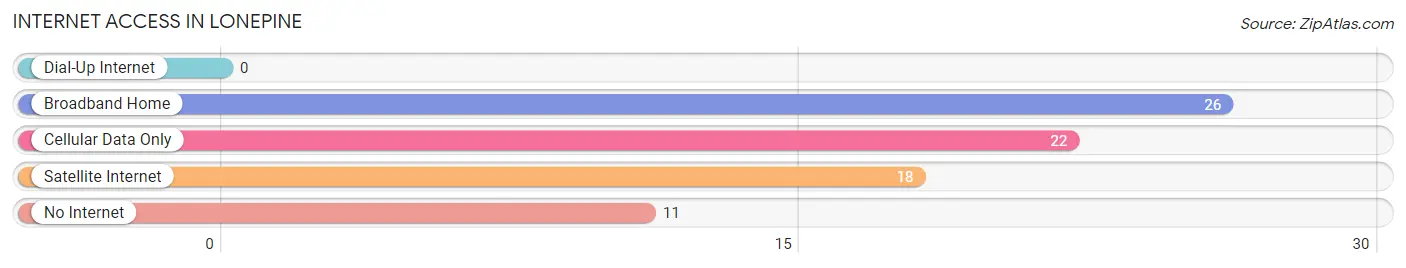
| Internet Type | # Households | % Households |
| Dial-Up Internet | 0 | 0.0% |
| Broadband Home | 26 | 35.1% |
| Cellular Data Only | 22 | 29.7% |
| Satellite Internet | 18 | 24.3% |
| No Internet | 11 | 14.9% |
| Total | 74 | 100.0% |
Lonepine Summary
Lonepine, Montana is a small town located in the southwestern corner of the state, near the Idaho border. It is situated in the foothills of the Rocky Mountains, and is surrounded by the Flathead National Forest. The town has a population of just over 1,000 people, and is the county seat of Lake County.
History
Lonepine was founded in 1883 by a group of homesteaders who were drawn to the area by the abundance of natural resources. The town was originally called “Lone Pine” after the single pine tree that stood in the center of town. The name was later changed to Lonepine to avoid confusion with other towns in the area.
The town quickly grew and prospered, becoming a hub for the timber and mining industries. In the early 1900s, the town was home to several sawmills, a flour mill, and a brickyard. The town also had a thriving agricultural industry, with many farmers growing wheat, oats, and barley.
In the 1920s, the town began to decline as the timber and mining industries moved away. The Great Depression further weakened the town’s economy, and many of the businesses closed. In the 1940s, the town was revitalized by the construction of a new highway, which brought new visitors and businesses to the area.
Geography
Lonepine is located in the Flathead Valley, which is surrounded by the Rocky Mountains. The town is situated at an elevation of 4,000 feet, and is located near the Flathead River. The town is also close to several lakes, including Flathead Lake, Swan Lake, and Whitefish Lake.
The climate in Lonepine is semi-arid, with hot summers and cold winters. The average annual temperature is around 45 degrees Fahrenheit, and the average annual precipitation is around 15 inches.
Economy
The economy of Lonepine is largely based on tourism. The town is a popular destination for outdoor enthusiasts, and is home to several ski resorts, hiking trails, and fishing spots. The town also has several restaurants, bars, and shops.
The town is also home to several manufacturing companies, including a furniture factory and a woodworking shop. The town also has a small airport, which serves as a hub for private and commercial flights.
Demographics
As of the 2010 census, the population of Lonepine was 1,037. The racial makeup of the town was 95.3% White, 0.7% Native American, 0.3% Asian, 0.2% African American, and 3.5% from other races. The median household income was $37,917, and the median age was 44.
Conclusion
Lonepine, Montana is a small town located in the southwestern corner of the state, near the Idaho border. It is situated in the foothills of the Rocky Mountains, and is surrounded by the Flathead National Forest. The town has a population of just over 1,000 people, and is the county seat of Lake County. The economy of Lonepine is largely based on tourism, and the town is a popular destination for outdoor enthusiasts. The town also has several manufacturing companies, and a small airport. The racial makeup of the town is mostly White, with a small percentage of Native American, Asian, and African American residents.
Common Questions
What is Per Capita Income in Lonepine?
Per Capita income in Lonepine is $30,512.
What is the Median Family Income in Lonepine?
Median Family Income in Lonepine is $73,438.
What is the Median Household income in Lonepine?
Median Household Income in Lonepine is $62,500.
What is Inequality or Gini Index in Lonepine?
Inequality or Gini Index in Lonepine is 0.37.
What is the Total Population of Lonepine?
Total Population of Lonepine is 145.
What is the Total Male Population of Lonepine?
Total Male Population of Lonepine is 98.
What is the Total Female Population of Lonepine?
Total Female Population of Lonepine is 47.
What is the Ratio of Males per 100 Females in Lonepine?
There are 208.51 Males per 100 Females in Lonepine.
What is the Ratio of Females per 100 Males in Lonepine?
There are 47.96 Females per 100 Males in Lonepine.
What is the Median Population Age in Lonepine?
Median Population Age in Lonepine is 54.1 Years.
What is the Average Family Size in Lonepine
Average Family Size in Lonepine is 2.2 People.
What is the Average Household Size in Lonepine
Average Household Size in Lonepine is 2.0 People.
How Large is the Labor Force in Lonepine?
There are 67 People in the Labor Forcein in Lonepine.
What is the Percentage of People in the Labor Force in Lonepine?
56.3% of People are in the Labor Force in Lonepine.
What is the Unemployment Rate in Lonepine?
Unemployment Rate in Lonepine is 6.0%.