Three Forks, MT Map & Demographics
Three Forks Map
Three Forks Overview
$33,976
PER CAPITA INCOME
$80,441
AVG FAMILY INCOME
$77,674
AVG HOUSEHOLD INCOME
62.8%
WAGE / INCOME GAP [ % ]
37.2¢/ $1
WAGE / INCOME GAP [ $ ]
0.35
INEQUALITY / GINI INDEX
1,895
TOTAL POPULATION
943
MALE POPULATION
952
FEMALE POPULATION
99.05
MALES / 100 FEMALES
100.95
FEMALES / 100 MALES
43.6
MEDIAN AGE
3.0
AVG FAMILY SIZE
2.4
AVG HOUSEHOLD SIZE
1,074
LABOR FORCE [ PEOPLE ]
69.0%
PERCENT IN LABOR FORCE
1.4%
UNEMPLOYMENT RATE
Three Forks Zip Codes
Three Forks Area Codes
Income in Three Forks
Income Overview in Three Forks
Per Capita Income in Three Forks is $33,976, while median incomes of families and households are $80,441 and $77,674 respectively.
| Characteristic | Number | Measure |
| Per Capita Income | 1,895 | $33,976 |
| Median Family Income | 448 | $80,441 |
| Mean Family Income | 448 | $90,829 |
| Median Household Income | 775 | $77,674 |
| Mean Household Income | 775 | $79,539 |
| Income Deficit | 448 | $0 |
| Wage / Income Gap (%) | 1,895 | 62.83% |
| Wage / Income Gap ($) | 1,895 | 37.17¢ per $1 |
| Gini / Inequality Index | 1,895 | 0.35 |
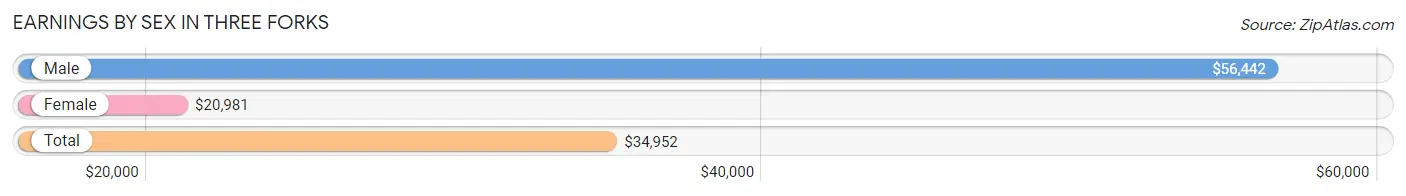
Earnings by Sex in Three Forks
Average Earnings in Three Forks are $34,952, $56,442 for men and $20,981 for women, a difference of 62.8%.
| Sex | Number | Average Earnings |
| Male | 544 (46.6%) | $56,442 |
| Female | 623 (53.4%) | $20,981 |
| Total | 1,167 (100.0%) | $34,952 |
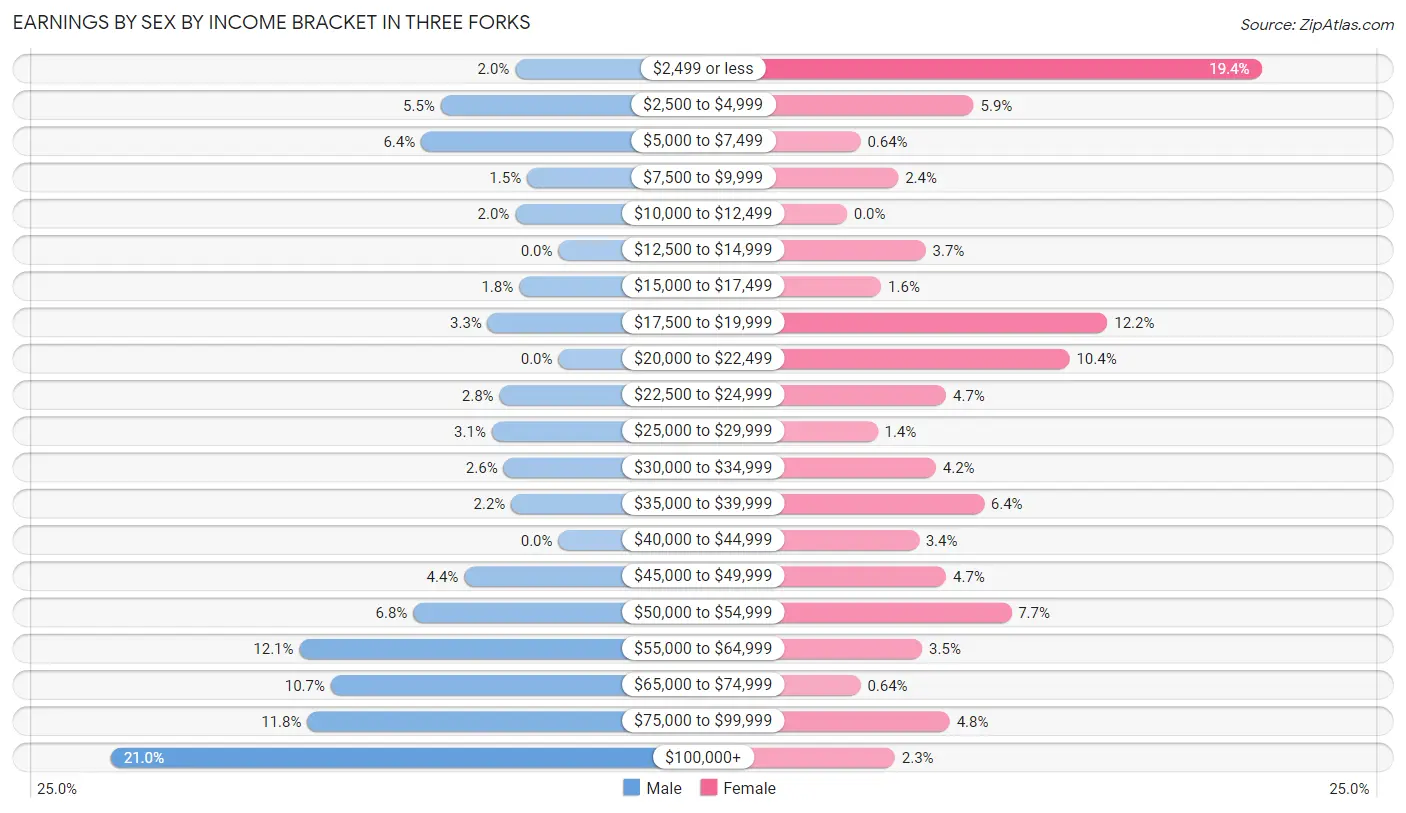
Earnings by Sex by Income Bracket in Three Forks
The most common earnings brackets in Three Forks are $100,000+ for men (114 | 21.0%) and $2,499 or less for women (121 | 19.4%).
| Income | Male | Female |
| $2,499 or less | 11 (2.0%) | 121 (19.4%) |
| $2,500 to $4,999 | 30 (5.5%) | 37 (5.9%) |
| $5,000 to $7,499 | 35 (6.4%) | 4 (0.6%) |
| $7,500 to $9,999 | 8 (1.5%) | 15 (2.4%) |
| $10,000 to $12,499 | 11 (2.0%) | 0 (0.0%) |
| $12,500 to $14,999 | 0 (0.0%) | 23 (3.7%) |
| $15,000 to $17,499 | 10 (1.8%) | 10 (1.6%) |
| $17,500 to $19,999 | 18 (3.3%) | 76 (12.2%) |
| $20,000 to $22,499 | 0 (0.0%) | 65 (10.4%) |
| $22,500 to $24,999 | 15 (2.8%) | 29 (4.6%) |
| $25,000 to $29,999 | 17 (3.1%) | 9 (1.4%) |
| $30,000 to $34,999 | 14 (2.6%) | 26 (4.2%) |
| $35,000 to $39,999 | 12 (2.2%) | 40 (6.4%) |
| $40,000 to $44,999 | 0 (0.0%) | 21 (3.4%) |
| $45,000 to $49,999 | 24 (4.4%) | 29 (4.6%) |
| $50,000 to $54,999 | 37 (6.8%) | 48 (7.7%) |
| $55,000 to $64,999 | 66 (12.1%) | 22 (3.5%) |
| $65,000 to $74,999 | 58 (10.7%) | 4 (0.6%) |
| $75,000 to $99,999 | 64 (11.8%) | 30 (4.8%) |
| $100,000+ | 114 (21.0%) | 14 (2.2%) |
| Total | 544 (100.0%) | 623 (100.0%) |
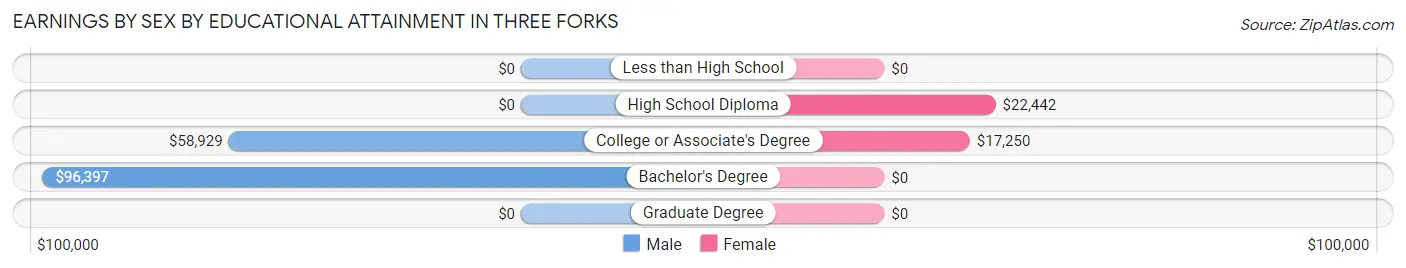
Earnings by Sex by Educational Attainment in Three Forks
Average earnings in Three Forks are $56,322 for men and $21,462 for women, a difference of 61.9%. Men with an educational attainment of bachelor's degree enjoy the highest average annual earnings of $96,397, while those with college or associate's degree education earn the least with $58,929. Women with an educational attainment of high school diploma earn the most with the average annual earnings of $22,442, while those with college or associate's degree education have the smallest earnings of $17,250.
| Educational Attainment | Male Income | Female Income |
| Less than High School | - | - |
| High School Diploma | - | - |
| College or Associate's Degree | $58,929 | $17,250 |
| Bachelor's Degree | $96,397 | $0 |
| Graduate Degree | - | - |
| Total | $56,322 | $21,462 |
Family Income in Three Forks
Family Income Brackets in Three Forks
According to the Three Forks family income data, there are 152 families falling into the $75,000 to $99,999 income range, which is the most common income bracket and makes up 33.9% of all families.
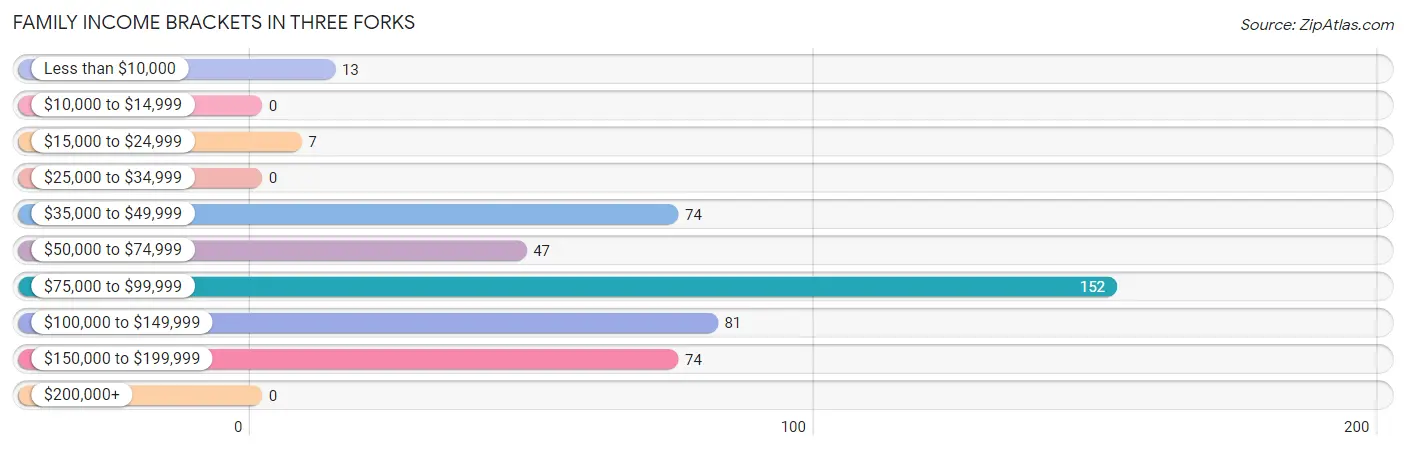
| Income Bracket | # Families | % Families |
| Less than $10,000 | 13 | 2.9% |
| $10,000 to $14,999 | 0 | 0.0% |
| $15,000 to $24,999 | 7 | 1.6% |
| $25,000 to $34,999 | 0 | 0.0% |
| $35,000 to $49,999 | 74 | 16.5% |
| $50,000 to $74,999 | 47 | 10.5% |
| $75,000 to $99,999 | 152 | 33.9% |
| $100,000 to $149,999 | 81 | 18.1% |
| $150,000 to $199,999 | 74 | 16.5% |
| $200,000+ | 0 | 0.0% |
Family Income by Famaliy Size in Three Forks
4-person families (92 | 20.5%) account for the highest median family income in Three Forks with $115,982 per family, while 2-person families (261 | 58.3%) have the highest median income of $39,784 per family member.
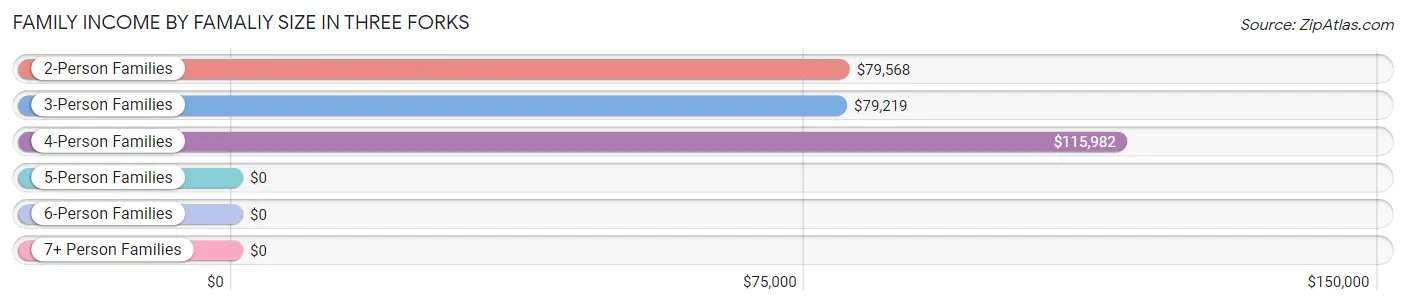
| Income Bracket | # Families | Median Income |
| 2-Person Families | 261 (58.3%) | $79,568 |
| 3-Person Families | 59 (13.2%) | $79,219 |
| 4-Person Families | 92 (20.5%) | $115,982 |
| 5-Person Families | 14 (3.1%) | $0 |
| 6-Person Families | 22 (4.9%) | $0 |
| 7+ Person Families | 0 (0.0%) | $0 |
| Total | 448 (100.0%) | $80,441 |
Family Income by Number of Earners in Three Forks
The median family income in Three Forks is $80,441, with families comprising 3+ earners (71) having the highest median family income of $130,694, while families with no earners (75) have the lowest median family income of $47,546, accounting for 15.9% and 16.7% of families, respectively.
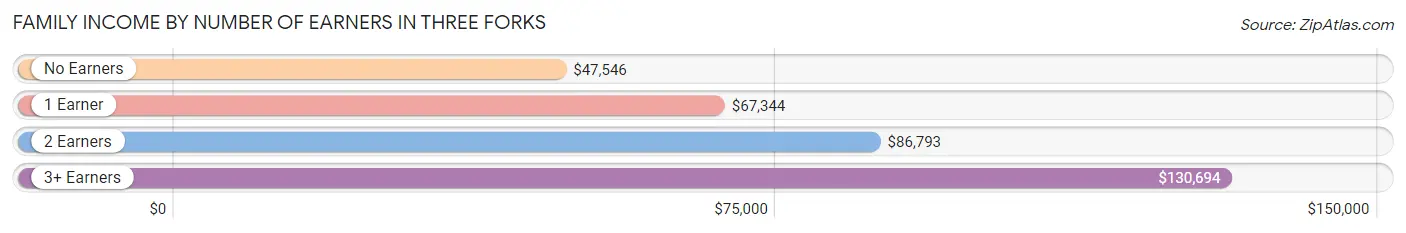
| Number of Earners | # Families | Median Income |
| No Earners | 75 (16.7%) | $47,546 |
| 1 Earner | 71 (15.9%) | $67,344 |
| 2 Earners | 231 (51.6%) | $86,793 |
| 3+ Earners | 71 (15.9%) | $130,694 |
| Total | 448 (100.0%) | $80,441 |
Household Income in Three Forks
Household Income Brackets in Three Forks
With 217 households falling in the category, the $75,000 to $99,999 income range is the most frequent in Three Forks, accounting for 28.0% of all households. In contrast, only 10 households (1.3%) fall into the $10,000 to $14,999 income bracket, making it the least populous group.
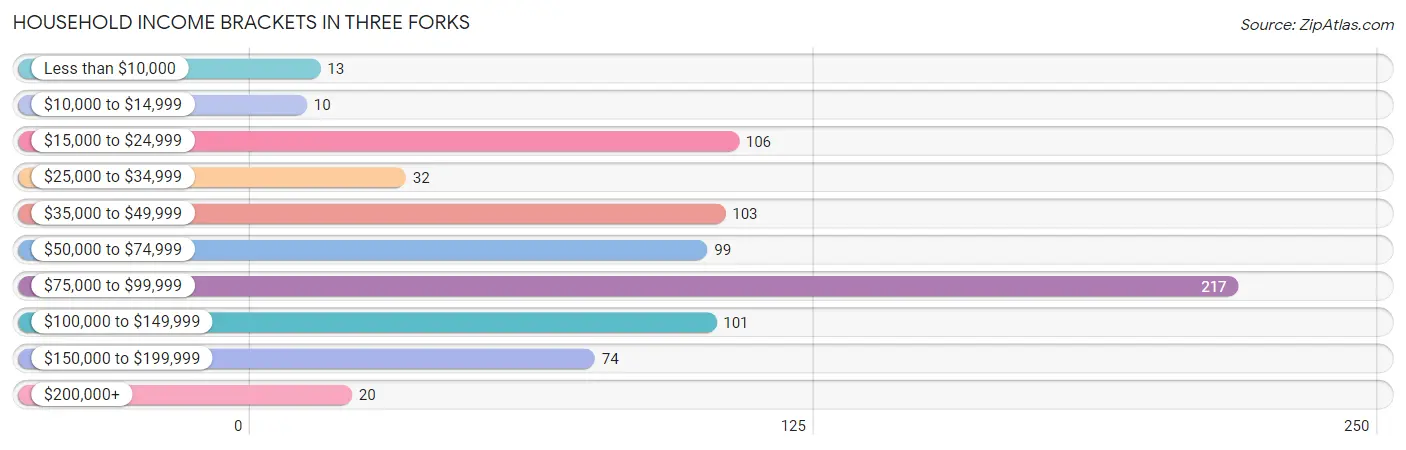
| Income Bracket | # Households | % Households |
| Less than $10,000 | 13 | 1.7% |
| $10,000 to $14,999 | 10 | 1.3% |
| $15,000 to $24,999 | 106 | 13.7% |
| $25,000 to $34,999 | 32 | 4.1% |
| $35,000 to $49,999 | 103 | 13.3% |
| $50,000 to $74,999 | 99 | 12.8% |
| $75,000 to $99,999 | 217 | 28.0% |
| $100,000 to $149,999 | 101 | 13.0% |
| $150,000 to $199,999 | 74 | 9.5% |
| $200,000+ | 20 | 2.6% |
Household Income by Householder Age in Three Forks
The median household income in Three Forks is $77,674, with the highest median household income of $109,563 found in the 25 to 44 years age bracket for the primary householder. A total of 197 households (25.4%) fall into this category. Meanwhile, the 15 to 24 years age bracket for the primary householder has the lowest median household income of $0, with 31 households (4.0%) in this group.
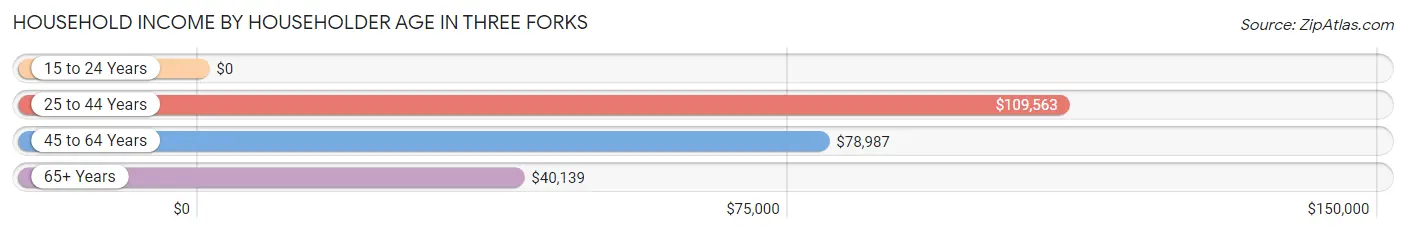
| Income Bracket | # Households | Median Income |
| 15 to 24 Years | 31 (4.0%) | $0 |
| 25 to 44 Years | 197 (25.4%) | $109,563 |
| 45 to 64 Years | 296 (38.2%) | $78,987 |
| 65+ Years | 251 (32.4%) | $40,139 |
| Total | 775 (100.0%) | $77,674 |
Poverty in Three Forks
Income Below Poverty by Sex and Age in Three Forks
With 9.5% poverty level for males and 5.8% for females among the residents of Three Forks, 15 year old males and 18 to 24 year old females are the most vulnerable to poverty, with 9 males (100.0%) and 17 females (17.9%) in their respective age groups living below the poverty level.
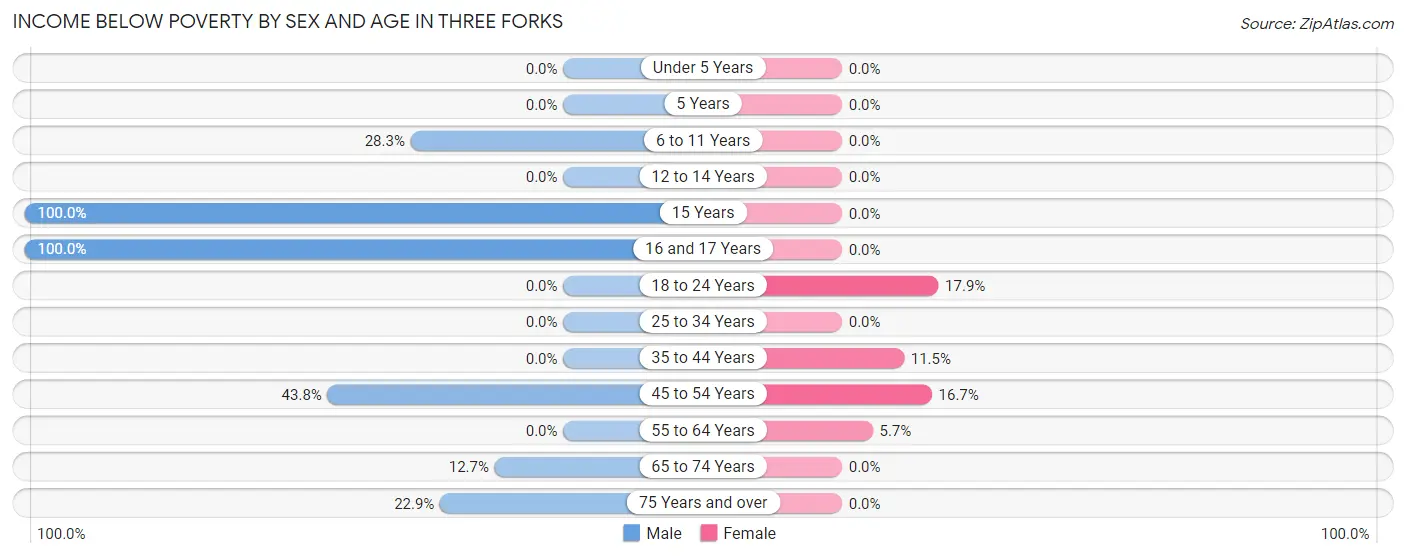
| Age Bracket | Male | Female |
| Under 5 Years | 0 (0.0%) | 0 (0.0%) |
| 5 Years | 0 (0.0%) | 0 (0.0%) |
| 6 to 11 Years | 17 (28.3%) | 0 (0.0%) |
| 12 to 14 Years | 0 (0.0%) | 0 (0.0%) |
| 15 Years | 9 (100.0%) | 0 (0.0%) |
| 16 and 17 Years | 9 (100.0%) | 0 (0.0%) |
| 18 to 24 Years | 0 (0.0%) | 17 (17.9%) |
| 25 to 34 Years | 0 (0.0%) | 0 (0.0%) |
| 35 to 44 Years | 0 (0.0%) | 13 (11.5%) |
| 45 to 54 Years | 21 (43.8%) | 11 (16.7%) |
| 55 to 64 Years | 0 (0.0%) | 13 (5.7%) |
| 65 to 74 Years | 14 (12.7%) | 0 (0.0%) |
| 75 Years and over | 16 (22.9%) | 0 (0.0%) |
| Total | 86 (9.5%) | 54 (5.8%) |
Income Above Poverty by Sex and Age in Three Forks
According to the poverty statistics in Three Forks, males aged under 5 years and females aged under 5 years are the age groups that are most secure financially, with 100.0% of males and 100.0% of females in these age groups living above the poverty line.
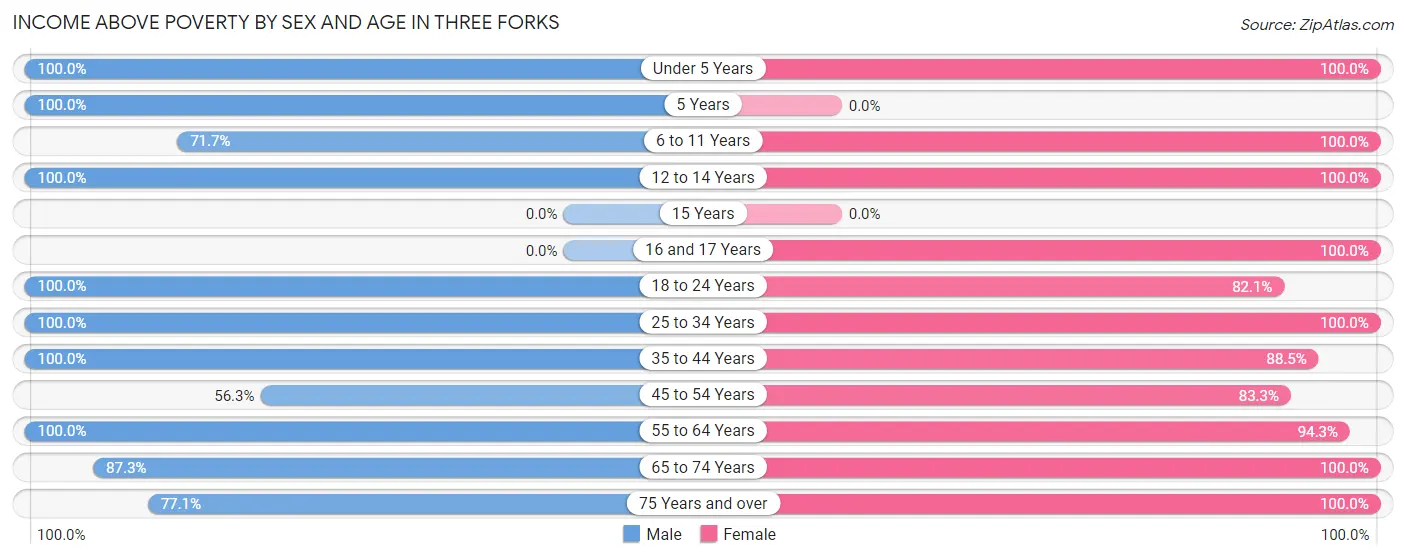
| Age Bracket | Male | Female |
| Under 5 Years | 21 (100.0%) | 38 (100.0%) |
| 5 Years | 4 (100.0%) | 0 (0.0%) |
| 6 to 11 Years | 43 (71.7%) | 35 (100.0%) |
| 12 to 14 Years | 85 (100.0%) | 41 (100.0%) |
| 15 Years | 0 (0.0%) | 0 (0.0%) |
| 16 and 17 Years | 0 (0.0%) | 59 (100.0%) |
| 18 to 24 Years | 24 (100.0%) | 78 (82.1%) |
| 25 to 34 Years | 151 (100.0%) | 79 (100.0%) |
| 35 to 44 Years | 106 (100.0%) | 100 (88.5%) |
| 45 to 54 Years | 27 (56.2%) | 55 (83.3%) |
| 55 to 64 Years | 213 (100.0%) | 215 (94.3%) |
| 65 to 74 Years | 96 (87.3%) | 150 (100.0%) |
| 75 Years and over | 54 (77.1%) | 20 (100.0%) |
| Total | 824 (90.5%) | 870 (94.2%) |
Income Below Poverty Among Married-Couple Families in Three Forks
The poverty statistics for married-couple families in Three Forks show that 4.8% or 20 of the total 413 families live below the poverty line. Families with 3 or 4 children have the highest poverty rate of 33.3%, comprising of 7 families. On the other hand, families with 1 or 2 children have the lowest poverty rate of 0.0%, which includes 0 families.
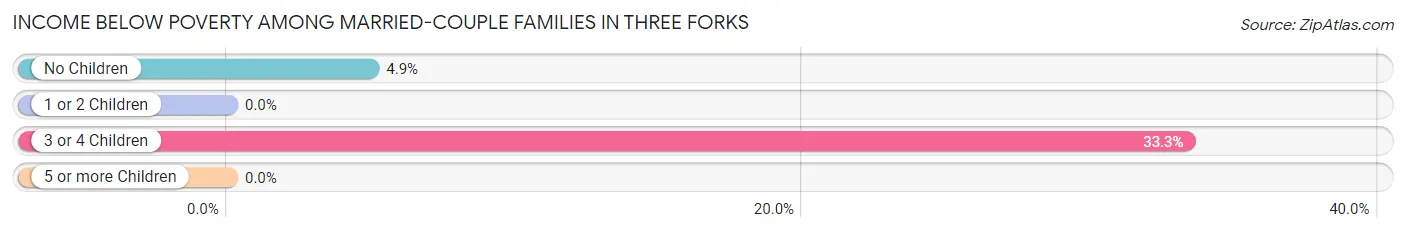
| Children | Above Poverty | Below Poverty |
| No Children | 251 (95.1%) | 13 (4.9%) |
| 1 or 2 Children | 128 (100.0%) | 0 (0.0%) |
| 3 or 4 Children | 14 (66.7%) | 7 (33.3%) |
| 5 or more Children | 0 (0.0%) | 0 (0.0%) |
| Total | 393 (95.2%) | 20 (4.8%) |
Income Below Poverty Among Single-Parent Households in Three Forks
| Children | Single Father | Single Mother |
| No Children | 0 (0.0%) | 0 (0.0%) |
| 1 or 2 Children | 0 (0.0%) | 0 (0.0%) |
| 3 or 4 Children | 0 (0.0%) | 0 (0.0%) |
| 5 or more Children | 0 (0.0%) | 0 (0.0%) |
| Total | 0 (0.0%) | 0 (0.0%) |
Income Below Poverty Among Married-Couple vs Single-Parent Households in Three Forks
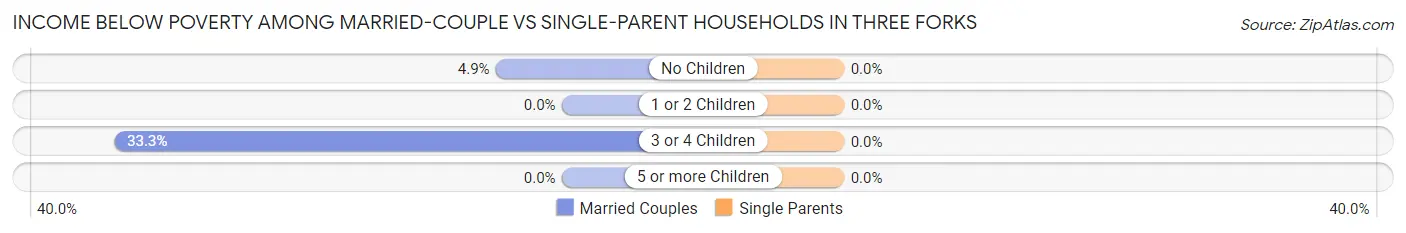
| Children | Married-Couple Families | Single-Parent Households |
| No Children | 13 (4.9%) | 0 (0.0%) |
| 1 or 2 Children | 0 (0.0%) | 0 (0.0%) |
| 3 or 4 Children | 7 (33.3%) | 0 (0.0%) |
| 5 or more Children | 0 (0.0%) | 0 (0.0%) |
| Total | 20 (4.8%) | 0 (0.0%) |
Race in Three Forks
The most populous races in Three Forks are White / Caucasian (1,763 | 93.0%), Hispanic or Latino (76 | 4.0%), and Asian (64 | 3.4%).
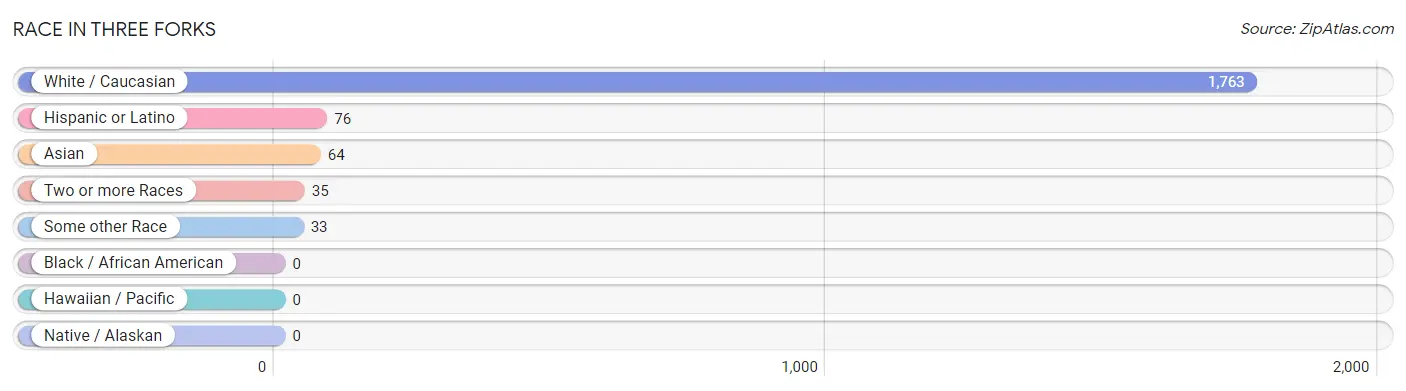
| Race | # Population | % Population |
| Asian | 64 | 3.4% |
| Black / African American | 0 | 0.0% |
| Hawaiian / Pacific | 0 | 0.0% |
| Hispanic or Latino | 76 | 4.0% |
| Native / Alaskan | 0 | 0.0% |
| White / Caucasian | 1,763 | 93.0% |
| Two or more Races | 35 | 1.8% |
| Some other Race | 33 | 1.7% |
| Total | 1,895 | 100.0% |
Ancestry in Three Forks
The most populous ancestries reported in Three Forks are German (660 | 34.8%), Irish (334 | 17.6%), English (161 | 8.5%), Swiss (91 | 4.8%), and Norwegian (87 | 4.6%), together accounting for 70.4% of all Three Forks residents.
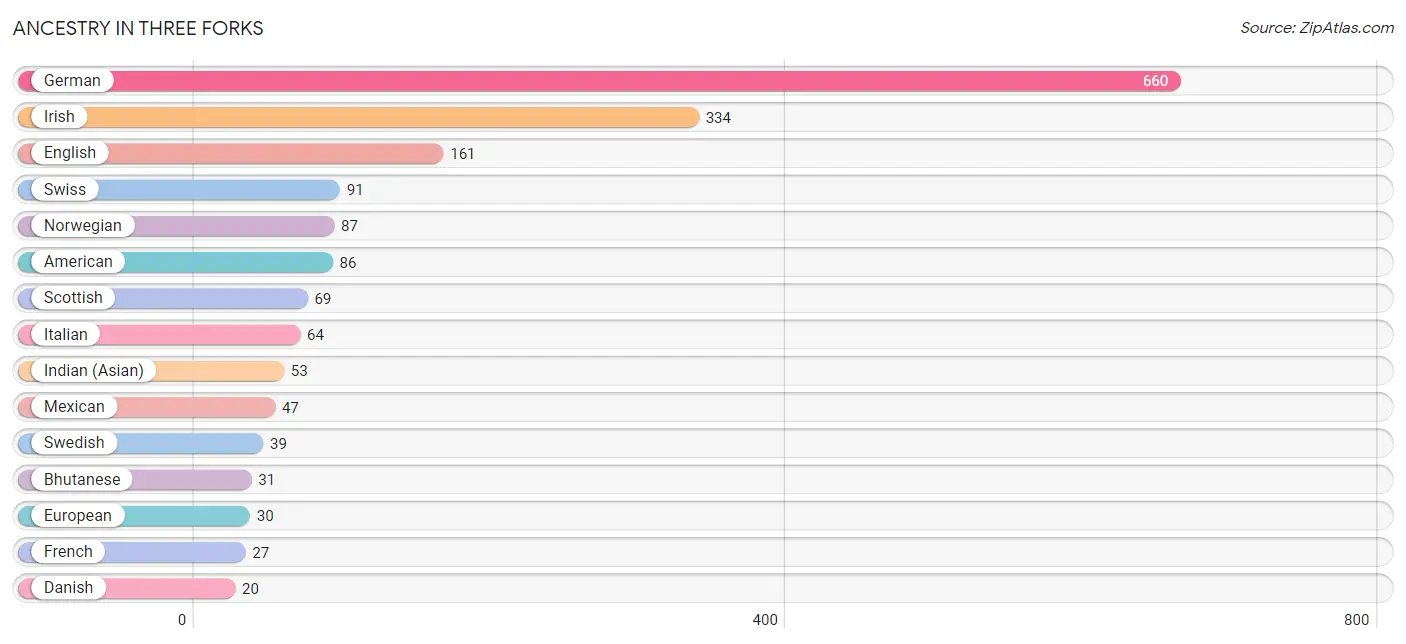
| Ancestry | # Population | % Population |
| American | 86 | 4.5% |
| Belgian | 14 | 0.7% |
| Bhutanese | 31 | 1.6% |
| Cajun | 4 | 0.2% |
| Cuban | 14 | 0.7% |
| Danish | 20 | 1.1% |
| Dutch | 9 | 0.5% |
| English | 161 | 8.5% |
| European | 30 | 1.6% |
| French | 27 | 1.4% |
| German | 660 | 34.8% |
| Greek | 7 | 0.4% |
| Indian (Asian) | 53 | 2.8% |
| Irish | 334 | 17.6% |
| Italian | 64 | 3.4% |
| Mexican | 47 | 2.5% |
| Norwegian | 87 | 4.6% |
| Scandinavian | 7 | 0.4% |
| Scotch-Irish | 12 | 0.6% |
| Scottish | 69 | 3.6% |
| Spanish | 15 | 0.8% |
| Swedish | 39 | 2.1% |
| Swiss | 91 | 4.8% | View All 23 Rows |
Immigrants in Three Forks
The most numerous immigrant groups reported in Three Forks came from Asia (38 | 2.0%), Eastern Asia (38 | 2.0%), Japan (20 | 1.1%), China (18 | 0.9%), and Canada (8 | 0.4%), together accounting for 6.5% of all Three Forks residents.
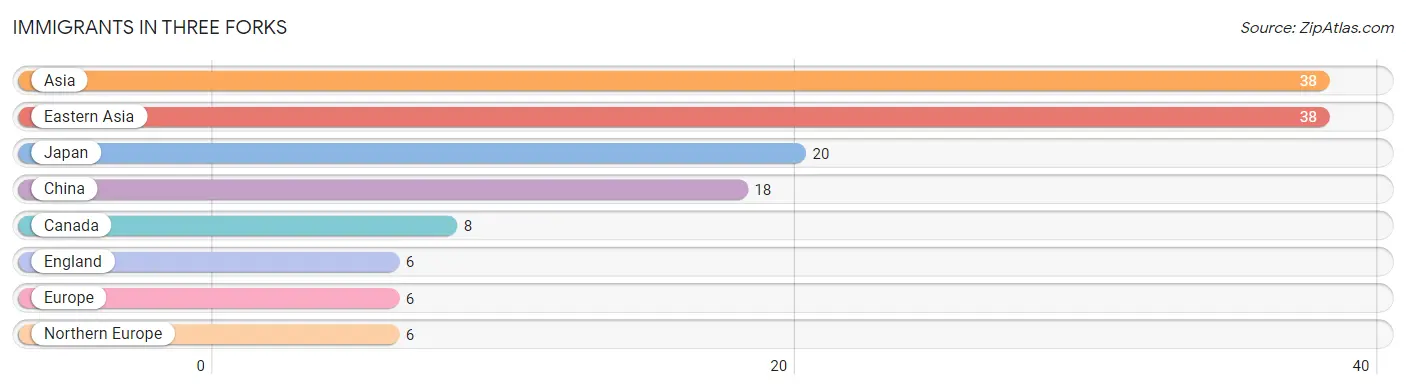
| Immigration Origin | # Population | % Population |
| Asia | 38 | 2.0% |
| Canada | 8 | 0.4% |
| China | 18 | 0.9% |
| Eastern Asia | 38 | 2.0% |
| England | 6 | 0.3% |
| Europe | 6 | 0.3% |
| Japan | 20 | 1.1% |
| Northern Europe | 6 | 0.3% | View All 8 Rows |
Sex and Age in Three Forks
Sex and Age in Three Forks
The most populous age groups in Three Forks are 60 to 64 Years (156 | 16.5%) for men and 60 to 64 Years (169 | 17.7%) for women.
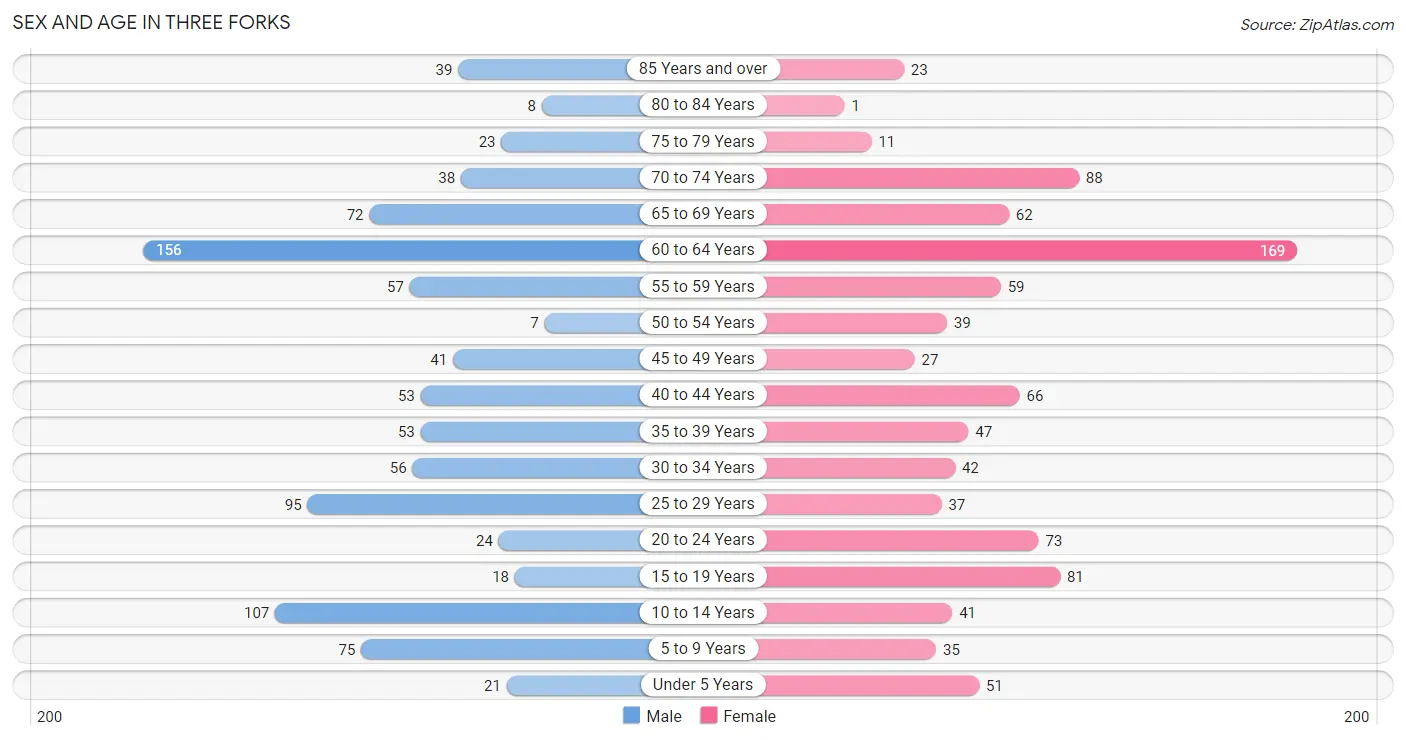
| Age Bracket | Male | Female |
| Under 5 Years | 21 (2.2%) | 51 (5.4%) |
| 5 to 9 Years | 75 (8.0%) | 35 (3.7%) |
| 10 to 14 Years | 107 (11.4%) | 41 (4.3%) |
| 15 to 19 Years | 18 (1.9%) | 81 (8.5%) |
| 20 to 24 Years | 24 (2.5%) | 73 (7.7%) |
| 25 to 29 Years | 95 (10.1%) | 37 (3.9%) |
| 30 to 34 Years | 56 (5.9%) | 42 (4.4%) |
| 35 to 39 Years | 53 (5.6%) | 47 (4.9%) |
| 40 to 44 Years | 53 (5.6%) | 66 (6.9%) |
| 45 to 49 Years | 41 (4.3%) | 27 (2.8%) |
| 50 to 54 Years | 7 (0.7%) | 39 (4.1%) |
| 55 to 59 Years | 57 (6.0%) | 59 (6.2%) |
| 60 to 64 Years | 156 (16.5%) | 169 (17.7%) |
| 65 to 69 Years | 72 (7.6%) | 62 (6.5%) |
| 70 to 74 Years | 38 (4.0%) | 88 (9.2%) |
| 75 to 79 Years | 23 (2.4%) | 11 (1.2%) |
| 80 to 84 Years | 8 (0.9%) | 1 (0.1%) |
| 85 Years and over | 39 (4.1%) | 23 (2.4%) |
| Total | 943 (100.0%) | 952 (100.0%) |
Families and Households in Three Forks
Median Family Size in Three Forks
The median family size in Three Forks is 3.05 persons per family, with single female/mother families (26 | 5.8%) accounting for the largest median family size of 4.65 persons per family. On the other hand, single male/father families (9 | 2.0%) represent the smallest median family size with 2.67 persons per family.
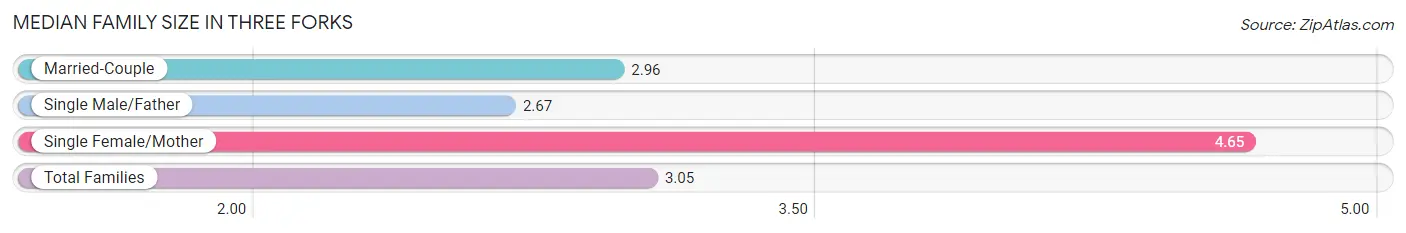
| Family Type | # Families | Family Size |
| Married-Couple | 413 (92.2%) | 2.96 |
| Single Male/Father | 9 (2.0%) | 2.67 |
| Single Female/Mother | 26 (5.8%) | 4.65 |
| Total Families | 448 (100.0%) | 3.05 |
Median Household Size in Three Forks
The median household size in Three Forks is 2.43 persons per household, with single female/mother households (26 | 3.4%) accounting for the largest median household size of 4.65 persons per household. non-family households (327 | 42.2%) represent the smallest median household size with 1.57 persons per household.
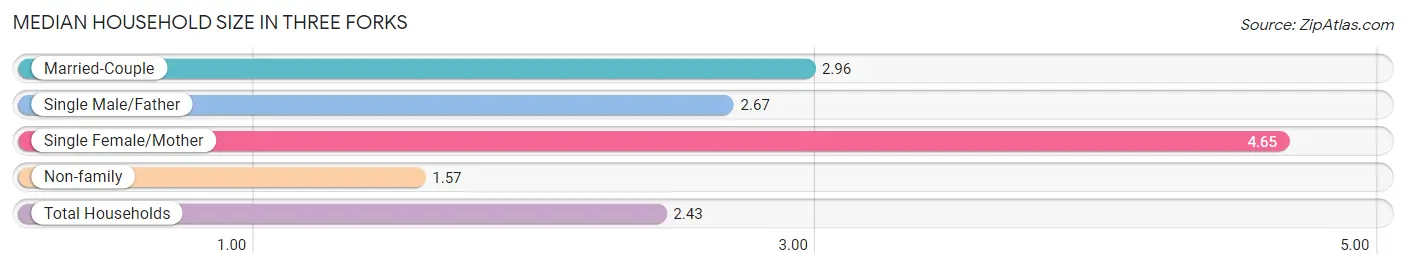
| Household Type | # Households | Household Size |
| Married-Couple | 413 (53.3%) | 2.96 |
| Single Male/Father | 9 (1.2%) | 2.67 |
| Single Female/Mother | 26 (3.4%) | 4.65 |
| Non-family | 327 (42.2%) | 1.57 |
| Total Households | 775 (100.0%) | 2.43 |
Household Size by Marriage Status in Three Forks
Out of a total of 775 households in Three Forks, 448 (57.8%) are family households, while 327 (42.2%) are nonfamily households. The most numerous type of family households are 2-person households, comprising 261, and the most common type of nonfamily households are 1-person households, comprising 227.
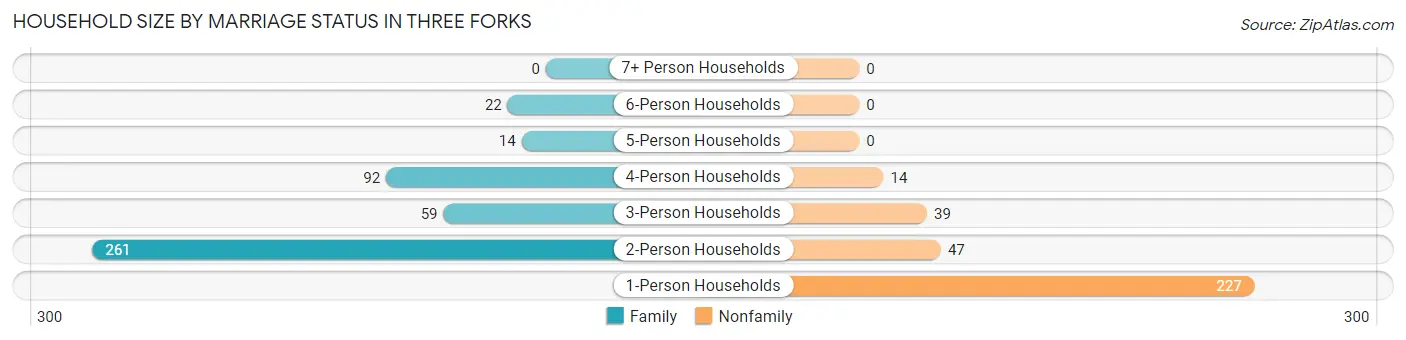
| Household Size | Family Households | Nonfamily Households |
| 1-Person Households | - | 227 (29.3%) |
| 2-Person Households | 261 (33.7%) | 47 (6.1%) |
| 3-Person Households | 59 (7.6%) | 39 (5.0%) |
| 4-Person Households | 92 (11.9%) | 14 (1.8%) |
| 5-Person Households | 14 (1.8%) | 0 (0.0%) |
| 6-Person Households | 22 (2.8%) | 0 (0.0%) |
| 7+ Person Households | 0 (0.0%) | 0 (0.0%) |
| Total | 448 (57.8%) | 327 (42.2%) |
Female Fertility in Three Forks
Fertility by Age in Three Forks
| Age Bracket | Women with Births | Births / 1,000 Women |
| 15 to 19 years | 0 (0.0%) | 0.0 |
| 20 to 34 years | 0 (0.0%) | 0.0 |
| 35 to 50 years | 0 (0.0%) | 0.0 |
| Total | 0 (0.0%) | 0.0 |
Fertility by Age by Marriage Status in Three Forks
| Age Bracket | Married | Unmarried |
| 15 to 19 years | 0 (0.0%) | 0 (0.0%) |
| 20 to 34 years | 0 (0.0%) | 0 (0.0%) |
| 35 to 50 years | 0 (0.0%) | 0 (0.0%) |
| Total | 0 (0.0%) | 0 (0.0%) |
Fertility by Education in Three Forks
| Educational Attainment | Women with Births | Births / 1,000 Women |
| Less than High School | 0 (0.0%) | 0.0 |
| High School Diploma | 0 (0.0%) | 0.0 |
| College or Associate's Degree | 0 (0.0%) | 0.0 |
| Bachelor's Degree | 0 (0.0%) | 0.0 |
| Graduate Degree | 0 (0.0%) | 0.0 |
| Total | 0 (0.0%) | 0.0 |
Fertility by Education by Marriage Status in Three Forks
| Educational Attainment | Married | Unmarried |
| Less than High School | 0 (0.0%) | 0 (0.0%) |
| High School Diploma | 0 (0.0%) | 0 (0.0%) |
| College or Associate's Degree | 0 (0.0%) | 0 (0.0%) |
| Bachelor's Degree | 0 (0.0%) | 0 (0.0%) |
| Graduate Degree | 0 (0.0%) | 0 (0.0%) |
| Total | 0 (0.0%) | 0 (0.0%) |
Employment Characteristics in Three Forks
Employment by Class of Employer in Three Forks
Among the 1,041 employed individuals in Three Forks, private company employees (596 | 57.3%), self-employed (not incorporated) (133 | 12.8%), and local government employees (108 | 10.4%) make up the most common classes of employment.
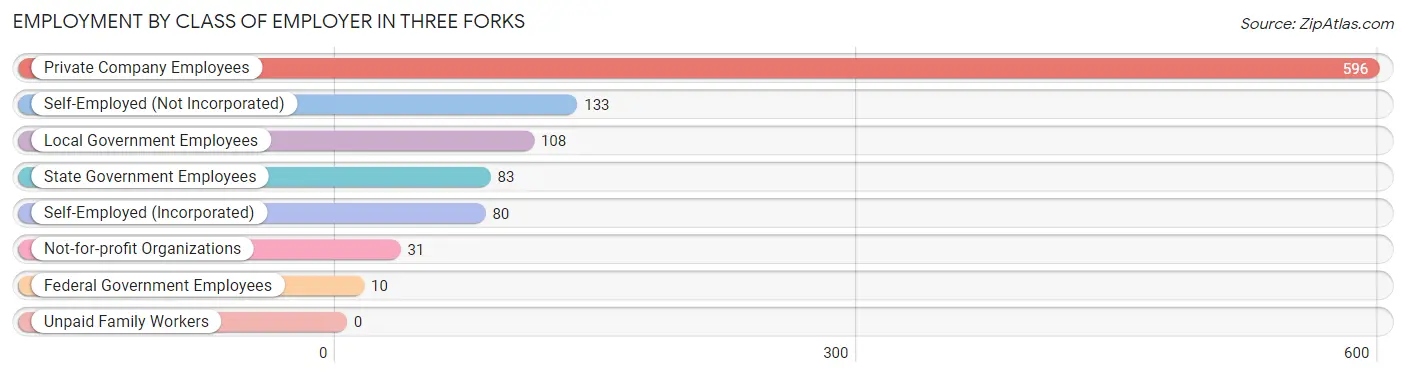
| Employer Class | # Employees | % Employees |
| Private Company Employees | 596 | 57.3% |
| Self-Employed (Incorporated) | 80 | 7.7% |
| Self-Employed (Not Incorporated) | 133 | 12.8% |
| Not-for-profit Organizations | 31 | 3.0% |
| Local Government Employees | 108 | 10.4% |
| State Government Employees | 83 | 8.0% |
| Federal Government Employees | 10 | 1.0% |
| Unpaid Family Workers | 0 | 0.0% |
| Total | 1,041 | 100.0% |
Employment Status by Age in Three Forks
According to the labor force statistics for Three Forks, out of the total population over 16 years of age (1,556), 69.0% or 1,074 individuals are in the labor force, with 1.4% or 15 of them unemployed. The age group with the highest labor force participation rate is 20 to 24 years, with 100.0% or 97 individuals in the labor force. Within the labor force, the 60 to 64 years age range has the highest percentage of unemployed individuals, with 4.3% or 11 of them being unemployed.
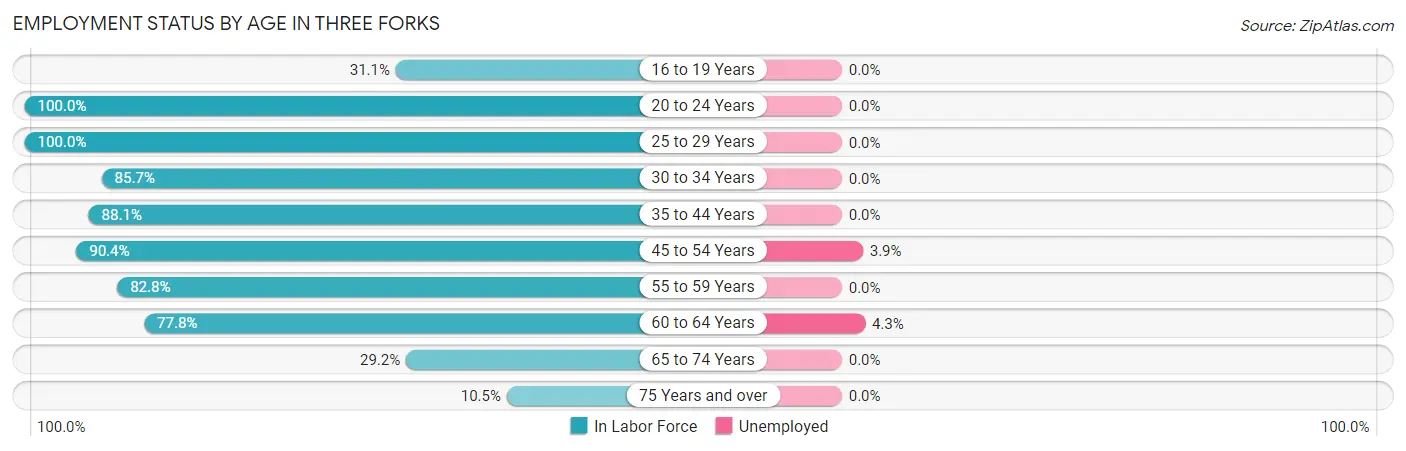
| Age Bracket | In Labor Force | Unemployed |
| 16 to 19 Years | 28 (31.1%) | 0 (0.0%) |
| 20 to 24 Years | 97 (100.0%) | 0 (0.0%) |
| 25 to 29 Years | 132 (100.0%) | 0 (0.0%) |
| 30 to 34 Years | 84 (85.7%) | 0 (0.0%) |
| 35 to 44 Years | 193 (88.1%) | 0 (0.0%) |
| 45 to 54 Years | 103 (90.4%) | 4 (3.9%) |
| 55 to 59 Years | 96 (82.8%) | 0 (0.0%) |
| 60 to 64 Years | 253 (77.8%) | 11 (4.3%) |
| 65 to 74 Years | 76 (29.2%) | 0 (0.0%) |
| 75 Years and over | 11 (10.5%) | 0 (0.0%) |
| Total | 1,074 (69.0%) | 15 (1.4%) |
Employment Status by Educational Attainment in Three Forks
According to labor force statistics for Three Forks, 85.8% of individuals (861) out of the total population between 25 and 64 years of age (1,004) are in the labor force, with 1.7% or 15 of them being unemployed. The group with the highest labor force participation rate are those with the educational attainment of bachelor's degree or higher, with 90.8% or 157 individuals in the labor force. Within the labor force, individuals with high school diploma education have the highest percentage of unemployment, with 3.8% or 15 of them being unemployed.
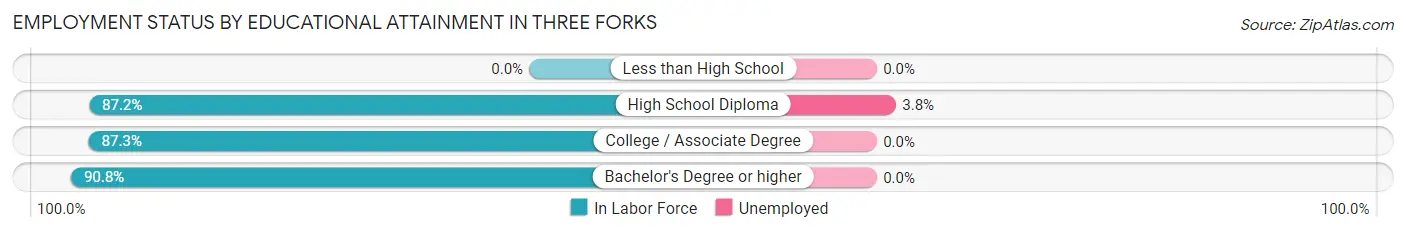
| Educational Attainment | In Labor Force | Unemployed |
| Less than High School | 0 (0.0%) | 0 (0.0%) |
| High School Diploma | 396 (87.2%) | 17 (3.8%) |
| College / Associate Degree | 308 (87.3%) | 0 (0.0%) |
| Bachelor's Degree or higher | 157 (90.8%) | 0 (0.0%) |
| Total | 861 (85.8%) | 17 (1.7%) |
Employment Occupations by Sex in Three Forks
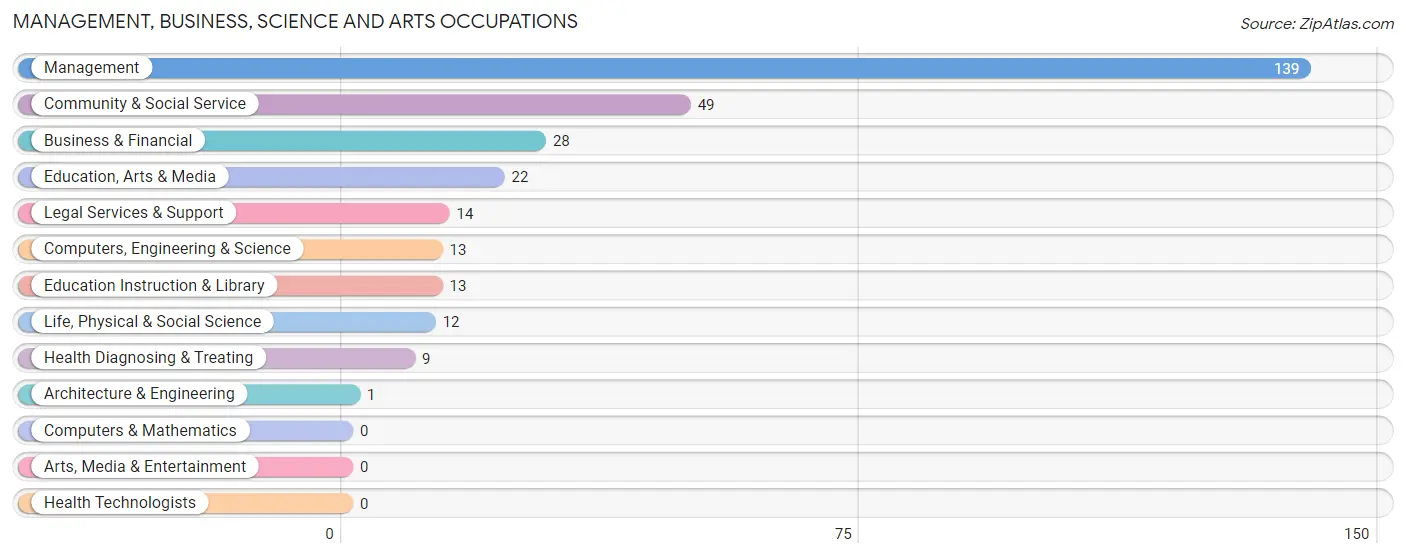
Management, Business, Science and Arts Occupations
The most common Management, Business, Science and Arts occupations in Three Forks are Management (139 | 13.1%), Community & Social Service (49 | 4.6%), Business & Financial (28 | 2.6%), Education, Arts & Media (22 | 2.1%), and Legal Services & Support (14 | 1.3%).
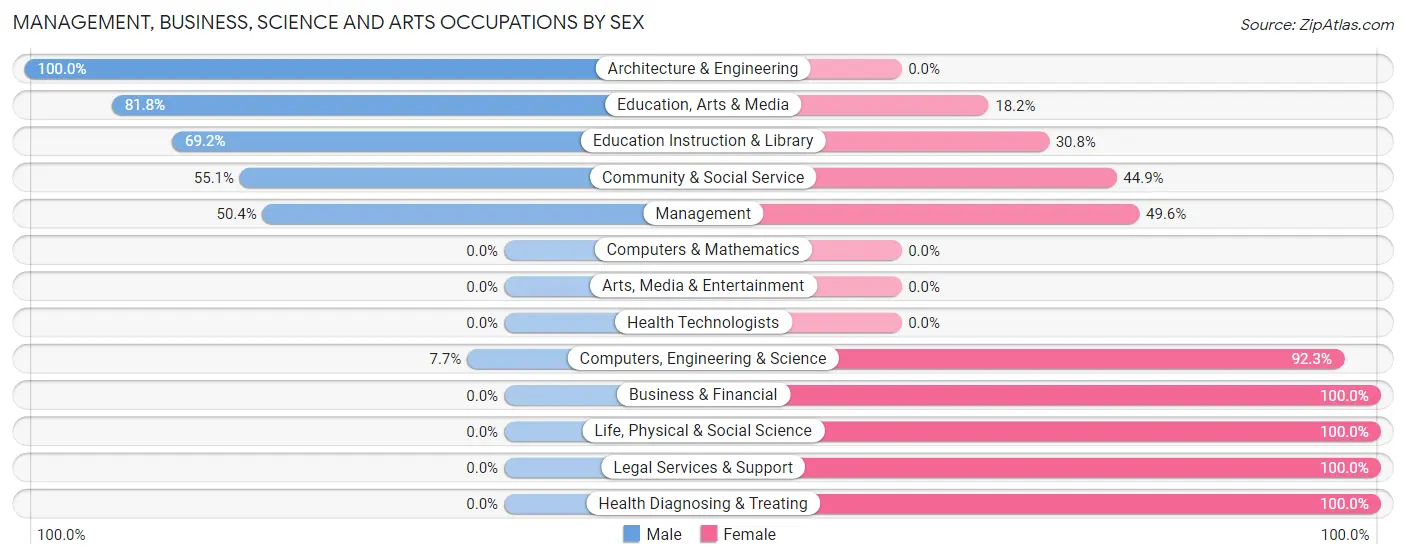
Management, Business, Science and Arts Occupations by Sex
Within the Management, Business, Science and Arts occupations in Three Forks, the most male-oriented occupations are Architecture & Engineering (100.0%), Education, Arts & Media (81.8%), and Education Instruction & Library (69.2%), while the most female-oriented occupations are Business & Financial (100.0%), Life, Physical & Social Science (100.0%), and Legal Services & Support (100.0%).
| Occupation | Male | Female |
| Management | 70 (50.4%) | 69 (49.6%) |
| Business & Financial | 0 (0.0%) | 28 (100.0%) |
| Computers, Engineering & Science | 1 (7.7%) | 12 (92.3%) |
| Computers & Mathematics | 0 (0.0%) | 0 (0.0%) |
| Architecture & Engineering | 1 (100.0%) | 0 (0.0%) |
| Life, Physical & Social Science | 0 (0.0%) | 12 (100.0%) |
| Community & Social Service | 27 (55.1%) | 22 (44.9%) |
| Education, Arts & Media | 18 (81.8%) | 4 (18.2%) |
| Legal Services & Support | 0 (0.0%) | 14 (100.0%) |
| Education Instruction & Library | 9 (69.2%) | 4 (30.8%) |
| Arts, Media & Entertainment | 0 (0.0%) | 0 (0.0%) |
| Health Diagnosing & Treating | 0 (0.0%) | 9 (100.0%) |
| Health Technologists | 0 (0.0%) | 0 (0.0%) |
| Total (Category) | 98 (41.2%) | 140 (58.8%) |
| Total (Overall) | 498 (47.1%) | 560 (52.9%) |
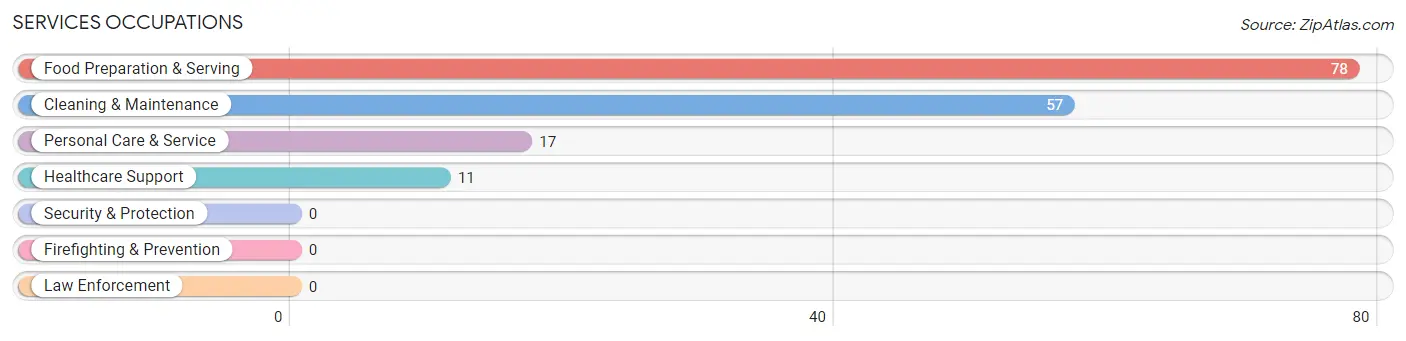
Services Occupations
The most common Services occupations in Three Forks are Food Preparation & Serving (78 | 7.4%), Cleaning & Maintenance (57 | 5.4%), Personal Care & Service (17 | 1.6%), and Healthcare Support (11 | 1.0%).
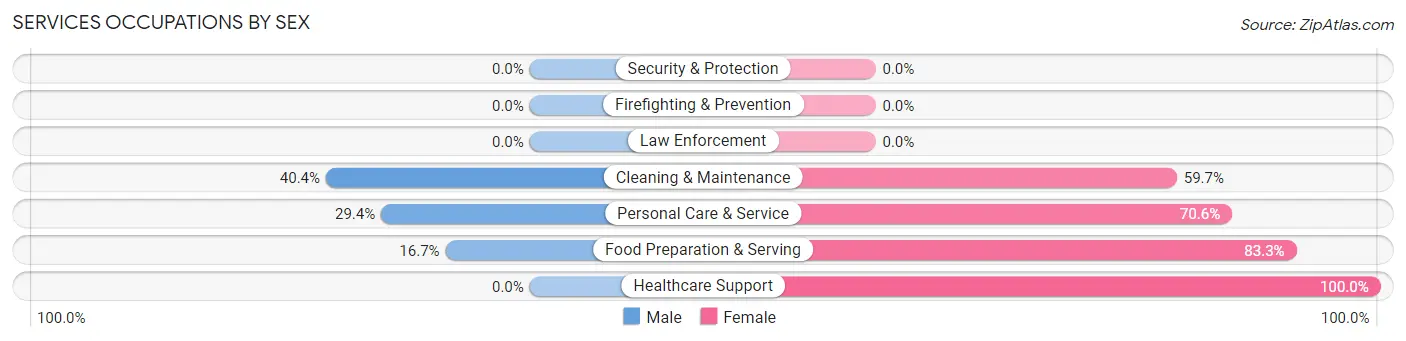
Services Occupations by Sex
Within the Services occupations in Three Forks, the most male-oriented occupations are Cleaning & Maintenance (40.4%), Personal Care & Service (29.4%), and Food Preparation & Serving (16.7%), while the most female-oriented occupations are Healthcare Support (100.0%), Food Preparation & Serving (83.3%), and Personal Care & Service (70.6%).
| Occupation | Male | Female |
| Healthcare Support | 0 (0.0%) | 11 (100.0%) |
| Security & Protection | 0 (0.0%) | 0 (0.0%) |
| Firefighting & Prevention | 0 (0.0%) | 0 (0.0%) |
| Law Enforcement | 0 (0.0%) | 0 (0.0%) |
| Food Preparation & Serving | 13 (16.7%) | 65 (83.3%) |
| Cleaning & Maintenance | 23 (40.4%) | 34 (59.7%) |
| Personal Care & Service | 5 (29.4%) | 12 (70.6%) |
| Total (Category) | 41 (25.2%) | 122 (74.9%) |
| Total (Overall) | 498 (47.1%) | 560 (52.9%) |
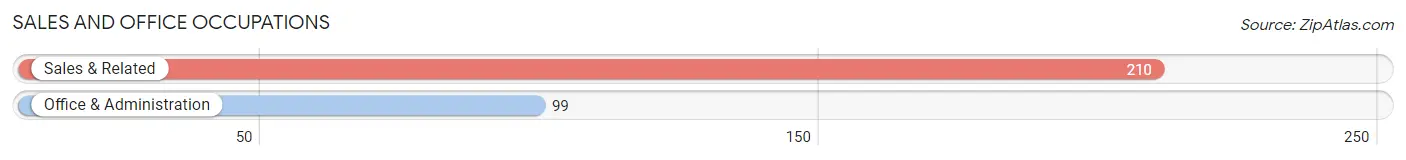
Sales and Office Occupations
The most common Sales and Office occupations in Three Forks are Sales & Related (210 | 19.9%), and Office & Administration (99 | 9.4%).
Sales and Office Occupations by Sex
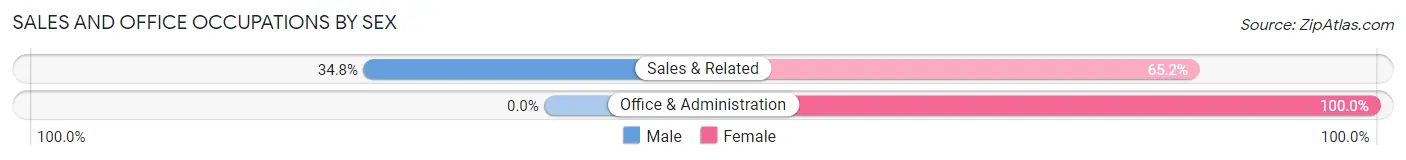
| Occupation | Male | Female |
| Sales & Related | 73 (34.8%) | 137 (65.2%) |
| Office & Administration | 0 (0.0%) | 99 (100.0%) |
| Total (Category) | 73 (23.6%) | 236 (76.4%) |
| Total (Overall) | 498 (47.1%) | 560 (52.9%) |
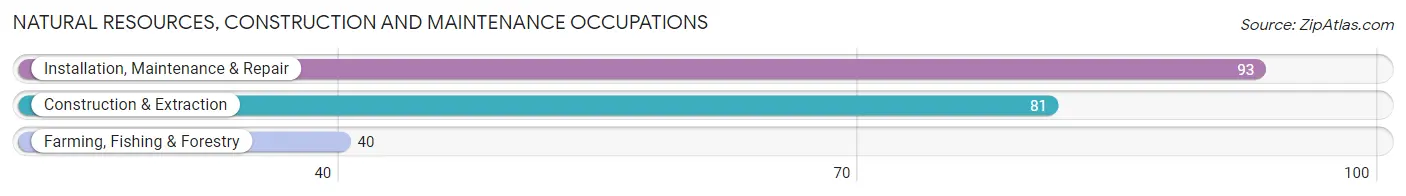
Natural Resources, Construction and Maintenance Occupations
The most common Natural Resources, Construction and Maintenance occupations in Three Forks are Installation, Maintenance & Repair (93 | 8.8%), Construction & Extraction (81 | 7.7%), and Farming, Fishing & Forestry (40 | 3.8%).
Natural Resources, Construction and Maintenance Occupations by Sex
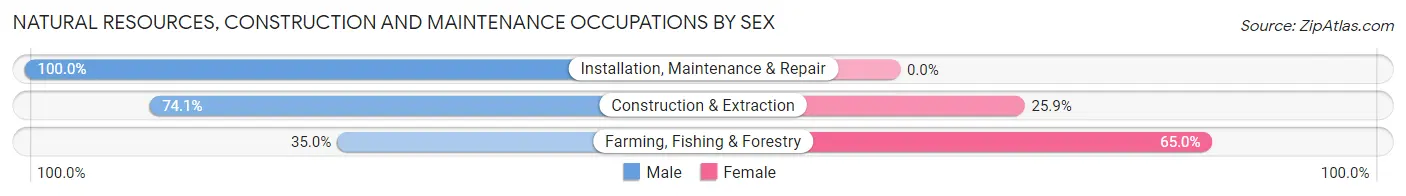
| Occupation | Male | Female |
| Farming, Fishing & Forestry | 14 (35.0%) | 26 (65.0%) |
| Construction & Extraction | 60 (74.1%) | 21 (25.9%) |
| Installation, Maintenance & Repair | 93 (100.0%) | 0 (0.0%) |
| Total (Category) | 167 (78.0%) | 47 (22.0%) |
| Total (Overall) | 498 (47.1%) | 560 (52.9%) |
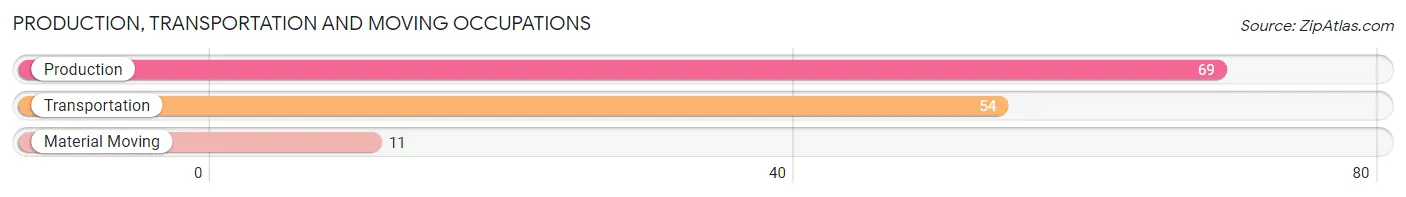
Production, Transportation and Moving Occupations
The most common Production, Transportation and Moving occupations in Three Forks are Production (69 | 6.5%), Transportation (54 | 5.1%), and Material Moving (11 | 1.0%).
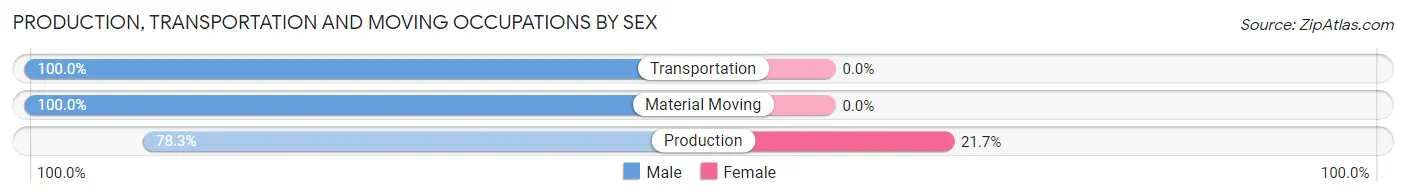
Production, Transportation and Moving Occupations by Sex
| Occupation | Male | Female |
| Production | 54 (78.3%) | 15 (21.7%) |
| Transportation | 54 (100.0%) | 0 (0.0%) |
| Material Moving | 11 (100.0%) | 0 (0.0%) |
| Total (Category) | 119 (88.8%) | 15 (11.2%) |
| Total (Overall) | 498 (47.1%) | 560 (52.9%) |
Employment Industries by Sex in Three Forks
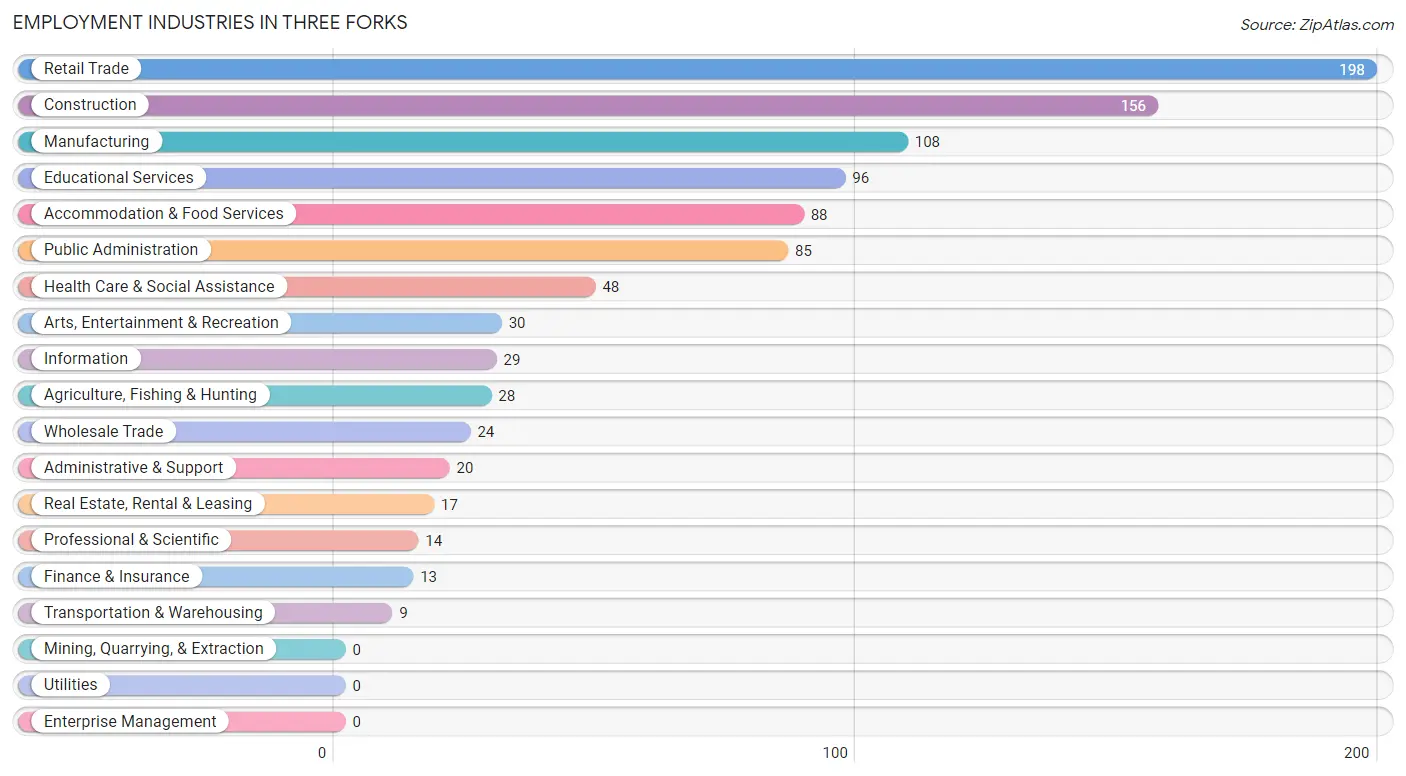
Employment Industries in Three Forks
The major employment industries in Three Forks include Retail Trade (198 | 18.7%), Construction (156 | 14.7%), Manufacturing (108 | 10.2%), Educational Services (96 | 9.1%), and Accommodation & Food Services (88 | 8.3%).
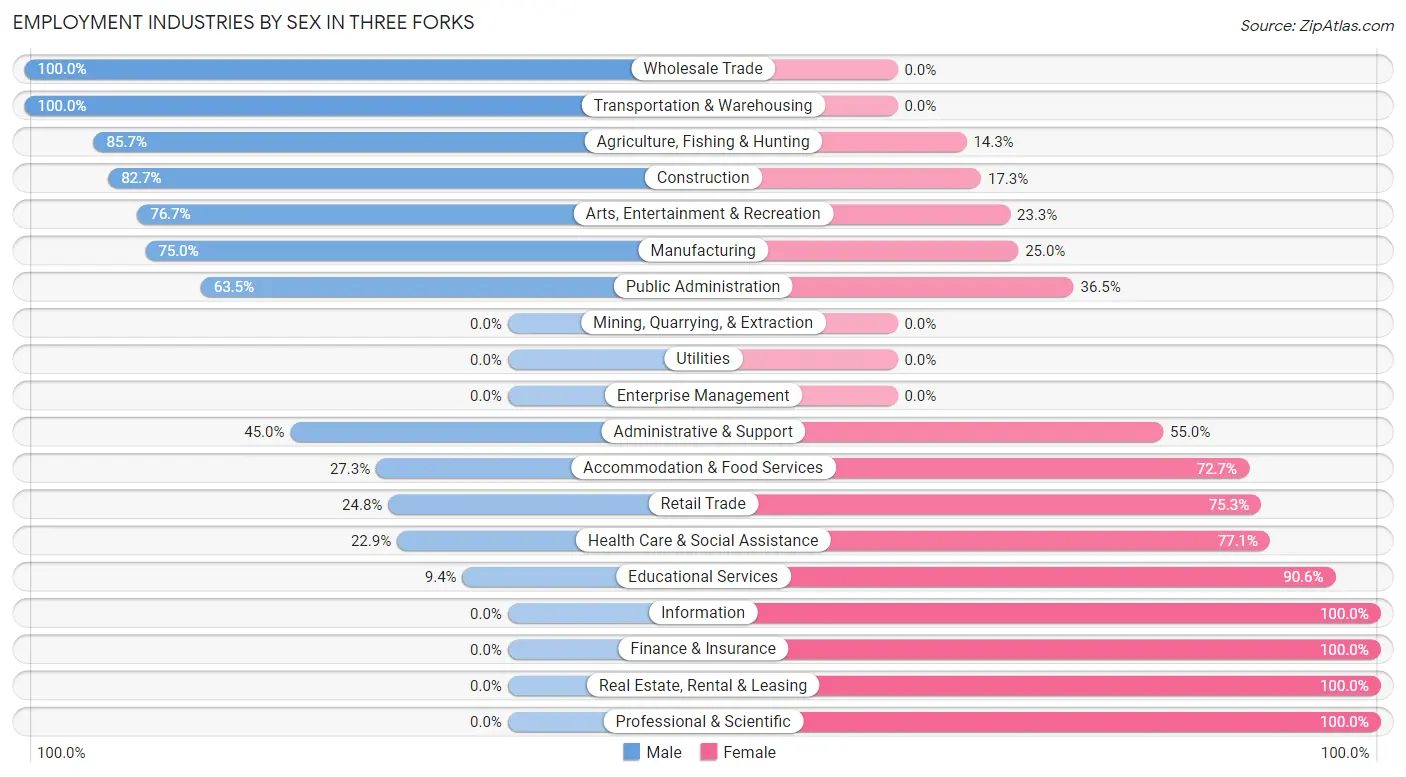
Employment Industries by Sex in Three Forks
The Three Forks industries that see more men than women are Wholesale Trade (100.0%), Transportation & Warehousing (100.0%), and Agriculture, Fishing & Hunting (85.7%), whereas the industries that tend to have a higher number of women are Information (100.0%), Finance & Insurance (100.0%), and Real Estate, Rental & Leasing (100.0%).
| Industry | Male | Female |
| Agriculture, Fishing & Hunting | 24 (85.7%) | 4 (14.3%) |
| Mining, Quarrying, & Extraction | 0 (0.0%) | 0 (0.0%) |
| Construction | 129 (82.7%) | 27 (17.3%) |
| Manufacturing | 81 (75.0%) | 27 (25.0%) |
| Wholesale Trade | 24 (100.0%) | 0 (0.0%) |
| Retail Trade | 49 (24.7%) | 149 (75.2%) |
| Transportation & Warehousing | 9 (100.0%) | 0 (0.0%) |
| Utilities | 0 (0.0%) | 0 (0.0%) |
| Information | 0 (0.0%) | 29 (100.0%) |
| Finance & Insurance | 0 (0.0%) | 13 (100.0%) |
| Real Estate, Rental & Leasing | 0 (0.0%) | 17 (100.0%) |
| Professional & Scientific | 0 (0.0%) | 14 (100.0%) |
| Enterprise Management | 0 (0.0%) | 0 (0.0%) |
| Administrative & Support | 9 (45.0%) | 11 (55.0%) |
| Educational Services | 9 (9.4%) | 87 (90.6%) |
| Health Care & Social Assistance | 11 (22.9%) | 37 (77.1%) |
| Arts, Entertainment & Recreation | 23 (76.7%) | 7 (23.3%) |
| Accommodation & Food Services | 24 (27.3%) | 64 (72.7%) |
| Public Administration | 54 (63.5%) | 31 (36.5%) |
| Total | 498 (47.1%) | 560 (52.9%) |
Education in Three Forks
School Enrollment in Three Forks
The most common levels of schooling among the 388 students in Three Forks are middle school (148 | 38.1%), elementary school (102 | 26.3%), and high school (77 | 19.9%).
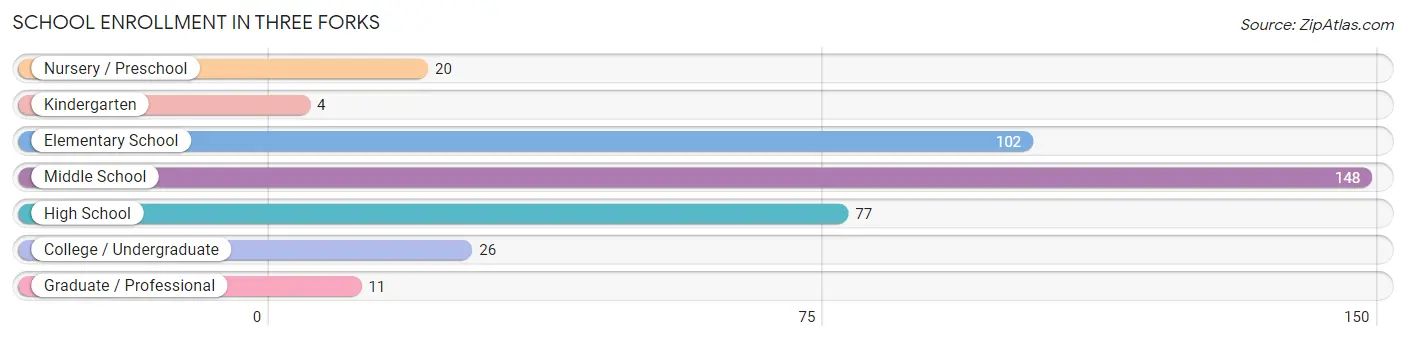
| School Level | # Students | % Students |
| Nursery / Preschool | 20 | 5.1% |
| Kindergarten | 4 | 1.0% |
| Elementary School | 102 | 26.3% |
| Middle School | 148 | 38.1% |
| High School | 77 | 19.9% |
| College / Undergraduate | 26 | 6.7% |
| Graduate / Professional | 11 | 2.8% |
| Total | 388 | 100.0% |
School Enrollment by Age by Funding Source in Three Forks
Out of a total of 388 students who are enrolled in schools in Three Forks, 18 (4.6%) attend a private institution, while the remaining 370 (95.4%) are enrolled in public schools. The age group of 25 to 34 year olds has the highest likelihood of being enrolled in private schools, with 4 (100.0% in the age bracket) enrolled. Conversely, the age group of 5 to 9 year old has the lowest likelihood of being enrolled in a private school, with 106 (100.0% in the age bracket) attending a public institution.
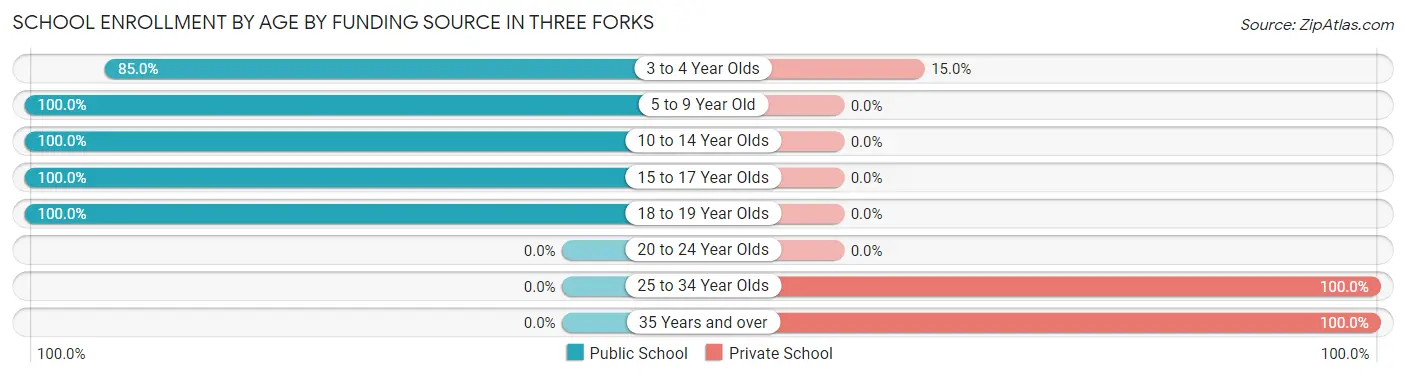
| Age Bracket | Public School | Private School |
| 3 to 4 Year Olds | 17 (85.0%) | 3 (15.0%) |
| 5 to 9 Year Old | 106 (100.0%) | 0 (0.0%) |
| 10 to 14 Year Olds | 148 (100.0%) | 0 (0.0%) |
| 15 to 17 Year Olds | 77 (100.0%) | 0 (0.0%) |
| 18 to 19 Year Olds | 22 (100.0%) | 0 (0.0%) |
| 20 to 24 Year Olds | 0 (0.0%) | 0 (0.0%) |
| 25 to 34 Year Olds | 0 (0.0%) | 4 (100.0%) |
| 35 Years and over | 0 (0.0%) | 11 (100.0%) |
| Total | 370 (95.4%) | 18 (4.6%) |
Educational Attainment by Field of Study in Three Forks
Education (70 | 20.6%), business (63 | 18.6%), liberal arts & history (56 | 16.5%), psychology (45 | 13.3%), and physical & health sciences (40 | 11.8%) are the most common fields of study among 339 individuals in Three Forks who have obtained a bachelor's degree or higher.
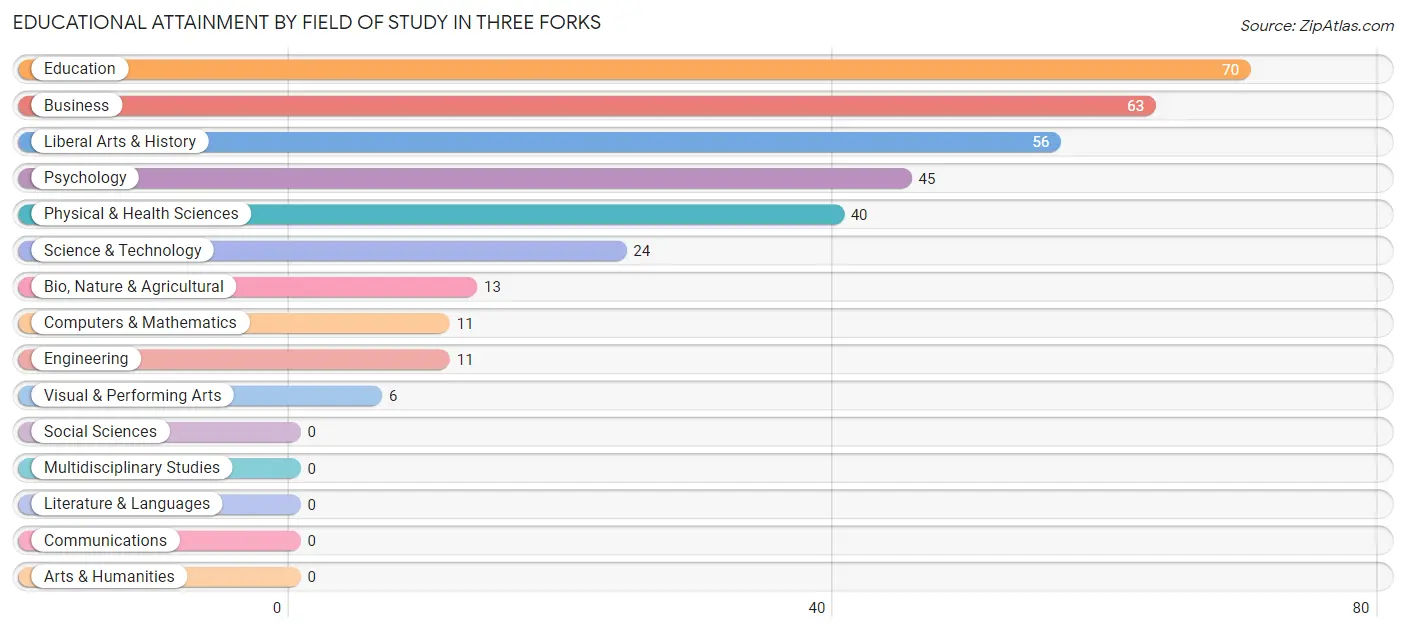
| Field of Study | # Graduates | % Graduates |
| Computers & Mathematics | 11 | 3.2% |
| Bio, Nature & Agricultural | 13 | 3.8% |
| Physical & Health Sciences | 40 | 11.8% |
| Psychology | 45 | 13.3% |
| Social Sciences | 0 | 0.0% |
| Engineering | 11 | 3.2% |
| Multidisciplinary Studies | 0 | 0.0% |
| Science & Technology | 24 | 7.1% |
| Business | 63 | 18.6% |
| Education | 70 | 20.6% |
| Literature & Languages | 0 | 0.0% |
| Liberal Arts & History | 56 | 16.5% |
| Visual & Performing Arts | 6 | 1.8% |
| Communications | 0 | 0.0% |
| Arts & Humanities | 0 | 0.0% |
| Total | 339 | 100.0% |
Transportation & Commute in Three Forks
Vehicle Availability by Sex in Three Forks
The most prevalent vehicle ownership categories in Three Forks are males with 3 vehicles (241, accounting for 48.4%) and females with 3 vehicles (278, making up 44.4%).
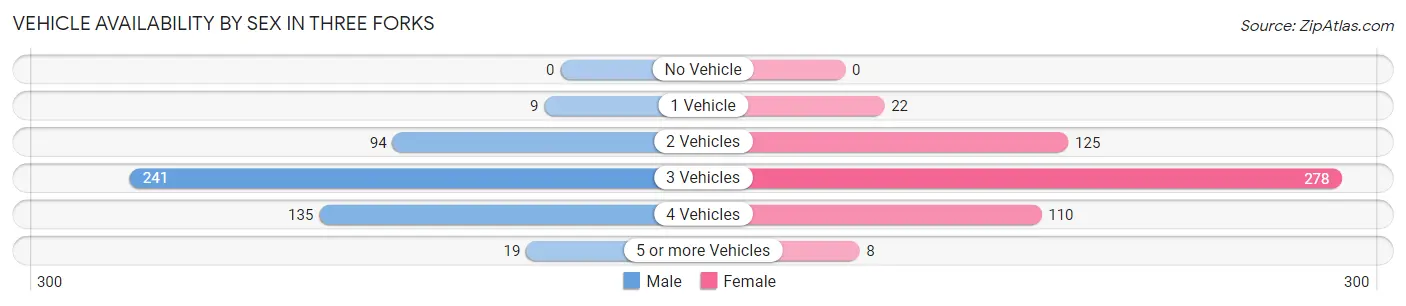
| Vehicles Available | Male | Female |
| No Vehicle | 0 (0.0%) | 0 (0.0%) |
| 1 Vehicle | 9 (1.8%) | 22 (4.1%) |
| 2 Vehicles | 94 (18.9%) | 125 (23.0%) |
| 3 Vehicles | 241 (48.4%) | 278 (51.2%) |
| 4 Vehicles | 135 (27.1%) | 110 (20.3%) |
| 5 or more Vehicles | 19 (3.8%) | 8 (1.5%) |
| Total | 498 (100.0%) | 543 (100.0%) |
Commute Time in Three Forks
The most frequently occuring commute durations in Three Forks are less than 5 minutes (200 commuters, 21.0%), 5 to 9 minutes (146 commuters, 15.3%), and 45 to 59 minutes (117 commuters, 12.3%).
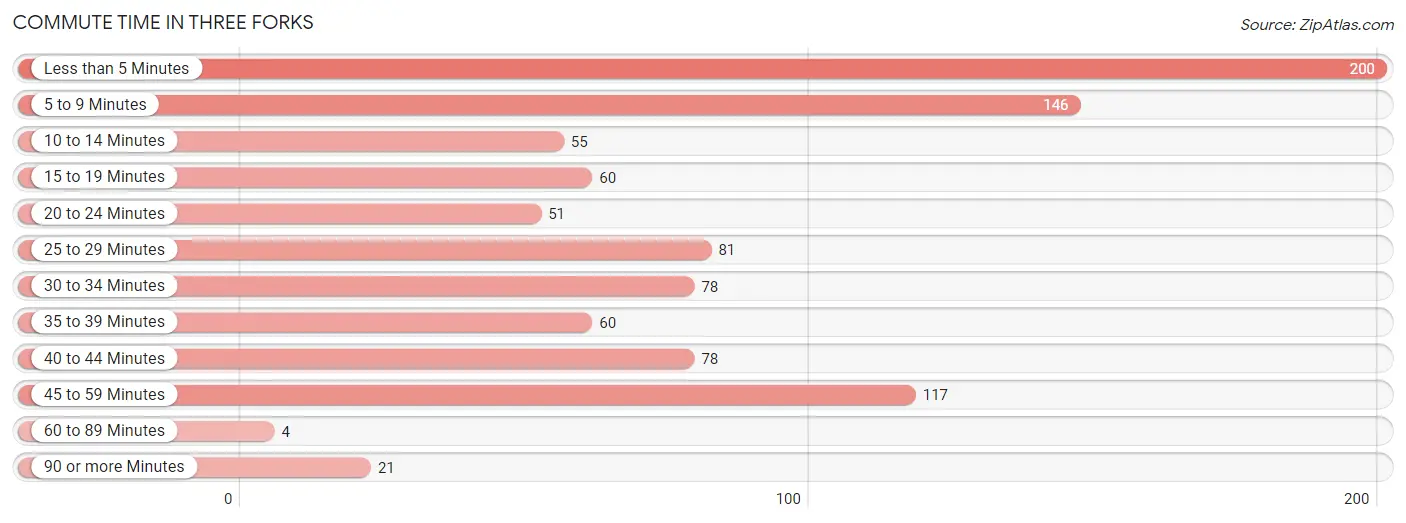
| Commute Time | # Commuters | % Commuters |
| Less than 5 Minutes | 200 | 21.0% |
| 5 to 9 Minutes | 146 | 15.3% |
| 10 to 14 Minutes | 55 | 5.8% |
| 15 to 19 Minutes | 60 | 6.3% |
| 20 to 24 Minutes | 51 | 5.4% |
| 25 to 29 Minutes | 81 | 8.5% |
| 30 to 34 Minutes | 78 | 8.2% |
| 35 to 39 Minutes | 60 | 6.3% |
| 40 to 44 Minutes | 78 | 8.2% |
| 45 to 59 Minutes | 117 | 12.3% |
| 60 to 89 Minutes | 4 | 0.4% |
| 90 or more Minutes | 21 | 2.2% |
Commute Time by Sex in Three Forks
The most common commute times in Three Forks are 45 to 59 minutes (96 commuters, 20.7%) for males and less than 5 minutes (169 commuters, 34.7%) for females.
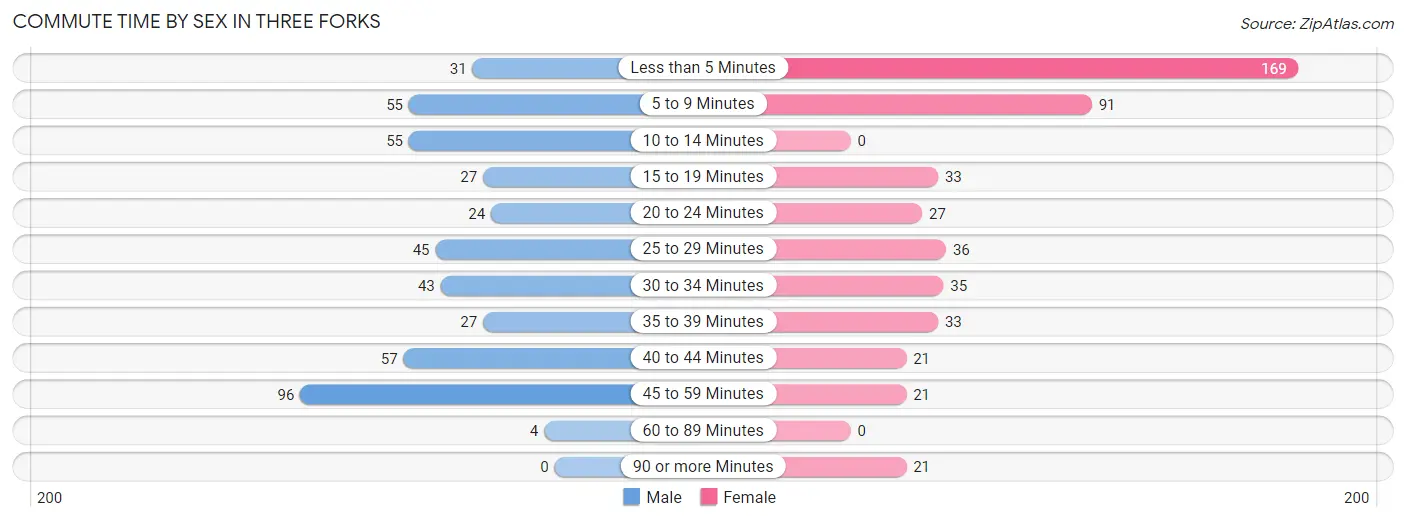
| Commute Time | Male | Female |
| Less than 5 Minutes | 31 (6.7%) | 169 (34.7%) |
| 5 to 9 Minutes | 55 (11.8%) | 91 (18.7%) |
| 10 to 14 Minutes | 55 (11.8%) | 0 (0.0%) |
| 15 to 19 Minutes | 27 (5.8%) | 33 (6.8%) |
| 20 to 24 Minutes | 24 (5.2%) | 27 (5.5%) |
| 25 to 29 Minutes | 45 (9.7%) | 36 (7.4%) |
| 30 to 34 Minutes | 43 (9.3%) | 35 (7.2%) |
| 35 to 39 Minutes | 27 (5.8%) | 33 (6.8%) |
| 40 to 44 Minutes | 57 (12.3%) | 21 (4.3%) |
| 45 to 59 Minutes | 96 (20.7%) | 21 (4.3%) |
| 60 to 89 Minutes | 4 (0.9%) | 0 (0.0%) |
| 90 or more Minutes | 0 (0.0%) | 21 (4.3%) |
Time of Departure to Work by Sex in Three Forks
The most frequent times of departure to work in Three Forks are 6:30 AM to 6:59 AM (135, 29.1%) for males and 7:30 AM to 7:59 AM (165, 33.9%) for females.
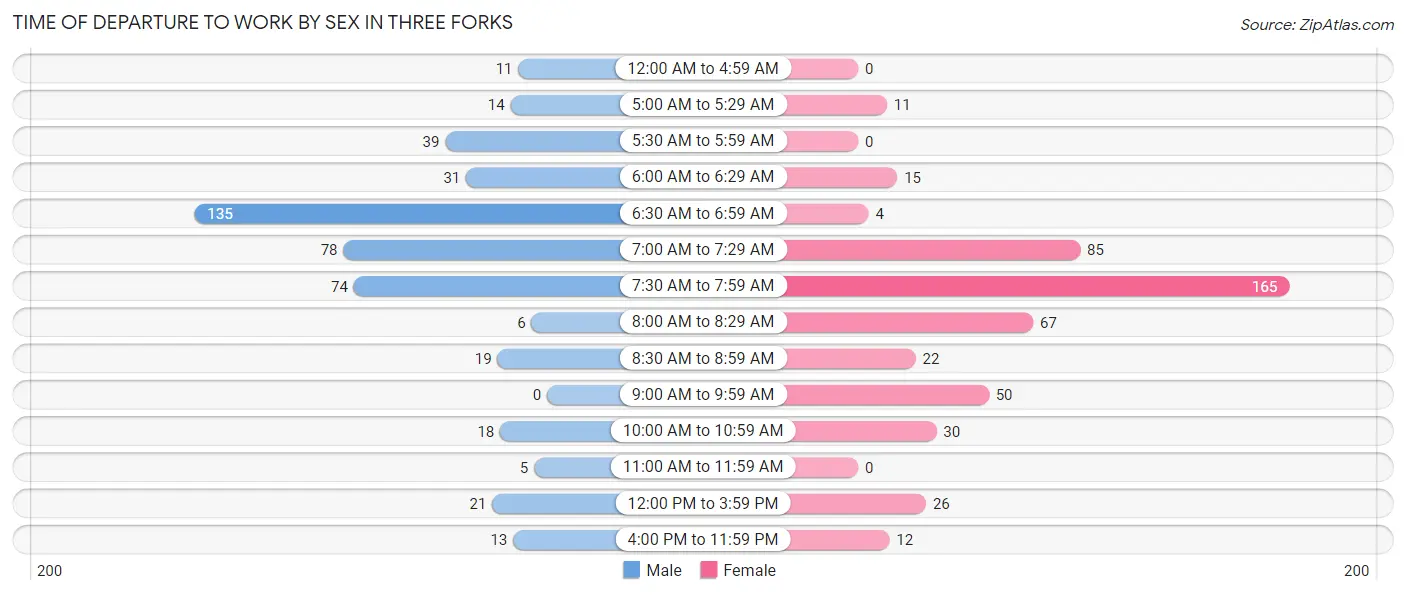
| Time of Departure | Male | Female |
| 12:00 AM to 4:59 AM | 11 (2.4%) | 0 (0.0%) |
| 5:00 AM to 5:29 AM | 14 (3.0%) | 11 (2.3%) |
| 5:30 AM to 5:59 AM | 39 (8.4%) | 0 (0.0%) |
| 6:00 AM to 6:29 AM | 31 (6.7%) | 15 (3.1%) |
| 6:30 AM to 6:59 AM | 135 (29.1%) | 4 (0.8%) |
| 7:00 AM to 7:29 AM | 78 (16.8%) | 85 (17.4%) |
| 7:30 AM to 7:59 AM | 74 (16.0%) | 165 (33.9%) |
| 8:00 AM to 8:29 AM | 6 (1.3%) | 67 (13.8%) |
| 8:30 AM to 8:59 AM | 19 (4.1%) | 22 (4.5%) |
| 9:00 AM to 9:59 AM | 0 (0.0%) | 50 (10.3%) |
| 10:00 AM to 10:59 AM | 18 (3.9%) | 30 (6.2%) |
| 11:00 AM to 11:59 AM | 5 (1.1%) | 0 (0.0%) |
| 12:00 PM to 3:59 PM | 21 (4.5%) | 26 (5.3%) |
| 4:00 PM to 11:59 PM | 13 (2.8%) | 12 (2.5%) |
| Total | 464 (100.0%) | 487 (100.0%) |
Housing Occupancy in Three Forks
Occupancy by Ownership in Three Forks
Of the total 775 dwellings in Three Forks, owner-occupied units account for 608 (78.4%), while renter-occupied units make up 167 (21.5%).
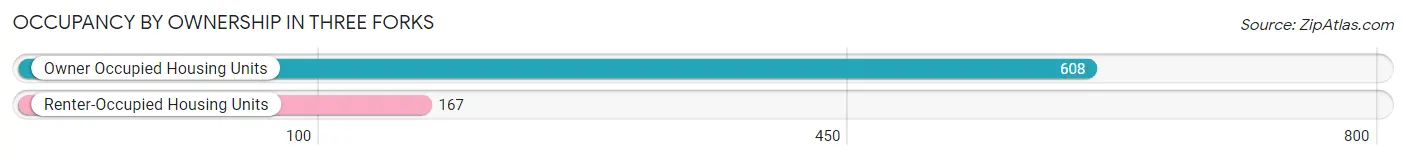
| Occupancy | # Housing Units | % Housing Units |
| Owner Occupied Housing Units | 608 | 78.4% |
| Renter-Occupied Housing Units | 167 | 21.5% |
| Total Occupied Housing Units | 775 | 100.0% |
Occupancy by Household Size in Three Forks
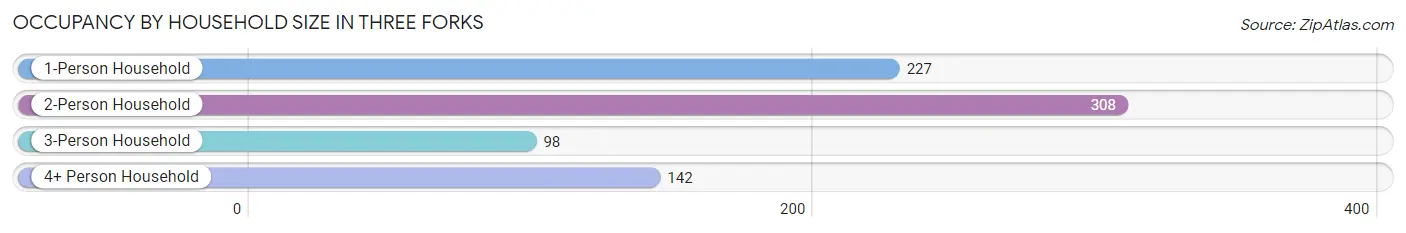
| Household Size | # Housing Units | % Housing Units |
| 1-Person Household | 227 | 29.3% |
| 2-Person Household | 308 | 39.7% |
| 3-Person Household | 98 | 12.7% |
| 4+ Person Household | 142 | 18.3% |
| Total Housing Units | 775 | 100.0% |
Occupancy by Ownership by Household Size in Three Forks
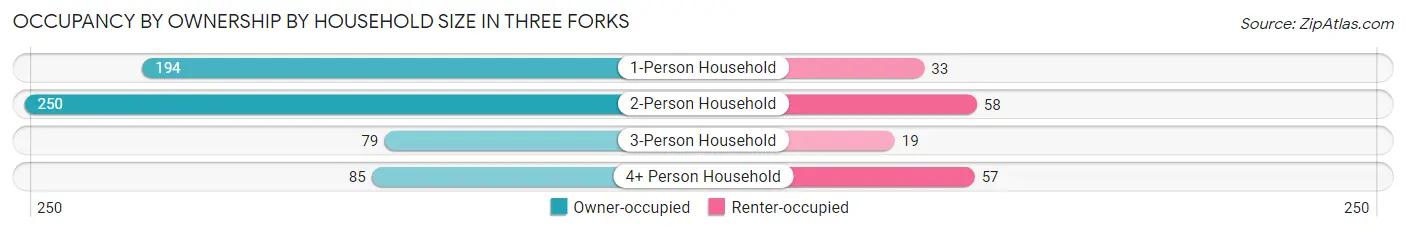
| Household Size | Owner-occupied | Renter-occupied |
| 1-Person Household | 194 (85.5%) | 33 (14.5%) |
| 2-Person Household | 250 (81.2%) | 58 (18.8%) |
| 3-Person Household | 79 (80.6%) | 19 (19.4%) |
| 4+ Person Household | 85 (59.9%) | 57 (40.1%) |
| Total Housing Units | 608 (78.4%) | 167 (21.5%) |
Occupancy by Educational Attainment in Three Forks
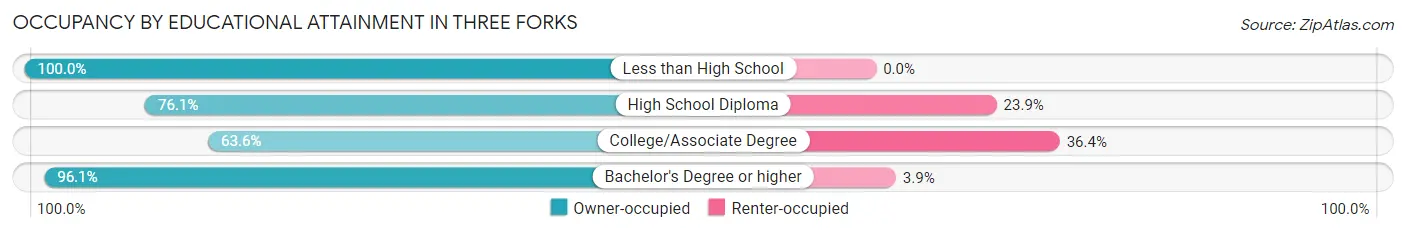
| Household Size | Owner-occupied | Renter-occupied |
| Less than High School | 26 (100.0%) | 0 (0.0%) |
| High School Diploma | 188 (76.1%) | 59 (23.9%) |
| College/Associate Degree | 173 (63.6%) | 99 (36.4%) |
| Bachelor's Degree or higher | 221 (96.1%) | 9 (3.9%) |
Occupancy by Age of Householder in Three Forks
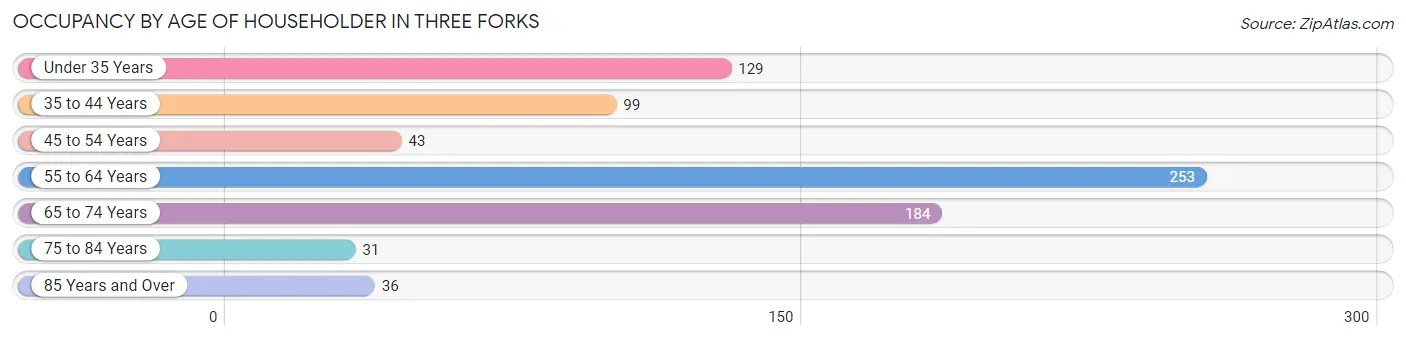
| Age Bracket | # Households | % Households |
| Under 35 Years | 129 | 16.7% |
| 35 to 44 Years | 99 | 12.8% |
| 45 to 54 Years | 43 | 5.6% |
| 55 to 64 Years | 253 | 32.7% |
| 65 to 74 Years | 184 | 23.7% |
| 75 to 84 Years | 31 | 4.0% |
| 85 Years and Over | 36 | 4.6% |
| Total | 775 | 100.0% |
Housing Finances in Three Forks
Median Income by Occupancy in Three Forks
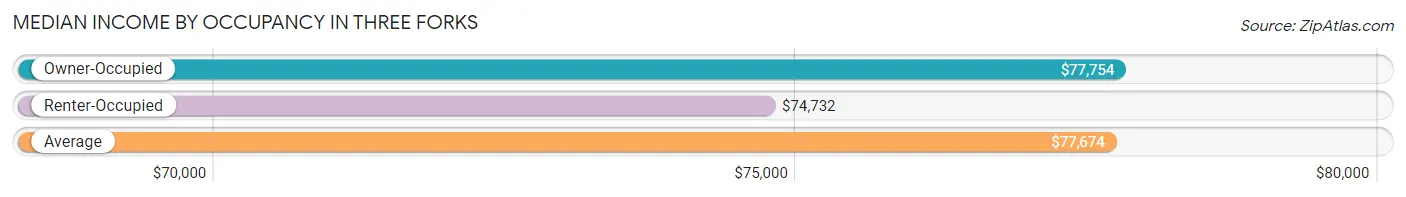
| Occupancy Type | # Households | Median Income |
| Owner-Occupied | 608 (78.4%) | $77,754 |
| Renter-Occupied | 167 (21.5%) | $74,732 |
| Average | 775 (100.0%) | $77,674 |
Occupancy by Householder Income Bracket in Three Forks
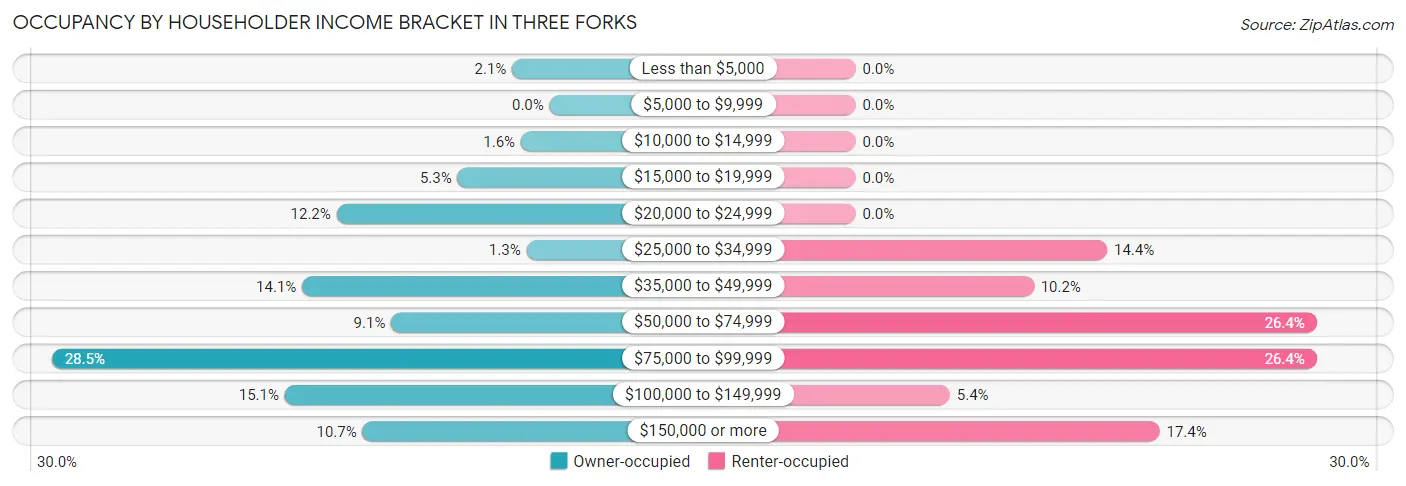
| Income Bracket | Owner-occupied | Renter-occupied |
| Less than $5,000 | 13 (2.1%) | 0 (0.0%) |
| $5,000 to $9,999 | 0 (0.0%) | 0 (0.0%) |
| $10,000 to $14,999 | 10 (1.6%) | 0 (0.0%) |
| $15,000 to $19,999 | 32 (5.3%) | 0 (0.0%) |
| $20,000 to $24,999 | 74 (12.2%) | 0 (0.0%) |
| $25,000 to $34,999 | 8 (1.3%) | 24 (14.4%) |
| $35,000 to $49,999 | 86 (14.1%) | 17 (10.2%) |
| $50,000 to $74,999 | 55 (9.0%) | 44 (26.4%) |
| $75,000 to $99,999 | 173 (28.4%) | 44 (26.4%) |
| $100,000 to $149,999 | 92 (15.1%) | 9 (5.4%) |
| $150,000 or more | 65 (10.7%) | 29 (17.4%) |
| Total | 608 (100.0%) | 167 (100.0%) |
Monthly Housing Cost Tiers in Three Forks
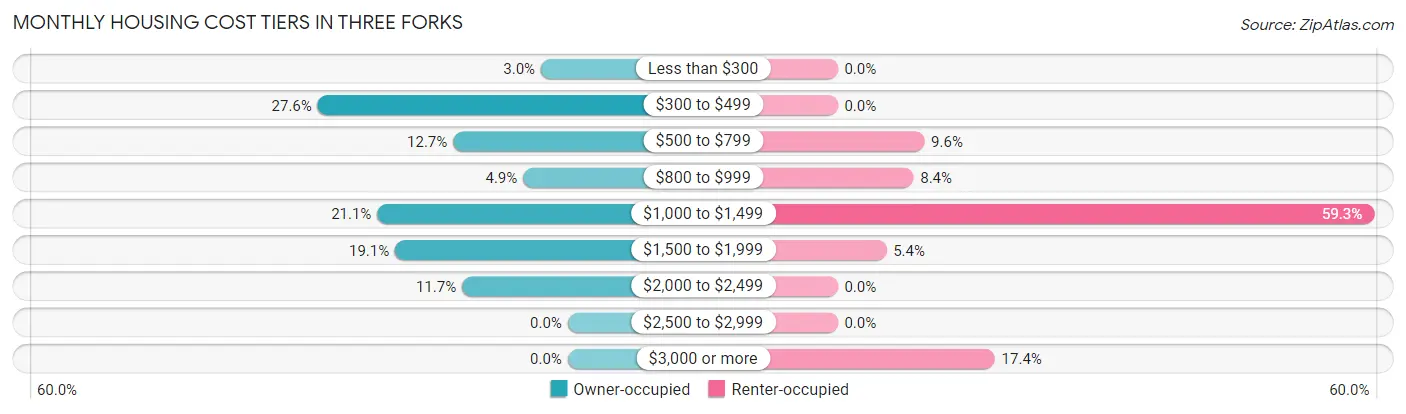
| Monthly Cost | Owner-occupied | Renter-occupied |
| Less than $300 | 18 (3.0%) | 0 (0.0%) |
| $300 to $499 | 168 (27.6%) | 0 (0.0%) |
| $500 to $799 | 77 (12.7%) | 16 (9.6%) |
| $800 to $999 | 30 (4.9%) | 14 (8.4%) |
| $1,000 to $1,499 | 128 (21.0%) | 99 (59.3%) |
| $1,500 to $1,999 | 116 (19.1%) | 9 (5.4%) |
| $2,000 to $2,499 | 71 (11.7%) | 0 (0.0%) |
| $2,500 to $2,999 | 0 (0.0%) | 0 (0.0%) |
| $3,000 or more | 0 (0.0%) | 29 (17.4%) |
| Total | 608 (100.0%) | 167 (100.0%) |
Physical Housing Characteristics in Three Forks
Housing Structures in Three Forks
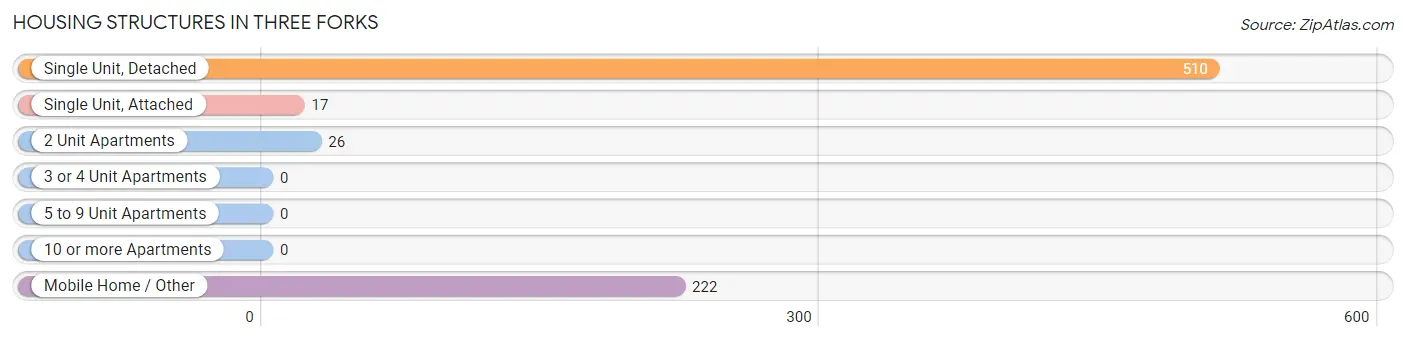
| Structure Type | # Housing Units | % Housing Units |
| Single Unit, Detached | 510 | 65.8% |
| Single Unit, Attached | 17 | 2.2% |
| 2 Unit Apartments | 26 | 3.4% |
| 3 or 4 Unit Apartments | 0 | 0.0% |
| 5 to 9 Unit Apartments | 0 | 0.0% |
| 10 or more Apartments | 0 | 0.0% |
| Mobile Home / Other | 222 | 28.6% |
| Total | 775 | 100.0% |
Housing Structures by Occupancy in Three Forks
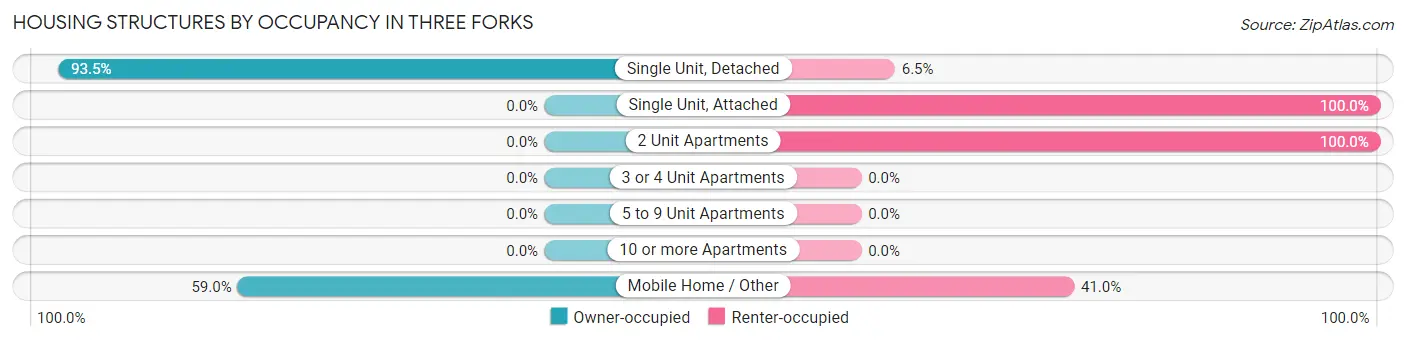
| Structure Type | Owner-occupied | Renter-occupied |
| Single Unit, Detached | 477 (93.5%) | 33 (6.5%) |
| Single Unit, Attached | 0 (0.0%) | 17 (100.0%) |
| 2 Unit Apartments | 0 (0.0%) | 26 (100.0%) |
| 3 or 4 Unit Apartments | 0 (0.0%) | 0 (0.0%) |
| 5 to 9 Unit Apartments | 0 (0.0%) | 0 (0.0%) |
| 10 or more Apartments | 0 (0.0%) | 0 (0.0%) |
| Mobile Home / Other | 131 (59.0%) | 91 (41.0%) |
| Total | 608 (78.4%) | 167 (21.5%) |
Housing Structures by Number of Rooms in Three Forks
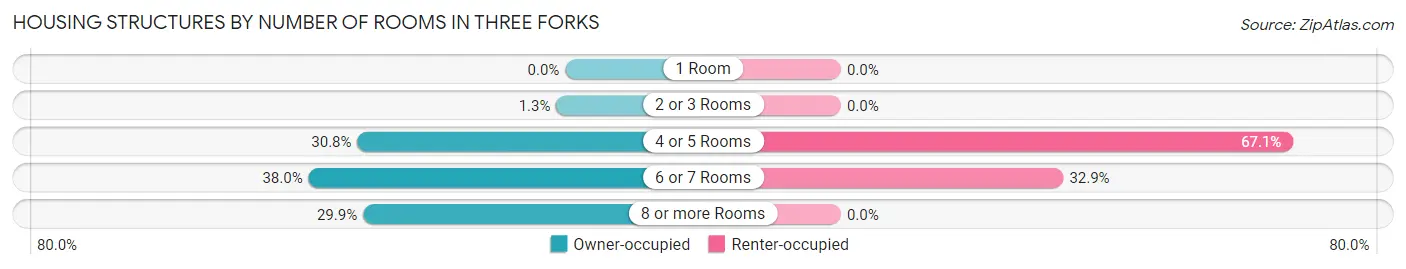
| Number of Rooms | Owner-occupied | Renter-occupied |
| 1 Room | 0 (0.0%) | 0 (0.0%) |
| 2 or 3 Rooms | 8 (1.3%) | 0 (0.0%) |
| 4 or 5 Rooms | 187 (30.8%) | 112 (67.1%) |
| 6 or 7 Rooms | 231 (38.0%) | 55 (32.9%) |
| 8 or more Rooms | 182 (29.9%) | 0 (0.0%) |
| Total | 608 (100.0%) | 167 (100.0%) |
Housing Structure by Heating Type in Three Forks
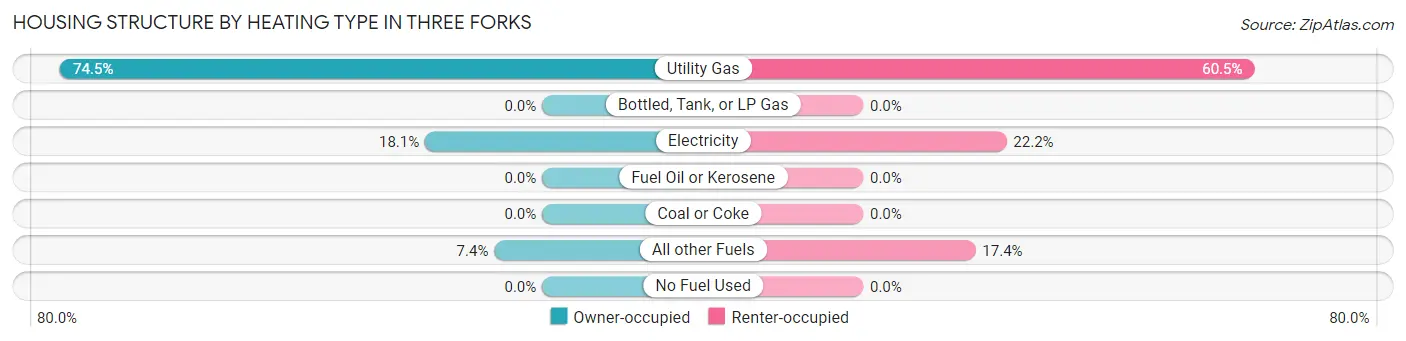
| Heating Type | Owner-occupied | Renter-occupied |
| Utility Gas | 453 (74.5%) | 101 (60.5%) |
| Bottled, Tank, or LP Gas | 0 (0.0%) | 0 (0.0%) |
| Electricity | 110 (18.1%) | 37 (22.2%) |
| Fuel Oil or Kerosene | 0 (0.0%) | 0 (0.0%) |
| Coal or Coke | 0 (0.0%) | 0 (0.0%) |
| All other Fuels | 45 (7.4%) | 29 (17.4%) |
| No Fuel Used | 0 (0.0%) | 0 (0.0%) |
| Total | 608 (100.0%) | 167 (100.0%) |
Household Vehicle Usage in Three Forks
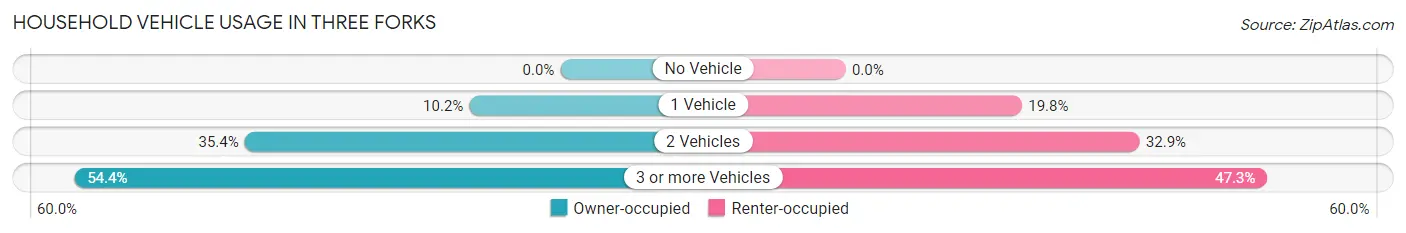
| Vehicles per Household | Owner-occupied | Renter-occupied |
| No Vehicle | 0 (0.0%) | 0 (0.0%) |
| 1 Vehicle | 62 (10.2%) | 33 (19.8%) |
| 2 Vehicles | 215 (35.4%) | 55 (32.9%) |
| 3 or more Vehicles | 331 (54.4%) | 79 (47.3%) |
| Total | 608 (100.0%) | 167 (100.0%) |
Real Estate & Mortgages in Three Forks
Real Estate and Mortgage Overview in Three Forks
| Characteristic | Without Mortgage | With Mortgage |
| Housing Units | 267 | 341 |
| Median Property Value | $231,500 | $352,900 |
| Median Household Income | $52,841 | $65 |
| Monthly Housing Costs | $456 | $0 |
| Real Estate Taxes | $1,484 | $24 |
Property Value by Mortgage Status in Three Forks
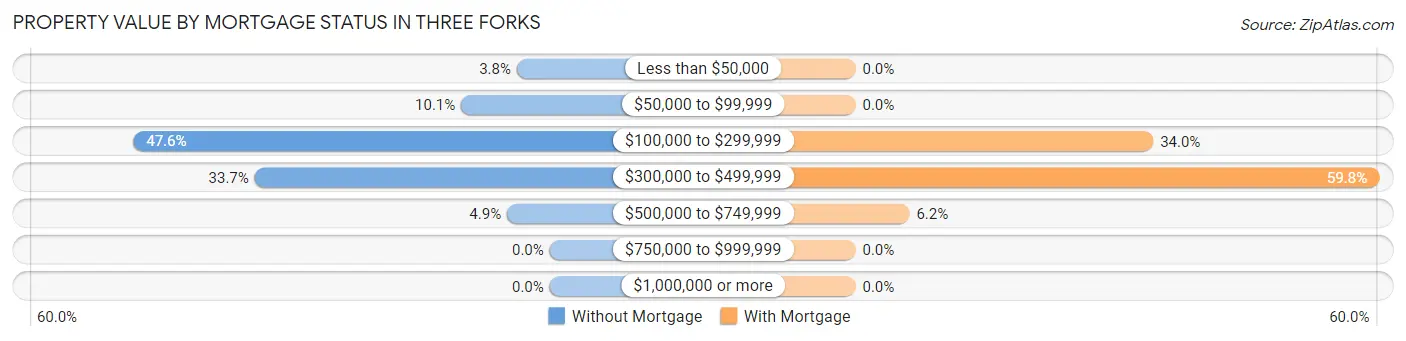
| Property Value | Without Mortgage | With Mortgage |
| Less than $50,000 | 10 (3.7%) | 0 (0.0%) |
| $50,000 to $99,999 | 27 (10.1%) | 0 (0.0%) |
| $100,000 to $299,999 | 127 (47.6%) | 116 (34.0%) |
| $300,000 to $499,999 | 90 (33.7%) | 204 (59.8%) |
| $500,000 to $749,999 | 13 (4.9%) | 21 (6.2%) |
| $750,000 to $999,999 | 0 (0.0%) | 0 (0.0%) |
| $1,000,000 or more | 0 (0.0%) | 0 (0.0%) |
| Total | 267 (100.0%) | 341 (100.0%) |
Household Income by Mortgage Status in Three Forks
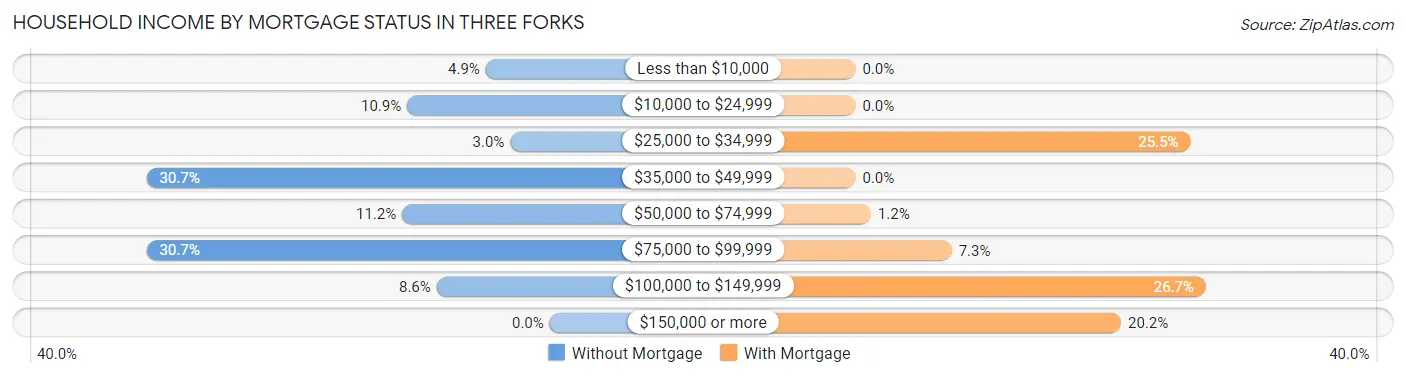
| Household Income | Without Mortgage | With Mortgage |
| Less than $10,000 | 13 (4.9%) | 0 (0.0%) |
| $10,000 to $24,999 | 29 (10.9%) | 0 (0.0%) |
| $25,000 to $34,999 | 8 (3.0%) | 87 (25.5%) |
| $35,000 to $49,999 | 82 (30.7%) | 0 (0.0%) |
| $50,000 to $74,999 | 30 (11.2%) | 4 (1.2%) |
| $75,000 to $99,999 | 82 (30.7%) | 25 (7.3%) |
| $100,000 to $149,999 | 23 (8.6%) | 91 (26.7%) |
| $150,000 or more | 0 (0.0%) | 69 (20.2%) |
| Total | 267 (100.0%) | 341 (100.0%) |
Property Value to Household Income Ratio in Three Forks
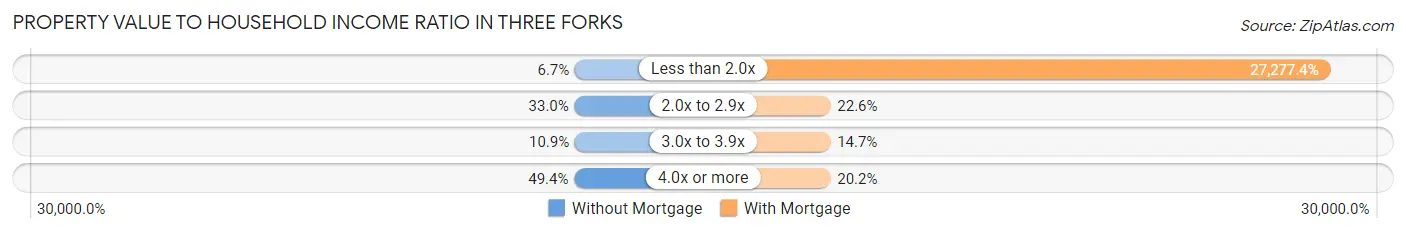
| Value-to-Income Ratio | Without Mortgage | With Mortgage |
| Less than 2.0x | 18 (6.7%) | 93,016 (27,277.4%) |
| 2.0x to 2.9x | 88 (33.0%) | 77 (22.6%) |
| 3.0x to 3.9x | 29 (10.9%) | 50 (14.7%) |
| 4.0x or more | 132 (49.4%) | 69 (20.2%) |
| Total | 267 (100.0%) | 341 (100.0%) |
Real Estate Taxes by Mortgage Status in Three Forks
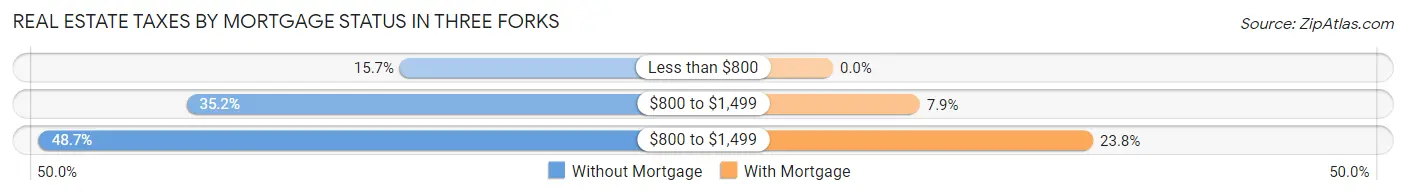
| Property Taxes | Without Mortgage | With Mortgage |
| Less than $800 | 42 (15.7%) | 0 (0.0%) |
| $800 to $1,499 | 94 (35.2%) | 27 (7.9%) |
| $800 to $1,499 | 130 (48.7%) | 81 (23.7%) |
| Total | 267 (100.0%) | 341 (100.0%) |
Health & Disability in Three Forks
Health Insurance Coverage by Age in Three Forks
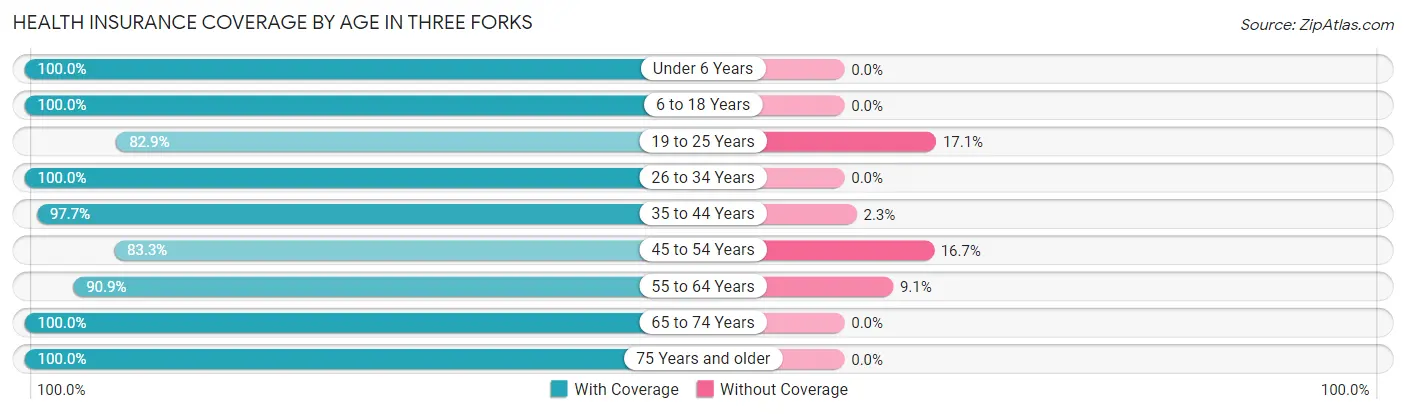
| Age Bracket | With Coverage | Without Coverage |
| Under 6 Years | 76 (100.0%) | 0 (0.0%) |
| 6 to 18 Years | 353 (100.0%) | 0 (0.0%) |
| 19 to 25 Years | 97 (82.9%) | 20 (17.1%) |
| 26 to 34 Years | 210 (100.0%) | 0 (0.0%) |
| 35 to 44 Years | 214 (97.7%) | 5 (2.3%) |
| 45 to 54 Years | 95 (83.3%) | 19 (16.7%) |
| 55 to 64 Years | 401 (90.9%) | 40 (9.1%) |
| 65 to 74 Years | 260 (100.0%) | 0 (0.0%) |
| 75 Years and older | 90 (100.0%) | 0 (0.0%) |
| Total | 1,796 (95.5%) | 84 (4.5%) |
Health Insurance Coverage by Citizenship Status in Three Forks
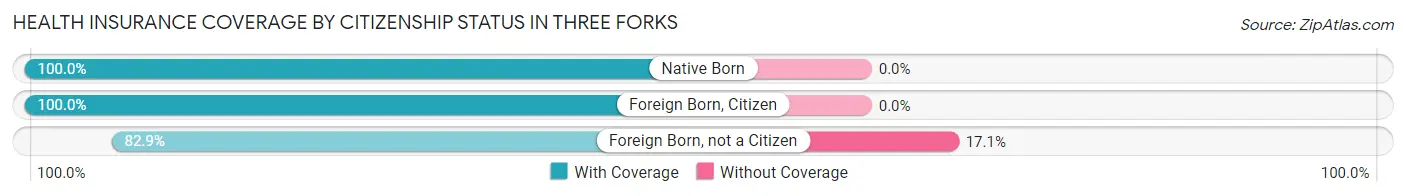
| Citizenship Status | With Coverage | Without Coverage |
| Native Born | 76 (100.0%) | 0 (0.0%) |
| Foreign Born, Citizen | 353 (100.0%) | 0 (0.0%) |
| Foreign Born, not a Citizen | 97 (82.9%) | 20 (17.1%) |
Health Insurance Coverage by Household Income in Three Forks
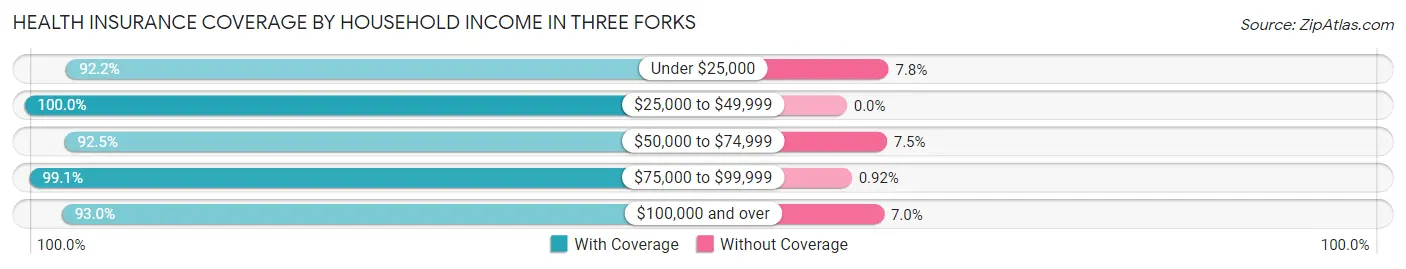
| Household Income | With Coverage | Without Coverage |
| Under $25,000 | 224 (92.2%) | 19 (7.8%) |
| $25,000 to $49,999 | 251 (100.0%) | 0 (0.0%) |
| $50,000 to $74,999 | 247 (92.5%) | 20 (7.5%) |
| $75,000 to $99,999 | 539 (99.1%) | 5 (0.9%) |
| $100,000 and over | 535 (93.0%) | 40 (7.0%) |
Public vs Private Health Insurance Coverage by Age in Three Forks
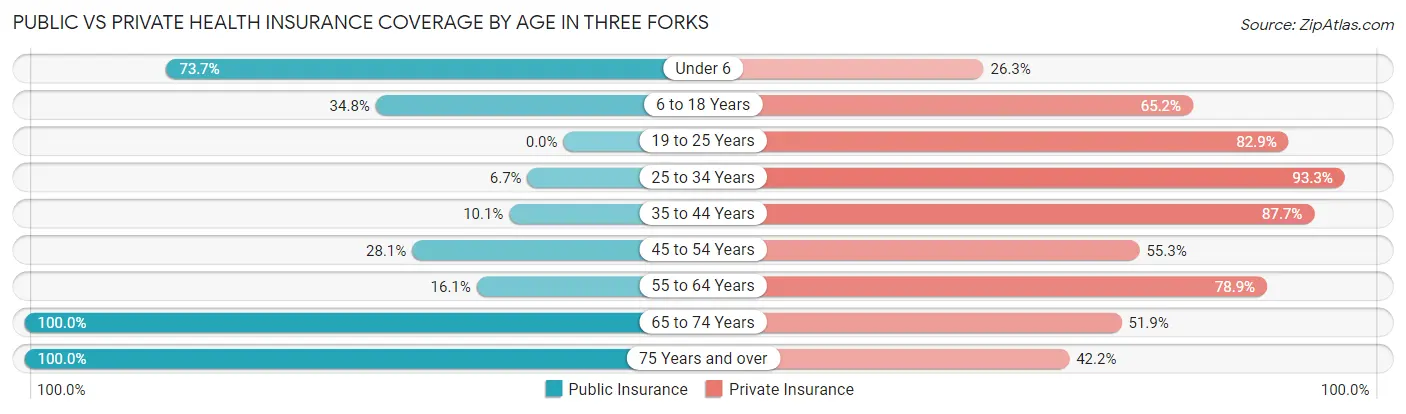
| Age Bracket | Public Insurance | Private Insurance |
| Under 6 | 56 (73.7%) | 20 (26.3%) |
| 6 to 18 Years | 123 (34.8%) | 230 (65.2%) |
| 19 to 25 Years | 0 (0.0%) | 97 (82.9%) |
| 25 to 34 Years | 14 (6.7%) | 196 (93.3%) |
| 35 to 44 Years | 22 (10.1%) | 192 (87.7%) |
| 45 to 54 Years | 32 (28.1%) | 63 (55.3%) |
| 55 to 64 Years | 71 (16.1%) | 348 (78.9%) |
| 65 to 74 Years | 260 (100.0%) | 135 (51.9%) |
| 75 Years and over | 90 (100.0%) | 38 (42.2%) |
| Total | 668 (35.5%) | 1,319 (70.2%) |
Disability Status by Sex by Age in Three Forks
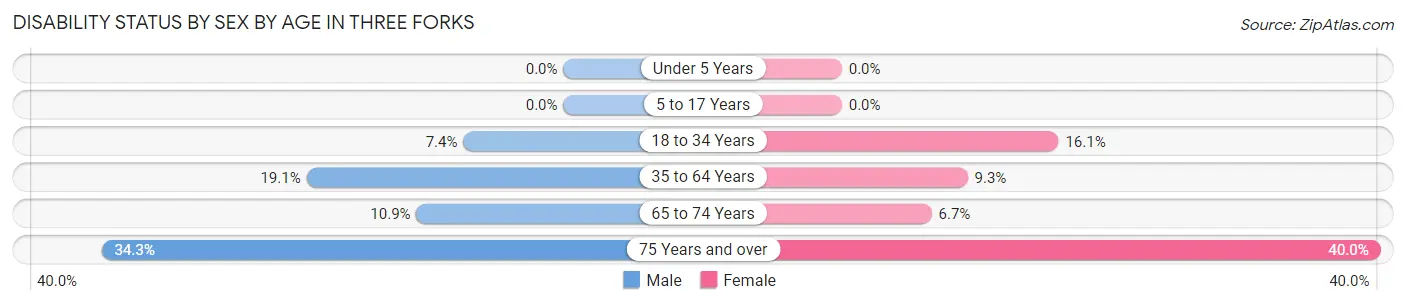
| Age Bracket | Male | Female |
| Under 5 Years | 0 (0.0%) | 0 (0.0%) |
| 5 to 17 Years | 0 (0.0%) | 0 (0.0%) |
| 18 to 34 Years | 13 (7.4%) | 28 (16.1%) |
| 35 to 64 Years | 70 (19.1%) | 38 (9.3%) |
| 65 to 74 Years | 12 (10.9%) | 10 (6.7%) |
| 75 Years and over | 24 (34.3%) | 8 (40.0%) |
Disability Class by Sex by Age in Three Forks
Disability Class: Hearing Difficulty
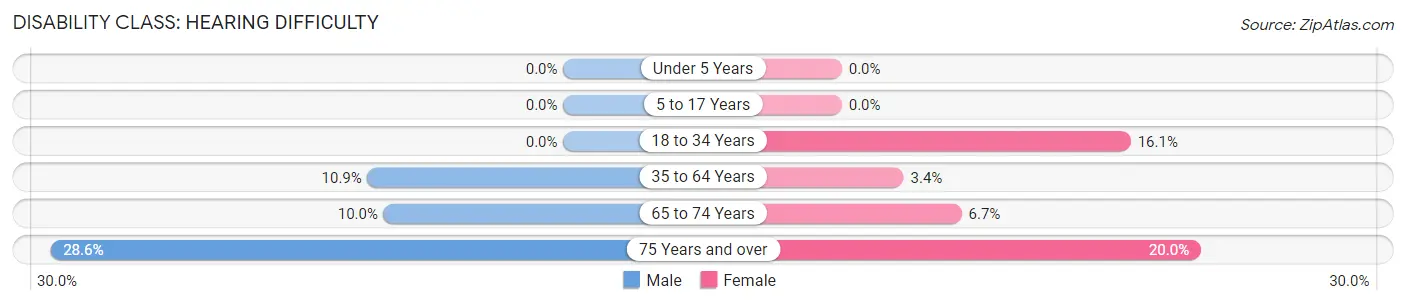
| Age Bracket | Male | Female |
| Under 5 Years | 0 (0.0%) | 0 (0.0%) |
| 5 to 17 Years | 0 (0.0%) | 0 (0.0%) |
| 18 to 34 Years | 0 (0.0%) | 28 (16.1%) |
| 35 to 64 Years | 40 (10.9%) | 14 (3.4%) |
| 65 to 74 Years | 11 (10.0%) | 10 (6.7%) |
| 75 Years and over | 20 (28.6%) | 4 (20.0%) |
Disability Class: Vision Difficulty
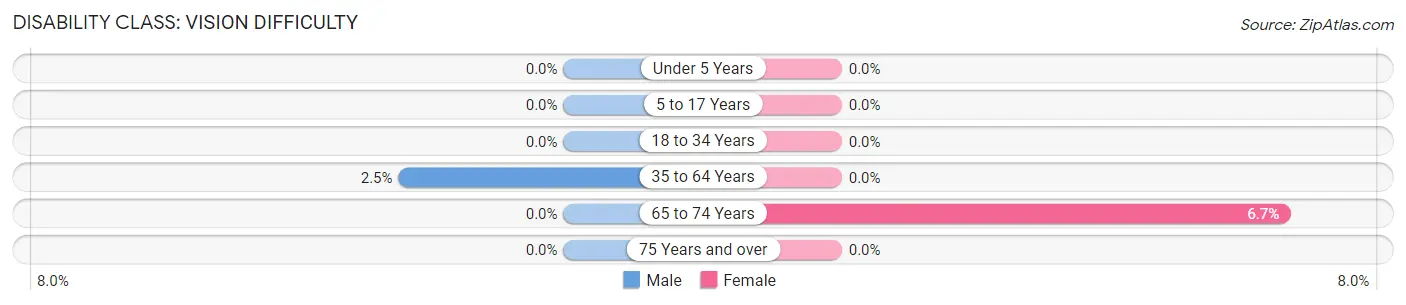
| Age Bracket | Male | Female |
| Under 5 Years | 0 (0.0%) | 0 (0.0%) |
| 5 to 17 Years | 0 (0.0%) | 0 (0.0%) |
| 18 to 34 Years | 0 (0.0%) | 0 (0.0%) |
| 35 to 64 Years | 9 (2.5%) | 0 (0.0%) |
| 65 to 74 Years | 0 (0.0%) | 10 (6.7%) |
| 75 Years and over | 0 (0.0%) | 0 (0.0%) |
Disability Class: Cognitive Difficulty
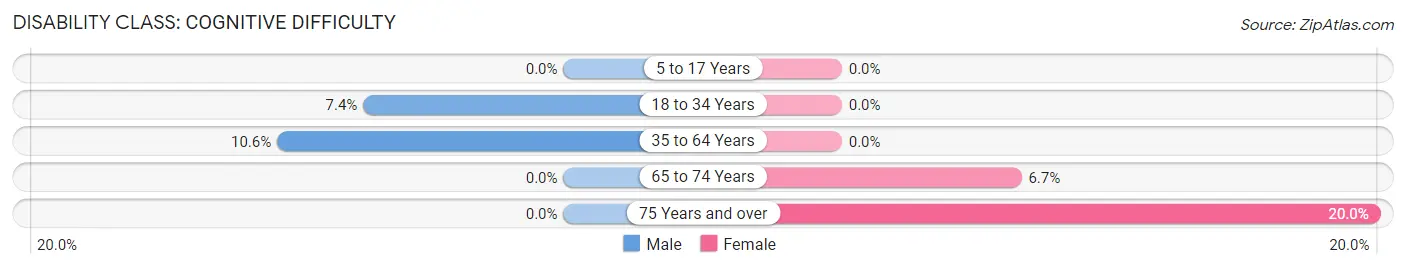
| Age Bracket | Male | Female |
| 5 to 17 Years | 0 (0.0%) | 0 (0.0%) |
| 18 to 34 Years | 13 (7.4%) | 0 (0.0%) |
| 35 to 64 Years | 39 (10.6%) | 0 (0.0%) |
| 65 to 74 Years | 0 (0.0%) | 10 (6.7%) |
| 75 Years and over | 0 (0.0%) | 4 (20.0%) |
Disability Class: Ambulatory Difficulty
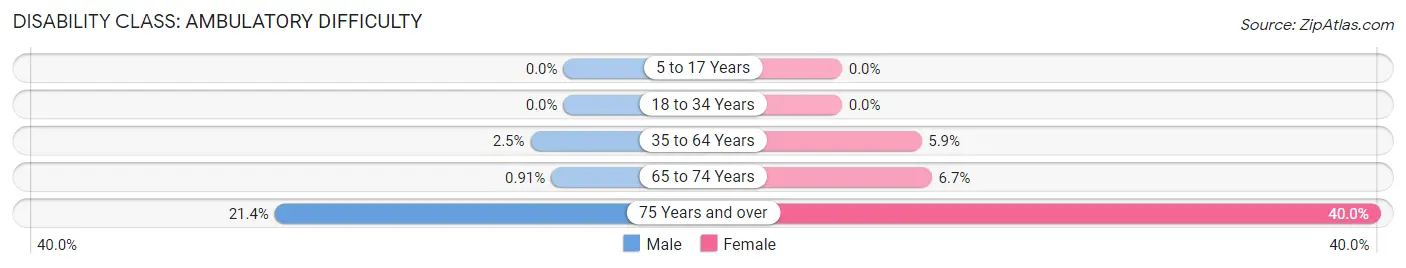
| Age Bracket | Male | Female |
| 5 to 17 Years | 0 (0.0%) | 0 (0.0%) |
| 18 to 34 Years | 0 (0.0%) | 0 (0.0%) |
| 35 to 64 Years | 9 (2.5%) | 24 (5.9%) |
| 65 to 74 Years | 1 (0.9%) | 10 (6.7%) |
| 75 Years and over | 15 (21.4%) | 8 (40.0%) |
Disability Class: Self-Care Difficulty
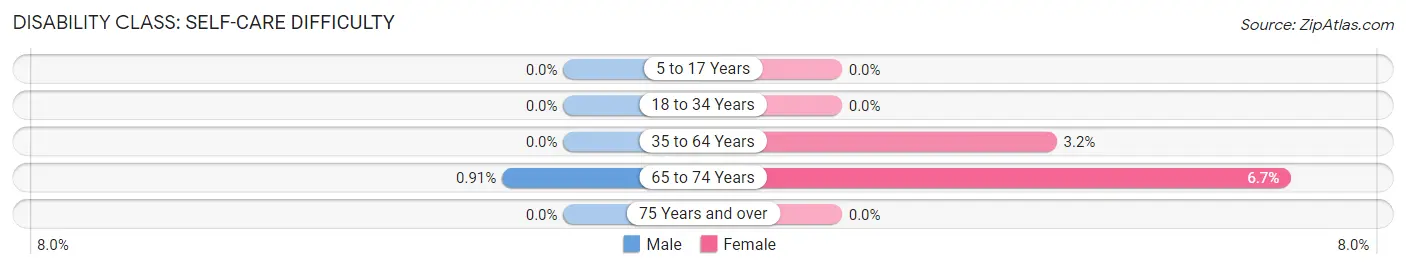
| Age Bracket | Male | Female |
| 5 to 17 Years | 0 (0.0%) | 0 (0.0%) |
| 18 to 34 Years | 0 (0.0%) | 0 (0.0%) |
| 35 to 64 Years | 0 (0.0%) | 13 (3.2%) |
| 65 to 74 Years | 1 (0.9%) | 10 (6.7%) |
| 75 Years and over | 0 (0.0%) | 0 (0.0%) |
Technology Access in Three Forks
Computing Device Access in Three Forks
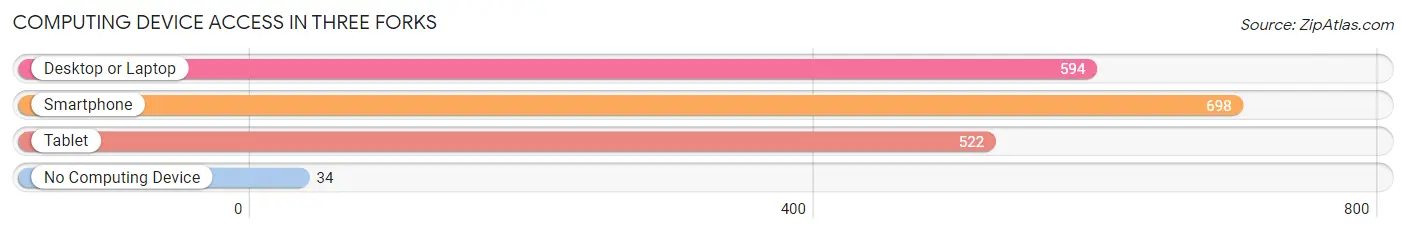
| Device Type | # Households | % Households |
| Desktop or Laptop | 594 | 76.6% |
| Smartphone | 698 | 90.1% |
| Tablet | 522 | 67.3% |
| No Computing Device | 34 | 4.4% |
| Total | 775 | 100.0% |
Internet Access in Three Forks
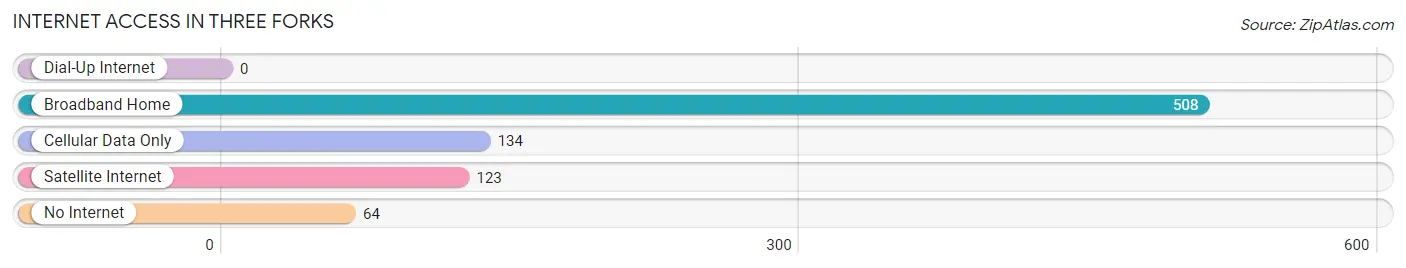
| Internet Type | # Households | % Households |
| Dial-Up Internet | 0 | 0.0% |
| Broadband Home | 508 | 65.5% |
| Cellular Data Only | 134 | 17.3% |
| Satellite Internet | 123 | 15.9% |
| No Internet | 64 | 8.3% |
| Total | 775 | 100.0% |
Three Forks Summary
Three Forks, Montana is a small town located in the southwestern part of the state, about an hour’s drive from the state capital of Helena. It is situated at the confluence of the Jefferson, Madison, and Gallatin Rivers, which form the headwaters of the Missouri River. The town has a population of about 1,800 people and is the county seat of Gallatin County.
History
The area around Three Forks has been inhabited for thousands of years by various Native American tribes, including the Shoshone, Blackfeet, and Crow. The first European settlers arrived in the area in the early 1800s, and the town was officially founded in 1864. It was named after the three rivers that converge there, and the town quickly became an important trading post and supply center for the surrounding area.
In the late 1800s, the town was a major stop on the stagecoach route between Helena and Bozeman. It was also a popular destination for gold prospectors, and the town’s population grew rapidly. By the early 1900s, Three Forks had become a bustling center of commerce and industry, with several stores, hotels, and saloons.
Geography
Three Forks is located in the southwestern part of Montana, about an hour’s drive from the state capital of Helena. It is situated at the confluence of the Jefferson, Madison, and Gallatin Rivers, which form the headwaters of the Missouri River. The town is surrounded by rolling hills and mountains, and is located in the heart of the Rocky Mountain Front.
The climate in Three Forks is generally mild, with hot summers and cold winters. The average annual temperature is around 45 degrees Fahrenheit, and the average annual precipitation is around 16 inches.
Economy
The economy of Three Forks is largely based on agriculture and tourism. The town is home to several farms and ranches, and the surrounding area is known for its excellent hunting and fishing. Tourism is also an important part of the local economy, with visitors coming to the area to enjoy the natural beauty and outdoor activities.
In addition, Three Forks is home to several small businesses, including restaurants, shops, and other services. The town is also home to a small manufacturing plant, which produces a variety of products.
Demographics
As of the 2010 census, the population of Three Forks was 1,876. The racial makeup of the town was 94.3% White, 0.3% African American, 0.7% Native American, 0.3% Asian, 0.1% Pacific Islander, and 4.3% from other races. The median household income was $37,917, and the median family income was $45,938. The per capita income was $19,945.
Conclusion
Three Forks, Montana is a small town located in the southwestern part of the state, about an hour’s drive from the state capital of Helena. It is situated at the confluence of the Jefferson, Madison, and Gallatin Rivers, which form the headwaters of the Missouri River. The town has a population of about 1,800 people and is the county seat of Gallatin County. The economy of Three Forks is largely based on agriculture and tourism, and the town is home to several small businesses. The racial makeup of the town is 94.3% White, 0.3% African American, 0.7% Native American, 0.3% Asian, 0.1% Pacific Islander, and 4.3% from other races. The median household income was $37,917, and the median family income was $45,938. The per capita income was $19,945.
Common Questions
What is Per Capita Income in Three Forks?
Per Capita income in Three Forks is $33,976.
What is the Median Family Income in Three Forks?
Median Family Income in Three Forks is $80,441.
What is the Median Household income in Three Forks?
Median Household Income in Three Forks is $77,674.
What is Income or Wage Gap in Three Forks?
Income or Wage Gap in Three Forks is 62.8%.
Women in Three Forks earn 37.2 cents for every dollar earned by a man.
What is Inequality or Gini Index in Three Forks?
Inequality or Gini Index in Three Forks is 0.35.
What is the Total Population of Three Forks?
Total Population of Three Forks is 1,895.
What is the Total Male Population of Three Forks?
Total Male Population of Three Forks is 943.
What is the Total Female Population of Three Forks?
Total Female Population of Three Forks is 952.
What is the Ratio of Males per 100 Females in Three Forks?
There are 99.05 Males per 100 Females in Three Forks.
What is the Ratio of Females per 100 Males in Three Forks?
There are 100.95 Females per 100 Males in Three Forks.
What is the Median Population Age in Three Forks?
Median Population Age in Three Forks is 43.6 Years.
What is the Average Family Size in Three Forks
Average Family Size in Three Forks is 3.0 People.
What is the Average Household Size in Three Forks
Average Household Size in Three Forks is 2.4 People.
How Large is the Labor Force in Three Forks?
There are 1,074 People in the Labor Forcein in Three Forks.
What is the Percentage of People in the Labor Force in Three Forks?
69.0% of People are in the Labor Force in Three Forks.
What is the Unemployment Rate in Three Forks?
Unemployment Rate in Three Forks is 1.4%.