Park City, MT
Park City Map
Park City Overview
1,022
TOTAL POPULATION
474
MALE POPULATION
548
FEMALE POPULATION
86.50
MALES / 100 FEMALES
115.61
FEMALES / 100 MALES
32.6
MEDIAN AGE
2.9
AVG FAMILY SIZE
2.6
AVG HOUSEHOLD SIZE
$28,342
PER CAPITA INCOME
$79,122
AVG FAMILY INCOME
$61,875
AVG HOUSEHOLD INCOME
18.4%
WAGE / INCOME GAP [ % ]
81.6¢/ $1
WAGE / INCOME GAP [ $ ]
0.33
INEQUALITY / GINI INDEX
507
LABOR FORCE [ PEOPLE ]
66.8%
PERCENT IN LABOR FORCE
2.2%
UNEMPLOYMENT RATE
Park City Zip Codes
Park City Area Codes
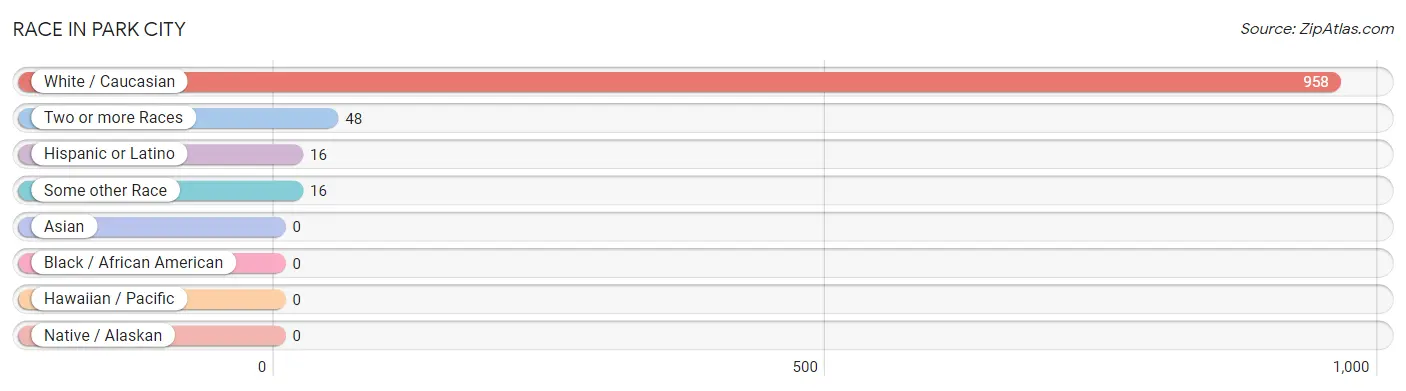
Race in Park City
The most populous races in Park City are White / Caucasian (958 | 93.7%), Two or more Races (48 | 4.7%), and Hispanic or Latino (16 | 1.6%).
| Race | # Population | % Population |
| Asian | 0 | 0.0% |
| Black / African American | 0 | 0.0% |
| Hawaiian / Pacific | 0 | 0.0% |
| Hispanic or Latino | 16 | 1.6% |
| Native / Alaskan | 0 | 0.0% |
| White / Caucasian | 958 | 93.7% |
| Two or more Races | 48 | 4.7% |
| Some other Race | 16 | 1.6% |
| Total | 1,022 | 100.0% |
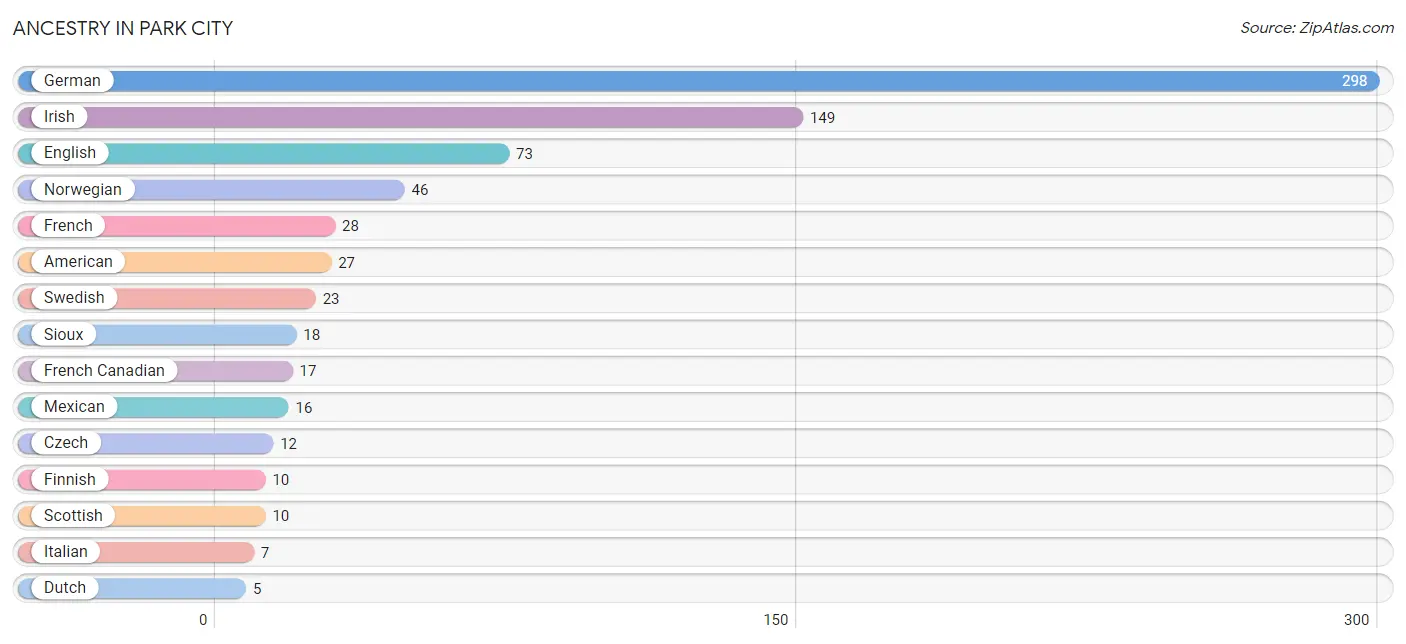
Ancestry in Park City
The most populous ancestries reported in Park City are German (298 | 29.2%), Irish (149 | 14.6%), English (73 | 7.1%), Norwegian (46 | 4.5%), and French (28 | 2.7%), together accounting for 58.1% of all Park City residents.
| Ancestry | # Population | % Population |
| American | 27 | 2.6% |
| Czech | 12 | 1.2% |
| Dutch | 5 | 0.5% |
| English | 73 | 7.1% |
| Finnish | 10 | 1.0% |
| French | 28 | 2.7% |
| French Canadian | 17 | 1.7% |
| German | 298 | 29.2% |
| Irish | 149 | 14.6% |
| Italian | 7 | 0.7% |
| Mexican | 16 | 1.6% |
| Norwegian | 46 | 4.5% |
| Polish | 5 | 0.5% |
| Scotch-Irish | 4 | 0.4% |
| Scottish | 10 | 1.0% |
| Sioux | 18 | 1.8% |
| Swedish | 23 | 2.2% |
| Swiss | 5 | 0.5% | View All 18 Rows |
Immigrants in Park City

| Immigration Origin | # Population | % Population | View All 0 Rows |
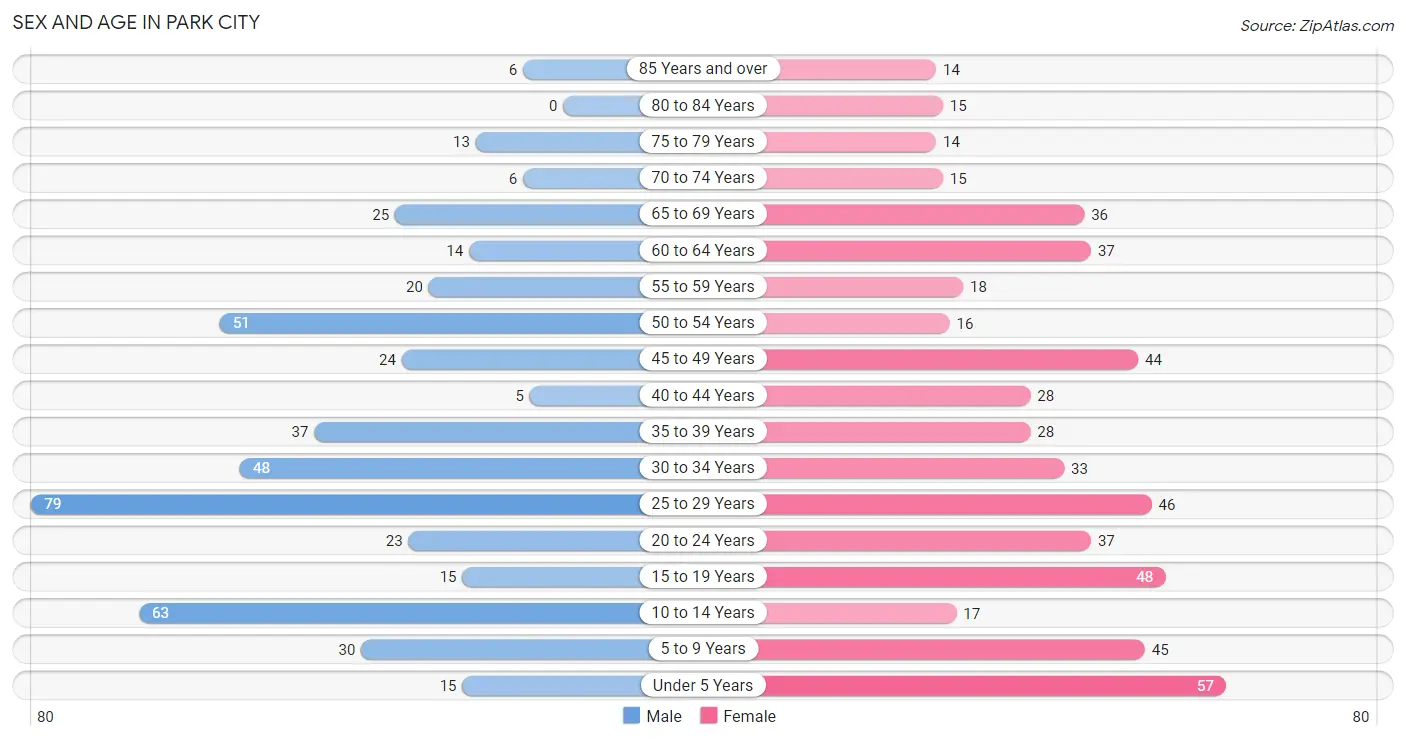
Sex and Age in Park City
Sex and Age in Park City
The most populous age groups in Park City are 25 to 29 Years (79 | 16.7%) for men and Under 5 Years (57 | 10.4%) for women.
| Age Bracket | Male | Female |
| Under 5 Years | 15 (3.2%) | 57 (10.4%) |
| 5 to 9 Years | 30 (6.3%) | 45 (8.2%) |
| 10 to 14 Years | 63 (13.3%) | 17 (3.1%) |
| 15 to 19 Years | 15 (3.2%) | 48 (8.8%) |
| 20 to 24 Years | 23 (4.9%) | 37 (6.8%) |
| 25 to 29 Years | 79 (16.7%) | 46 (8.4%) |
| 30 to 34 Years | 48 (10.1%) | 33 (6.0%) |
| 35 to 39 Years | 37 (7.8%) | 28 (5.1%) |
| 40 to 44 Years | 5 (1.1%) | 28 (5.1%) |
| 45 to 49 Years | 24 (5.1%) | 44 (8.0%) |
| 50 to 54 Years | 51 (10.8%) | 16 (2.9%) |
| 55 to 59 Years | 20 (4.2%) | 18 (3.3%) |
| 60 to 64 Years | 14 (2.9%) | 37 (6.8%) |
| 65 to 69 Years | 25 (5.3%) | 36 (6.6%) |
| 70 to 74 Years | 6 (1.3%) | 15 (2.7%) |
| 75 to 79 Years | 13 (2.7%) | 14 (2.5%) |
| 80 to 84 Years | 0 (0.0%) | 15 (2.7%) |
| 85 Years and over | 6 (1.3%) | 14 (2.5%) |
| Total | 474 (100.0%) | 548 (100.0%) |
Families and Households in Park City
Median Family Size in Park City
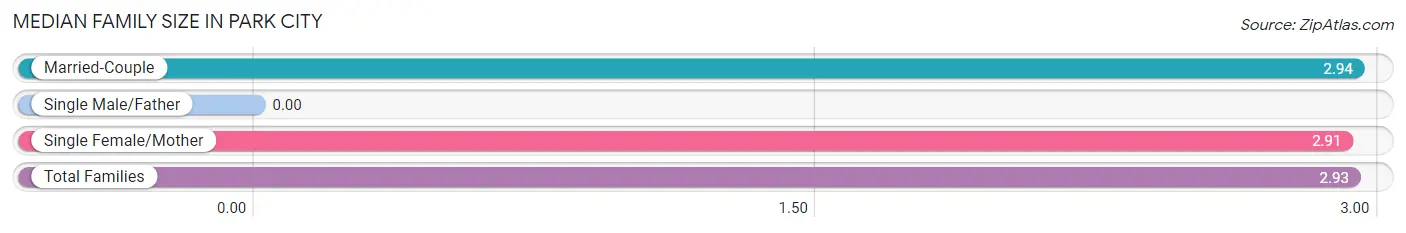
| Family Type | # Families | Family Size |
| Married-Couple | 241 (82.0%) | 2.94 |
| Single Male/Father | 0 (0.0%) | - |
| Single Female/Mother | 53 (18.0%) | 2.91 |
| Total Families | 294 (100.0%) | 2.93 |
Median Household Size in Park City
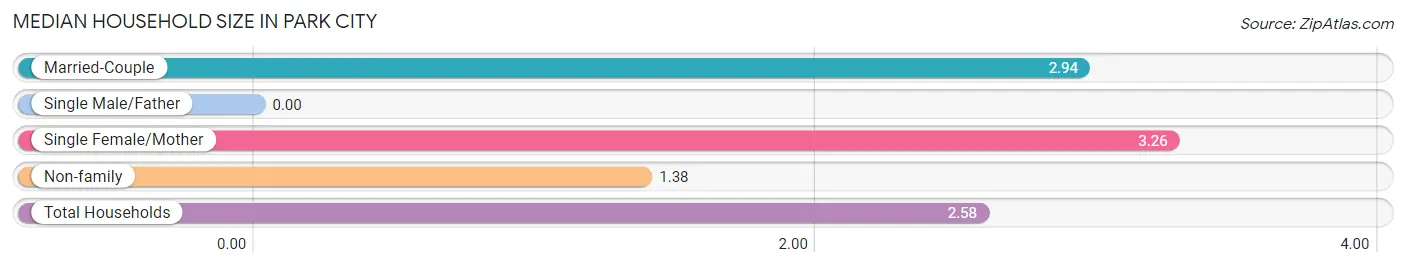
| Household Type | # Households | Household Size |
| Married-Couple | 241 (60.9%) | 2.94 |
| Single Male/Father | 0 (0.0%) | - |
| Single Female/Mother | 53 (13.4%) | 3.26 |
| Non-family | 102 (25.8%) | 1.38 |
| Total Households | 396 (100.0%) | 2.58 |
Household Size by Marriage Status in Park City
Out of a total of 396 households in Park City, 294 (74.2%) are family households, while 102 (25.8%) are nonfamily households. The most numerous type of family households are 2-person households, comprising 129, and the most common type of nonfamily households are 1-person households, comprising 73.
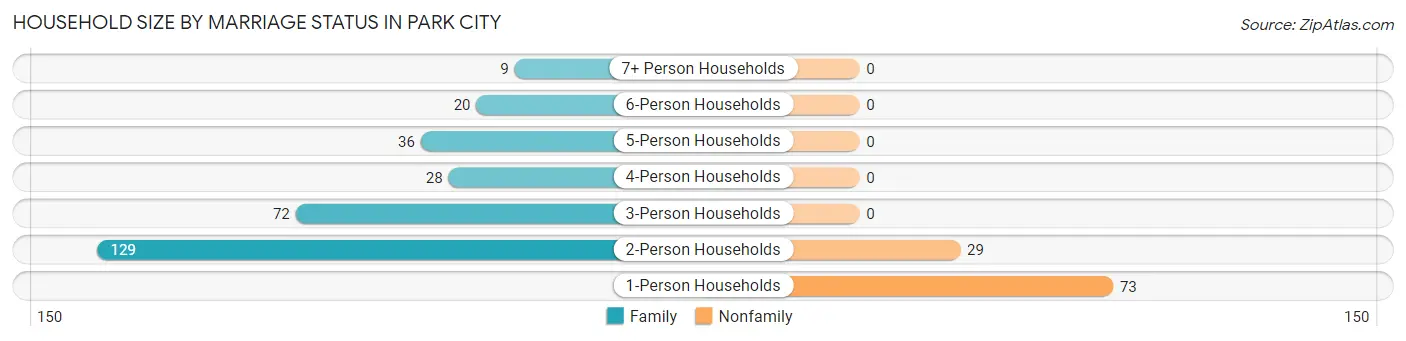
| Household Size | Family Households | Nonfamily Households |
| 1-Person Households | - | 73 (18.4%) |
| 2-Person Households | 129 (32.6%) | 29 (7.3%) |
| 3-Person Households | 72 (18.2%) | 0 (0.0%) |
| 4-Person Households | 28 (7.1%) | 0 (0.0%) |
| 5-Person Households | 36 (9.1%) | 0 (0.0%) |
| 6-Person Households | 20 (5.1%) | 0 (0.0%) |
| 7+ Person Households | 9 (2.3%) | 0 (0.0%) |
| Total | 294 (74.2%) | 102 (25.8%) |
Female Fertility in Park City
Fertility by Age in Park City
Average fertility rate in Park City is 32.0 births per 1,000 women. Women in the age bracket of 20 to 34 years have the highest fertility rate with 52.0 births per 1,000 women. Women in the age bracket of 20 to 34 years acount for 66.7% of all women with births.
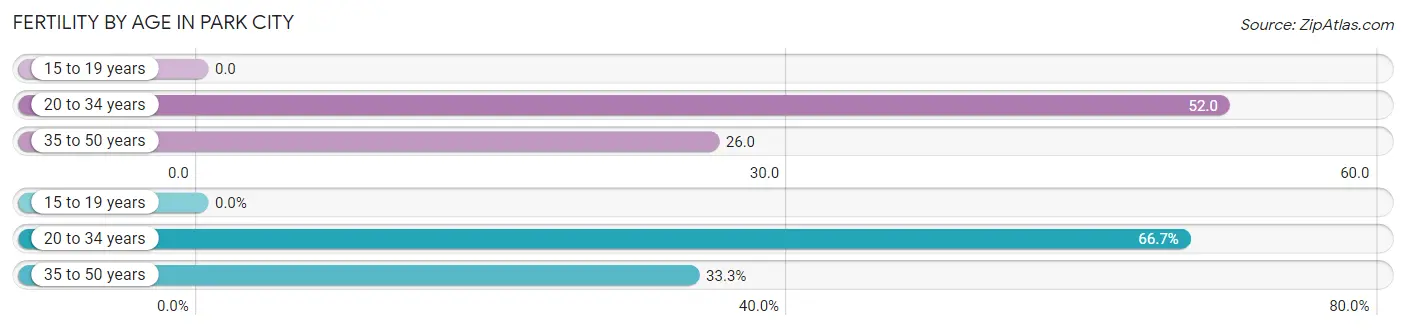
| Age Bracket | Women with Births | Births / 1,000 Women |
| 15 to 19 years | 0 (0.0%) | 0.0 |
| 20 to 34 years | 6 (66.7%) | 52.0 |
| 35 to 50 years | 3 (33.3%) | 26.0 |
| Total | 9 (100.0%) | 32.0 |
Fertility by Age by Marriage Status in Park City
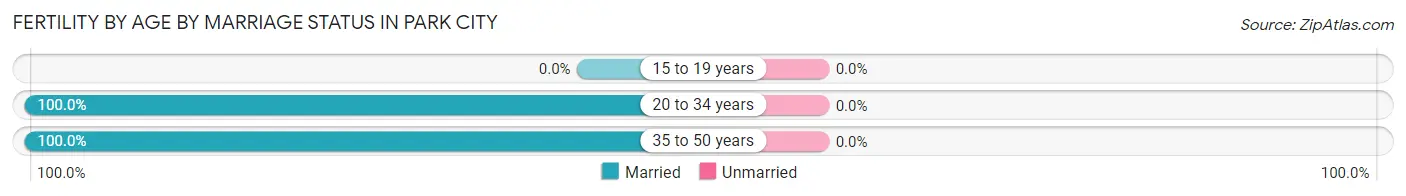
| Age Bracket | Married | Unmarried |
| 15 to 19 years | 0 (0.0%) | 0 (0.0%) |
| 20 to 34 years | 6 (100.0%) | 0 (0.0%) |
| 35 to 50 years | 3 (100.0%) | 0 (0.0%) |
| Total | 9 (100.0%) | 0 (0.0%) |
Fertility by Education in Park City
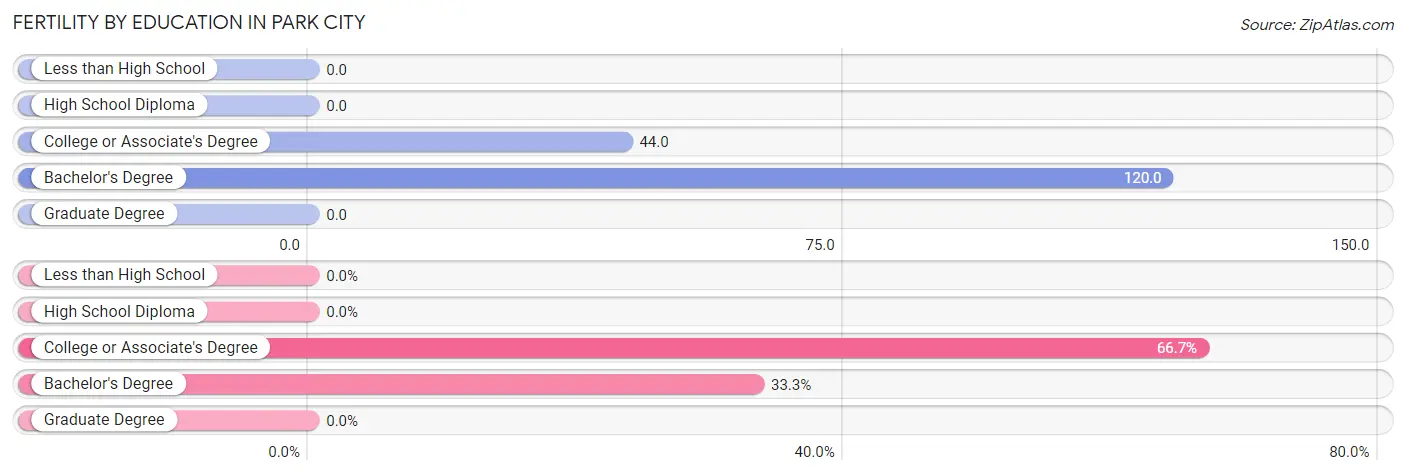
| Educational Attainment | Women with Births | Births / 1,000 Women |
| Less than High School | 0 (0.0%) | 0.0 |
| High School Diploma | 0 (0.0%) | 0.0 |
| College or Associate's Degree | 6 (66.7%) | 44.0 |
| Bachelor's Degree | 3 (33.3%) | 120.0 |
| Graduate Degree | 0 (0.0%) | 0.0 |
| Total | 9 (100.0%) | 32.0 |
Fertility by Education by Marriage Status in Park City
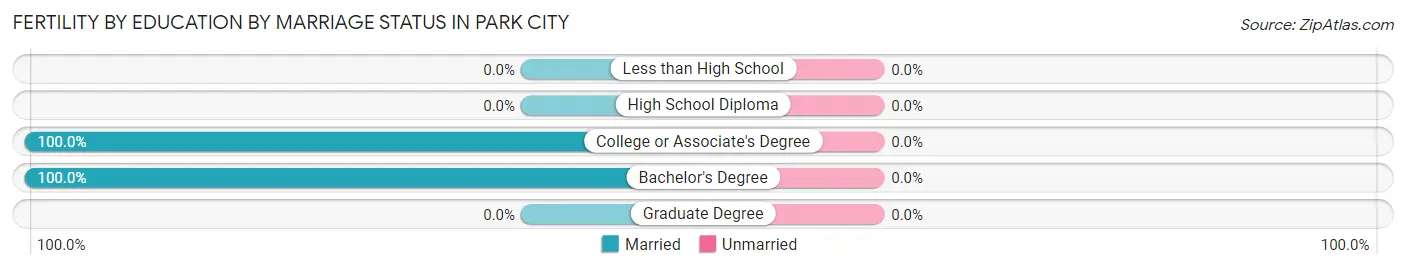
| Educational Attainment | Married | Unmarried |
| Less than High School | 0 (0.0%) | 0 (0.0%) |
| High School Diploma | 0 (0.0%) | 0 (0.0%) |
| College or Associate's Degree | 6 (100.0%) | 0 (0.0%) |
| Bachelor's Degree | 3 (100.0%) | 0 (0.0%) |
| Graduate Degree | 0 (0.0%) | 0 (0.0%) |
| Total | 9 (100.0%) | 0 (0.0%) |
Income in Park City
Income Overview in Park City
Per Capita Income in Park City is $28,342, while median incomes of families and households are $79,122 and $61,875 respectively.
| Characteristic | Number | Measure |
| Per Capita Income | 1,022 | $28,342 |
| Median Family Income | 294 | $79,122 |
| Mean Family Income | 294 | $84,028 |
| Median Household Income | 396 | $61,875 |
| Mean Household Income | 396 | $72,051 |
| Income Deficit | 294 | $0 |
| Wage / Income Gap (%) | 1,022 | 18.37% |
| Wage / Income Gap ($) | 1,022 | 81.63¢ per $1 |
| Gini / Inequality Index | 1,022 | 0.33 |
Earnings by Sex in Park City
Average Earnings in Park City are $34,353, $38,281 for men and $31,250 for women, a difference of 18.4%.
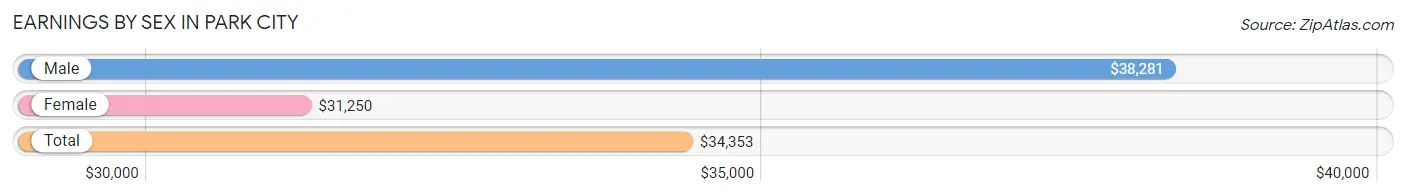
| Sex | Number | Average Earnings |
| Male | 309 (55.7%) | $38,281 |
| Female | 246 (44.3%) | $31,250 |
| Total | 555 (100.0%) | $34,353 |
Earnings by Sex by Income Bracket in Park City
The most common earnings brackets in Park City are $75,000 to $99,999 for men (53 | 17.2%) and $30,000 to $34,999 for women (42 | 17.1%).
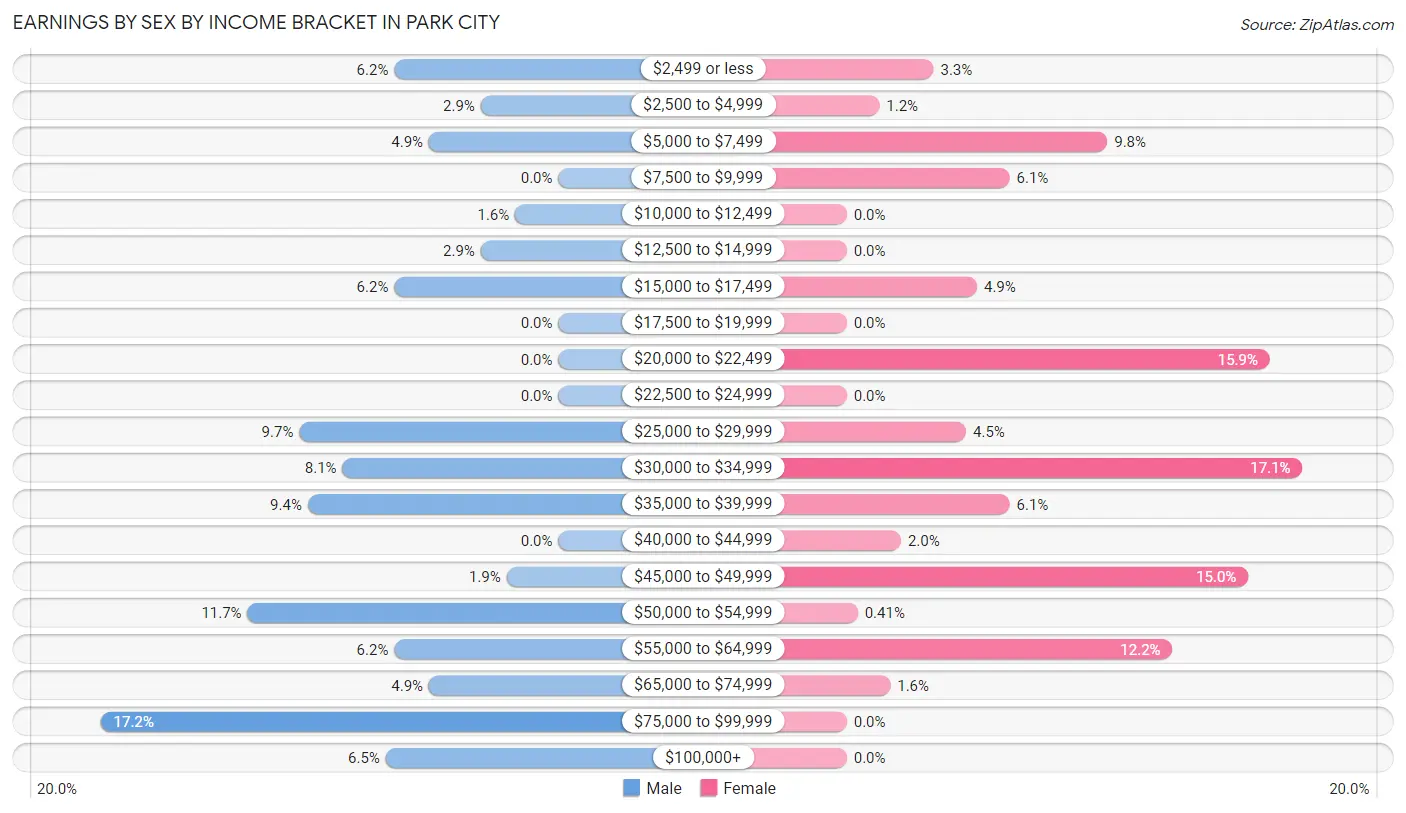
| Income | Male | Female |
| $2,499 or less | 19 (6.1%) | 8 (3.3%) |
| $2,500 to $4,999 | 9 (2.9%) | 3 (1.2%) |
| $5,000 to $7,499 | 15 (4.9%) | 24 (9.8%) |
| $7,500 to $9,999 | 0 (0.0%) | 15 (6.1%) |
| $10,000 to $12,499 | 5 (1.6%) | 0 (0.0%) |
| $12,500 to $14,999 | 9 (2.9%) | 0 (0.0%) |
| $15,000 to $17,499 | 19 (6.1%) | 12 (4.9%) |
| $17,500 to $19,999 | 0 (0.0%) | 0 (0.0%) |
| $20,000 to $22,499 | 0 (0.0%) | 39 (15.9%) |
| $22,500 to $24,999 | 0 (0.0%) | 0 (0.0%) |
| $25,000 to $29,999 | 30 (9.7%) | 11 (4.5%) |
| $30,000 to $34,999 | 25 (8.1%) | 42 (17.1%) |
| $35,000 to $39,999 | 29 (9.4%) | 15 (6.1%) |
| $40,000 to $44,999 | 0 (0.0%) | 5 (2.0%) |
| $45,000 to $49,999 | 6 (1.9%) | 37 (15.0%) |
| $50,000 to $54,999 | 36 (11.7%) | 1 (0.4%) |
| $55,000 to $64,999 | 19 (6.1%) | 30 (12.2%) |
| $65,000 to $74,999 | 15 (4.9%) | 4 (1.6%) |
| $75,000 to $99,999 | 53 (17.2%) | 0 (0.0%) |
| $100,000+ | 20 (6.5%) | 0 (0.0%) |
| Total | 309 (100.0%) | 246 (100.0%) |
Earnings by Sex by Educational Attainment in Park City
Average earnings in Park City are $50,035 for men and $32,778 for women, a difference of 34.5%. Men with an educational attainment of college or associate's degree enjoy the highest average annual earnings of $78,188, while those with bachelor's degree education earn the least with $28,281. Women with an educational attainment of college or associate's degree earn the most with the average annual earnings of $46,500, while those with high school diploma education have the smallest earnings of $20,875.
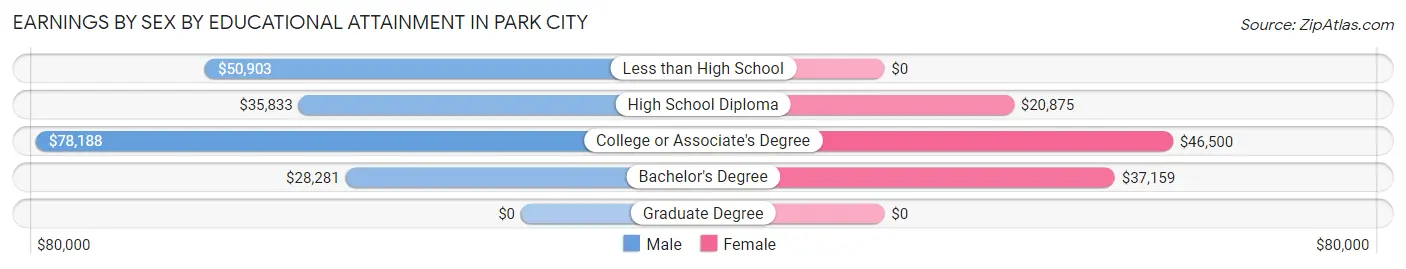
| Educational Attainment | Male Income | Female Income |
| Less than High School | $50,903 | $0 |
| High School Diploma | $35,833 | $20,875 |
| College or Associate's Degree | $78,188 | $46,500 |
| Bachelor's Degree | $28,281 | $37,159 |
| Graduate Degree | - | - |
| Total | $50,035 | $32,778 |
Family Income in Park City
Family Income Brackets in Park City
According to the Park City family income data, there are 82 families falling into the $100,000 to $149,999 income range, which is the most common income bracket and makes up 27.9% of all families.
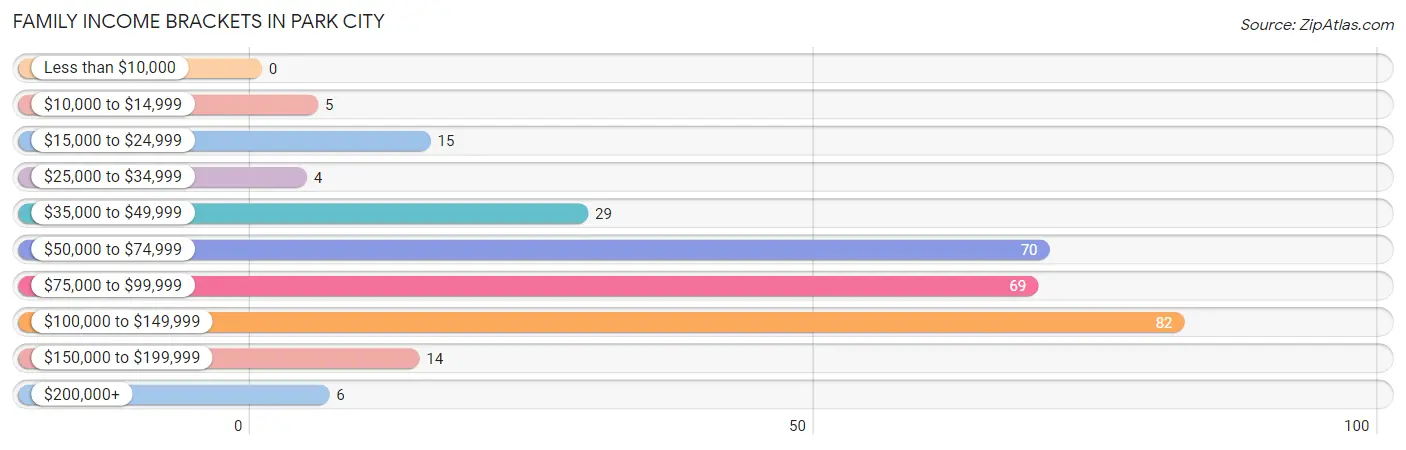
| Income Bracket | # Families | % Families |
| Less than $10,000 | 0 | 0.0% |
| $10,000 to $14,999 | 5 | 1.7% |
| $15,000 to $24,999 | 15 | 5.1% |
| $25,000 to $34,999 | 4 | 1.4% |
| $35,000 to $49,999 | 29 | 9.9% |
| $50,000 to $74,999 | 70 | 23.8% |
| $75,000 to $99,999 | 69 | 23.5% |
| $100,000 to $149,999 | 82 | 27.9% |
| $150,000 to $199,999 | 14 | 4.8% |
| $200,000+ | 6 | 2.0% |
Family Income by Famaliy Size in Park City
3-person families (57 | 19.4%) account for the highest median family income in Park City with $86,518 per family, while 2-person families (144 | 49.0%) have the highest median income of $42,500 per family member.
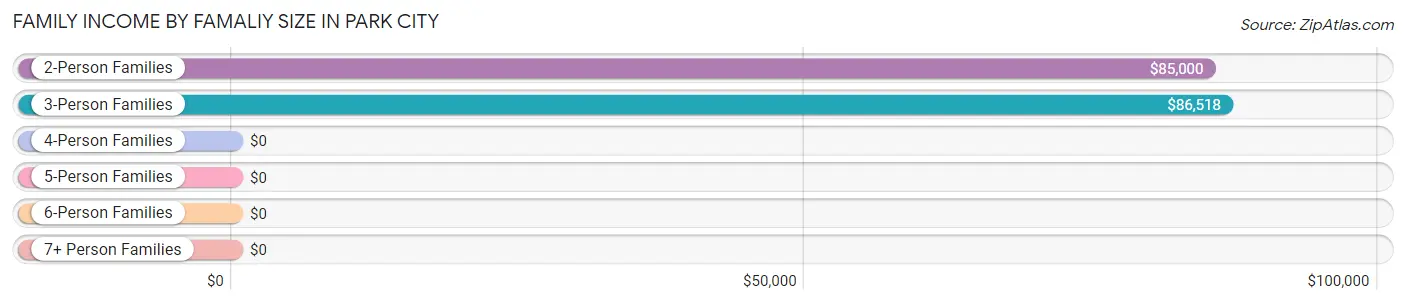
| Income Bracket | # Families | Median Income |
| 2-Person Families | 144 (49.0%) | $85,000 |
| 3-Person Families | 57 (19.4%) | $86,518 |
| 4-Person Families | 28 (9.5%) | $0 |
| 5-Person Families | 36 (12.2%) | $0 |
| 6-Person Families | 20 (6.8%) | $0 |
| 7+ Person Families | 9 (3.1%) | $0 |
| Total | 294 (100.0%) | $79,122 |
Family Income by Number of Earners in Park City
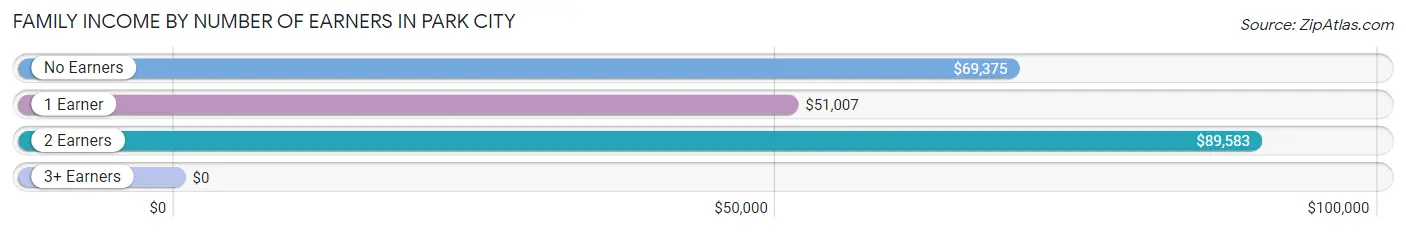
| Number of Earners | # Families | Median Income |
| No Earners | 25 (8.5%) | $69,375 |
| 1 Earner | 107 (36.4%) | $51,007 |
| 2 Earners | 144 (49.0%) | $89,583 |
| 3+ Earners | 18 (6.1%) | $0 |
| Total | 294 (100.0%) | $79,122 |
Household Income in Park City
Household Income Brackets in Park City
With 87 households falling in the category, the $50,000 to $74,999 income range is the most frequent in Park City, accounting for 22.0% of all households. In contrast, only 5 households (1.3%) fall into the $10,000 to $14,999 income bracket, making it the least populous group.
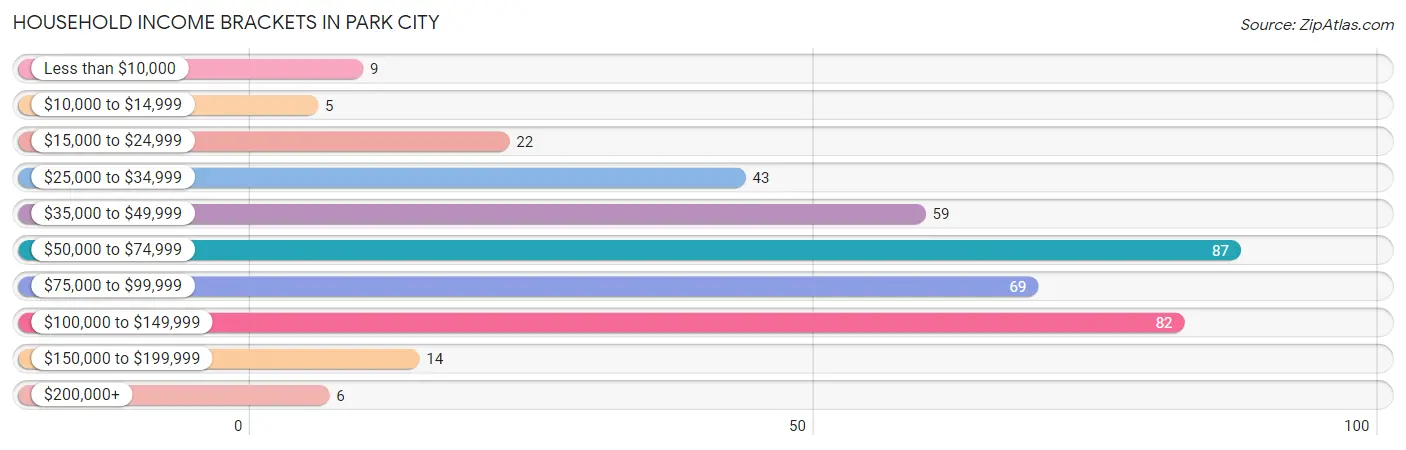
| Income Bracket | # Households | % Households |
| Less than $10,000 | 9 | 2.3% |
| $10,000 to $14,999 | 5 | 1.3% |
| $15,000 to $24,999 | 22 | 5.6% |
| $25,000 to $34,999 | 43 | 10.9% |
| $35,000 to $49,999 | 59 | 14.9% |
| $50,000 to $74,999 | 87 | 22.0% |
| $75,000 to $99,999 | 69 | 17.4% |
| $100,000 to $149,999 | 82 | 20.7% |
| $150,000 to $199,999 | 14 | 3.5% |
| $200,000+ | 6 | 1.5% |
Household Income by Householder Age in Park City
The median household income in Park City is $61,875, with the highest median household income of $95,750 found in the 45 to 64 years age bracket for the primary householder. A total of 137 households (34.6%) fall into this category. Meanwhile, the 65+ years age bracket for the primary householder has the lowest median household income of $45,469, with 93 households (23.5%) in this group.
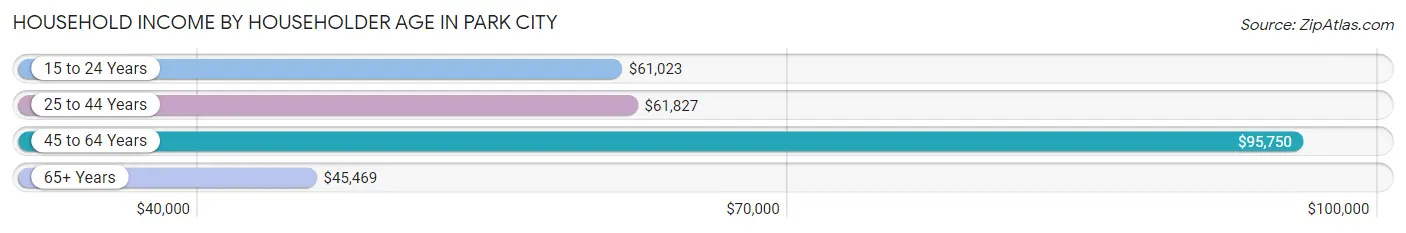
| Income Bracket | # Households | Median Income |
| 15 to 24 Years | 27 (6.8%) | $61,023 |
| 25 to 44 Years | 139 (35.1%) | $61,827 |
| 45 to 64 Years | 137 (34.6%) | $95,750 |
| 65+ Years | 93 (23.5%) | $45,469 |
| Total | 396 (100.0%) | $61,875 |
Poverty in Park City
Income Below Poverty by Sex and Age in Park City
With 5.1% poverty level for males and 4.6% for females among the residents of Park City, 65 to 74 year old males and 45 to 54 year old females are the most vulnerable to poverty, with 4 males (12.9%) and 15 females (25.0%) in their respective age groups living below the poverty level.
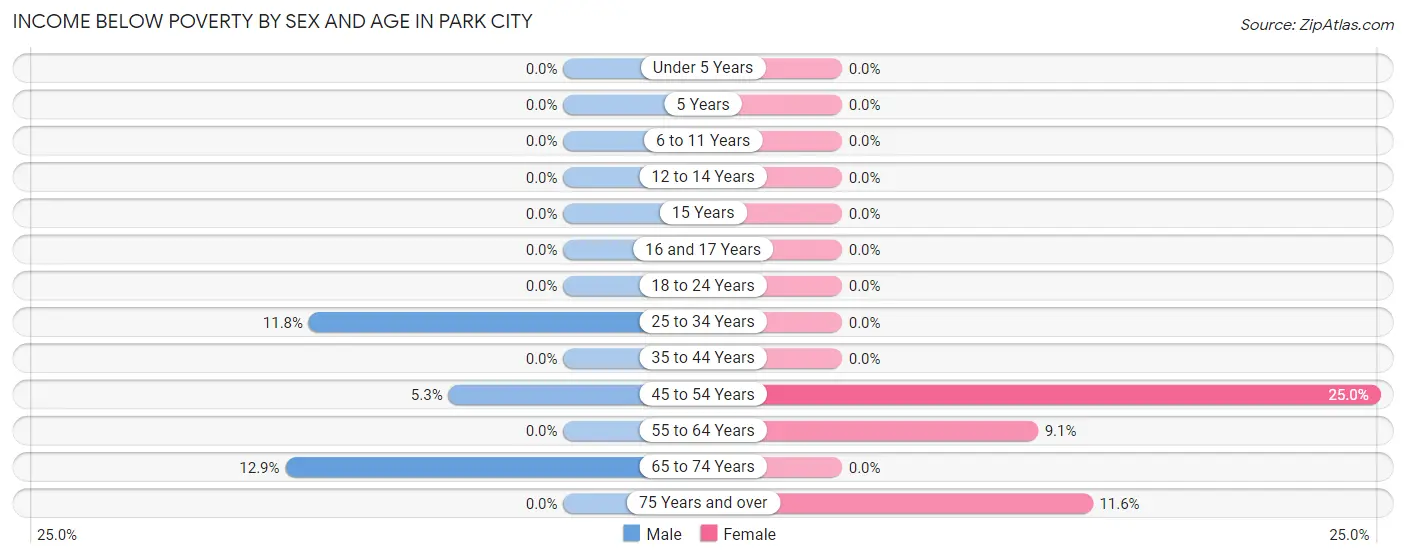
| Age Bracket | Male | Female |
| Under 5 Years | 0 (0.0%) | 0 (0.0%) |
| 5 Years | 0 (0.0%) | 0 (0.0%) |
| 6 to 11 Years | 0 (0.0%) | 0 (0.0%) |
| 12 to 14 Years | 0 (0.0%) | 0 (0.0%) |
| 15 Years | 0 (0.0%) | 0 (0.0%) |
| 16 and 17 Years | 0 (0.0%) | 0 (0.0%) |
| 18 to 24 Years | 0 (0.0%) | 0 (0.0%) |
| 25 to 34 Years | 15 (11.8%) | 0 (0.0%) |
| 35 to 44 Years | 0 (0.0%) | 0 (0.0%) |
| 45 to 54 Years | 4 (5.3%) | 15 (25.0%) |
| 55 to 64 Years | 0 (0.0%) | 5 (9.1%) |
| 65 to 74 Years | 4 (12.9%) | 0 (0.0%) |
| 75 Years and over | 0 (0.0%) | 5 (11.6%) |
| Total | 23 (5.1%) | 25 (4.6%) |
Income Above Poverty by Sex and Age in Park City
According to the poverty statistics in Park City, males aged under 5 years and females aged under 5 years are the age groups that are most secure financially, with 100.0% of males and 100.0% of females in these age groups living above the poverty line.
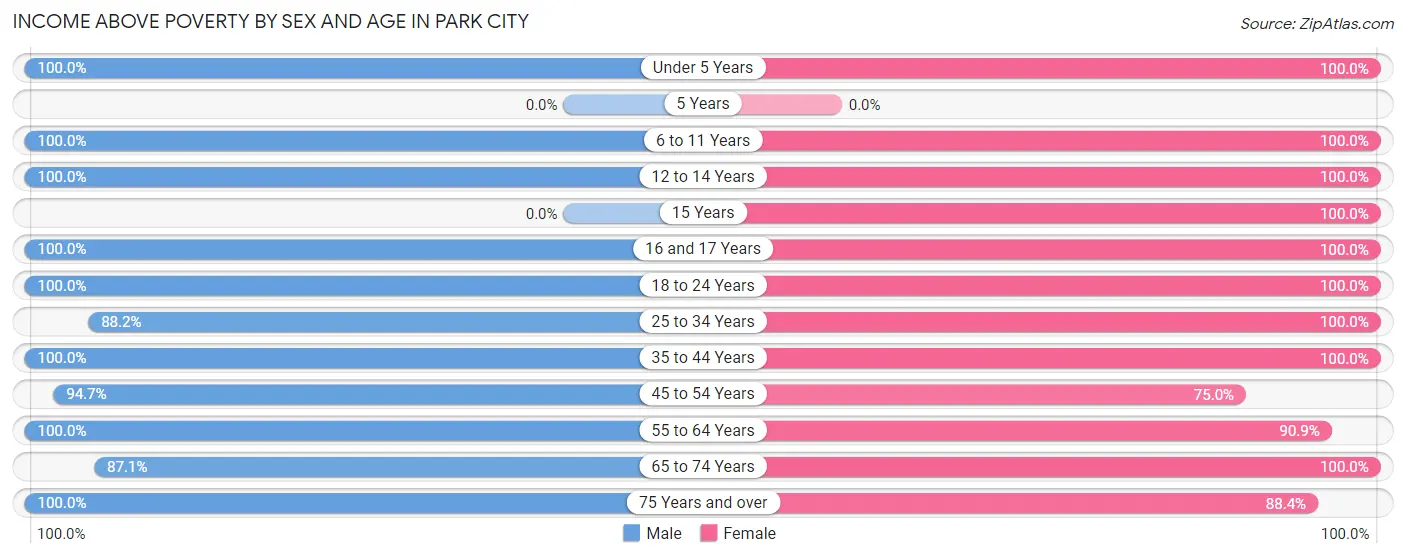
| Age Bracket | Male | Female |
| Under 5 Years | 15 (100.0%) | 57 (100.0%) |
| 5 Years | 0 (0.0%) | 0 (0.0%) |
| 6 to 11 Years | 30 (100.0%) | 45 (100.0%) |
| 12 to 14 Years | 40 (100.0%) | 17 (100.0%) |
| 15 Years | 0 (0.0%) | 36 (100.0%) |
| 16 and 17 Years | 15 (100.0%) | 3 (100.0%) |
| 18 to 24 Years | 23 (100.0%) | 46 (100.0%) |
| 25 to 34 Years | 112 (88.2%) | 79 (100.0%) |
| 35 to 44 Years | 42 (100.0%) | 56 (100.0%) |
| 45 to 54 Years | 71 (94.7%) | 45 (75.0%) |
| 55 to 64 Years | 34 (100.0%) | 50 (90.9%) |
| 65 to 74 Years | 27 (87.1%) | 51 (100.0%) |
| 75 Years and over | 19 (100.0%) | 38 (88.4%) |
| Total | 428 (94.9%) | 523 (95.4%) |
Income Below Poverty Among Married-Couple Families in Park City
The poverty statistics for married-couple families in Park City show that 2.1% or 5 of the total 241 families live below the poverty line. Families with no children have the highest poverty rate of 3.6%, comprising of 5 families. On the other hand, families with 1 or 2 children have the lowest poverty rate of 0.0%, which includes 0 families.
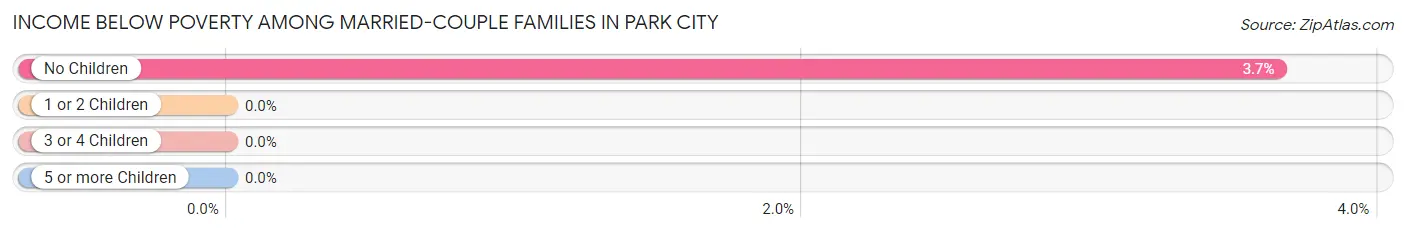
| Children | Above Poverty | Below Poverty |
| No Children | 132 (96.4%) | 5 (3.6%) |
| 1 or 2 Children | 39 (100.0%) | 0 (0.0%) |
| 3 or 4 Children | 65 (100.0%) | 0 (0.0%) |
| 5 or more Children | 0 (0.0%) | 0 (0.0%) |
| Total | 236 (97.9%) | 5 (2.1%) |
Income Below Poverty Among Single-Parent Households in Park City
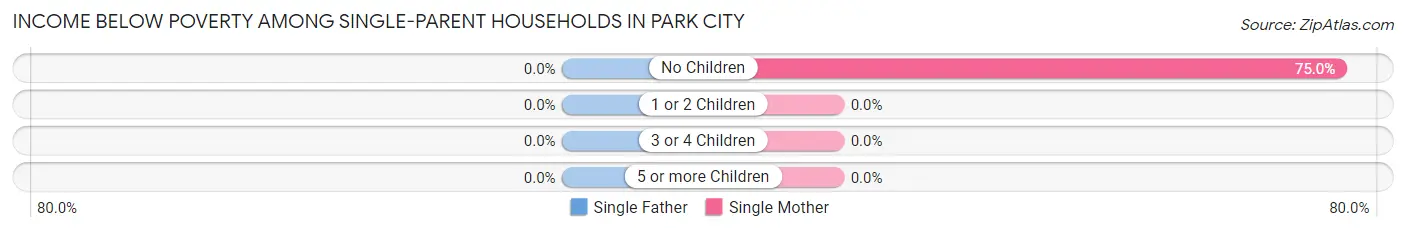
| Children | Single Father | Single Mother |
| No Children | 0 (0.0%) | 15 (75.0%) |
| 1 or 2 Children | 0 (0.0%) | 0 (0.0%) |
| 3 or 4 Children | 0 (0.0%) | 0 (0.0%) |
| 5 or more Children | 0 (0.0%) | 0 (0.0%) |
| Total | 0 (0.0%) | 15 (28.3%) |
Income Below Poverty Among Married-Couple vs Single-Parent Households in Park City
The poverty data for Park City shows that 5 of the married-couple family households (2.1%) and 15 of the single-parent households (28.3%) are living below the poverty level. Within the married-couple family households, those with no children have the highest poverty rate, with 5 households (3.6%) falling below the poverty line. Among the single-parent households, those with no children have the highest poverty rate, with 15 household (75.0%) living below poverty.
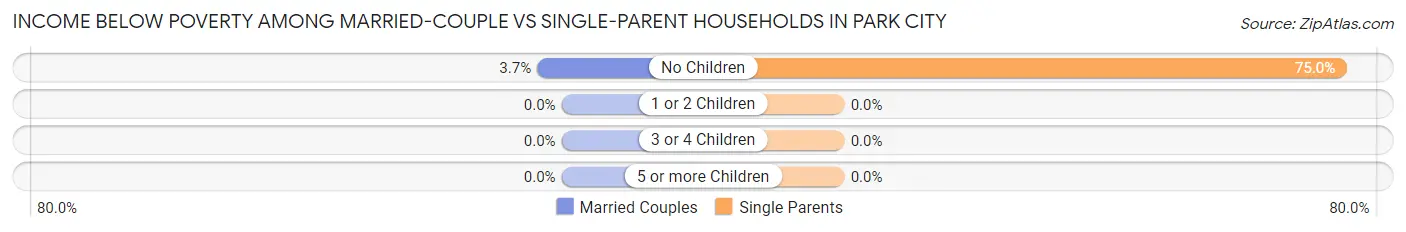
| Children | Married-Couple Families | Single-Parent Households |
| No Children | 5 (3.6%) | 15 (75.0%) |
| 1 or 2 Children | 0 (0.0%) | 0 (0.0%) |
| 3 or 4 Children | 0 (0.0%) | 0 (0.0%) |
| 5 or more Children | 0 (0.0%) | 0 (0.0%) |
| Total | 5 (2.1%) | 15 (28.3%) |
Employment Characteristics in Park City
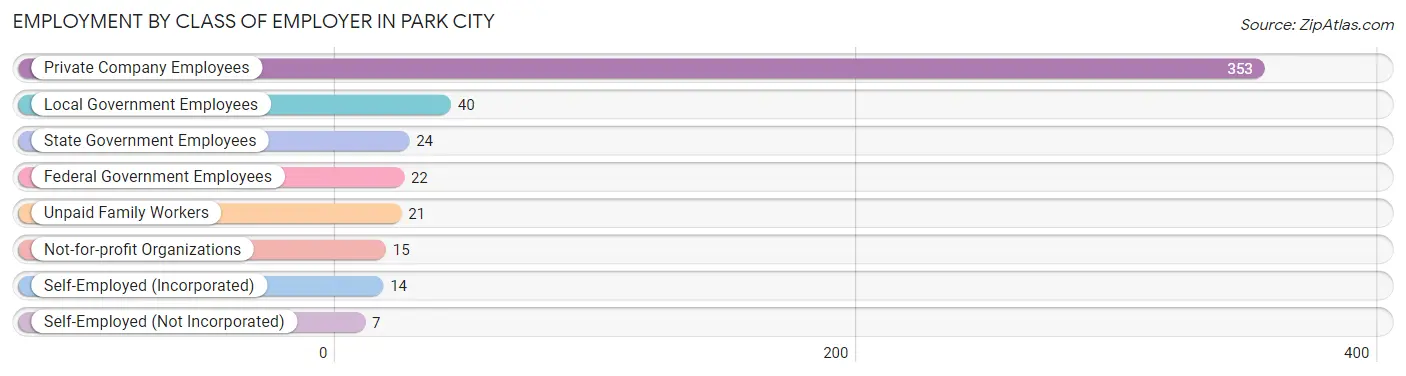
Employment by Class of Employer in Park City
Among the 496 employed individuals in Park City, private company employees (353 | 71.2%), local government employees (40 | 8.1%), and state government employees (24 | 4.8%) make up the most common classes of employment.
| Employer Class | # Employees | % Employees |
| Private Company Employees | 353 | 71.2% |
| Self-Employed (Incorporated) | 14 | 2.8% |
| Self-Employed (Not Incorporated) | 7 | 1.4% |
| Not-for-profit Organizations | 15 | 3.0% |
| Local Government Employees | 40 | 8.1% |
| State Government Employees | 24 | 4.8% |
| Federal Government Employees | 22 | 4.4% |
| Unpaid Family Workers | 21 | 4.2% |
| Total | 496 | 100.0% |
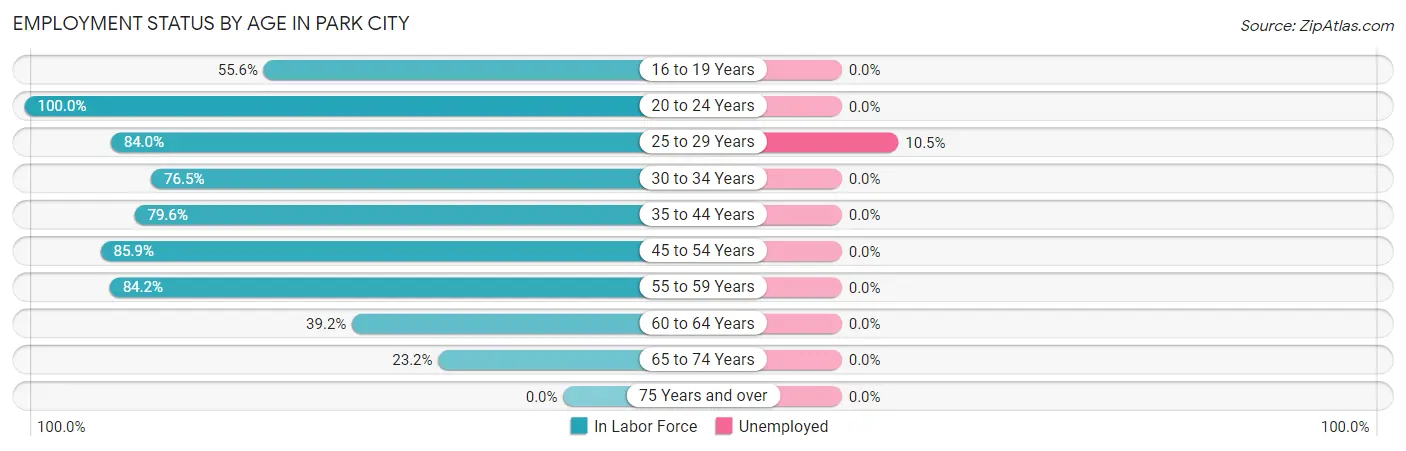
Employment Status by Age in Park City
According to the labor force statistics for Park City, out of the total population over 16 years of age (759), 66.8% or 507 individuals are in the labor force, with 2.2% or 11 of them unemployed. The age group with the highest labor force participation rate is 20 to 24 years, with 100.0% or 60 individuals in the labor force. Within the labor force, the 25 to 29 years age range has the highest percentage of unemployed individuals, with 10.5% or 11 of them being unemployed.
| Age Bracket | In Labor Force | Unemployed |
| 16 to 19 Years | 15 (55.6%) | 0 (0.0%) |
| 20 to 24 Years | 60 (100.0%) | 0 (0.0%) |
| 25 to 29 Years | 105 (84.0%) | 11 (10.5%) |
| 30 to 34 Years | 62 (76.5%) | 0 (0.0%) |
| 35 to 44 Years | 78 (79.6%) | 0 (0.0%) |
| 45 to 54 Years | 116 (85.9%) | 0 (0.0%) |
| 55 to 59 Years | 32 (84.2%) | 0 (0.0%) |
| 60 to 64 Years | 20 (39.2%) | 0 (0.0%) |
| 65 to 74 Years | 19 (23.2%) | 0 (0.0%) |
| 75 Years and over | 0 (0.0%) | 0 (0.0%) |
| Total | 507 (66.8%) | 11 (2.2%) |
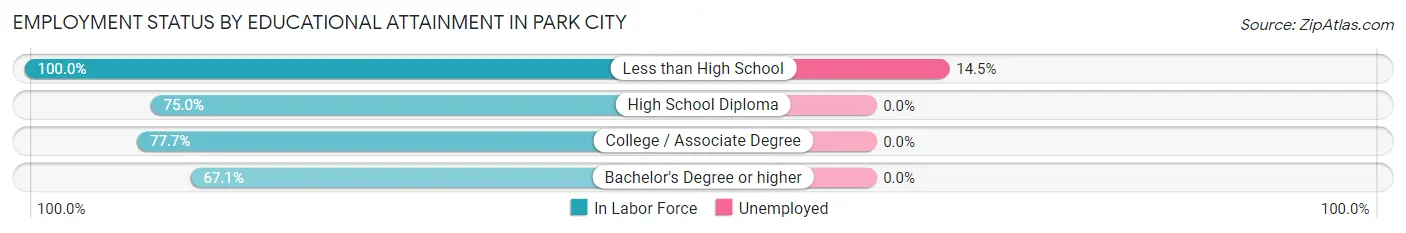
Employment Status by Educational Attainment in Park City
According to labor force statistics for Park City, 78.2% of individuals (413) out of the total population between 25 and 64 years of age (528) are in the labor force, with 2.7% or 11 of them being unemployed. The group with the highest labor force participation rate are those with the educational attainment of less than high school, with 100.0% or 76 individuals in the labor force. Within the labor force, individuals with less than high school education have the highest percentage of unemployment, with 14.5% or 11 of them being unemployed.
| Educational Attainment | In Labor Force | Unemployed |
| Less than High School | 76 (100.0%) | 11 (14.5%) |
| High School Diploma | 141 (75.0%) | 0 (0.0%) |
| College / Associate Degree | 139 (77.7%) | 0 (0.0%) |
| Bachelor's Degree or higher | 57 (67.1%) | 0 (0.0%) |
| Total | 413 (78.2%) | 14 (2.7%) |
Employment Occupations by Sex in Park City
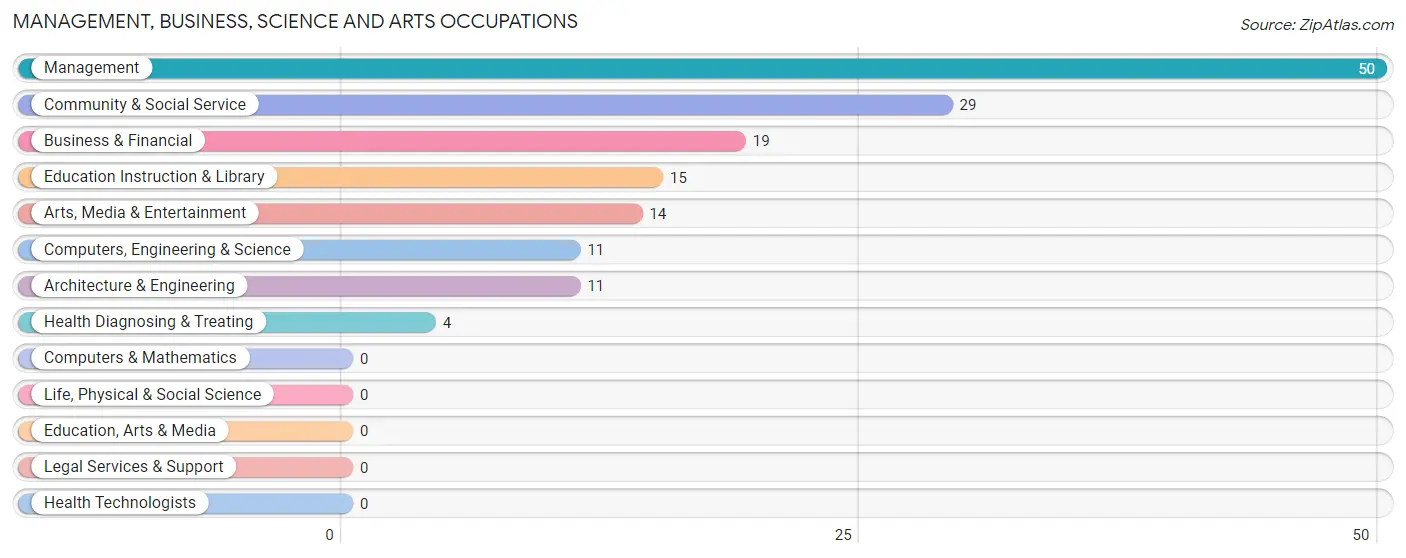
Management, Business, Science and Arts Occupations
The most common Management, Business, Science and Arts occupations in Park City are Management (50 | 10.1%), Community & Social Service (29 | 5.9%), Business & Financial (19 | 3.8%), Education Instruction & Library (15 | 3.0%), and Arts, Media & Entertainment (14 | 2.8%).
Management, Business, Science and Arts Occupations by Sex
Within the Management, Business, Science and Arts occupations in Park City, the most male-oriented occupations are Computers, Engineering & Science (100.0%), Architecture & Engineering (100.0%), and Arts, Media & Entertainment (57.1%), while the most female-oriented occupations are Education Instruction & Library (100.0%), Health Diagnosing & Treating (100.0%), and Business & Financial (84.2%).
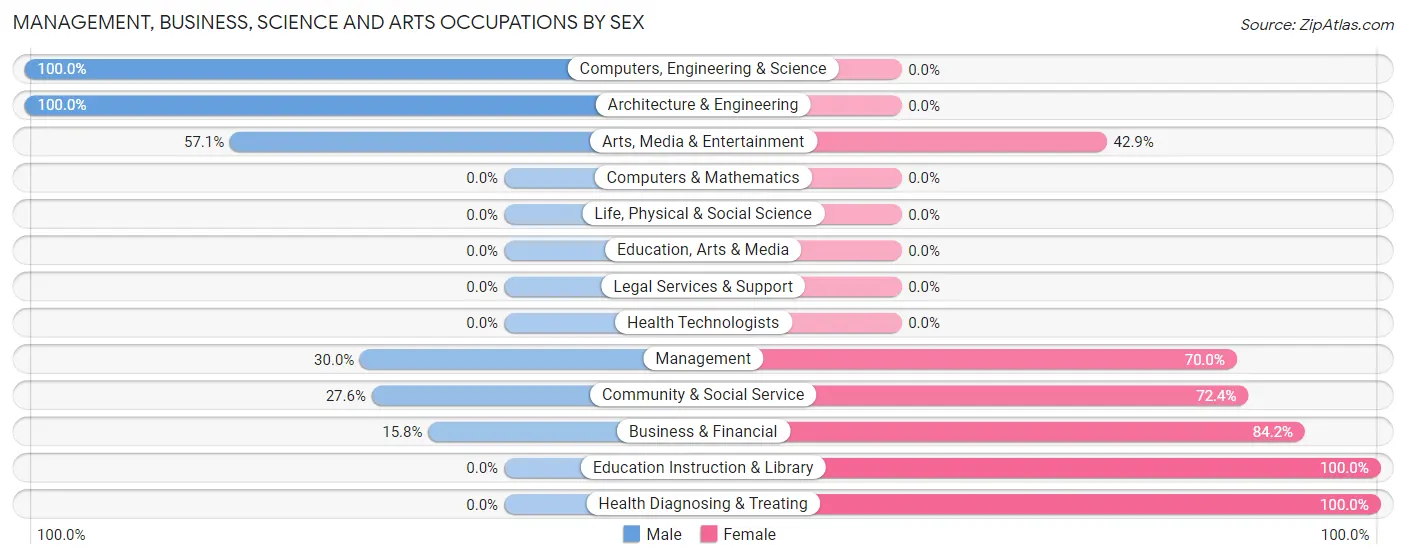
| Occupation | Male | Female |
| Management | 15 (30.0%) | 35 (70.0%) |
| Business & Financial | 3 (15.8%) | 16 (84.2%) |
| Computers, Engineering & Science | 11 (100.0%) | 0 (0.0%) |
| Computers & Mathematics | 0 (0.0%) | 0 (0.0%) |
| Architecture & Engineering | 11 (100.0%) | 0 (0.0%) |
| Life, Physical & Social Science | 0 (0.0%) | 0 (0.0%) |
| Community & Social Service | 8 (27.6%) | 21 (72.4%) |
| Education, Arts & Media | 0 (0.0%) | 0 (0.0%) |
| Legal Services & Support | 0 (0.0%) | 0 (0.0%) |
| Education Instruction & Library | 0 (0.0%) | 15 (100.0%) |
| Arts, Media & Entertainment | 8 (57.1%) | 6 (42.9%) |
| Health Diagnosing & Treating | 0 (0.0%) | 4 (100.0%) |
| Health Technologists | 0 (0.0%) | 0 (0.0%) |
| Total (Category) | 37 (32.7%) | 76 (67.3%) |
| Total (Overall) | 296 (59.7%) | 200 (40.3%) |
Services Occupations
The most common Services occupations in Park City are Cleaning & Maintenance (16 | 3.2%), Food Preparation & Serving (12 | 2.4%), and Healthcare Support (4 | 0.8%).
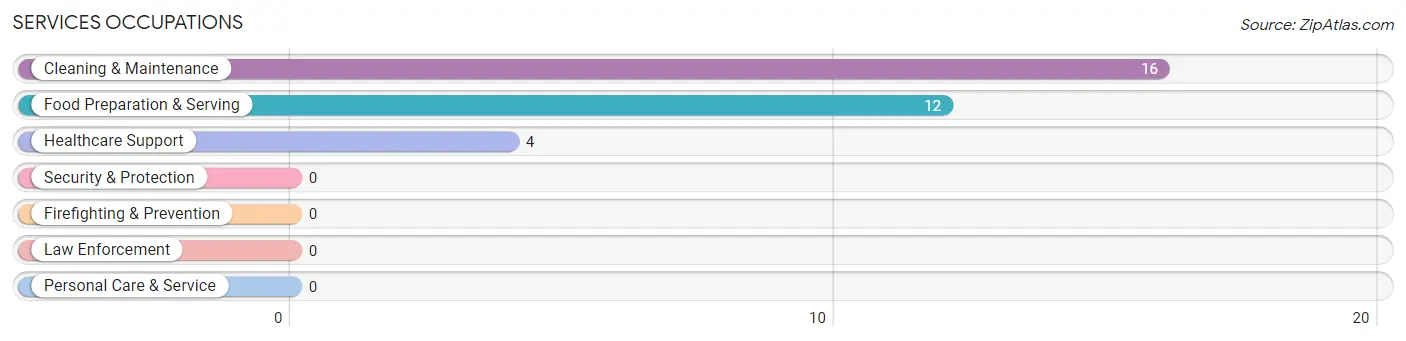
Services Occupations by Sex
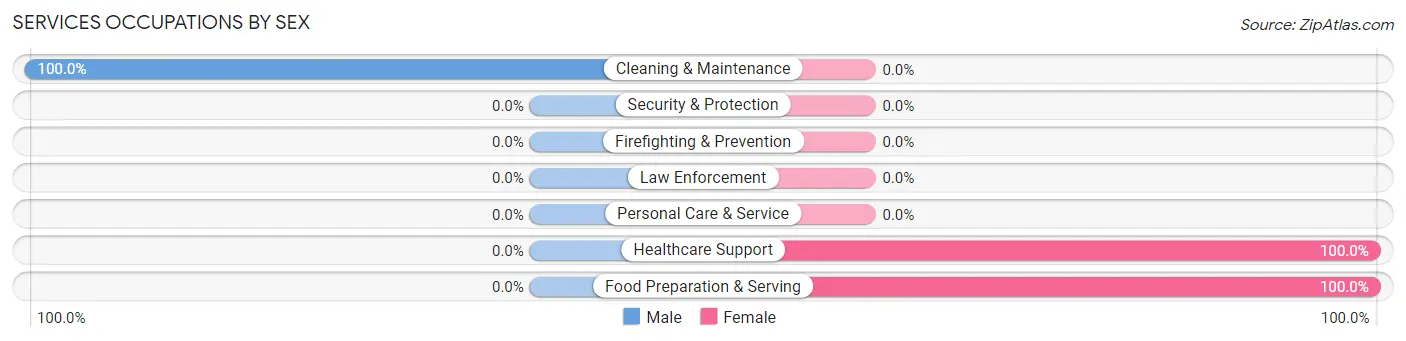
| Occupation | Male | Female |
| Healthcare Support | 0 (0.0%) | 4 (100.0%) |
| Security & Protection | 0 (0.0%) | 0 (0.0%) |
| Firefighting & Prevention | 0 (0.0%) | 0 (0.0%) |
| Law Enforcement | 0 (0.0%) | 0 (0.0%) |
| Food Preparation & Serving | 0 (0.0%) | 12 (100.0%) |
| Cleaning & Maintenance | 16 (100.0%) | 0 (0.0%) |
| Personal Care & Service | 0 (0.0%) | 0 (0.0%) |
| Total (Category) | 16 (50.0%) | 16 (50.0%) |
| Total (Overall) | 296 (59.7%) | 200 (40.3%) |
Sales and Office Occupations
The most common Sales and Office occupations in Park City are Office & Administration (62 | 12.5%), and Sales & Related (50 | 10.1%).
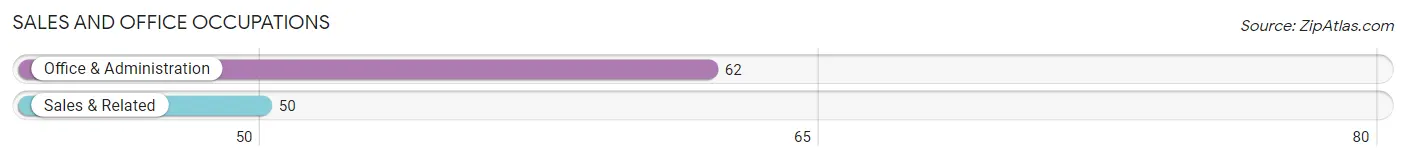
Sales and Office Occupations by Sex
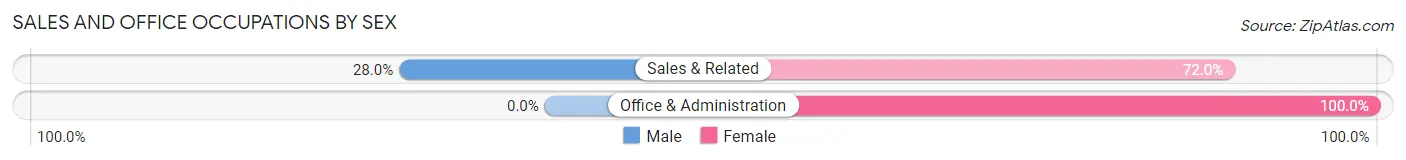
| Occupation | Male | Female |
| Sales & Related | 14 (28.0%) | 36 (72.0%) |
| Office & Administration | 0 (0.0%) | 62 (100.0%) |
| Total (Category) | 14 (12.5%) | 98 (87.5%) |
| Total (Overall) | 296 (59.7%) | 200 (40.3%) |
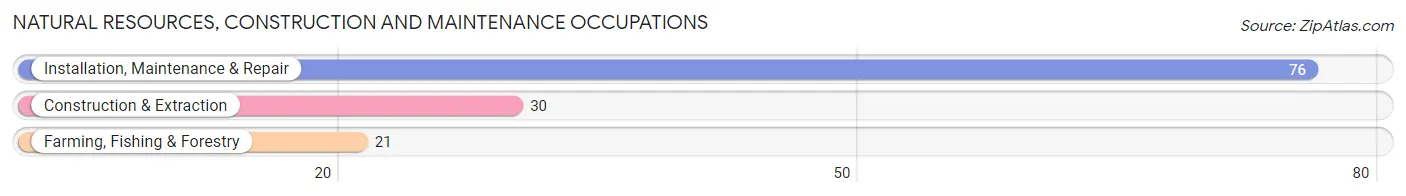
Natural Resources, Construction and Maintenance Occupations
The most common Natural Resources, Construction and Maintenance occupations in Park City are Installation, Maintenance & Repair (76 | 15.3%), Construction & Extraction (30 | 6.0%), and Farming, Fishing & Forestry (21 | 4.2%).
Natural Resources, Construction and Maintenance Occupations by Sex
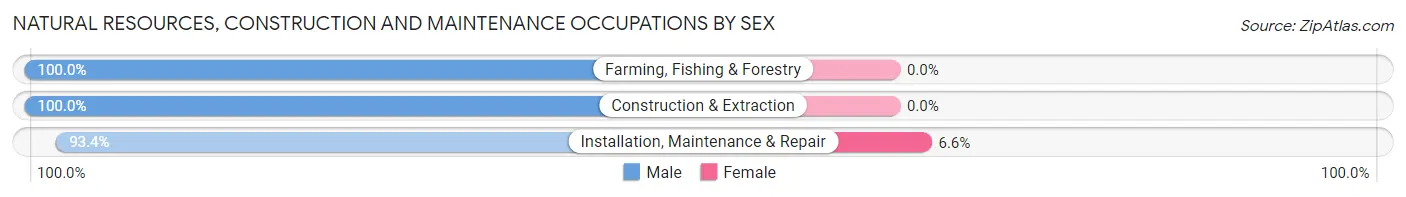
| Occupation | Male | Female |
| Farming, Fishing & Forestry | 21 (100.0%) | 0 (0.0%) |
| Construction & Extraction | 30 (100.0%) | 0 (0.0%) |
| Installation, Maintenance & Repair | 71 (93.4%) | 5 (6.6%) |
| Total (Category) | 122 (96.1%) | 5 (3.9%) |
| Total (Overall) | 296 (59.7%) | 200 (40.3%) |
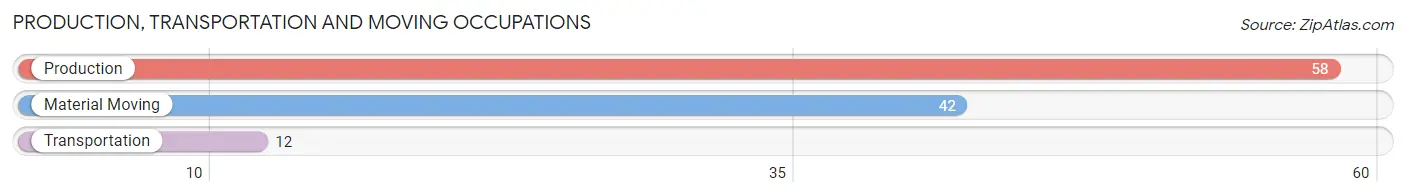
Production, Transportation and Moving Occupations
The most common Production, Transportation and Moving occupations in Park City are Production (58 | 11.7%), Material Moving (42 | 8.5%), and Transportation (12 | 2.4%).
Production, Transportation and Moving Occupations by Sex
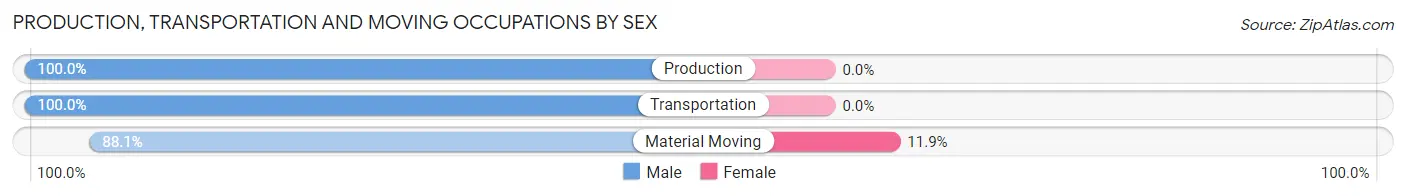
| Occupation | Male | Female |
| Production | 58 (100.0%) | 0 (0.0%) |
| Transportation | 12 (100.0%) | 0 (0.0%) |
| Material Moving | 37 (88.1%) | 5 (11.9%) |
| Total (Category) | 107 (95.5%) | 5 (4.5%) |
| Total (Overall) | 296 (59.7%) | 200 (40.3%) |
Employment Industries by Sex in Park City
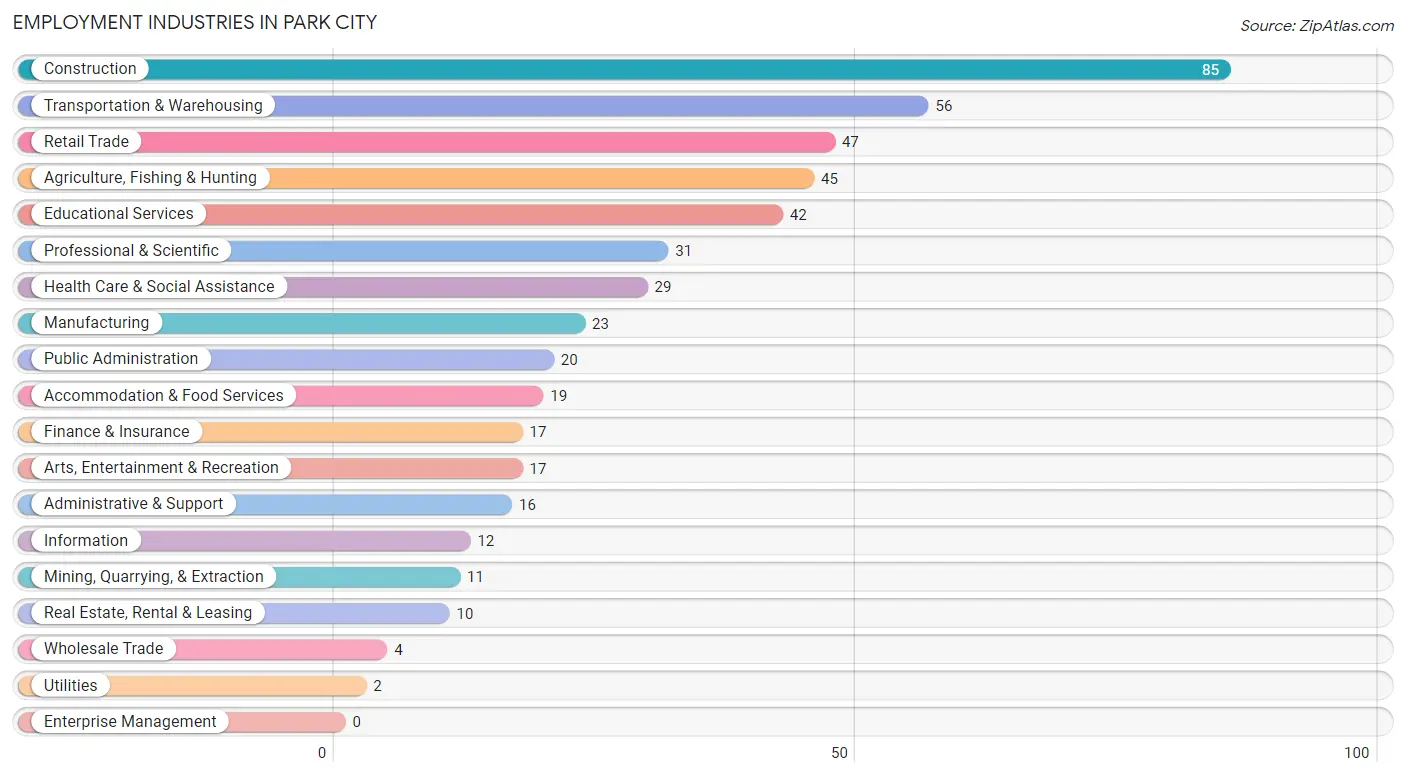
Employment Industries in Park City
The major employment industries in Park City include Construction (85 | 17.1%), Transportation & Warehousing (56 | 11.3%), Retail Trade (47 | 9.5%), Agriculture, Fishing & Hunting (45 | 9.1%), and Educational Services (42 | 8.5%).
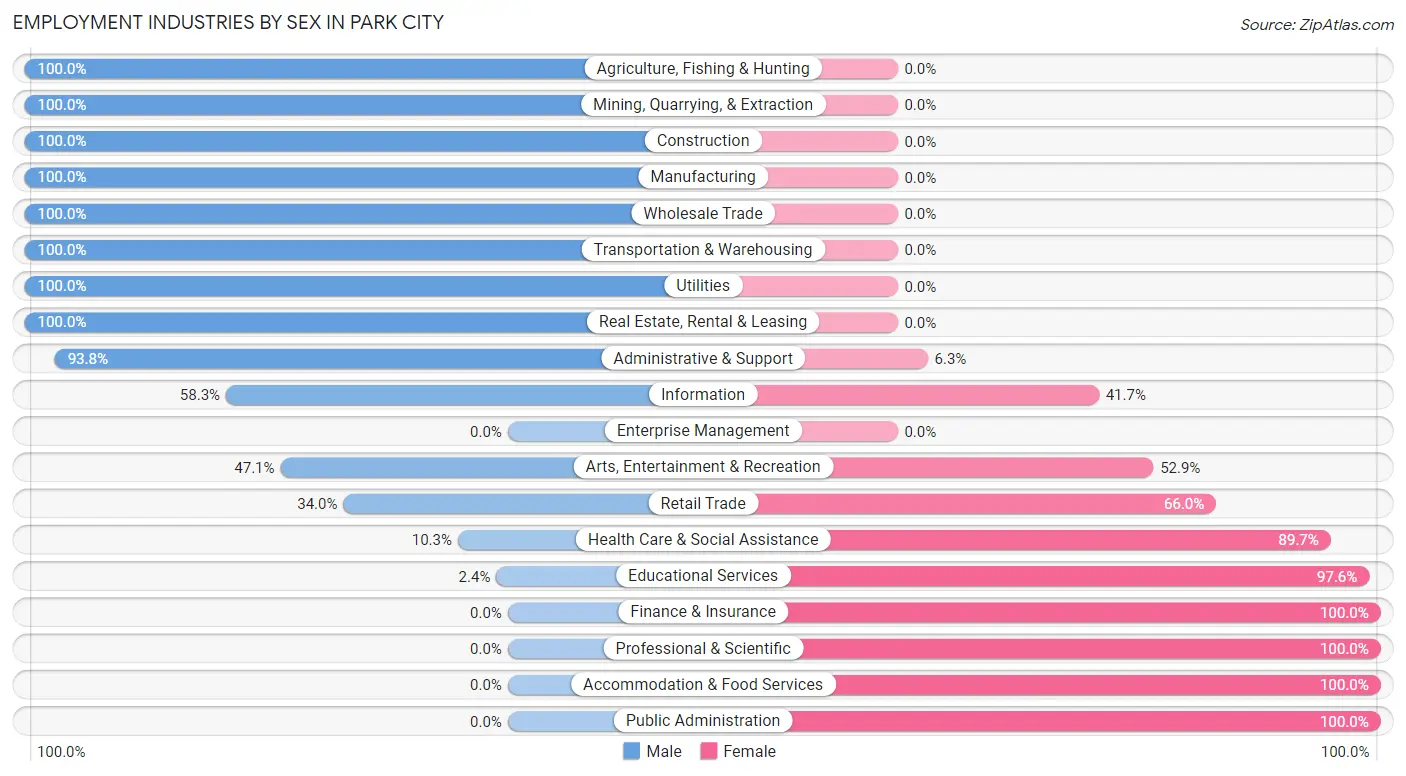
Employment Industries by Sex in Park City
The Park City industries that see more men than women are Agriculture, Fishing & Hunting (100.0%), Mining, Quarrying, & Extraction (100.0%), and Construction (100.0%), whereas the industries that tend to have a higher number of women are Finance & Insurance (100.0%), Professional & Scientific (100.0%), and Accommodation & Food Services (100.0%).
| Industry | Male | Female |
| Agriculture, Fishing & Hunting | 45 (100.0%) | 0 (0.0%) |
| Mining, Quarrying, & Extraction | 11 (100.0%) | 0 (0.0%) |
| Construction | 85 (100.0%) | 0 (0.0%) |
| Manufacturing | 23 (100.0%) | 0 (0.0%) |
| Wholesale Trade | 4 (100.0%) | 0 (0.0%) |
| Retail Trade | 16 (34.0%) | 31 (66.0%) |
| Transportation & Warehousing | 56 (100.0%) | 0 (0.0%) |
| Utilities | 2 (100.0%) | 0 (0.0%) |
| Information | 7 (58.3%) | 5 (41.7%) |
| Finance & Insurance | 0 (0.0%) | 17 (100.0%) |
| Real Estate, Rental & Leasing | 10 (100.0%) | 0 (0.0%) |
| Professional & Scientific | 0 (0.0%) | 31 (100.0%) |
| Enterprise Management | 0 (0.0%) | 0 (0.0%) |
| Administrative & Support | 15 (93.8%) | 1 (6.2%) |
| Educational Services | 1 (2.4%) | 41 (97.6%) |
| Health Care & Social Assistance | 3 (10.3%) | 26 (89.7%) |
| Arts, Entertainment & Recreation | 8 (47.1%) | 9 (52.9%) |
| Accommodation & Food Services | 0 (0.0%) | 19 (100.0%) |
| Public Administration | 0 (0.0%) | 20 (100.0%) |
| Total | 296 (59.7%) | 200 (40.3%) |
Education in Park City
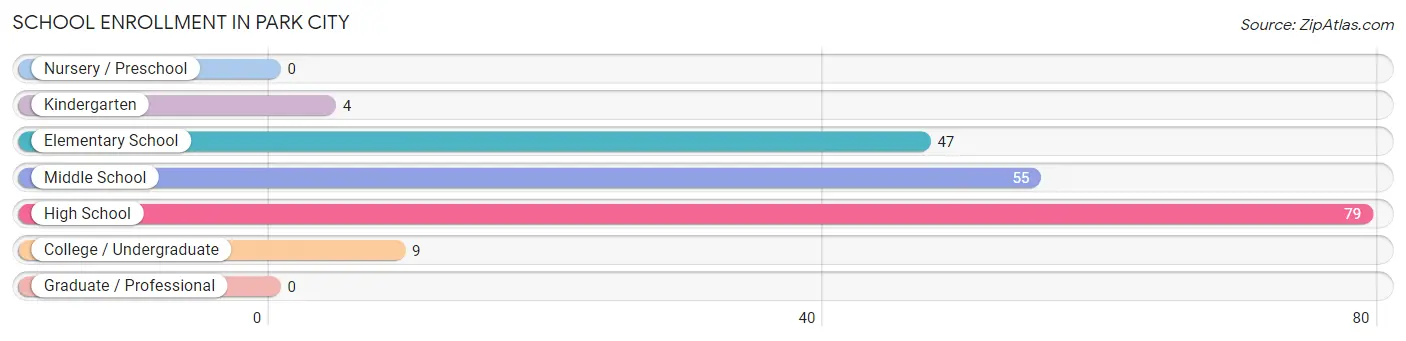
School Enrollment in Park City
The most common levels of schooling among the 194 students in Park City are high school (79 | 40.7%), middle school (55 | 28.3%), and elementary school (47 | 24.2%).
| School Level | # Students | % Students |
| Nursery / Preschool | 0 | 0.0% |
| Kindergarten | 4 | 2.1% |
| Elementary School | 47 | 24.2% |
| Middle School | 55 | 28.3% |
| High School | 79 | 40.7% |
| College / Undergraduate | 9 | 4.6% |
| Graduate / Professional | 0 | 0.0% |
| Total | 194 | 100.0% |
School Enrollment by Age by Funding Source in Park City
Out of a total of 194 students who are enrolled in schools in Park City, 39 (20.1%) attend a private institution, while the remaining 155 (79.9%) are enrolled in public schools. The age group of 15 to 17 year olds has the highest likelihood of being enrolled in private schools, with 36 (66.7% in the age bracket) enrolled. Conversely, the age group of 10 to 14 year olds has the lowest likelihood of being enrolled in a private school, with 80 (100.0% in the age bracket) attending a public institution.
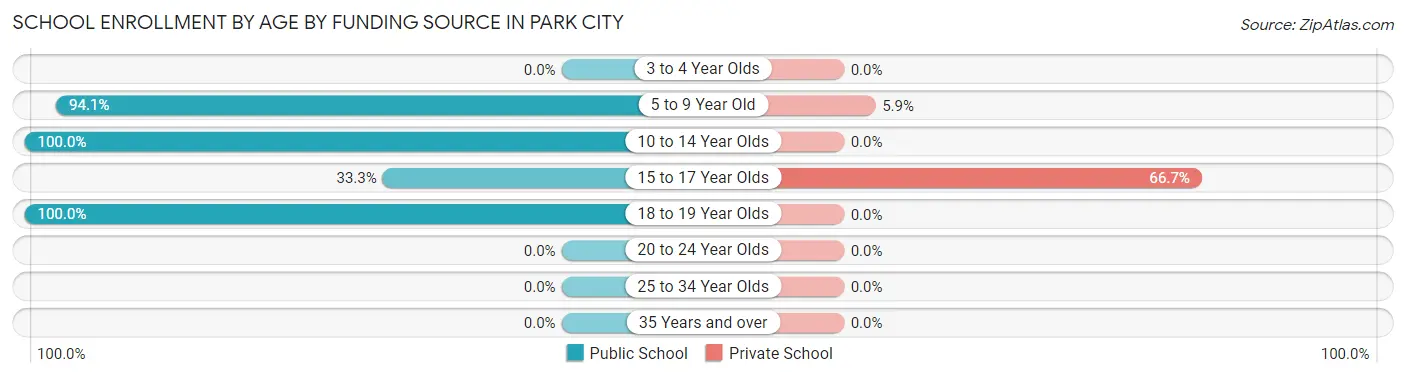
| Age Bracket | Public School | Private School |
| 3 to 4 Year Olds | 0 (0.0%) | 0 (0.0%) |
| 5 to 9 Year Old | 48 (94.1%) | 3 (5.9%) |
| 10 to 14 Year Olds | 80 (100.0%) | 0 (0.0%) |
| 15 to 17 Year Olds | 18 (33.3%) | 36 (66.7%) |
| 18 to 19 Year Olds | 9 (100.0%) | 0 (0.0%) |
| 20 to 24 Year Olds | 0 (0.0%) | 0 (0.0%) |
| 25 to 34 Year Olds | 0 (0.0%) | 0 (0.0%) |
| 35 Years and over | 0 (0.0%) | 0 (0.0%) |
| Total | 155 (79.9%) | 39 (20.1%) |
Educational Attainment by Field of Study in Park City
Liberal arts & history (31 | 29.8%), business (27 | 26.0%), social sciences (14 | 13.5%), engineering (11 | 10.6%), and arts & humanities (7 | 6.7%) are the most common fields of study among 104 individuals in Park City who have obtained a bachelor's degree or higher.
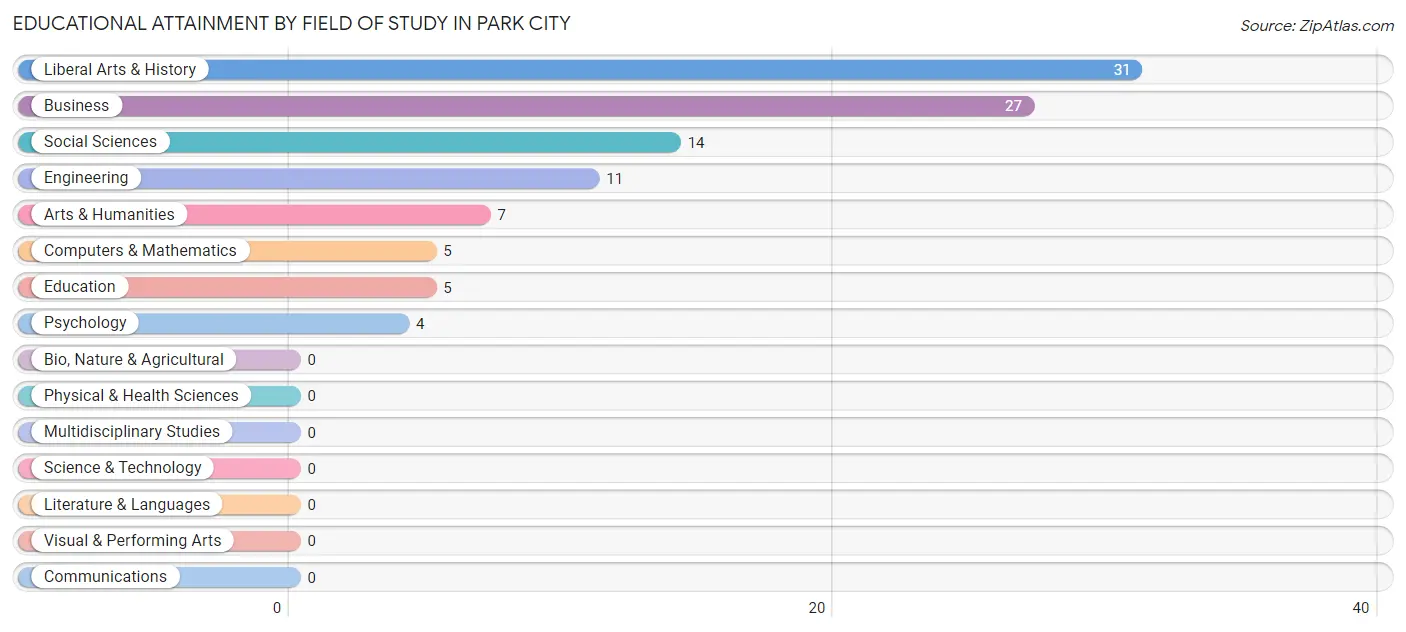
| Field of Study | # Graduates | % Graduates |
| Computers & Mathematics | 5 | 4.8% |
| Bio, Nature & Agricultural | 0 | 0.0% |
| Physical & Health Sciences | 0 | 0.0% |
| Psychology | 4 | 3.8% |
| Social Sciences | 14 | 13.5% |
| Engineering | 11 | 10.6% |
| Multidisciplinary Studies | 0 | 0.0% |
| Science & Technology | 0 | 0.0% |
| Business | 27 | 26.0% |
| Education | 5 | 4.8% |
| Literature & Languages | 0 | 0.0% |
| Liberal Arts & History | 31 | 29.8% |
| Visual & Performing Arts | 0 | 0.0% |
| Communications | 0 | 0.0% |
| Arts & Humanities | 7 | 6.7% |
| Total | 104 | 100.0% |
Transportation & Commute in Park City
Vehicle Availability by Sex in Park City
The most prevalent vehicle ownership categories in Park City are males with 2 vehicles (142, accounting for 48.0%) and females with 2 vehicles (76, making up 71.0%).
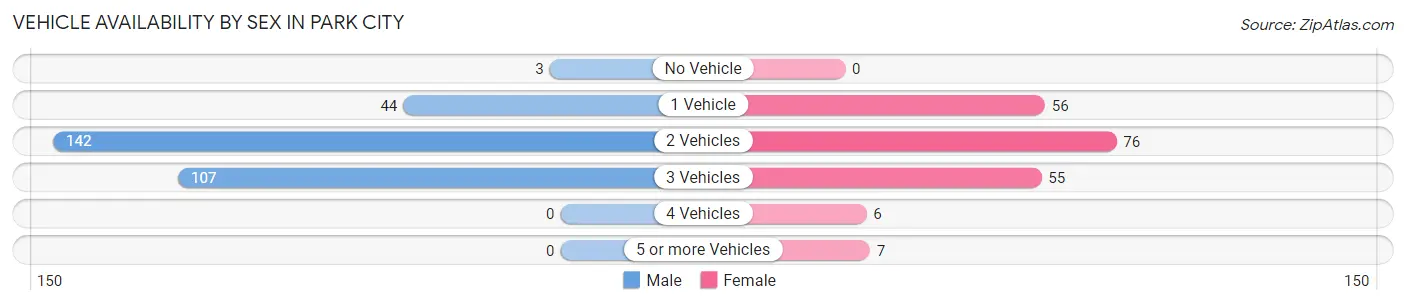
| Vehicles Available | Male | Female |
| No Vehicle | 3 (1.0%) | 0 (0.0%) |
| 1 Vehicle | 44 (14.9%) | 56 (28.0%) |
| 2 Vehicles | 142 (48.0%) | 76 (38.0%) |
| 3 Vehicles | 107 (36.1%) | 55 (27.5%) |
| 4 Vehicles | 0 (0.0%) | 6 (3.0%) |
| 5 or more Vehicles | 0 (0.0%) | 7 (3.5%) |
| Total | 296 (100.0%) | 200 (100.0%) |
Commute Time in Park City
The most frequently occuring commute durations in Park City are 25 to 29 minutes (112 commuters, 22.8%), 20 to 24 minutes (103 commuters, 20.9%), and 15 to 19 minutes (88 commuters, 17.9%).
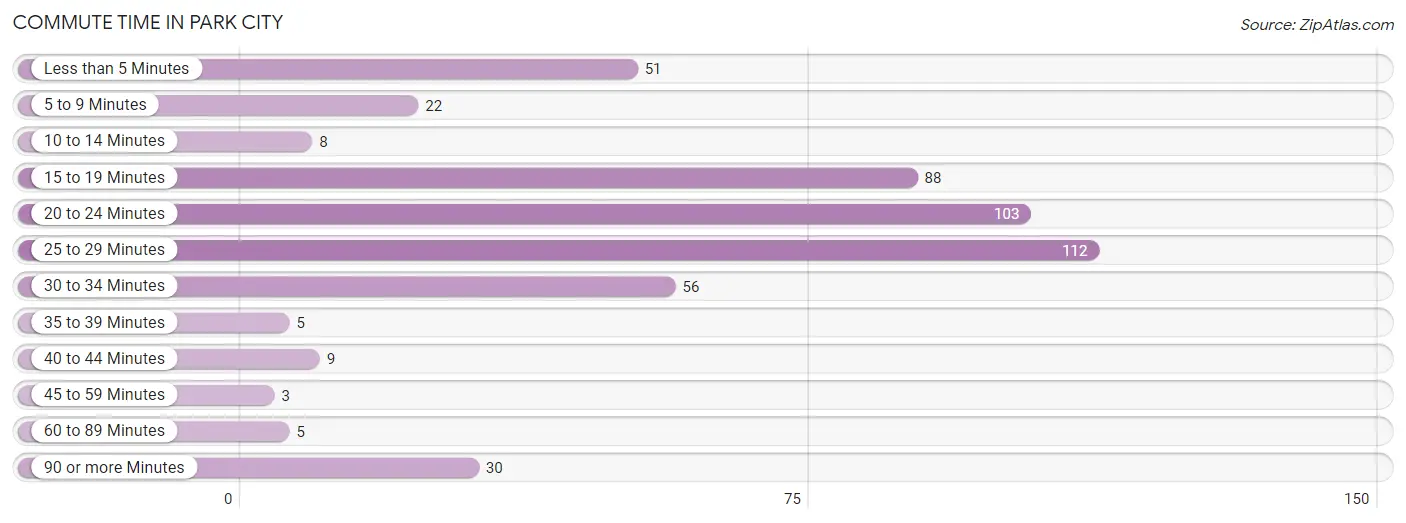
| Commute Time | # Commuters | % Commuters |
| Less than 5 Minutes | 51 | 10.4% |
| 5 to 9 Minutes | 22 | 4.5% |
| 10 to 14 Minutes | 8 | 1.6% |
| 15 to 19 Minutes | 88 | 17.9% |
| 20 to 24 Minutes | 103 | 20.9% |
| 25 to 29 Minutes | 112 | 22.8% |
| 30 to 34 Minutes | 56 | 11.4% |
| 35 to 39 Minutes | 5 | 1.0% |
| 40 to 44 Minutes | 9 | 1.8% |
| 45 to 59 Minutes | 3 | 0.6% |
| 60 to 89 Minutes | 5 | 1.0% |
| 90 or more Minutes | 30 | 6.1% |
Commute Time by Sex in Park City
The most common commute times in Park City are 20 to 24 minutes (76 commuters, 25.7%) for males and 25 to 29 minutes (73 commuters, 37.2%) for females.
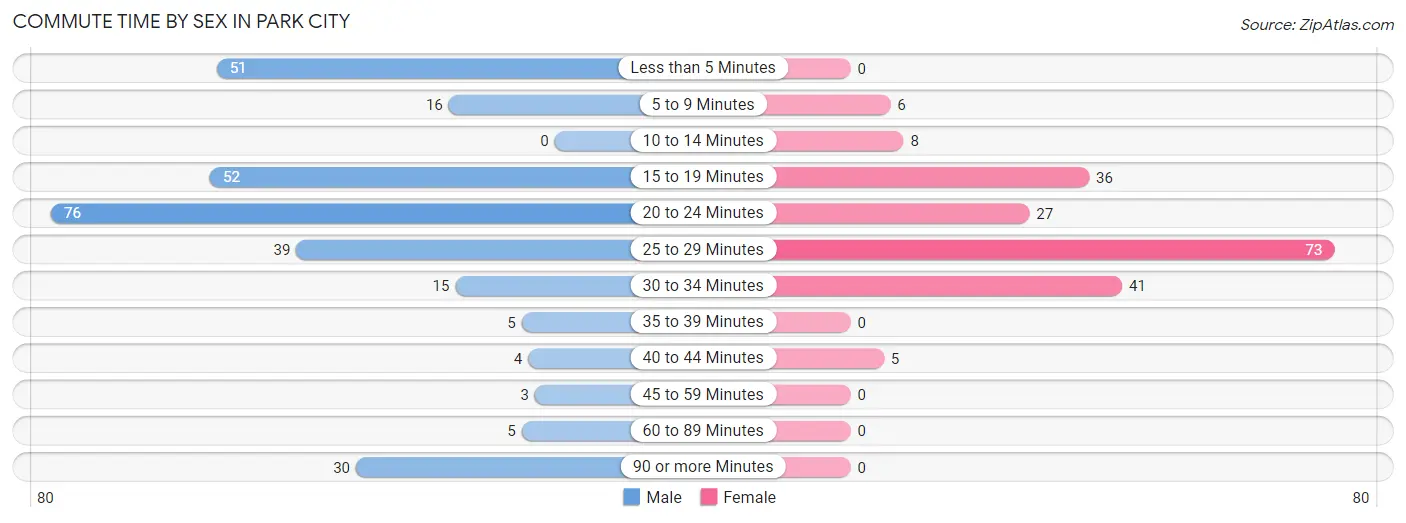
| Commute Time | Male | Female |
| Less than 5 Minutes | 51 (17.2%) | 0 (0.0%) |
| 5 to 9 Minutes | 16 (5.4%) | 6 (3.1%) |
| 10 to 14 Minutes | 0 (0.0%) | 8 (4.1%) |
| 15 to 19 Minutes | 52 (17.6%) | 36 (18.4%) |
| 20 to 24 Minutes | 76 (25.7%) | 27 (13.8%) |
| 25 to 29 Minutes | 39 (13.2%) | 73 (37.2%) |
| 30 to 34 Minutes | 15 (5.1%) | 41 (20.9%) |
| 35 to 39 Minutes | 5 (1.7%) | 0 (0.0%) |
| 40 to 44 Minutes | 4 (1.3%) | 5 (2.5%) |
| 45 to 59 Minutes | 3 (1.0%) | 0 (0.0%) |
| 60 to 89 Minutes | 5 (1.7%) | 0 (0.0%) |
| 90 or more Minutes | 30 (10.1%) | 0 (0.0%) |
Time of Departure to Work by Sex in Park City
The most frequent times of departure to work in Park City are 7:00 AM to 7:29 AM (69, 23.3%) for males and 7:00 AM to 7:29 AM (47, 24.0%) for females.
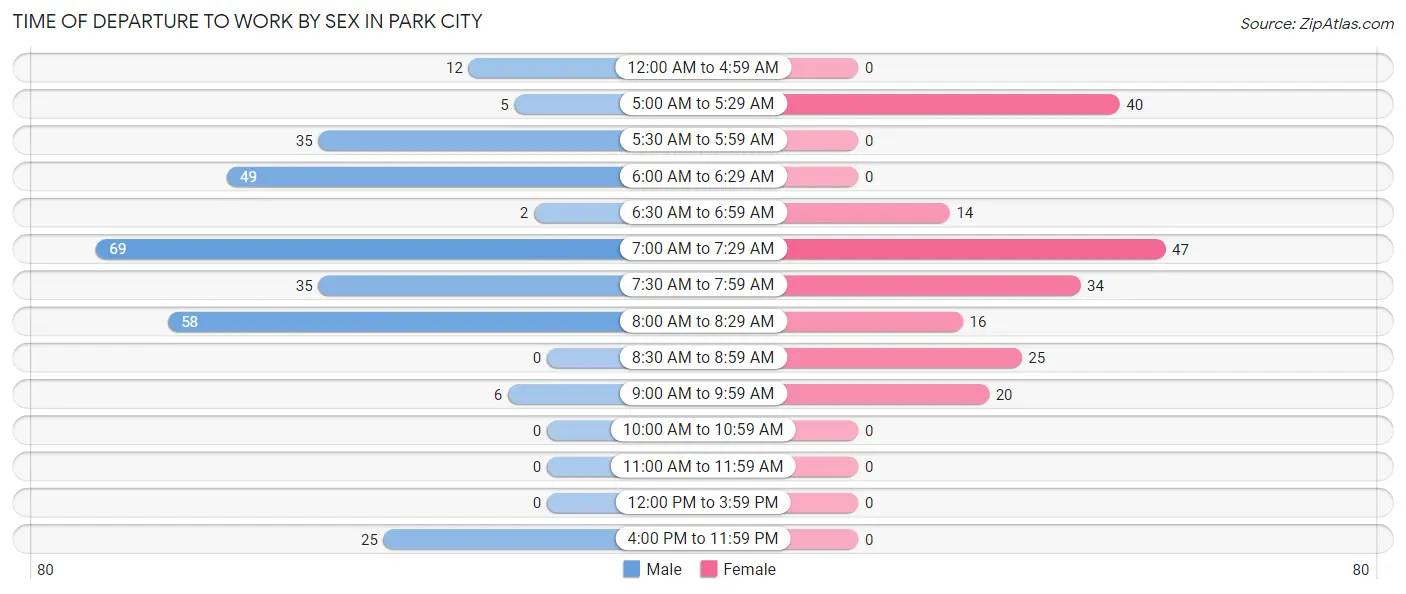
| Time of Departure | Male | Female |
| 12:00 AM to 4:59 AM | 12 (4.1%) | 0 (0.0%) |
| 5:00 AM to 5:29 AM | 5 (1.7%) | 40 (20.4%) |
| 5:30 AM to 5:59 AM | 35 (11.8%) | 0 (0.0%) |
| 6:00 AM to 6:29 AM | 49 (16.6%) | 0 (0.0%) |
| 6:30 AM to 6:59 AM | 2 (0.7%) | 14 (7.1%) |
| 7:00 AM to 7:29 AM | 69 (23.3%) | 47 (24.0%) |
| 7:30 AM to 7:59 AM | 35 (11.8%) | 34 (17.3%) |
| 8:00 AM to 8:29 AM | 58 (19.6%) | 16 (8.2%) |
| 8:30 AM to 8:59 AM | 0 (0.0%) | 25 (12.8%) |
| 9:00 AM to 9:59 AM | 6 (2.0%) | 20 (10.2%) |
| 10:00 AM to 10:59 AM | 0 (0.0%) | 0 (0.0%) |
| 11:00 AM to 11:59 AM | 0 (0.0%) | 0 (0.0%) |
| 12:00 PM to 3:59 PM | 0 (0.0%) | 0 (0.0%) |
| 4:00 PM to 11:59 PM | 25 (8.5%) | 0 (0.0%) |
| Total | 296 (100.0%) | 196 (100.0%) |
Housing Occupancy in Park City
Occupancy by Ownership in Park City
Of the total 396 dwellings in Park City, owner-occupied units account for 276 (69.7%), while renter-occupied units make up 120 (30.3%).
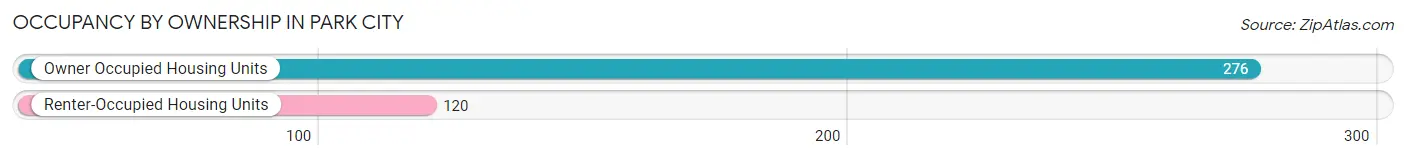
| Occupancy | # Housing Units | % Housing Units |
| Owner Occupied Housing Units | 276 | 69.7% |
| Renter-Occupied Housing Units | 120 | 30.3% |
| Total Occupied Housing Units | 396 | 100.0% |
Occupancy by Household Size in Park City
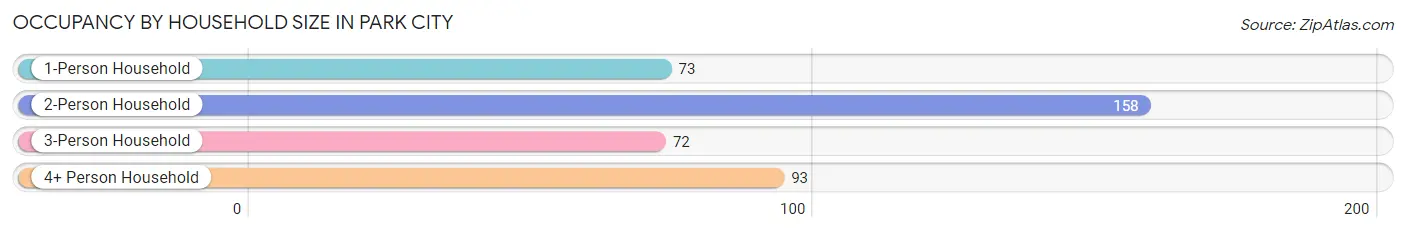
| Household Size | # Housing Units | % Housing Units |
| 1-Person Household | 73 | 18.4% |
| 2-Person Household | 158 | 39.9% |
| 3-Person Household | 72 | 18.2% |
| 4+ Person Household | 93 | 23.5% |
| Total Housing Units | 396 | 100.0% |
Occupancy by Ownership by Household Size in Park City
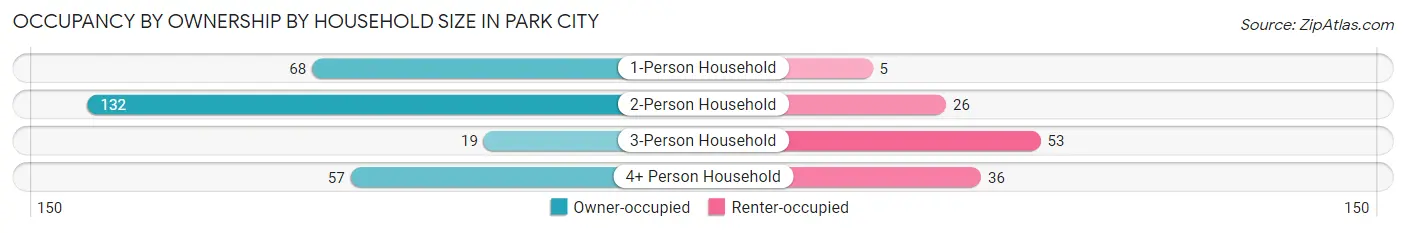
| Household Size | Owner-occupied | Renter-occupied |
| 1-Person Household | 68 (93.1%) | 5 (6.9%) |
| 2-Person Household | 132 (83.5%) | 26 (16.5%) |
| 3-Person Household | 19 (26.4%) | 53 (73.6%) |
| 4+ Person Household | 57 (61.3%) | 36 (38.7%) |
| Total Housing Units | 276 (69.7%) | 120 (30.3%) |
Occupancy by Educational Attainment in Park City
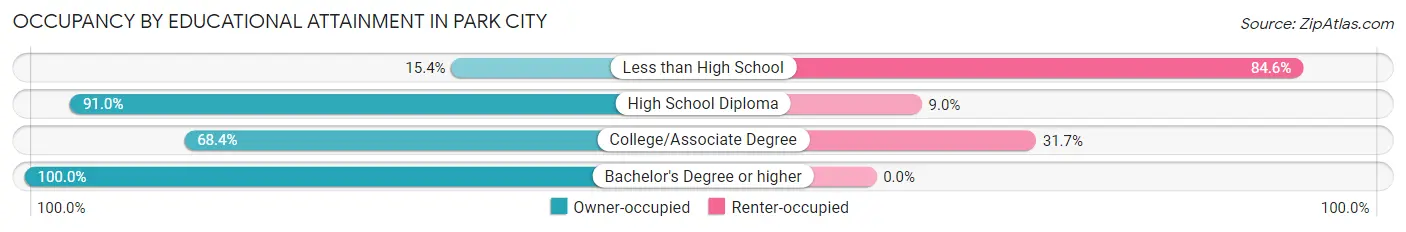
| Household Size | Owner-occupied | Renter-occupied |
| Less than High School | 12 (15.4%) | 66 (84.6%) |
| High School Diploma | 101 (91.0%) | 10 (9.0%) |
| College/Associate Degree | 95 (68.3%) | 44 (31.7%) |
| Bachelor's Degree or higher | 68 (100.0%) | 0 (0.0%) |
Occupancy by Age of Householder in Park City
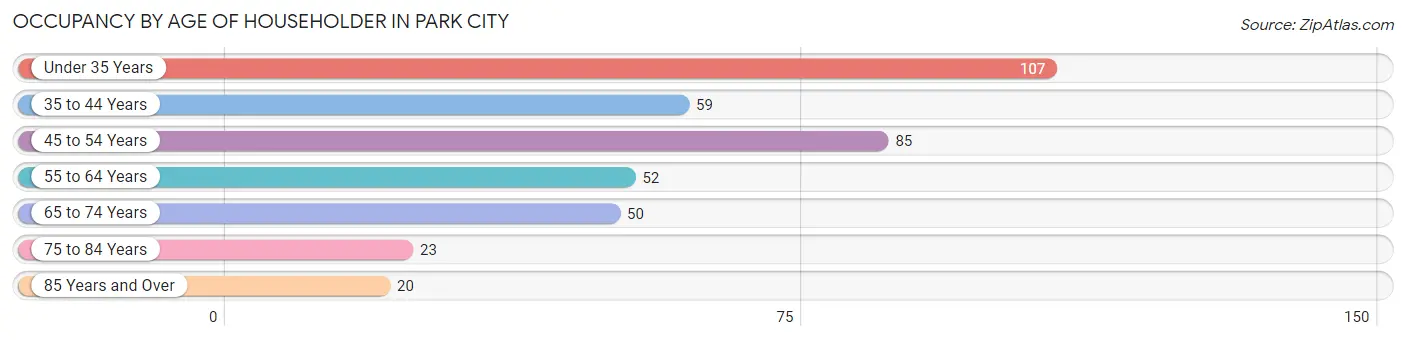
| Age Bracket | # Households | % Households |
| Under 35 Years | 107 | 27.0% |
| 35 to 44 Years | 59 | 14.9% |
| 45 to 54 Years | 85 | 21.5% |
| 55 to 64 Years | 52 | 13.1% |
| 65 to 74 Years | 50 | 12.6% |
| 75 to 84 Years | 23 | 5.8% |
| 85 Years and Over | 20 | 5.1% |
| Total | 396 | 100.0% |
Housing Finances in Park City
Median Income by Occupancy in Park City
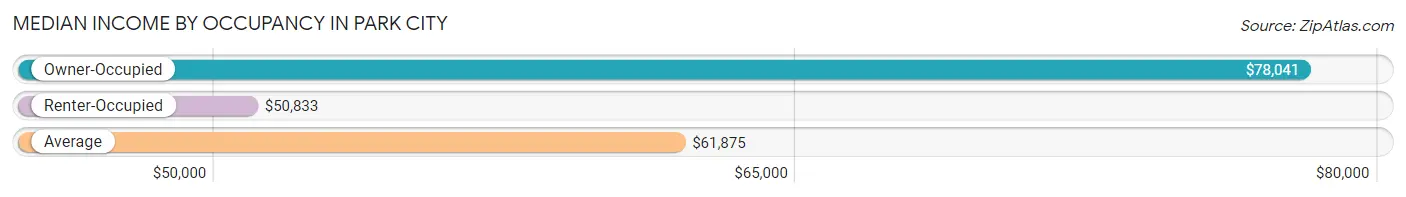
| Occupancy Type | # Households | Median Income |
| Owner-Occupied | 276 (69.7%) | $78,041 |
| Renter-Occupied | 120 (30.3%) | $50,833 |
| Average | 396 (100.0%) | $61,875 |
Occupancy by Householder Income Bracket in Park City
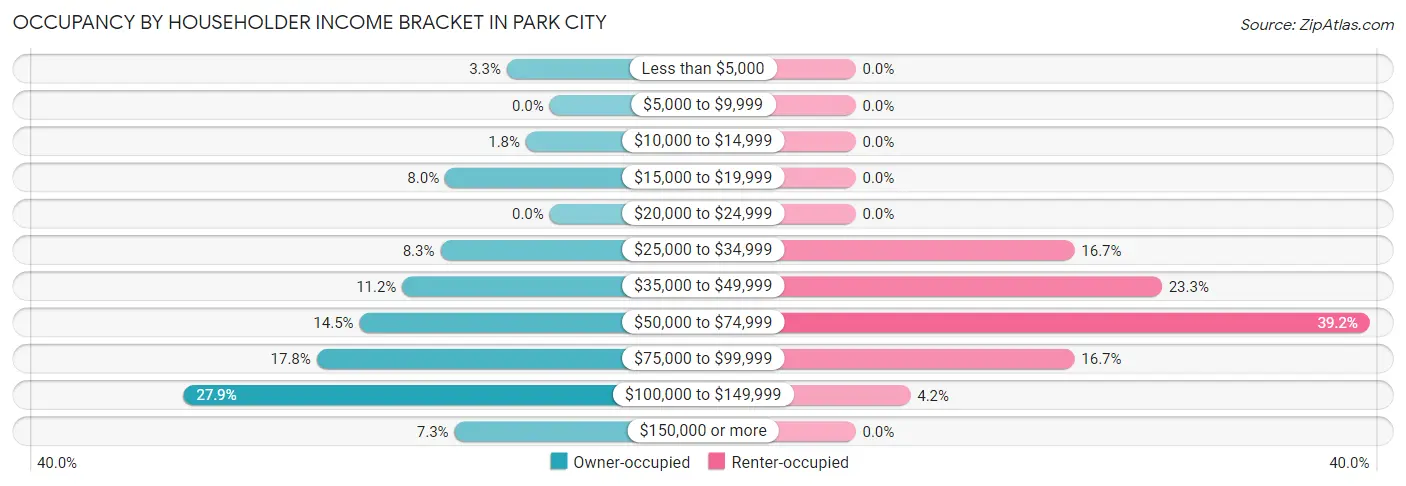
| Income Bracket | Owner-occupied | Renter-occupied |
| Less than $5,000 | 9 (3.3%) | 0 (0.0%) |
| $5,000 to $9,999 | 0 (0.0%) | 0 (0.0%) |
| $10,000 to $14,999 | 5 (1.8%) | 0 (0.0%) |
| $15,000 to $19,999 | 22 (8.0%) | 0 (0.0%) |
| $20,000 to $24,999 | 0 (0.0%) | 0 (0.0%) |
| $25,000 to $34,999 | 23 (8.3%) | 20 (16.7%) |
| $35,000 to $49,999 | 31 (11.2%) | 28 (23.3%) |
| $50,000 to $74,999 | 40 (14.5%) | 47 (39.2%) |
| $75,000 to $99,999 | 49 (17.7%) | 20 (16.7%) |
| $100,000 to $149,999 | 77 (27.9%) | 5 (4.2%) |
| $150,000 or more | 20 (7.2%) | 0 (0.0%) |
| Total | 276 (100.0%) | 120 (100.0%) |
Monthly Housing Cost Tiers in Park City
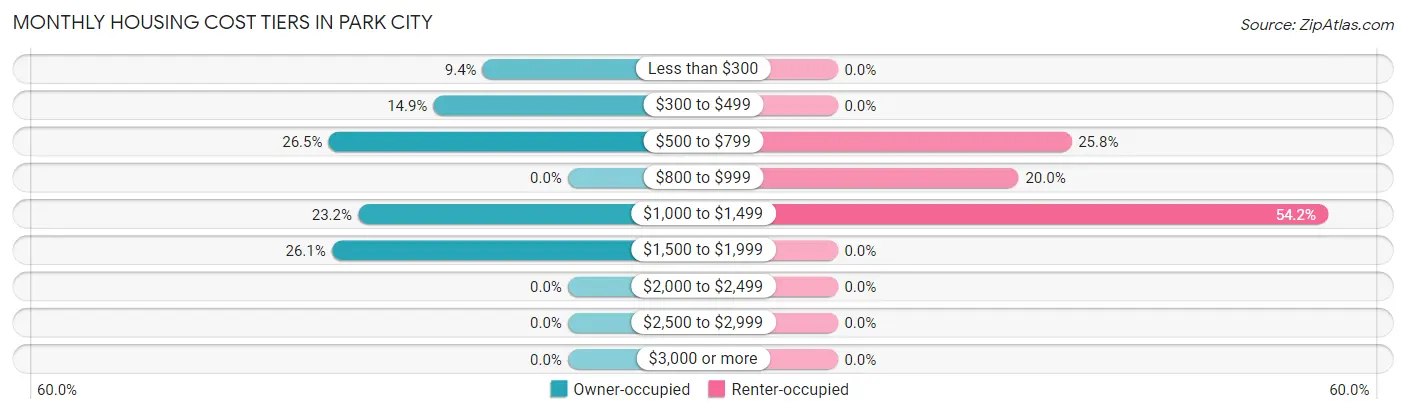
| Monthly Cost | Owner-occupied | Renter-occupied |
| Less than $300 | 26 (9.4%) | 0 (0.0%) |
| $300 to $499 | 41 (14.9%) | 0 (0.0%) |
| $500 to $799 | 73 (26.5%) | 31 (25.8%) |
| $800 to $999 | 0 (0.0%) | 24 (20.0%) |
| $1,000 to $1,499 | 64 (23.2%) | 65 (54.2%) |
| $1,500 to $1,999 | 72 (26.1%) | 0 (0.0%) |
| $2,000 to $2,499 | 0 (0.0%) | 0 (0.0%) |
| $2,500 to $2,999 | 0 (0.0%) | 0 (0.0%) |
| $3,000 or more | 0 (0.0%) | 0 (0.0%) |
| Total | 276 (100.0%) | 120 (100.0%) |
Physical Housing Characteristics in Park City
Housing Structures in Park City
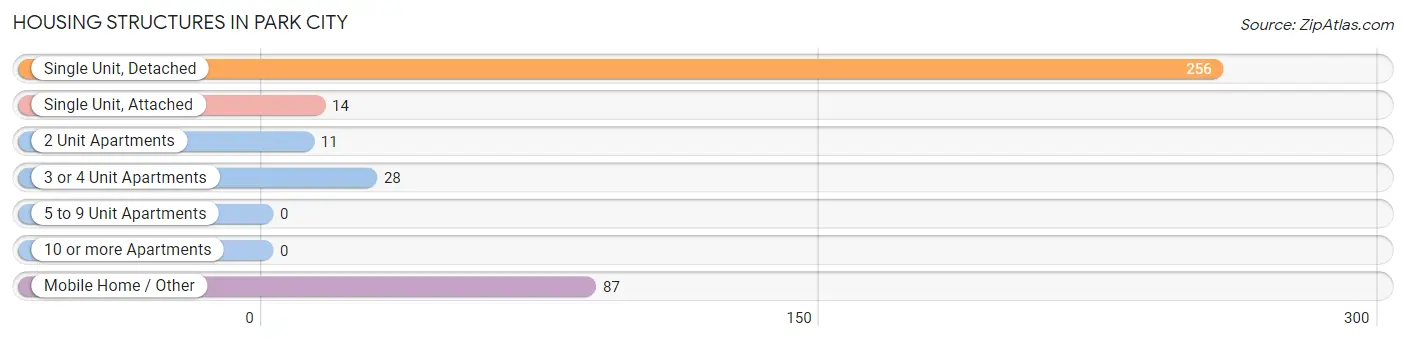
| Structure Type | # Housing Units | % Housing Units |
| Single Unit, Detached | 256 | 64.6% |
| Single Unit, Attached | 14 | 3.5% |
| 2 Unit Apartments | 11 | 2.8% |
| 3 or 4 Unit Apartments | 28 | 7.1% |
| 5 to 9 Unit Apartments | 0 | 0.0% |
| 10 or more Apartments | 0 | 0.0% |
| Mobile Home / Other | 87 | 22.0% |
| Total | 396 | 100.0% |
Housing Structures by Occupancy in Park City
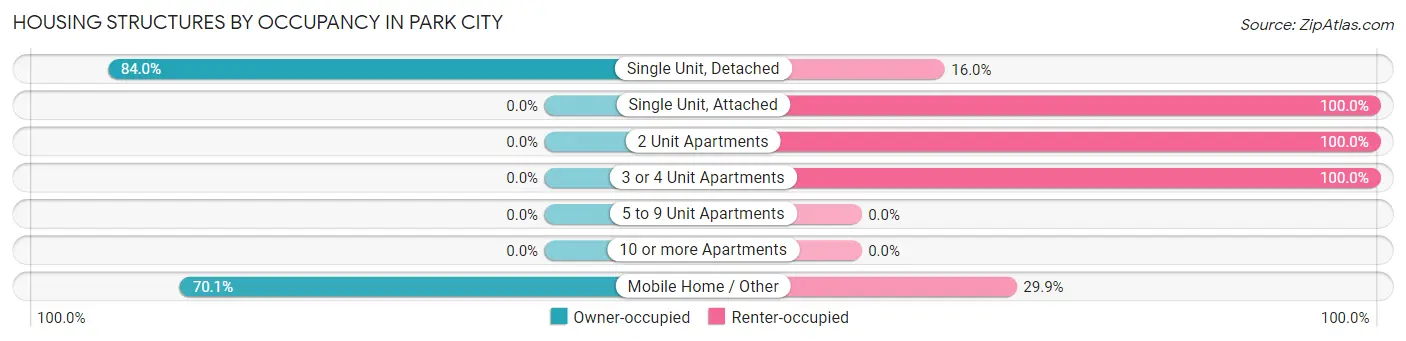
| Structure Type | Owner-occupied | Renter-occupied |
| Single Unit, Detached | 215 (84.0%) | 41 (16.0%) |
| Single Unit, Attached | 0 (0.0%) | 14 (100.0%) |
| 2 Unit Apartments | 0 (0.0%) | 11 (100.0%) |
| 3 or 4 Unit Apartments | 0 (0.0%) | 28 (100.0%) |
| 5 to 9 Unit Apartments | 0 (0.0%) | 0 (0.0%) |
| 10 or more Apartments | 0 (0.0%) | 0 (0.0%) |
| Mobile Home / Other | 61 (70.1%) | 26 (29.9%) |
| Total | 276 (69.7%) | 120 (30.3%) |
Housing Structures by Number of Rooms in Park City
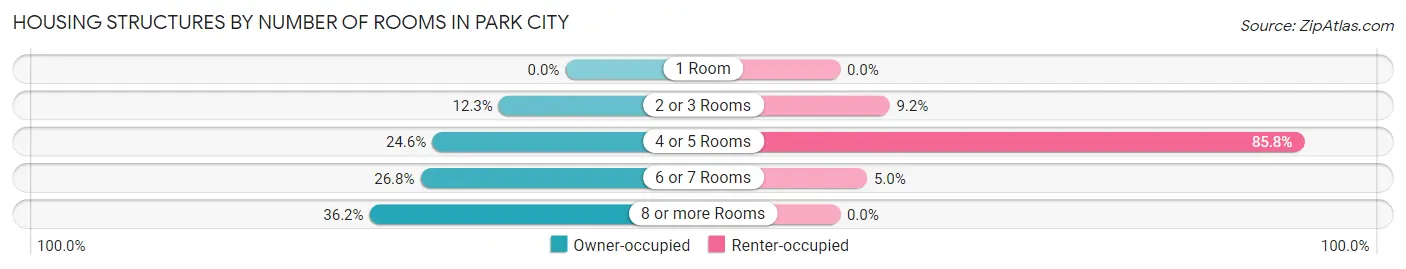
| Number of Rooms | Owner-occupied | Renter-occupied |
| 1 Room | 0 (0.0%) | 0 (0.0%) |
| 2 or 3 Rooms | 34 (12.3%) | 11 (9.2%) |
| 4 or 5 Rooms | 68 (24.6%) | 103 (85.8%) |
| 6 or 7 Rooms | 74 (26.8%) | 6 (5.0%) |
| 8 or more Rooms | 100 (36.2%) | 0 (0.0%) |
| Total | 276 (100.0%) | 120 (100.0%) |
Housing Structure by Heating Type in Park City
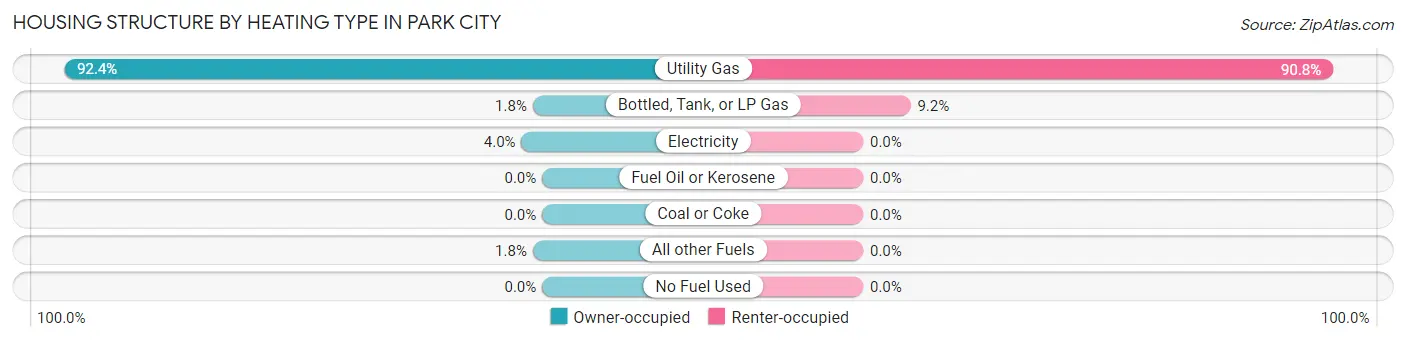
| Heating Type | Owner-occupied | Renter-occupied |
| Utility Gas | 255 (92.4%) | 109 (90.8%) |
| Bottled, Tank, or LP Gas | 5 (1.8%) | 11 (9.2%) |
| Electricity | 11 (4.0%) | 0 (0.0%) |
| Fuel Oil or Kerosene | 0 (0.0%) | 0 (0.0%) |
| Coal or Coke | 0 (0.0%) | 0 (0.0%) |
| All other Fuels | 5 (1.8%) | 0 (0.0%) |
| No Fuel Used | 0 (0.0%) | 0 (0.0%) |
| Total | 276 (100.0%) | 120 (100.0%) |
Household Vehicle Usage in Park City
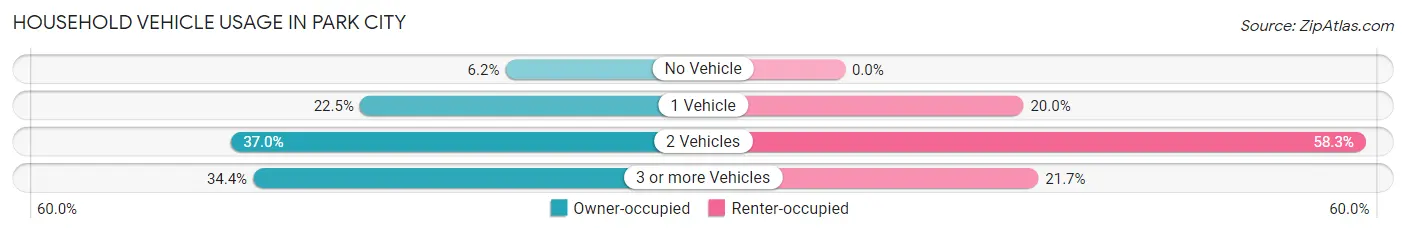
| Vehicles per Household | Owner-occupied | Renter-occupied |
| No Vehicle | 17 (6.2%) | 0 (0.0%) |
| 1 Vehicle | 62 (22.5%) | 24 (20.0%) |
| 2 Vehicles | 102 (37.0%) | 70 (58.3%) |
| 3 or more Vehicles | 95 (34.4%) | 26 (21.7%) |
| Total | 276 (100.0%) | 120 (100.0%) |
Real Estate & Mortgages in Park City
Real Estate and Mortgage Overview in Park City
| Characteristic | Without Mortgage | With Mortgage |
| Housing Units | 115 | 161 |
| Median Property Value | $241,400 | $209,100 |
| Median Household Income | $78,828 | $0 |
| Monthly Housing Costs | $460 | $0 |
| Real Estate Taxes | $1,709 | $0 |
Property Value by Mortgage Status in Park City
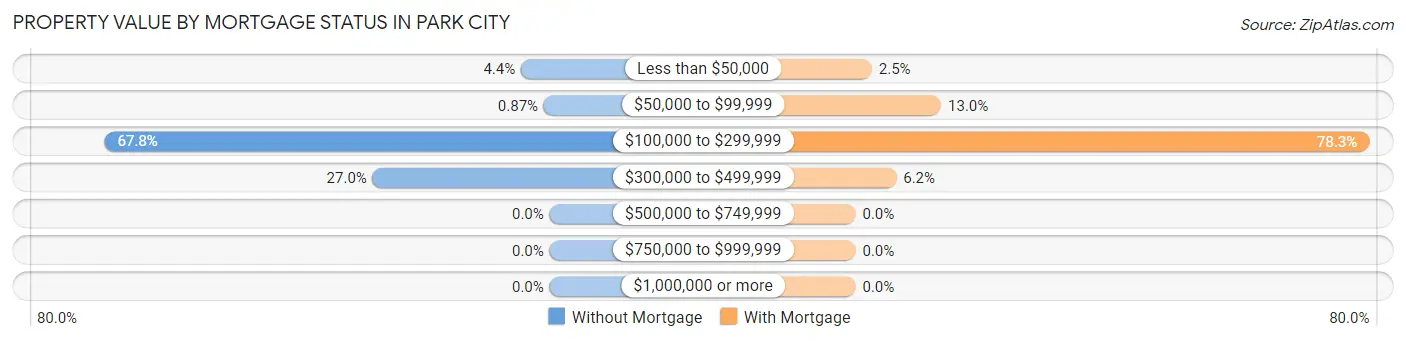
| Property Value | Without Mortgage | With Mortgage |
| Less than $50,000 | 5 (4.3%) | 4 (2.5%) |
| $50,000 to $99,999 | 1 (0.9%) | 21 (13.0%) |
| $100,000 to $299,999 | 78 (67.8%) | 126 (78.3%) |
| $300,000 to $499,999 | 31 (27.0%) | 10 (6.2%) |
| $500,000 to $749,999 | 0 (0.0%) | 0 (0.0%) |
| $750,000 to $999,999 | 0 (0.0%) | 0 (0.0%) |
| $1,000,000 or more | 0 (0.0%) | 0 (0.0%) |
| Total | 115 (100.0%) | 161 (100.0%) |
Household Income by Mortgage Status in Park City
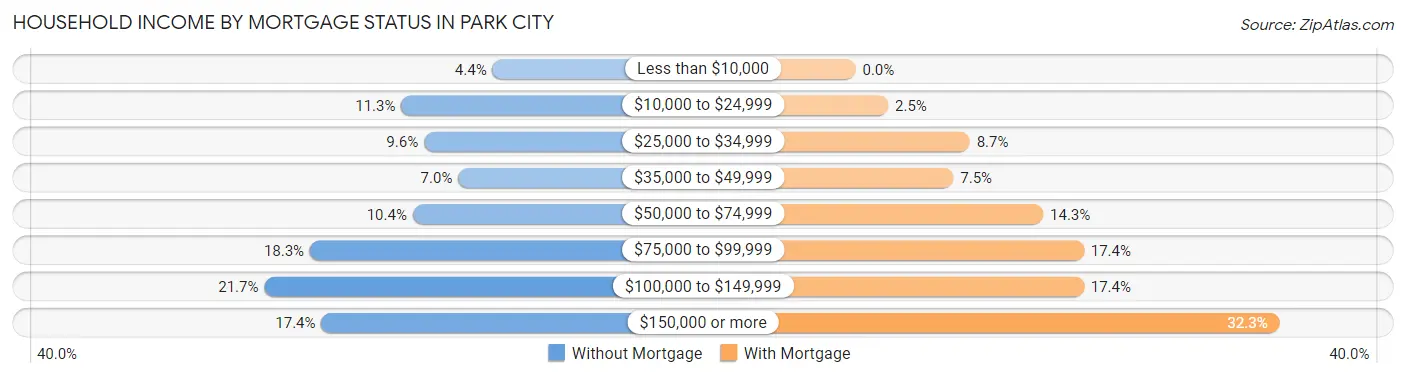
| Household Income | Without Mortgage | With Mortgage |
| Less than $10,000 | 5 (4.3%) | 0 (0.0%) |
| $10,000 to $24,999 | 13 (11.3%) | 4 (2.5%) |
| $25,000 to $34,999 | 11 (9.6%) | 14 (8.7%) |
| $35,000 to $49,999 | 8 (7.0%) | 12 (7.4%) |
| $50,000 to $74,999 | 12 (10.4%) | 23 (14.3%) |
| $75,000 to $99,999 | 21 (18.3%) | 28 (17.4%) |
| $100,000 to $149,999 | 25 (21.7%) | 28 (17.4%) |
| $150,000 or more | 20 (17.4%) | 52 (32.3%) |
| Total | 115 (100.0%) | 161 (100.0%) |
Property Value to Household Income Ratio in Park City
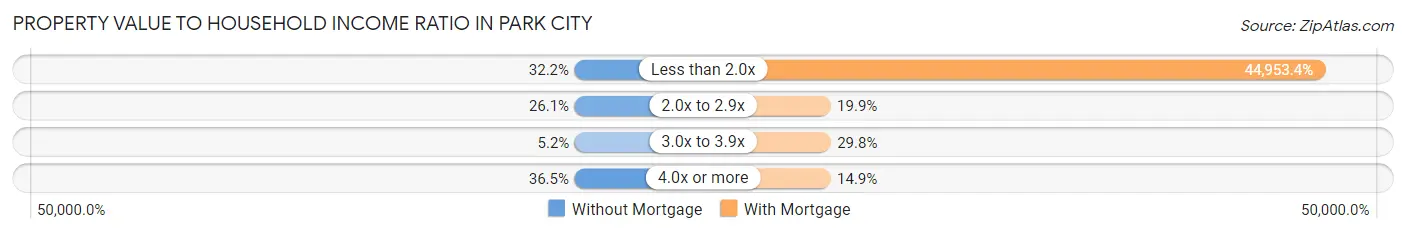
| Value-to-Income Ratio | Without Mortgage | With Mortgage |
| Less than 2.0x | 37 (32.2%) | 72,375 (44,953.4%) |
| 2.0x to 2.9x | 30 (26.1%) | 32 (19.9%) |
| 3.0x to 3.9x | 6 (5.2%) | 48 (29.8%) |
| 4.0x or more | 42 (36.5%) | 24 (14.9%) |
| Total | 115 (100.0%) | 161 (100.0%) |
Real Estate Taxes by Mortgage Status in Park City
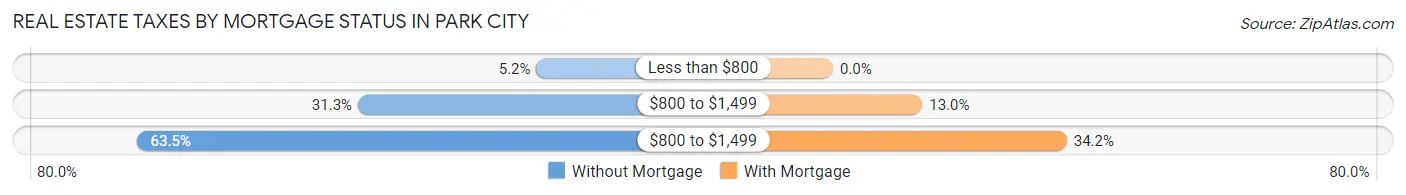
| Property Taxes | Without Mortgage | With Mortgage |
| Less than $800 | 6 (5.2%) | 0 (0.0%) |
| $800 to $1,499 | 36 (31.3%) | 21 (13.0%) |
| $800 to $1,499 | 73 (63.5%) | 55 (34.2%) |
| Total | 115 (100.0%) | 161 (100.0%) |
Health & Disability in Park City
Health Insurance Coverage by Age in Park City
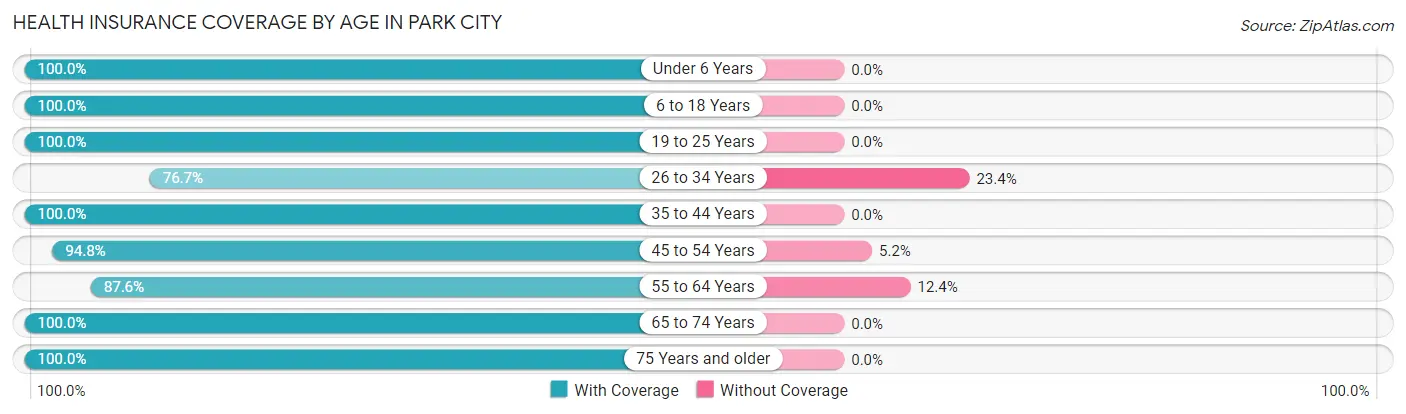
| Age Bracket | With Coverage | Without Coverage |
| Under 6 Years | 72 (100.0%) | 0 (0.0%) |
| 6 to 18 Years | 209 (100.0%) | 0 (0.0%) |
| 19 to 25 Years | 78 (100.0%) | 0 (0.0%) |
| 26 to 34 Years | 151 (76.6%) | 46 (23.4%) |
| 35 to 44 Years | 98 (100.0%) | 0 (0.0%) |
| 45 to 54 Years | 128 (94.8%) | 7 (5.2%) |
| 55 to 64 Years | 78 (87.6%) | 11 (12.4%) |
| 65 to 74 Years | 82 (100.0%) | 0 (0.0%) |
| 75 Years and older | 62 (100.0%) | 0 (0.0%) |
| Total | 958 (93.7%) | 64 (6.3%) |
Health Insurance Coverage by Citizenship Status in Park City
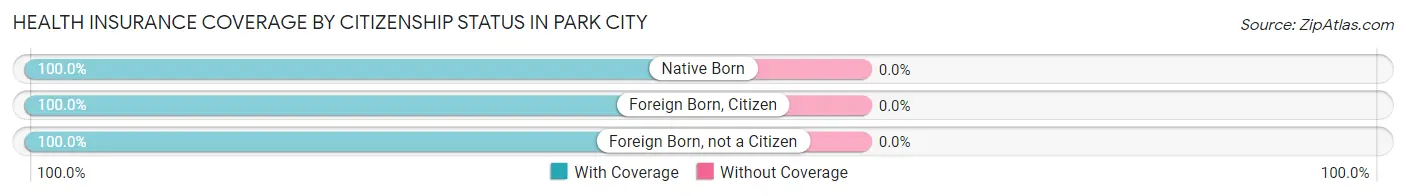
| Citizenship Status | With Coverage | Without Coverage |
| Native Born | 72 (100.0%) | 0 (0.0%) |
| Foreign Born, Citizen | 209 (100.0%) | 0 (0.0%) |
| Foreign Born, not a Citizen | 78 (100.0%) | 0 (0.0%) |
Health Insurance Coverage by Household Income in Park City
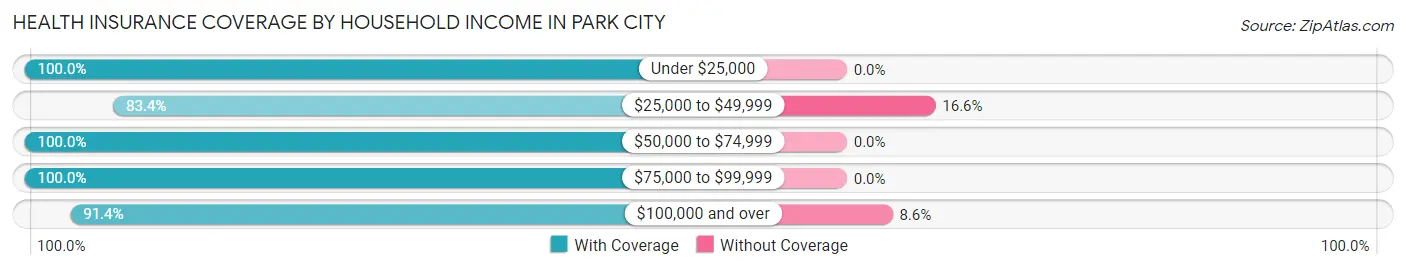
| Household Income | With Coverage | Without Coverage |
| Under $25,000 | 40 (100.0%) | 0 (0.0%) |
| $25,000 to $49,999 | 181 (83.4%) | 36 (16.6%) |
| $50,000 to $74,999 | 210 (100.0%) | 0 (0.0%) |
| $75,000 to $99,999 | 228 (100.0%) | 0 (0.0%) |
| $100,000 and over | 299 (91.4%) | 28 (8.6%) |
Public vs Private Health Insurance Coverage by Age in Park City
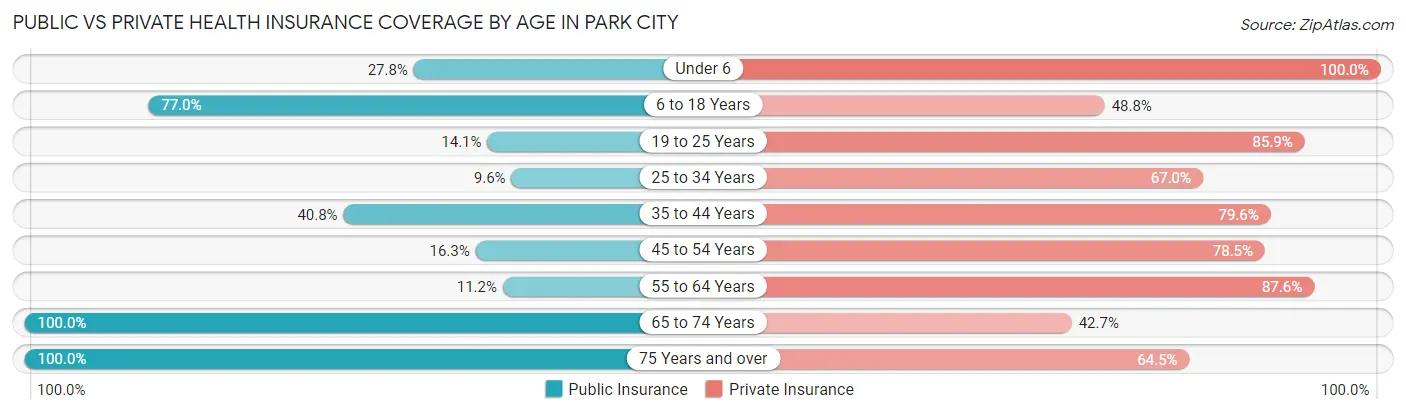
| Age Bracket | Public Insurance | Private Insurance |
| Under 6 | 20 (27.8%) | 72 (100.0%) |
| 6 to 18 Years | 161 (77.0%) | 102 (48.8%) |
| 19 to 25 Years | 11 (14.1%) | 67 (85.9%) |
| 25 to 34 Years | 19 (9.6%) | 132 (67.0%) |
| 35 to 44 Years | 40 (40.8%) | 78 (79.6%) |
| 45 to 54 Years | 22 (16.3%) | 106 (78.5%) |
| 55 to 64 Years | 10 (11.2%) | 78 (87.6%) |
| 65 to 74 Years | 82 (100.0%) | 35 (42.7%) |
| 75 Years and over | 62 (100.0%) | 40 (64.5%) |
| Total | 427 (41.8%) | 710 (69.5%) |
Disability Status by Sex by Age in Park City
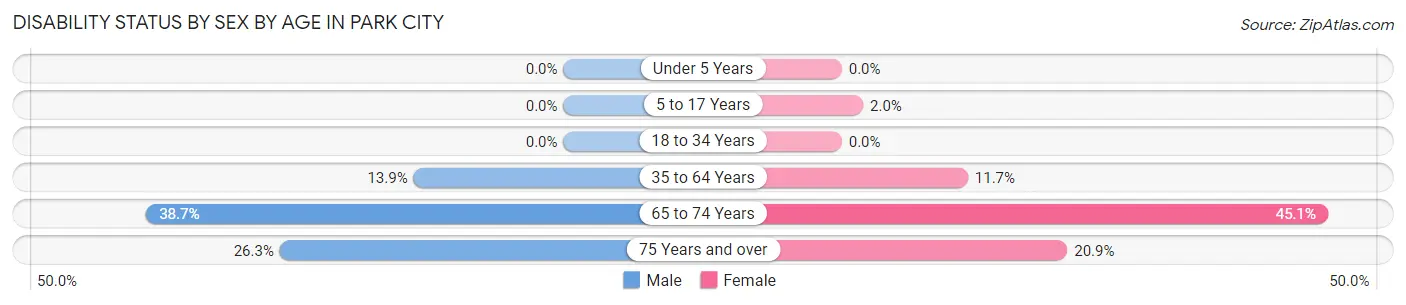
| Age Bracket | Male | Female |
| Under 5 Years | 0 (0.0%) | 0 (0.0%) |
| 5 to 17 Years | 0 (0.0%) | 2 (2.0%) |
| 18 to 34 Years | 0 (0.0%) | 0 (0.0%) |
| 35 to 64 Years | 21 (13.9%) | 20 (11.7%) |
| 65 to 74 Years | 12 (38.7%) | 23 (45.1%) |
| 75 Years and over | 5 (26.3%) | 9 (20.9%) |
Disability Class by Sex by Age in Park City
Disability Class: Hearing Difficulty
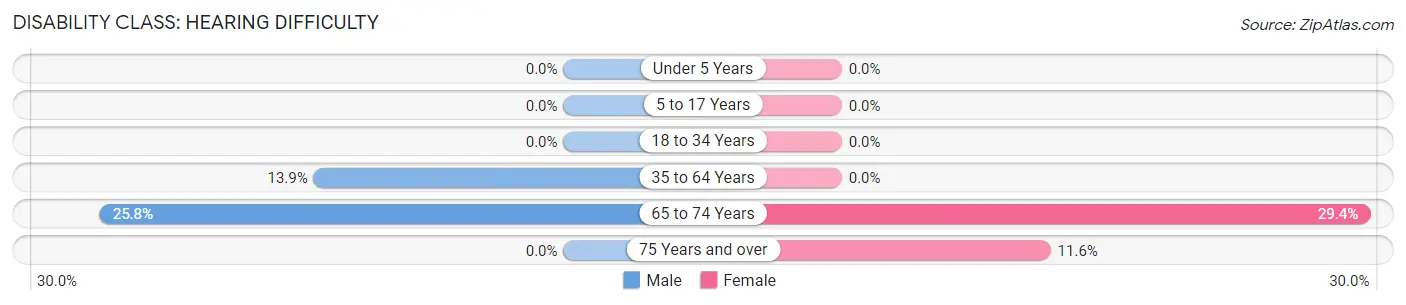
| Age Bracket | Male | Female |
| Under 5 Years | 0 (0.0%) | 0 (0.0%) |
| 5 to 17 Years | 0 (0.0%) | 0 (0.0%) |
| 18 to 34 Years | 0 (0.0%) | 0 (0.0%) |
| 35 to 64 Years | 21 (13.9%) | 0 (0.0%) |
| 65 to 74 Years | 8 (25.8%) | 15 (29.4%) |
| 75 Years and over | 0 (0.0%) | 5 (11.6%) |
Disability Class: Vision Difficulty
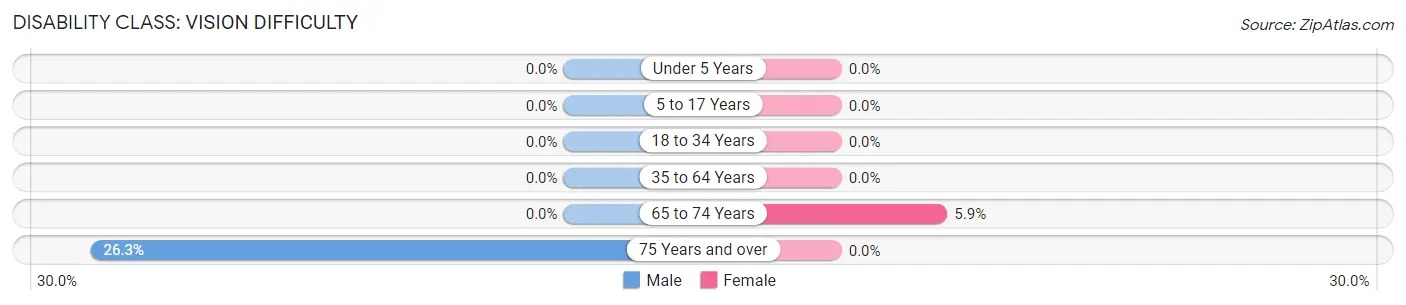
| Age Bracket | Male | Female |
| Under 5 Years | 0 (0.0%) | 0 (0.0%) |
| 5 to 17 Years | 0 (0.0%) | 0 (0.0%) |
| 18 to 34 Years | 0 (0.0%) | 0 (0.0%) |
| 35 to 64 Years | 0 (0.0%) | 0 (0.0%) |
| 65 to 74 Years | 0 (0.0%) | 3 (5.9%) |
| 75 Years and over | 5 (26.3%) | 0 (0.0%) |
Disability Class: Cognitive Difficulty
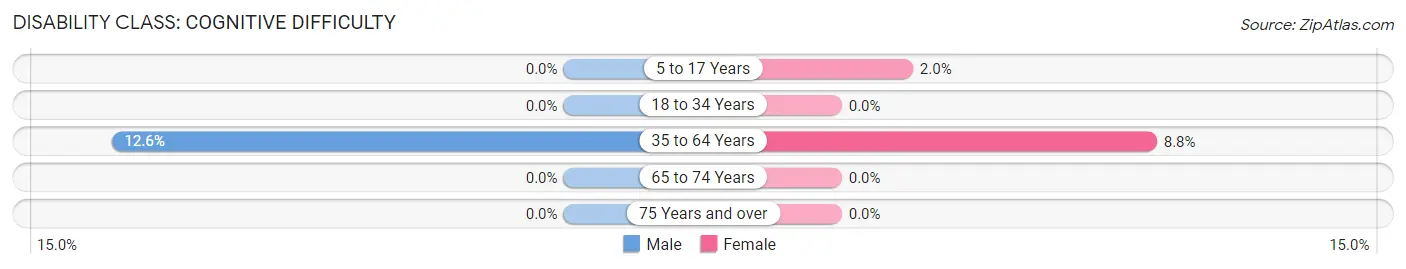
| Age Bracket | Male | Female |
| 5 to 17 Years | 0 (0.0%) | 2 (2.0%) |
| 18 to 34 Years | 0 (0.0%) | 0 (0.0%) |
| 35 to 64 Years | 19 (12.6%) | 15 (8.8%) |
| 65 to 74 Years | 0 (0.0%) | 0 (0.0%) |
| 75 Years and over | 0 (0.0%) | 0 (0.0%) |
Disability Class: Ambulatory Difficulty
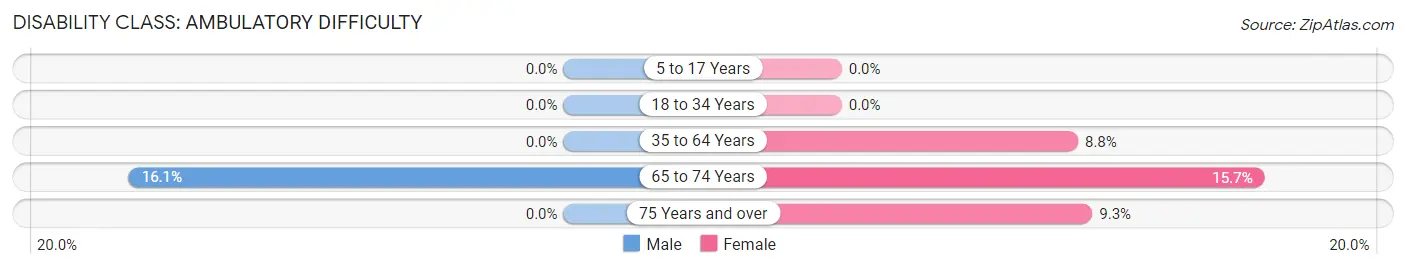
| Age Bracket | Male | Female |
| 5 to 17 Years | 0 (0.0%) | 0 (0.0%) |
| 18 to 34 Years | 0 (0.0%) | 0 (0.0%) |
| 35 to 64 Years | 0 (0.0%) | 15 (8.8%) |
| 65 to 74 Years | 5 (16.1%) | 8 (15.7%) |
| 75 Years and over | 0 (0.0%) | 4 (9.3%) |
Disability Class: Self-Care Difficulty
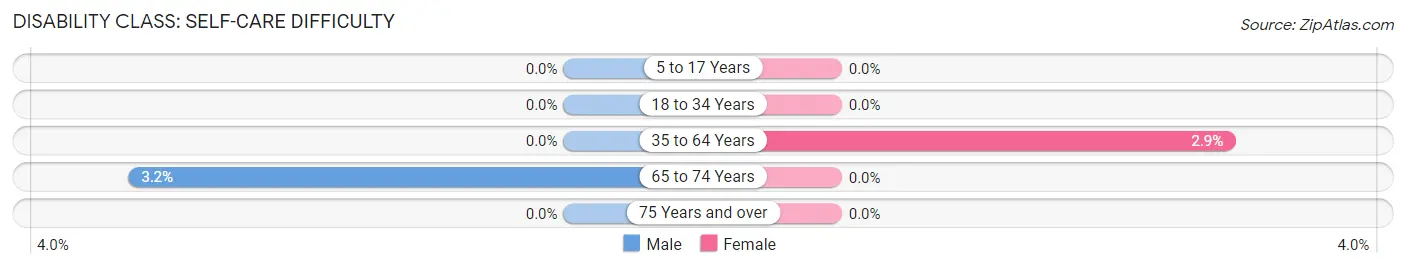
| Age Bracket | Male | Female |
| 5 to 17 Years | 0 (0.0%) | 0 (0.0%) |
| 18 to 34 Years | 0 (0.0%) | 0 (0.0%) |
| 35 to 64 Years | 0 (0.0%) | 5 (2.9%) |
| 65 to 74 Years | 1 (3.2%) | 0 (0.0%) |
| 75 Years and over | 0 (0.0%) | 0 (0.0%) |
Technology Access in Park City
Computing Device Access in Park City
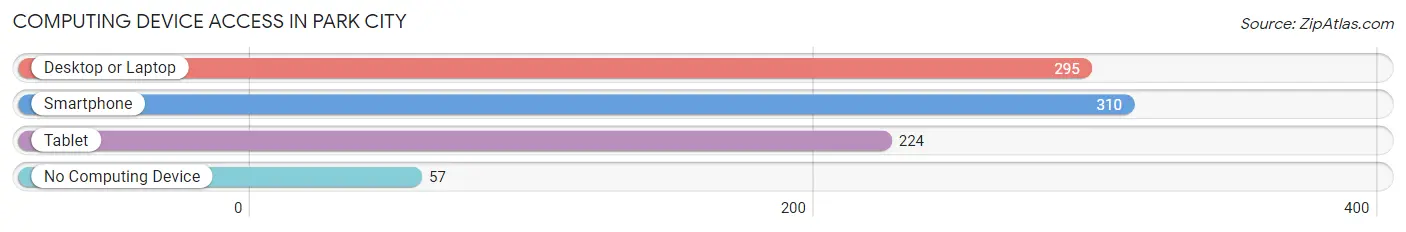
| Device Type | # Households | % Households |
| Desktop or Laptop | 295 | 74.5% |
| Smartphone | 310 | 78.3% |
| Tablet | 224 | 56.6% |
| No Computing Device | 57 | 14.4% |
| Total | 396 | 100.0% |
Internet Access in Park City
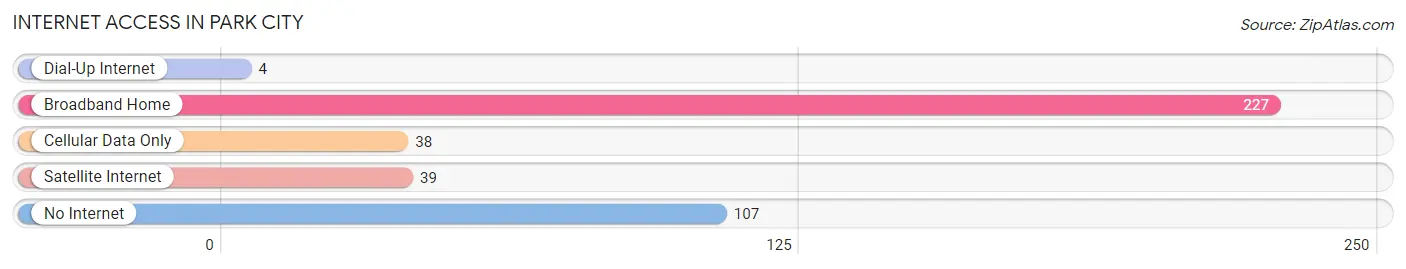
| Internet Type | # Households | % Households |
| Dial-Up Internet | 4 | 1.0% |
| Broadband Home | 227 | 57.3% |
| Cellular Data Only | 38 | 9.6% |
| Satellite Internet | 39 | 9.9% |
| No Internet | 107 | 27.0% |
| Total | 396 | 100.0% |
Park City Summary
Park City, Montana is a small town located in the western part of the state, near the Idaho border. It is situated in the Rocky Mountains, and is surrounded by the Beaverhead-Deerlodge National Forest. The town has a population of just over 1,000 people, and is the county seat of Park County.
History
Park City was founded in 1883 by a group of miners who were looking for gold in the area. The town was originally called “Park”, but was later changed to Park City when the post office was established in 1884. The town quickly grew, and by the early 1900s, it had become a bustling mining town with a population of over 1,000 people.
The town was home to several large mining companies, including the Park City Mining Company, which operated until the early 1940s. The town also had a large lumber industry, and was home to several sawmills.
In the 1950s, the town began to decline as the mining industry began to decline. The sawmills also closed, and the population began to dwindle. In the 1970s, the town was revitalized when the nearby ski resort, Big Sky, opened. This brought a new influx of tourists to the area, and the town began to grow again.
Geography
Park City is located in the western part of Montana, near the Idaho border. It is situated in the Rocky Mountains, and is surrounded by the Beaverhead-Deerlodge National Forest. The town is located at an elevation of 4,890 feet, and has a total area of 1.2 square miles.
The town is located in a valley, and is surrounded by mountains on all sides. The nearest major city is Missoula, which is located about 90 miles to the east. The nearest airport is in Bozeman, which is about 60 miles to the south.
Economy
The economy of Park City is largely based on tourism. The town is home to the Big Sky ski resort, which attracts thousands of visitors each year. The resort also provides jobs for many of the town’s residents.
In addition to tourism, the town also has a small manufacturing sector. There are several small businesses in the area, including a furniture factory, a woodworking shop, and a metal fabrication shop.
Demographics
As of the 2010 census, the population of Park City was 1,072. The town has a median age of 44.7 years, and a median household income of $41,250. The town is predominantly white, with 92.3% of the population identifying as such. The town also has a small Hispanic population, with 4.3% of the population identifying as Hispanic or Latino.
Park City is a small town with a rich history and a vibrant economy. It is a great place to live, work, and play, and is a great place to visit. With its beautiful scenery and friendly people, Park City is a great place to call home.
Common Questions
What is the Total Population of Park City?
Total Population of Park City is 1,022.
What is the Total Male Population of Park City?
Total Male Population of Park City is 474.
What is the Total Female Population of Park City?
Total Female Population of Park City is 548.
What is the Ratio of Males per 100 Females in Park City?
There are 86.50 Males per 100 Females in Park City.
What is the Ratio of Females per 100 Males in Park City?
There are 115.61 Females per 100 Males in Park City.
What is the Median Population Age in Park City?
Median Population Age in Park City is 32.6 Years.
What is the Average Family Size in Park City
Average Family Size in Park City is 2.9 People.
What is the Average Household Size in Park City
Average Household Size in Park City is 2.6 People.
What is Per Capita Income in Park City?
Per Capita income in Park City is $28,342.
What is the Median Family Income in Park City?
Median Family Income in Park City is $79,122.
What is the Median Household income in Park City?
Median Household Income in Park City is $61,875.
What is Income or Wage Gap in Park City?
Income or Wage Gap in Park City is 18.4%.
Women in Park City earn 81.6 cents for every dollar earned by a man.
What is Inequality or Gini Index in Park City?
Inequality or Gini Index in Park City is 0.33.
How Large is the Labor Force in Park City?
There are 507 People in the Labor Forcein in Park City.
What is the Percentage of People in the Labor Force in Park City?
66.8% of People are in the Labor Force in Park City.
What is the Unemployment Rate in Park City?
Unemployment Rate in Park City is 2.2%.