Huntley, MT Map & Demographics
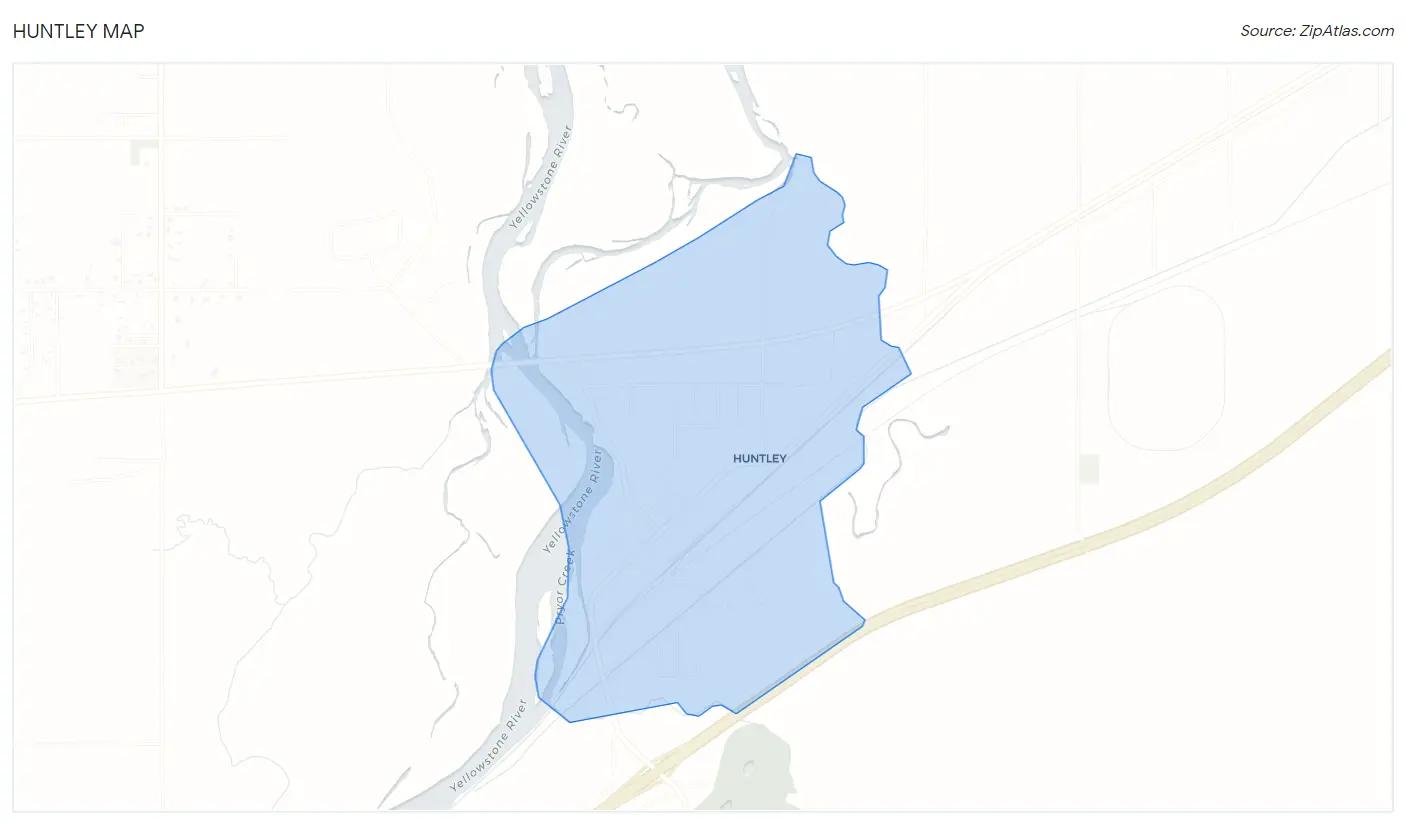
Huntley Map
Huntley Overview
$22,613
PER CAPITA INCOME
$46,292
AVG FAMILY INCOME
$46,604
AVG HOUSEHOLD INCOME
92.5%
WAGE / INCOME GAP [ % ]
7.5¢/ $1
WAGE / INCOME GAP [ $ ]
0.28
INEQUALITY / GINI INDEX
380
TOTAL POPULATION
204
MALE POPULATION
176
FEMALE POPULATION
115.91
MALES / 100 FEMALES
86.27
FEMALES / 100 MALES
38.1
MEDIAN AGE
2.5
AVG FAMILY SIZE
2.4
AVG HOUSEHOLD SIZE
122
LABOR FORCE [ PEOPLE ]
43.6%
PERCENT IN LABOR FORCE
Huntley Zip Codes
Huntley Area Codes
Income in Huntley
Income Overview in Huntley
Per Capita Income in Huntley is $22,613, while median incomes of families and households are $46,292 and $46,604 respectively.
| Characteristic | Number | Measure |
| Per Capita Income | 380 | $22,613 |
| Median Family Income | 130 | $46,292 |
| Mean Family Income | 130 | $58,548 |
| Median Household Income | 159 | $46,604 |
| Mean Household Income | 159 | $56,626 |
| Income Deficit | 130 | $0 |
| Wage / Income Gap (%) | 380 | 92.46% |
| Wage / Income Gap ($) | 380 | 7.54¢ per $1 |
| Gini / Inequality Index | 380 | 0.28 |
Earnings by Sex in Huntley
Average Earnings in Huntley are $23,409, $33,160 for men and $2,499 for women, a difference of 92.5%.
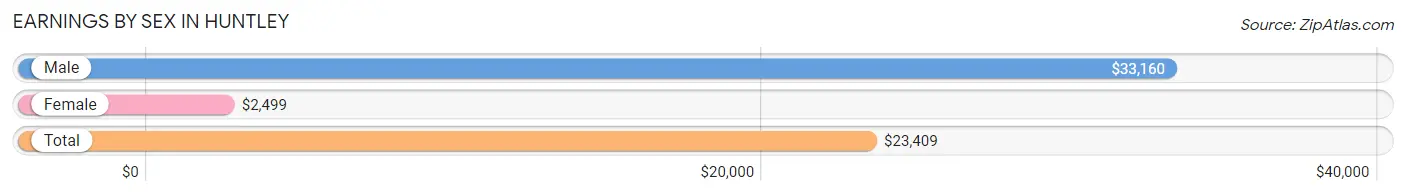
| Sex | Number | Average Earnings |
| Male | 122 (53.5%) | $33,160 |
| Female | 106 (46.5%) | $2,499 |
| Total | 228 (100.0%) | $23,409 |
Earnings by Sex by Income Bracket in Huntley
The most common earnings brackets in Huntley are $30,000 to $34,999 for men (53 | 43.4%) and $2,499 or less for women (60 | 56.6%).
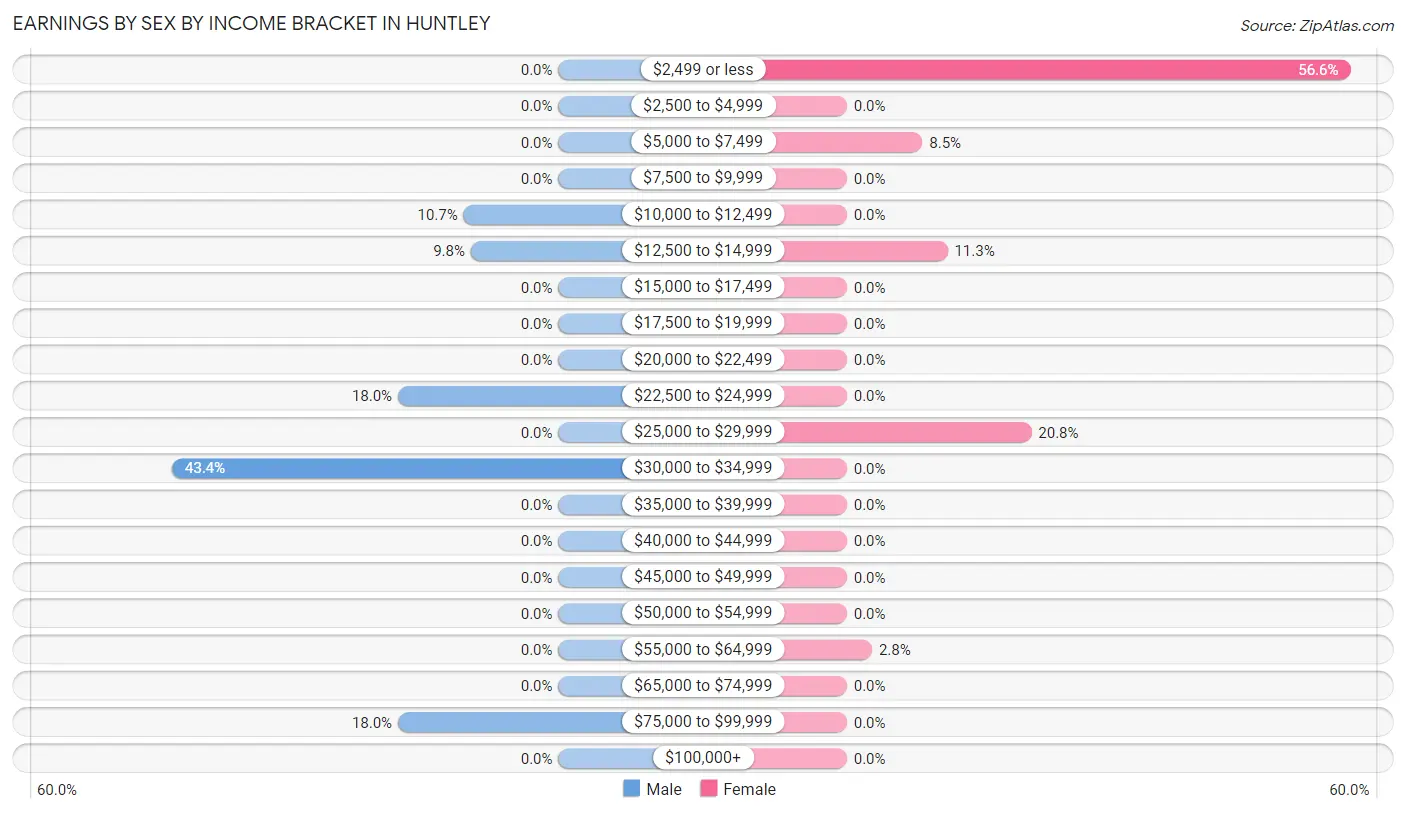
| Income | Male | Female |
| $2,499 or less | 0 (0.0%) | 60 (56.6%) |
| $2,500 to $4,999 | 0 (0.0%) | 0 (0.0%) |
| $5,000 to $7,499 | 0 (0.0%) | 9 (8.5%) |
| $7,500 to $9,999 | 0 (0.0%) | 0 (0.0%) |
| $10,000 to $12,499 | 13 (10.7%) | 0 (0.0%) |
| $12,500 to $14,999 | 12 (9.8%) | 12 (11.3%) |
| $15,000 to $17,499 | 0 (0.0%) | 0 (0.0%) |
| $17,500 to $19,999 | 0 (0.0%) | 0 (0.0%) |
| $20,000 to $22,499 | 0 (0.0%) | 0 (0.0%) |
| $22,500 to $24,999 | 22 (18.0%) | 0 (0.0%) |
| $25,000 to $29,999 | 0 (0.0%) | 22 (20.7%) |
| $30,000 to $34,999 | 53 (43.4%) | 0 (0.0%) |
| $35,000 to $39,999 | 0 (0.0%) | 0 (0.0%) |
| $40,000 to $44,999 | 0 (0.0%) | 0 (0.0%) |
| $45,000 to $49,999 | 0 (0.0%) | 0 (0.0%) |
| $50,000 to $54,999 | 0 (0.0%) | 0 (0.0%) |
| $55,000 to $64,999 | 0 (0.0%) | 3 (2.8%) |
| $65,000 to $74,999 | 0 (0.0%) | 0 (0.0%) |
| $75,000 to $99,999 | 22 (18.0%) | 0 (0.0%) |
| $100,000+ | 0 (0.0%) | 0 (0.0%) |
| Total | 122 (100.0%) | 106 (100.0%) |
Earnings by Sex by Educational Attainment in Huntley
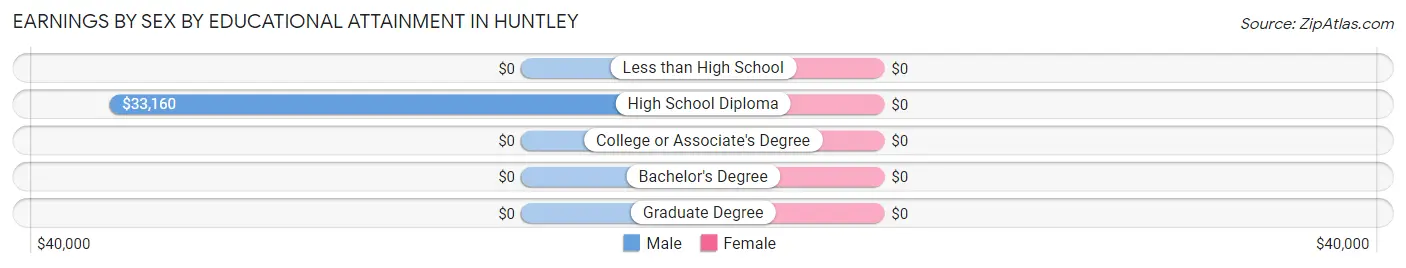
| Educational Attainment | Male Income | Female Income |
| Less than High School | - | - |
| High School Diploma | $33,160 | $0 |
| College or Associate's Degree | - | - |
| Bachelor's Degree | - | - |
| Graduate Degree | - | - |
| Total | $33,160 | $2,499 |
Family Income in Huntley
Family Income Brackets in Huntley
According to the Huntley family income data, there are 72 families falling into the $35,000 to $49,999 income range, which is the most common income bracket and makes up 55.4% of all families.
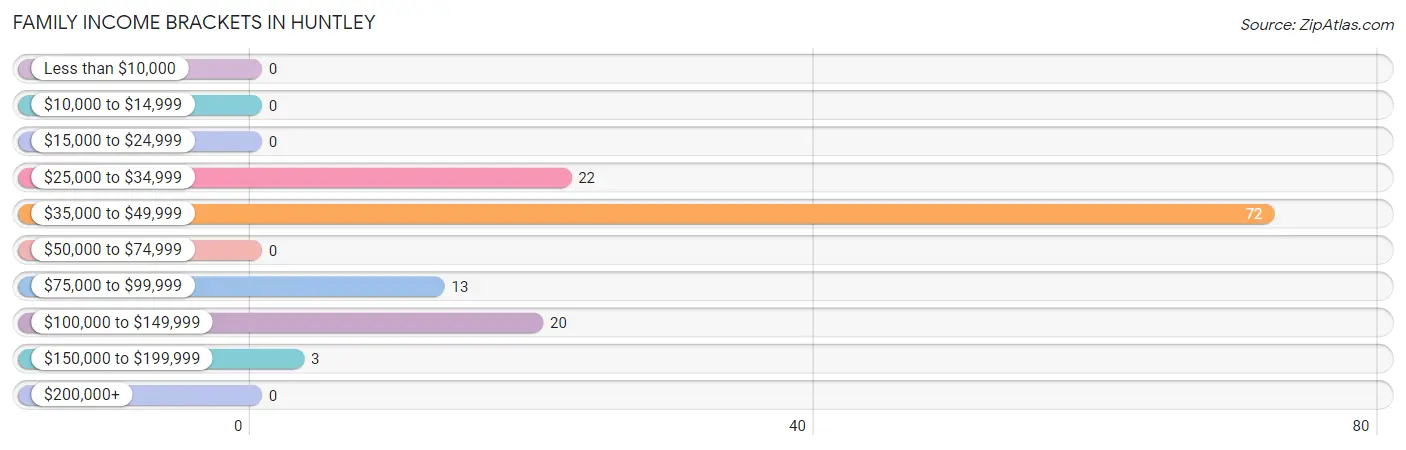
| Income Bracket | # Families | % Families |
| Less than $10,000 | 0 | 0.0% |
| $10,000 to $14,999 | 0 | 0.0% |
| $15,000 to $24,999 | 0 | 0.0% |
| $25,000 to $34,999 | 22 | 16.9% |
| $35,000 to $49,999 | 72 | 55.4% |
| $50,000 to $74,999 | 0 | 0.0% |
| $75,000 to $99,999 | 13 | 10.0% |
| $100,000 to $149,999 | 20 | 15.4% |
| $150,000 to $199,999 | 3 | 2.3% |
| $200,000+ | 0 | 0.0% |
Family Income by Famaliy Size in Huntley
| Income Bracket | # Families | Median Income |
| 2-Person Families | 70 (53.8%) | $0 |
| 3-Person Families | 0 (0.0%) | $0 |
| 4-Person Families | 60 (46.2%) | $0 |
| 5-Person Families | 0 (0.0%) | $0 |
| 6-Person Families | 0 (0.0%) | $0 |
| 7+ Person Families | 0 (0.0%) | $0 |
| Total | 130 (100.0%) | $46,292 |
Family Income by Number of Earners in Huntley
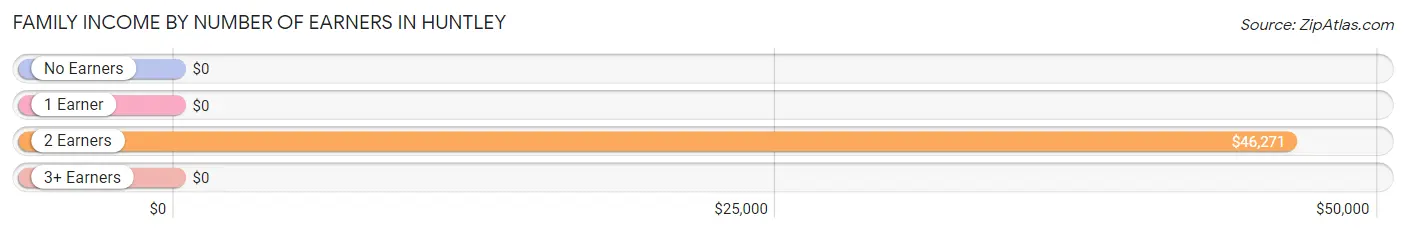
| Number of Earners | # Families | Median Income |
| No Earners | 0 (0.0%) | $0 |
| 1 Earner | 45 (34.6%) | $0 |
| 2 Earners | 85 (65.4%) | $46,271 |
| 3+ Earners | 0 (0.0%) | $0 |
| Total | 130 (100.0%) | $46,292 |
Household Income in Huntley
Household Income Brackets in Huntley
With 72 households falling in the category, the $35,000 to $49,999 income range is the most frequent in Huntley, accounting for 45.3% of all households.
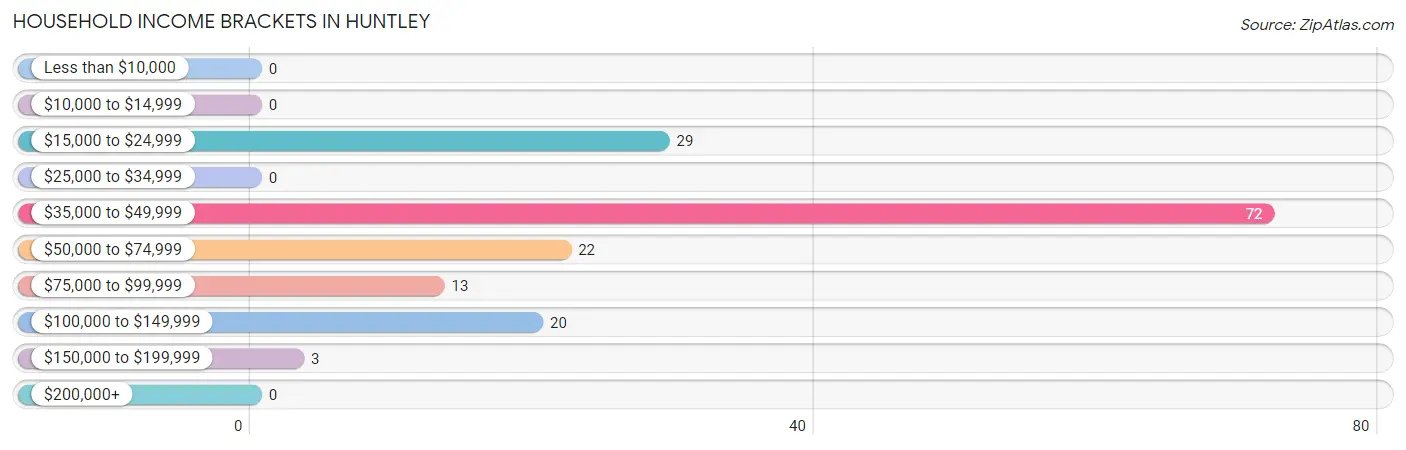
| Income Bracket | # Households | % Households |
| Less than $10,000 | 0 | 0.0% |
| $10,000 to $14,999 | 0 | 0.0% |
| $15,000 to $24,999 | 29 | 18.2% |
| $25,000 to $34,999 | 0 | 0.0% |
| $35,000 to $49,999 | 72 | 45.3% |
| $50,000 to $74,999 | 22 | 13.8% |
| $75,000 to $99,999 | 13 | 8.2% |
| $100,000 to $149,999 | 20 | 12.6% |
| $150,000 to $199,999 | 3 | 1.9% |
| $200,000+ | 0 | 0.0% |
Household Income by Householder Age in Huntley
The median household income in Huntley is $46,604, with the highest median household income of $110,375 found in the 45 to 64 years age bracket for the primary householder. A total of 23 households (14.5%) fall into this category.
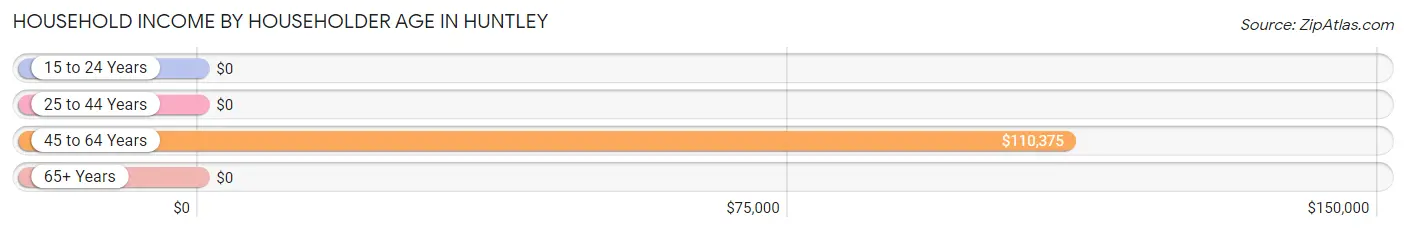
| Income Bracket | # Households | Median Income |
| 15 to 24 Years | 0 (0.0%) | $0 |
| 25 to 44 Years | 82 (51.6%) | $0 |
| 45 to 64 Years | 23 (14.5%) | $110,375 |
| 65+ Years | 54 (34.0%) | $0 |
| Total | 159 (100.0%) | $46,604 |
Poverty in Huntley
Income Below Poverty by Sex and Age in Huntley
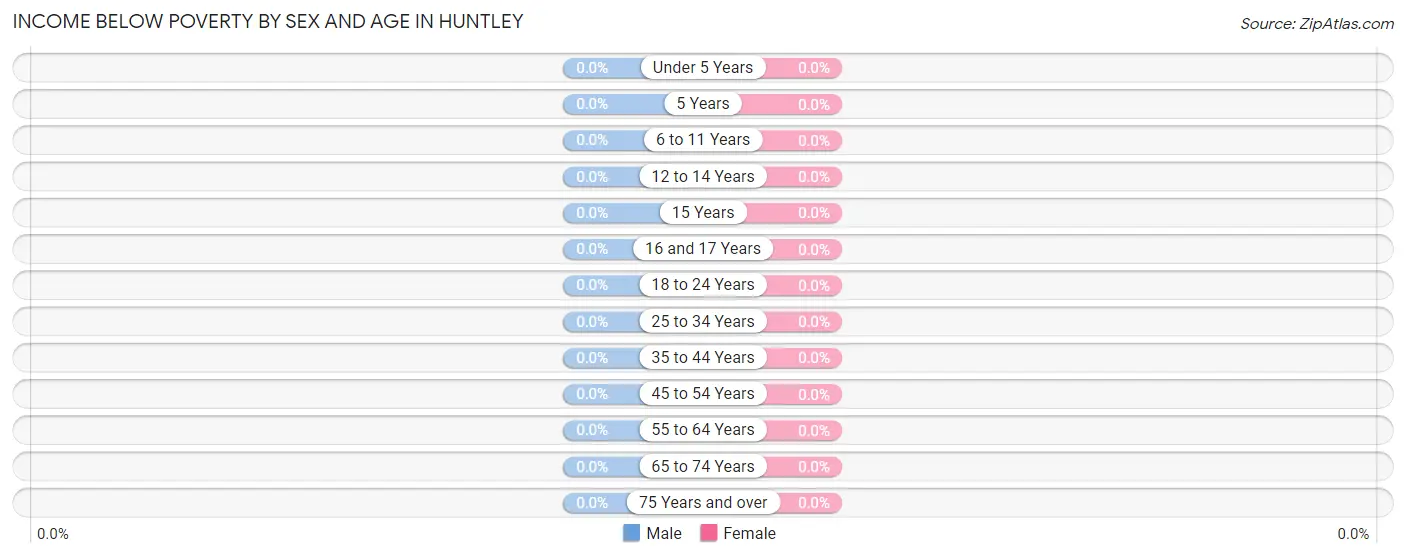
| Age Bracket | Male | Female |
| Under 5 Years | 0 (0.0%) | 0 (0.0%) |
| 5 Years | 0 (0.0%) | 0 (0.0%) |
| 6 to 11 Years | 0 (0.0%) | 0 (0.0%) |
| 12 to 14 Years | 0 (0.0%) | 0 (0.0%) |
| 15 Years | 0 (0.0%) | 0 (0.0%) |
| 16 and 17 Years | 0 (0.0%) | 0 (0.0%) |
| 18 to 24 Years | 0 (0.0%) | 0 (0.0%) |
| 25 to 34 Years | 0 (0.0%) | 0 (0.0%) |
| 35 to 44 Years | 0 (0.0%) | 0 (0.0%) |
| 45 to 54 Years | 0 (0.0%) | 0 (0.0%) |
| 55 to 64 Years | 0 (0.0%) | 0 (0.0%) |
| 65 to 74 Years | 0 (0.0%) | 0 (0.0%) |
| 75 Years and over | 0 (0.0%) | 0 (0.0%) |
| Total | 0 (0.0%) | 0 (0.0%) |
Income Above Poverty by Sex and Age in Huntley
According to the poverty statistics in Huntley, males aged under 5 years and females aged under 5 years are the age groups that are most secure financially, with 100.0% of males and 100.0% of females in these age groups living above the poverty line.
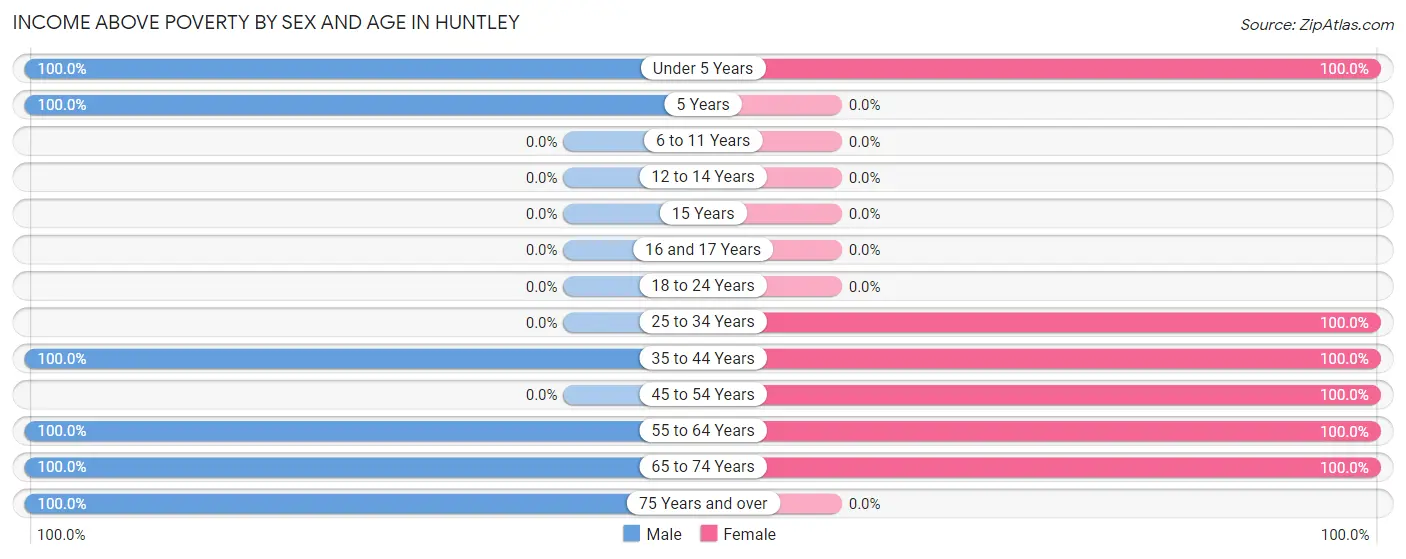
| Age Bracket | Male | Female |
| Under 5 Years | 21 (100.0%) | 47 (100.0%) |
| 5 Years | 32 (100.0%) | 0 (0.0%) |
| 6 to 11 Years | 0 (0.0%) | 0 (0.0%) |
| 12 to 14 Years | 0 (0.0%) | 0 (0.0%) |
| 15 Years | 0 (0.0%) | 0 (0.0%) |
| 16 and 17 Years | 0 (0.0%) | 0 (0.0%) |
| 18 to 24 Years | 0 (0.0%) | 0 (0.0%) |
| 25 to 34 Years | 0 (0.0%) | 60 (100.0%) |
| 35 to 44 Years | 75 (100.0%) | 22 (100.0%) |
| 45 to 54 Years | 0 (0.0%) | 9 (100.0%) |
| 55 to 64 Years | 22 (100.0%) | 25 (100.0%) |
| 65 to 74 Years | 25 (100.0%) | 13 (100.0%) |
| 75 Years and over | 29 (100.0%) | 0 (0.0%) |
| Total | 204 (100.0%) | 176 (100.0%) |
Income Below Poverty Among Married-Couple Families in Huntley
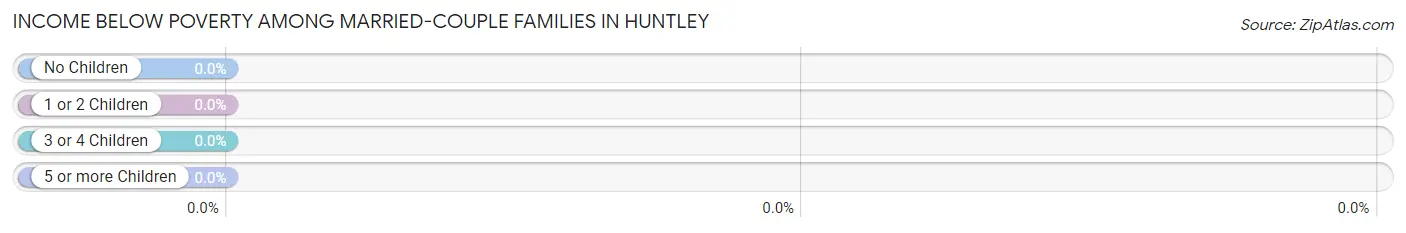
| Children | Above Poverty | Below Poverty |
| No Children | 48 (100.0%) | 0 (0.0%) |
| 1 or 2 Children | 60 (100.0%) | 0 (0.0%) |
| 3 or 4 Children | 0 (0.0%) | 0 (0.0%) |
| 5 or more Children | 0 (0.0%) | 0 (0.0%) |
| Total | 108 (100.0%) | 0 (0.0%) |
Income Below Poverty Among Single-Parent Households in Huntley
| Children | Single Father | Single Mother |
| No Children | 0 (0.0%) | 0 (0.0%) |
| 1 or 2 Children | 0 (0.0%) | 0 (0.0%) |
| 3 or 4 Children | 0 (0.0%) | 0 (0.0%) |
| 5 or more Children | 0 (0.0%) | 0 (0.0%) |
| Total | 0 (0.0%) | 0 (0.0%) |
Income Below Poverty Among Married-Couple vs Single-Parent Households in Huntley
| Children | Married-Couple Families | Single-Parent Households |
| No Children | 0 (0.0%) | 0 (0.0%) |
| 1 or 2 Children | 0 (0.0%) | 0 (0.0%) |
| 3 or 4 Children | 0 (0.0%) | 0 (0.0%) |
| 5 or more Children | 0 (0.0%) | 0 (0.0%) |
| Total | 0 (0.0%) | 0 (0.0%) |
Race in Huntley
The most populous races in Huntley are , and White / Caucasian (380 | 100.0%).
| Race | # Population | % Population |
| Asian | 0 | 0.0% |
| Black / African American | 0 | 0.0% |
| Hawaiian / Pacific | 0 | 0.0% |
| Hispanic or Latino | 0 | 0.0% |
| Native / Alaskan | 0 | 0.0% |
| White / Caucasian | 380 | 100.0% |
| Two or more Races | 0 | 0.0% |
| Some other Race | 0 | 0.0% |
| Total | 380 | 100.0% |
Ancestry in Huntley
The most populous ancestries reported in Huntley are German (186 | 48.9%), English (94 | 24.7%), Norwegian (53 | 14.0%), Swedish (53 | 14.0%), and Danish (41 | 10.8%), together accounting for 112.4% of all Huntley residents.
| Ancestry | # Population | % Population |
| Czech | 3 | 0.8% |
| Danish | 41 | 10.8% |
| English | 94 | 24.7% |
| German | 186 | 48.9% |
| Irish | 26 | 6.8% |
| Norwegian | 53 | 14.0% |
| Swedish | 53 | 14.0% | View All 7 Rows |
Immigrants in Huntley
The most numerous immigrant groups reported in Huntley came from Denmark (12 | 3.2%), Europe (12 | 3.2%), and Northern Europe (12 | 3.2%), together accounting for 9.5% of all Huntley residents.
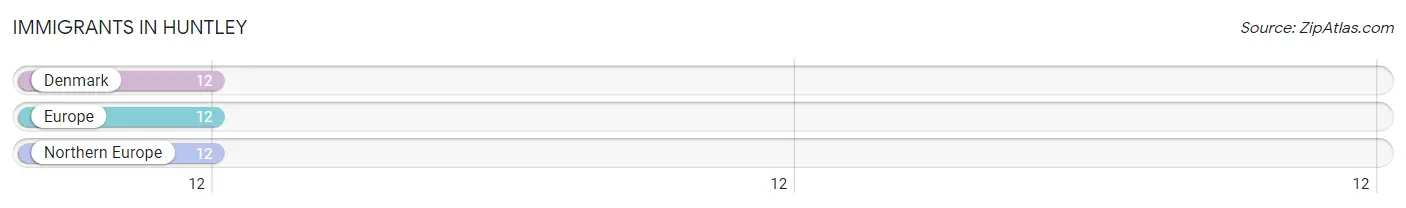
| Immigration Origin | # Population | % Population |
| Denmark | 12 | 3.2% |
| Europe | 12 | 3.2% |
| Northern Europe | 12 | 3.2% | View All 3 Rows |
Sex and Age in Huntley
Sex and Age in Huntley
The most populous age groups in Huntley are 35 to 39 Years (75 | 36.8%) for men and 30 to 34 Years (60 | 34.1%) for women.
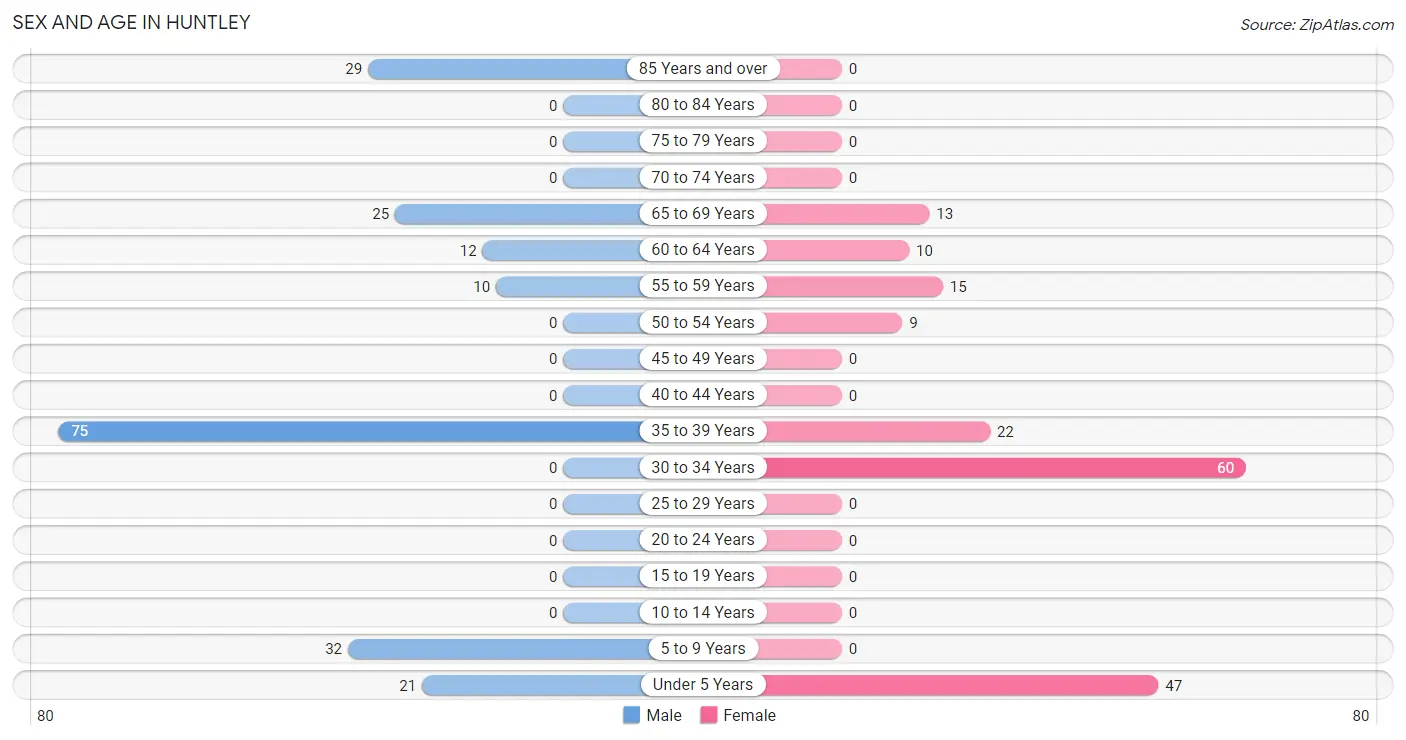
| Age Bracket | Male | Female |
| Under 5 Years | 21 (10.3%) | 47 (26.7%) |
| 5 to 9 Years | 32 (15.7%) | 0 (0.0%) |
| 10 to 14 Years | 0 (0.0%) | 0 (0.0%) |
| 15 to 19 Years | 0 (0.0%) | 0 (0.0%) |
| 20 to 24 Years | 0 (0.0%) | 0 (0.0%) |
| 25 to 29 Years | 0 (0.0%) | 0 (0.0%) |
| 30 to 34 Years | 0 (0.0%) | 60 (34.1%) |
| 35 to 39 Years | 75 (36.8%) | 22 (12.5%) |
| 40 to 44 Years | 0 (0.0%) | 0 (0.0%) |
| 45 to 49 Years | 0 (0.0%) | 0 (0.0%) |
| 50 to 54 Years | 0 (0.0%) | 9 (5.1%) |
| 55 to 59 Years | 10 (4.9%) | 15 (8.5%) |
| 60 to 64 Years | 12 (5.9%) | 10 (5.7%) |
| 65 to 69 Years | 25 (12.2%) | 13 (7.4%) |
| 70 to 74 Years | 0 (0.0%) | 0 (0.0%) |
| 75 to 79 Years | 0 (0.0%) | 0 (0.0%) |
| 80 to 84 Years | 0 (0.0%) | 0 (0.0%) |
| 85 Years and over | 29 (14.2%) | 0 (0.0%) |
| Total | 204 (100.0%) | 176 (100.0%) |
Families and Households in Huntley
Median Family Size in Huntley
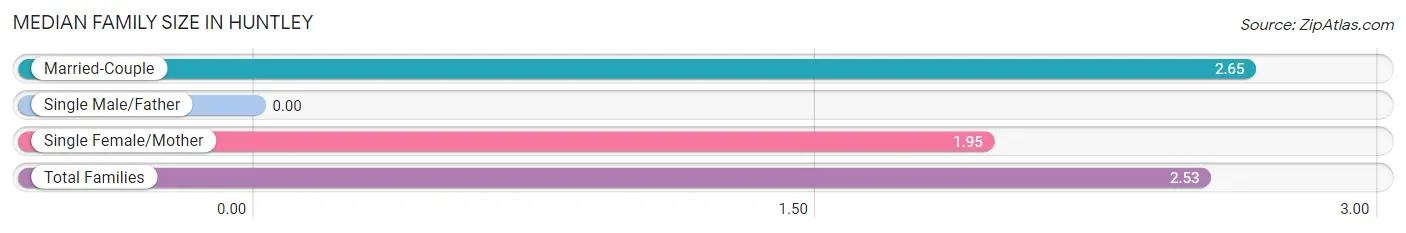
| Family Type | # Families | Family Size |
| Married-Couple | 108 (83.1%) | 2.65 |
| Single Male/Father | 0 (0.0%) | - |
| Single Female/Mother | 22 (16.9%) | 1.95 |
| Total Families | 130 (100.0%) | 2.53 |
Median Household Size in Huntley
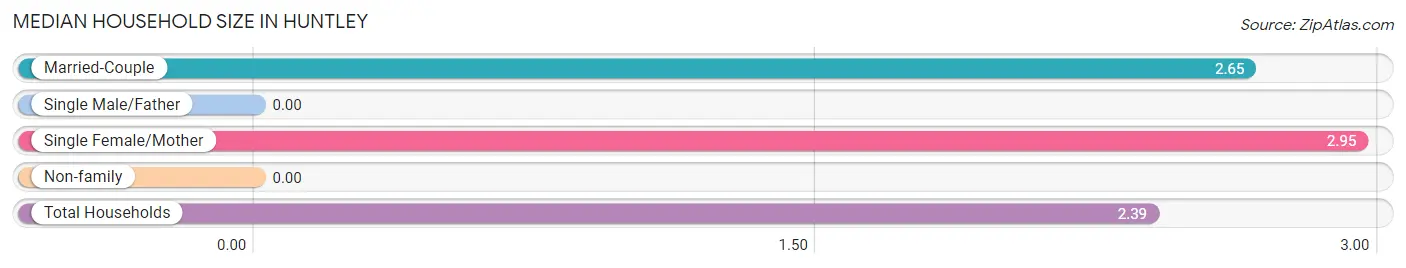
| Household Type | # Households | Household Size |
| Married-Couple | 108 (67.9%) | 2.65 |
| Single Male/Father | 0 (0.0%) | - |
| Single Female/Mother | 22 (13.8%) | 2.95 |
| Non-family | 29 (18.2%) | - |
| Total Households | 159 (100.0%) | 2.39 |
Household Size by Marriage Status in Huntley
Out of a total of 159 households in Huntley, 130 (81.8%) are family households, while 29 (18.2%) are nonfamily households. The most numerous type of family households are 4-person households, comprising 60, and the most common type of nonfamily households are 1-person households, comprising 29.
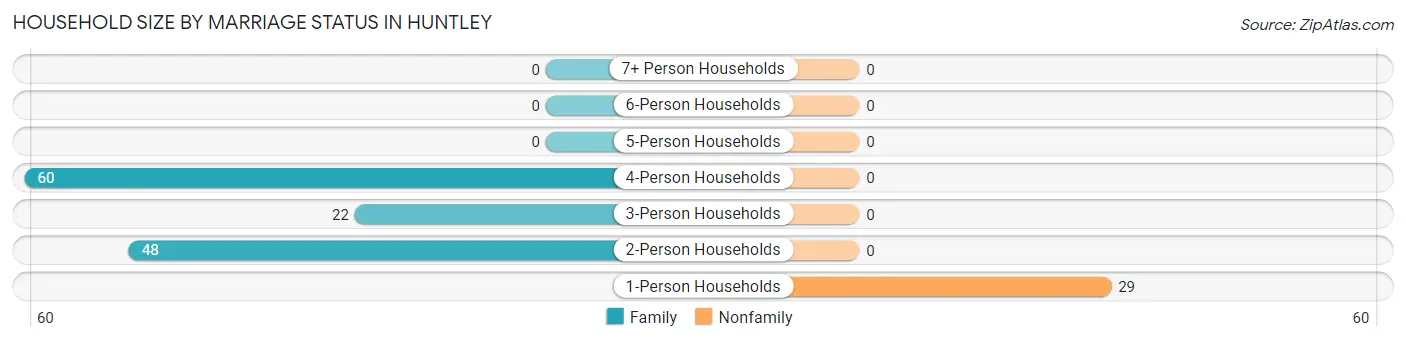
| Household Size | Family Households | Nonfamily Households |
| 1-Person Households | - | 29 (18.2%) |
| 2-Person Households | 48 (30.2%) | 0 (0.0%) |
| 3-Person Households | 22 (13.8%) | 0 (0.0%) |
| 4-Person Households | 60 (37.7%) | 0 (0.0%) |
| 5-Person Households | 0 (0.0%) | 0 (0.0%) |
| 6-Person Households | 0 (0.0%) | 0 (0.0%) |
| 7+ Person Households | 0 (0.0%) | 0 (0.0%) |
| Total | 130 (81.8%) | 29 (18.2%) |
Female Fertility in Huntley
Fertility by Age in Huntley
Average fertility rate in Huntley is 732.0 births per 1,000 women. Women in the age bracket of 20 to 34 years have the highest fertility rate with 1,000.0 births per 1,000 women. Women in the age bracket of 20 to 34 years acount for 100.0% of all women with births.
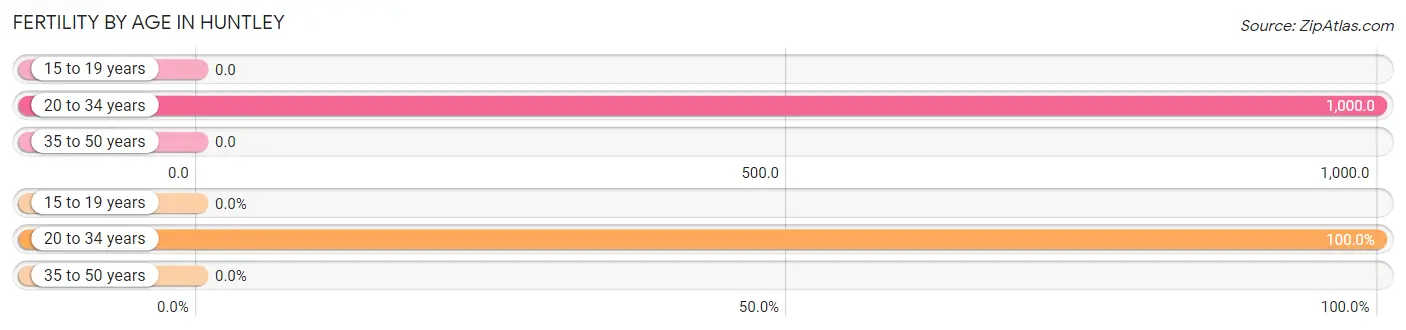
| Age Bracket | Women with Births | Births / 1,000 Women |
| 15 to 19 years | 0 (0.0%) | 0.0 |
| 20 to 34 years | 60 (100.0%) | 1,000.0 |
| 35 to 50 years | 0 (0.0%) | 0.0 |
| Total | 60 (100.0%) | 732.0 |
Fertility by Age by Marriage Status in Huntley
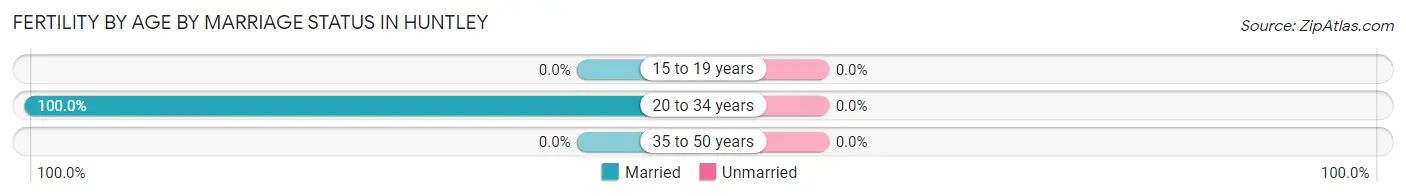
| Age Bracket | Married | Unmarried |
| 15 to 19 years | 0 (0.0%) | 0 (0.0%) |
| 20 to 34 years | 60 (100.0%) | 0 (0.0%) |
| 35 to 50 years | 0 (0.0%) | 0 (0.0%) |
| Total | 60 (100.0%) | 0 (0.0%) |
Fertility by Education in Huntley
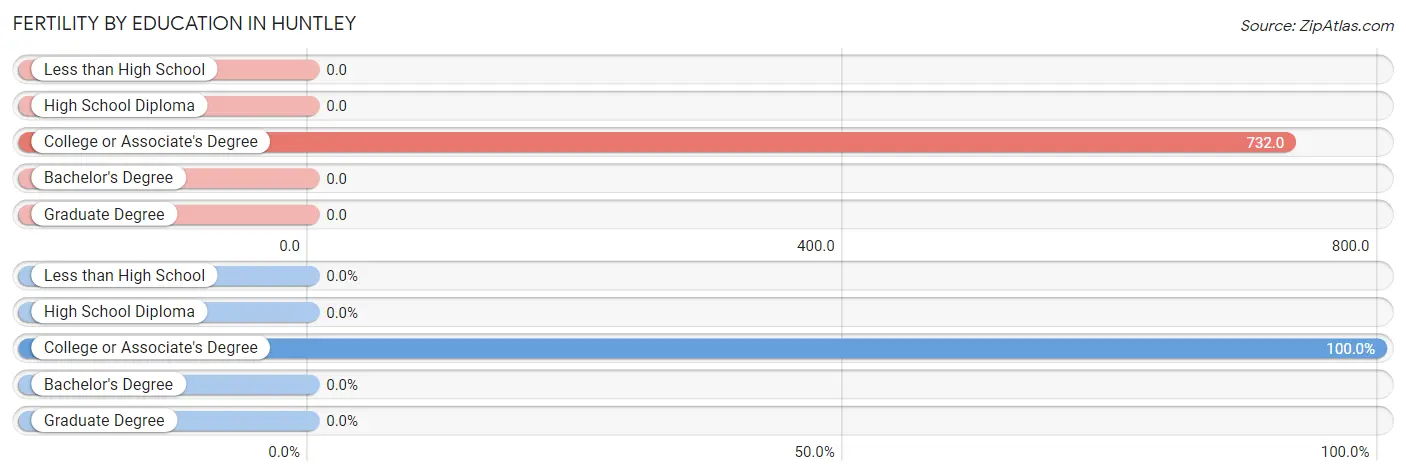
| Educational Attainment | Women with Births | Births / 1,000 Women |
| Less than High School | 0 (0.0%) | 0.0 |
| High School Diploma | 0 (0.0%) | 0.0 |
| College or Associate's Degree | 60 (100.0%) | 732.0 |
| Bachelor's Degree | 0 (0.0%) | 0.0 |
| Graduate Degree | 0 (0.0%) | 0.0 |
| Total | 60 (100.0%) | 732.0 |
Fertility by Education by Marriage Status in Huntley
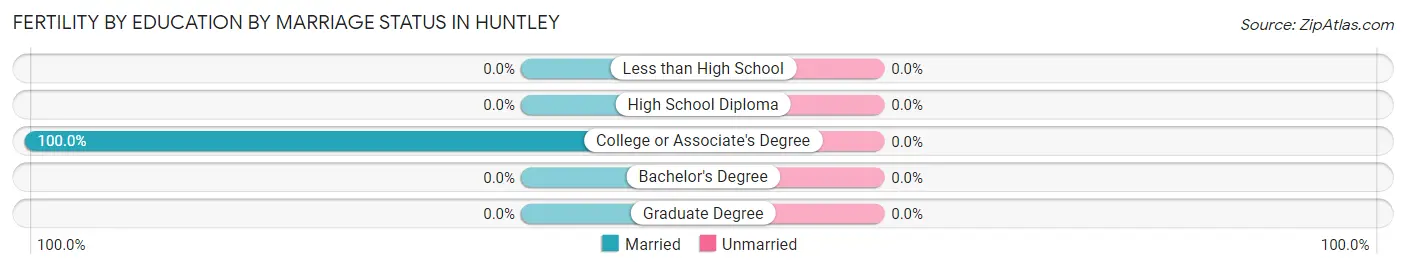
| Educational Attainment | Married | Unmarried |
| Less than High School | 0 (0.0%) | 0 (0.0%) |
| High School Diploma | 0 (0.0%) | 0 (0.0%) |
| College or Associate's Degree | 60 (100.0%) | 0 (0.0%) |
| Bachelor's Degree | 0 (0.0%) | 0 (0.0%) |
| Graduate Degree | 0 (0.0%) | 0 (0.0%) |
| Total | 60 (100.0%) | 0 (0.0%) |
Employment Characteristics in Huntley
Employment by Class of Employer in Huntley
Among the 122 employed individuals in Huntley, private company employees (109 | 89.3%), not-for-profit organizations (10 | 8.2%), and state government employees (3 | 2.5%) make up the most common classes of employment.
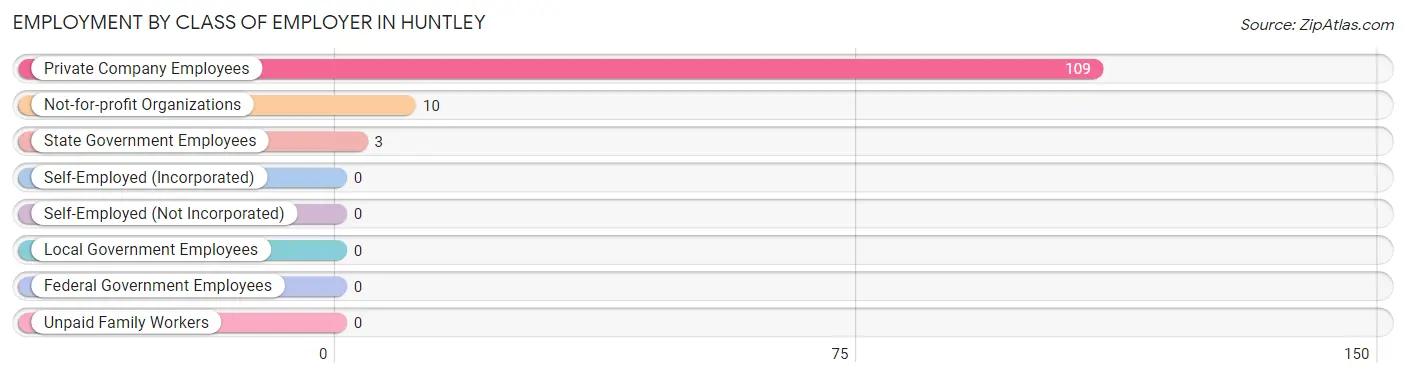
| Employer Class | # Employees | % Employees |
| Private Company Employees | 109 | 89.3% |
| Self-Employed (Incorporated) | 0 | 0.0% |
| Self-Employed (Not Incorporated) | 0 | 0.0% |
| Not-for-profit Organizations | 10 | 8.2% |
| Local Government Employees | 0 | 0.0% |
| State Government Employees | 3 | 2.5% |
| Federal Government Employees | 0 | 0.0% |
| Unpaid Family Workers | 0 | 0.0% |
| Total | 122 | 100.0% |
Employment Status by Age in Huntley
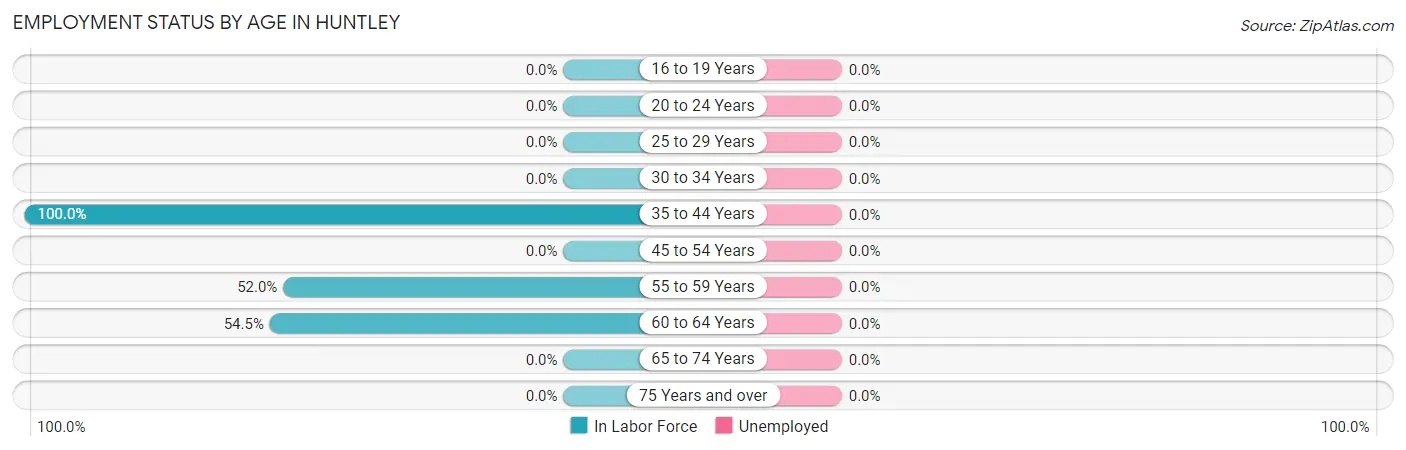
| Age Bracket | In Labor Force | Unemployed |
| 16 to 19 Years | 0 (0.0%) | 0 (0.0%) |
| 20 to 24 Years | 0 (0.0%) | 0 (0.0%) |
| 25 to 29 Years | 0 (0.0%) | 0 (0.0%) |
| 30 to 34 Years | 0 (0.0%) | 0 (0.0%) |
| 35 to 44 Years | 97 (100.0%) | 0 (0.0%) |
| 45 to 54 Years | 0 (0.0%) | 0 (0.0%) |
| 55 to 59 Years | 13 (52.0%) | 0 (0.0%) |
| 60 to 64 Years | 12 (54.5%) | 0 (0.0%) |
| 65 to 74 Years | 0 (0.0%) | 0 (0.0%) |
| 75 Years and over | 0 (0.0%) | 0 (0.0%) |
| Total | 122 (43.6%) | 0 (0.0%) |
Employment Status by Educational Attainment in Huntley
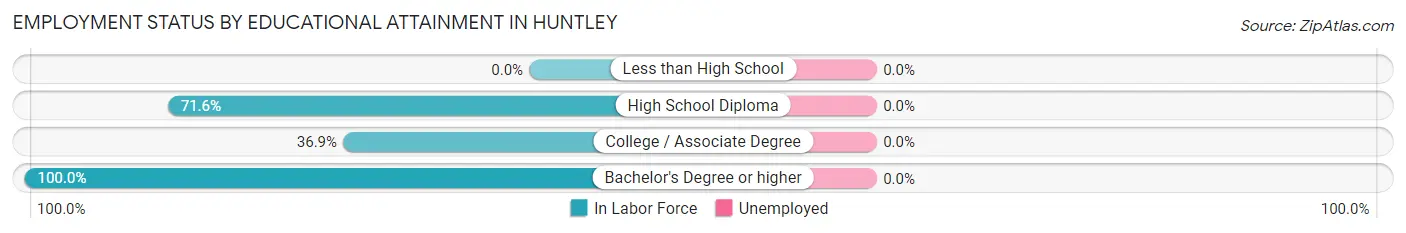
| Educational Attainment | In Labor Force | Unemployed |
| Less than High School | 0 (0.0%) | 0 (0.0%) |
| High School Diploma | 53 (71.6%) | 0 (0.0%) |
| College / Associate Degree | 41 (36.9%) | 0 (0.0%) |
| Bachelor's Degree or higher | 28 (100.0%) | 0 (0.0%) |
| Total | 122 (57.3%) | 0 (0.0%) |
Employment Occupations by Sex in Huntley
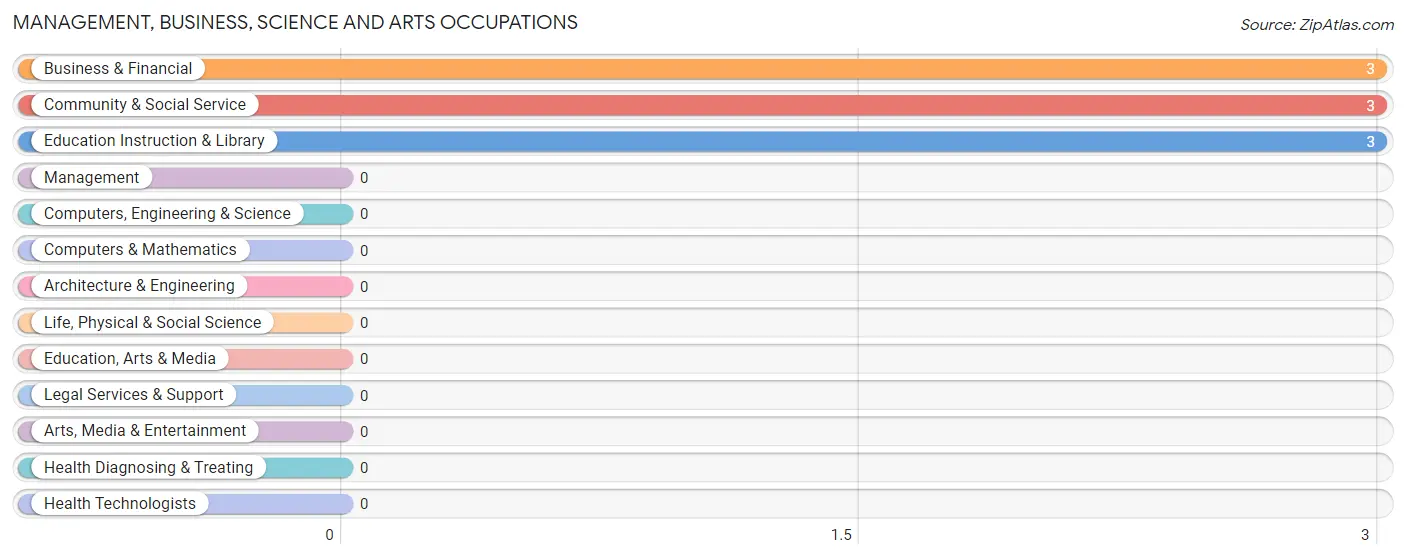
Management, Business, Science and Arts Occupations
The most common Management, Business, Science and Arts occupations in Huntley are Business & Financial (3 | 2.5%), Community & Social Service (3 | 2.5%), and Education Instruction & Library (3 | 2.5%).
Management, Business, Science and Arts Occupations by Sex
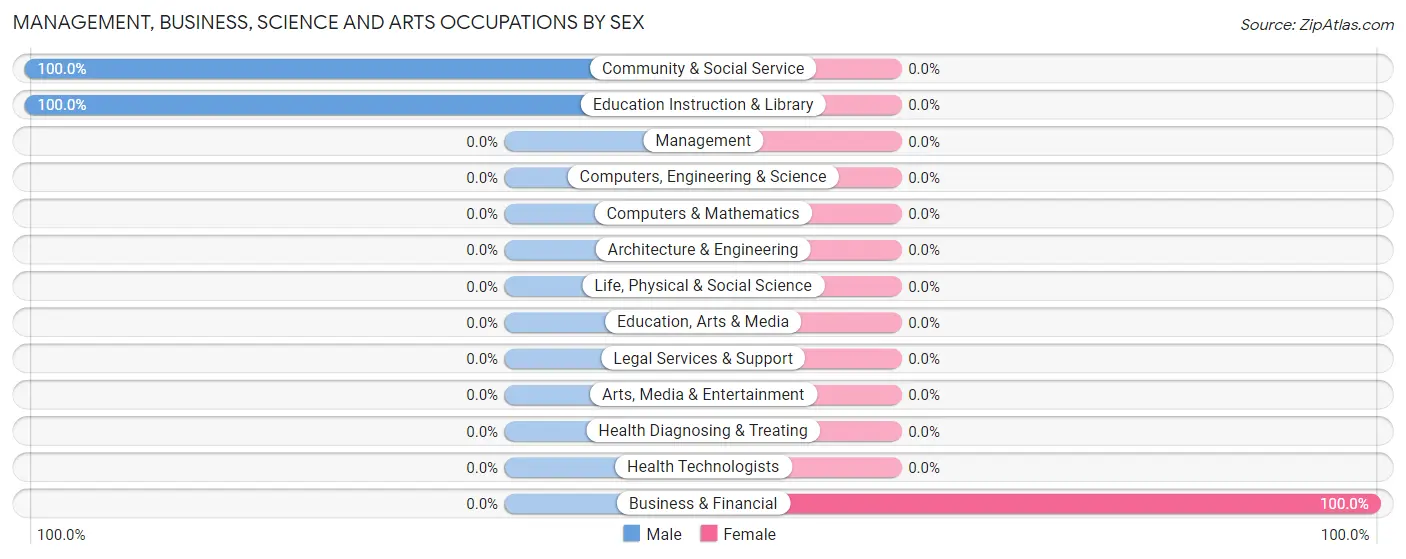
| Occupation | Male | Female |
| Management | 0 (0.0%) | 0 (0.0%) |
| Business & Financial | 0 (0.0%) | 3 (100.0%) |
| Computers, Engineering & Science | 0 (0.0%) | 0 (0.0%) |
| Computers & Mathematics | 0 (0.0%) | 0 (0.0%) |
| Architecture & Engineering | 0 (0.0%) | 0 (0.0%) |
| Life, Physical & Social Science | 0 (0.0%) | 0 (0.0%) |
| Community & Social Service | 3 (100.0%) | 0 (0.0%) |
| Education, Arts & Media | 0 (0.0%) | 0 (0.0%) |
| Legal Services & Support | 0 (0.0%) | 0 (0.0%) |
| Education Instruction & Library | 3 (100.0%) | 0 (0.0%) |
| Arts, Media & Entertainment | 0 (0.0%) | 0 (0.0%) |
| Health Diagnosing & Treating | 0 (0.0%) | 0 (0.0%) |
| Health Technologists | 0 (0.0%) | 0 (0.0%) |
| Total (Category) | 3 (50.0%) | 3 (50.0%) |
| Total (Overall) | 97 (79.5%) | 25 (20.5%) |
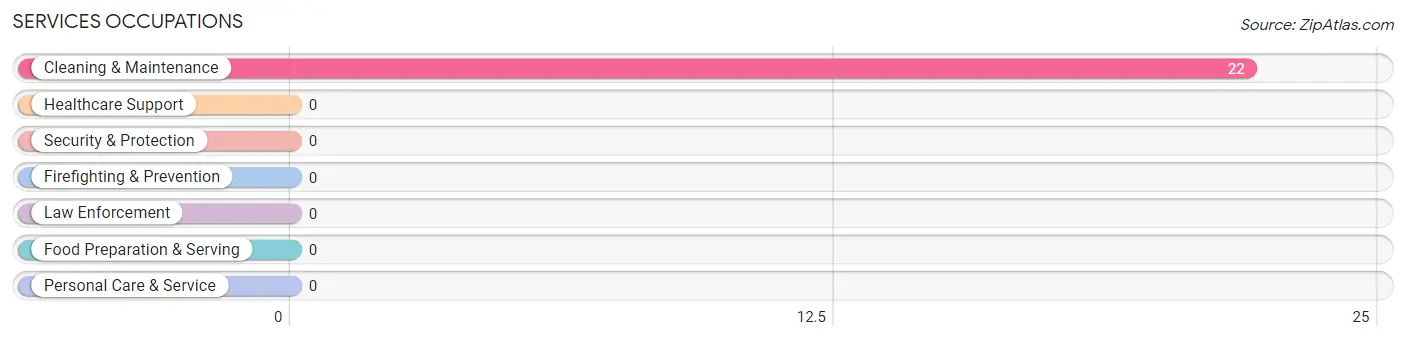
Services Occupations
The most common Services occupations in Huntley are , and Cleaning & Maintenance (22 | 18.0%).
Services Occupations by Sex
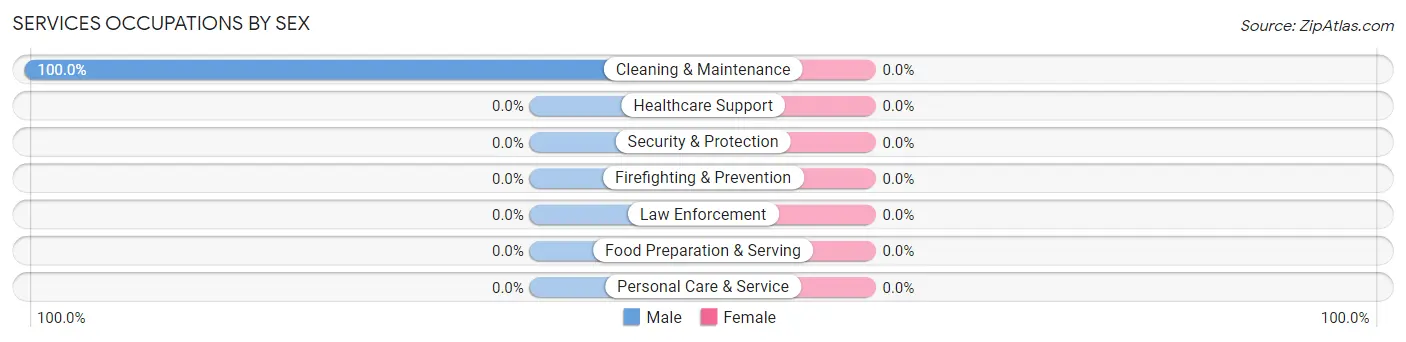
| Occupation | Male | Female |
| Healthcare Support | 0 (0.0%) | 0 (0.0%) |
| Security & Protection | 0 (0.0%) | 0 (0.0%) |
| Firefighting & Prevention | 0 (0.0%) | 0 (0.0%) |
| Law Enforcement | 0 (0.0%) | 0 (0.0%) |
| Food Preparation & Serving | 0 (0.0%) | 0 (0.0%) |
| Cleaning & Maintenance | 22 (100.0%) | 0 (0.0%) |
| Personal Care & Service | 0 (0.0%) | 0 (0.0%) |
| Total (Category) | 22 (100.0%) | 0 (0.0%) |
| Total (Overall) | 97 (79.5%) | 25 (20.5%) |
Sales and Office Occupations
The most common Sales and Office occupations in Huntley are , and Office & Administration (22 | 18.0%).
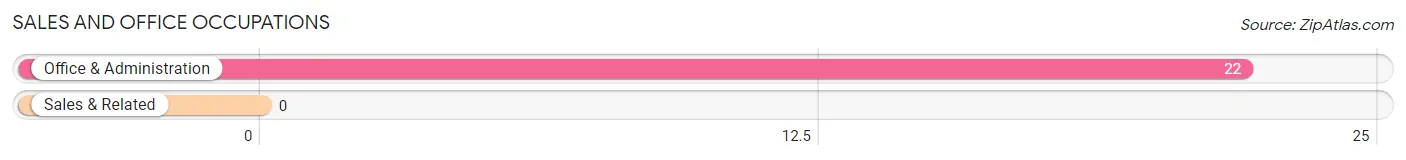
Sales and Office Occupations by Sex
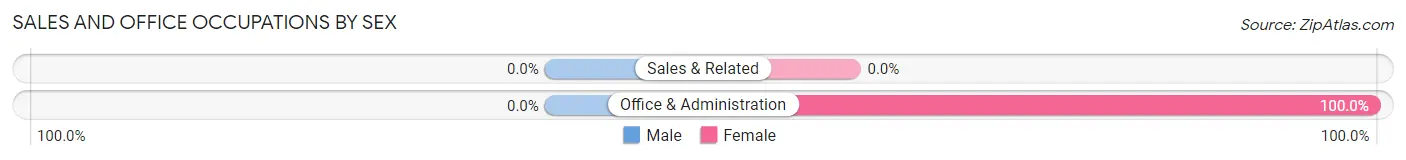
| Occupation | Male | Female |
| Sales & Related | 0 (0.0%) | 0 (0.0%) |
| Office & Administration | 0 (0.0%) | 22 (100.0%) |
| Total (Category) | 0 (0.0%) | 22 (100.0%) |
| Total (Overall) | 97 (79.5%) | 25 (20.5%) |
Natural Resources, Construction and Maintenance Occupations
The most common Natural Resources, Construction and Maintenance occupations in Huntley are Construction & Extraction (53 | 43.4%), and Installation, Maintenance & Repair (10 | 8.2%).
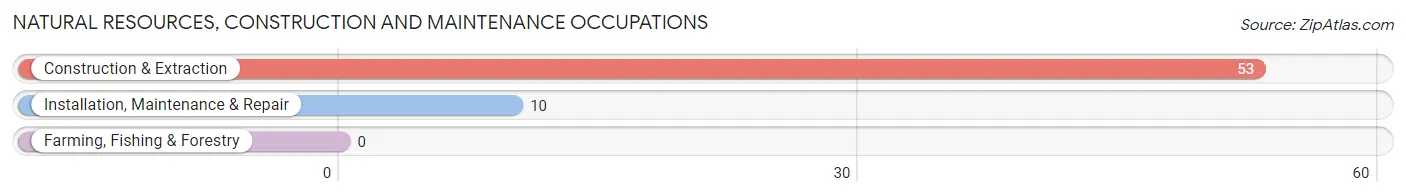
Natural Resources, Construction and Maintenance Occupations by Sex
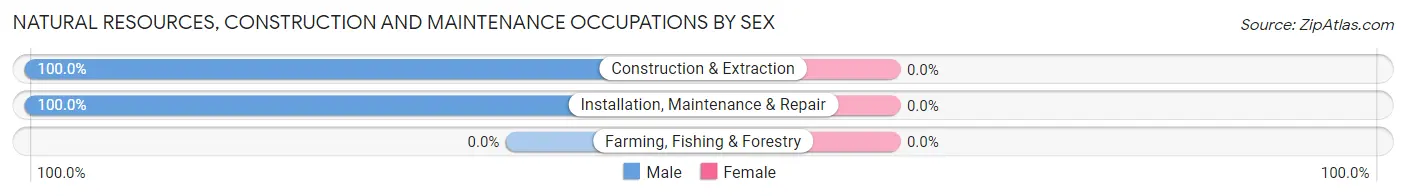
| Occupation | Male | Female |
| Farming, Fishing & Forestry | 0 (0.0%) | 0 (0.0%) |
| Construction & Extraction | 53 (100.0%) | 0 (0.0%) |
| Installation, Maintenance & Repair | 10 (100.0%) | 0 (0.0%) |
| Total (Category) | 63 (100.0%) | 0 (0.0%) |
| Total (Overall) | 97 (79.5%) | 25 (20.5%) |
Production, Transportation and Moving Occupations
The most common Production, Transportation and Moving occupations in Huntley are , and Production (9 | 7.4%).
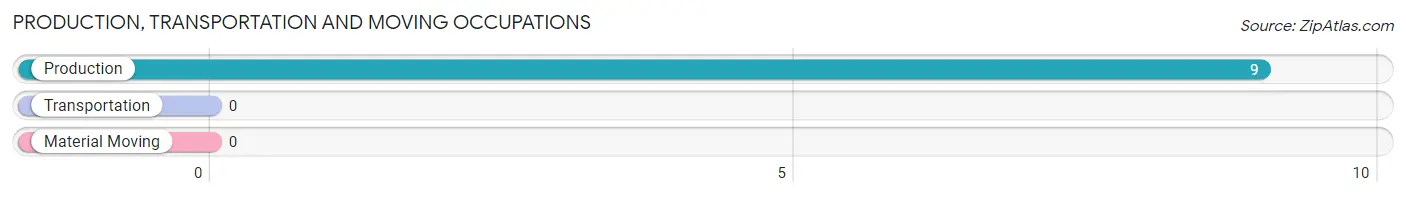
Production, Transportation and Moving Occupations by Sex
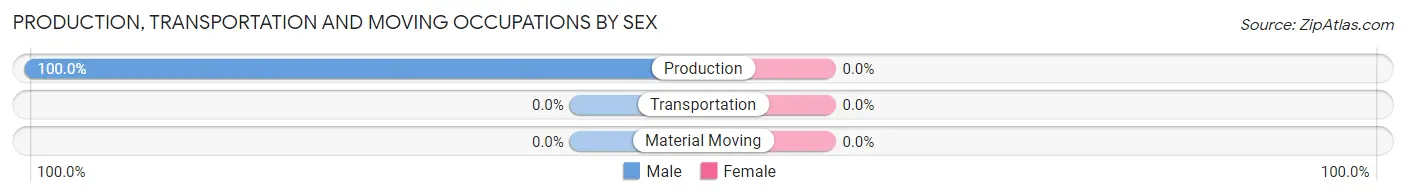
| Occupation | Male | Female |
| Production | 9 (100.0%) | 0 (0.0%) |
| Transportation | 0 (0.0%) | 0 (0.0%) |
| Material Moving | 0 (0.0%) | 0 (0.0%) |
| Total (Category) | 9 (100.0%) | 0 (0.0%) |
| Total (Overall) | 97 (79.5%) | 25 (20.5%) |
Employment Industries by Sex in Huntley
Employment Industries in Huntley
The major employment industries in Huntley include Construction (53 | 43.4%), Administrative & Support (22 | 18.0%), Health Care & Social Assistance (22 | 18.0%), Utilities (19 | 15.6%), and Wholesale Trade (3 | 2.5%).
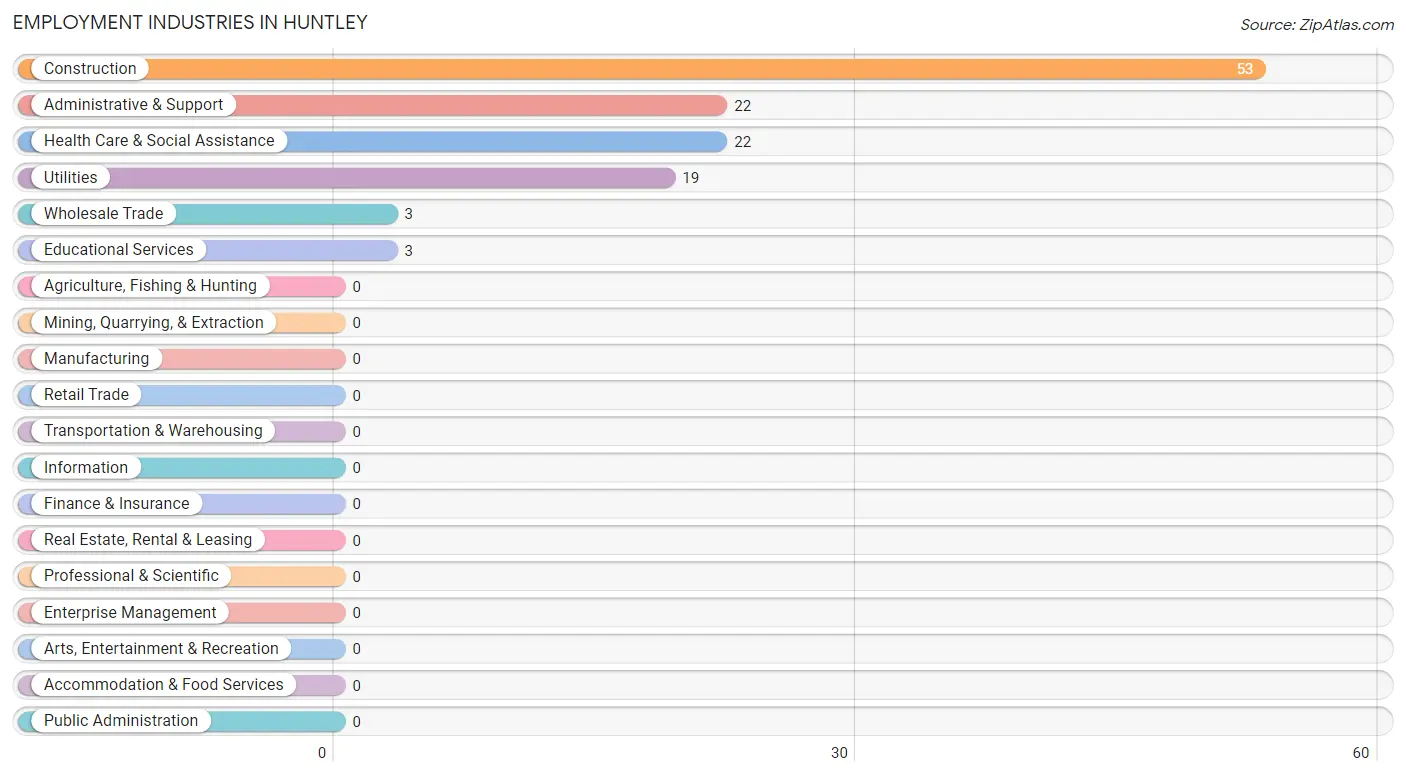
Employment Industries by Sex in Huntley
The Huntley industries that see more men than women are Construction (100.0%), Utilities (100.0%), and Administrative & Support (100.0%), whereas the industries that tend to have a higher number of women are Wholesale Trade (100.0%), and Health Care & Social Assistance (100.0%).
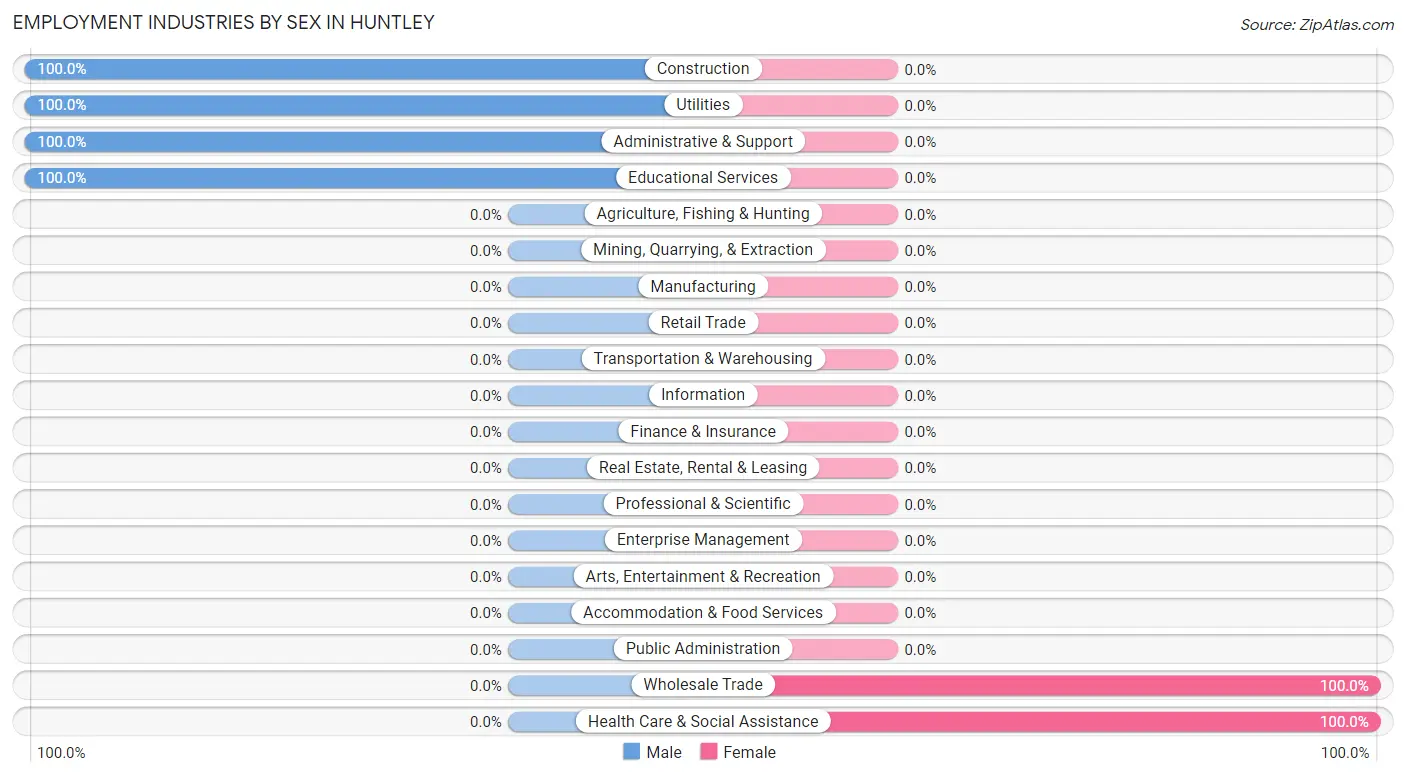
| Industry | Male | Female |
| Agriculture, Fishing & Hunting | 0 (0.0%) | 0 (0.0%) |
| Mining, Quarrying, & Extraction | 0 (0.0%) | 0 (0.0%) |
| Construction | 53 (100.0%) | 0 (0.0%) |
| Manufacturing | 0 (0.0%) | 0 (0.0%) |
| Wholesale Trade | 0 (0.0%) | 3 (100.0%) |
| Retail Trade | 0 (0.0%) | 0 (0.0%) |
| Transportation & Warehousing | 0 (0.0%) | 0 (0.0%) |
| Utilities | 19 (100.0%) | 0 (0.0%) |
| Information | 0 (0.0%) | 0 (0.0%) |
| Finance & Insurance | 0 (0.0%) | 0 (0.0%) |
| Real Estate, Rental & Leasing | 0 (0.0%) | 0 (0.0%) |
| Professional & Scientific | 0 (0.0%) | 0 (0.0%) |
| Enterprise Management | 0 (0.0%) | 0 (0.0%) |
| Administrative & Support | 22 (100.0%) | 0 (0.0%) |
| Educational Services | 3 (100.0%) | 0 (0.0%) |
| Health Care & Social Assistance | 0 (0.0%) | 22 (100.0%) |
| Arts, Entertainment & Recreation | 0 (0.0%) | 0 (0.0%) |
| Accommodation & Food Services | 0 (0.0%) | 0 (0.0%) |
| Public Administration | 0 (0.0%) | 0 (0.0%) |
| Total | 97 (79.5%) | 25 (20.5%) |
Education in Huntley
School Enrollment in Huntley
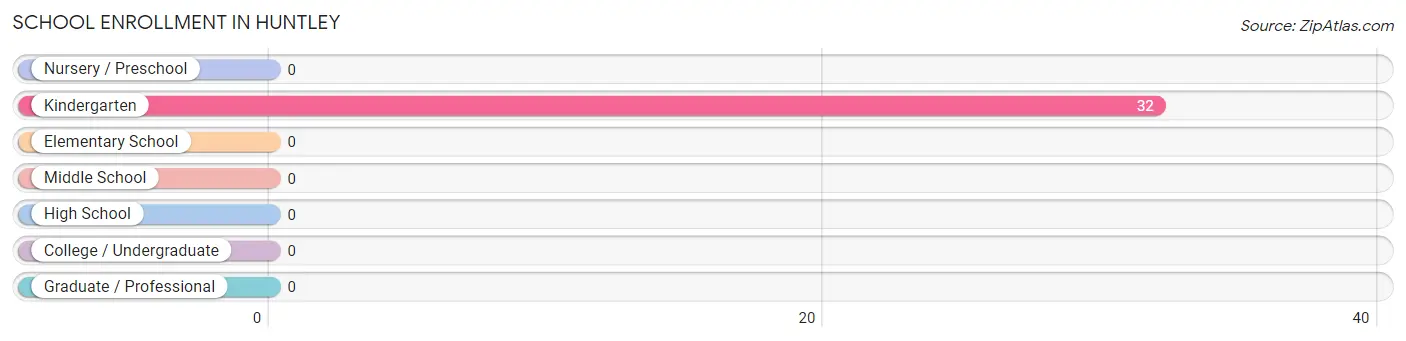
| School Level | # Students | % Students |
| Nursery / Preschool | 0 | 0.0% |
| Kindergarten | 32 | 100.0% |
| Elementary School | 0 | 0.0% |
| Middle School | 0 | 0.0% |
| High School | 0 | 0.0% |
| College / Undergraduate | 0 | 0.0% |
| Graduate / Professional | 0 | 0.0% |
| Total | 32 | 100.0% |
School Enrollment by Age by Funding Source in Huntley
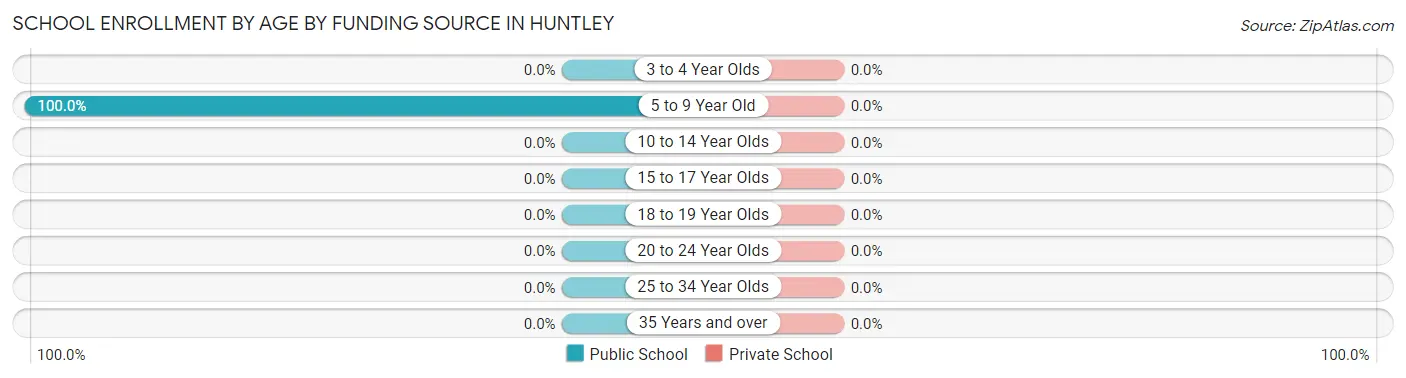
| Age Bracket | Public School | Private School |
| 3 to 4 Year Olds | 0 (0.0%) | 0 (0.0%) |
| 5 to 9 Year Old | 32 (100.0%) | 0 (0.0%) |
| 10 to 14 Year Olds | 0 (0.0%) | 0 (0.0%) |
| 15 to 17 Year Olds | 0 (0.0%) | 0 (0.0%) |
| 18 to 19 Year Olds | 0 (0.0%) | 0 (0.0%) |
| 20 to 24 Year Olds | 0 (0.0%) | 0 (0.0%) |
| 25 to 34 Year Olds | 0 (0.0%) | 0 (0.0%) |
| 35 Years and over | 0 (0.0%) | 0 (0.0%) |
| Total | 32 (100.0%) | 0 (0.0%) |
Educational Attainment by Field of Study in Huntley
Business (22 | 78.6%), and bio, nature & agricultural (6 | 21.4%) are the most common fields of study among 28 individuals in Huntley who have obtained a bachelor's degree or higher.
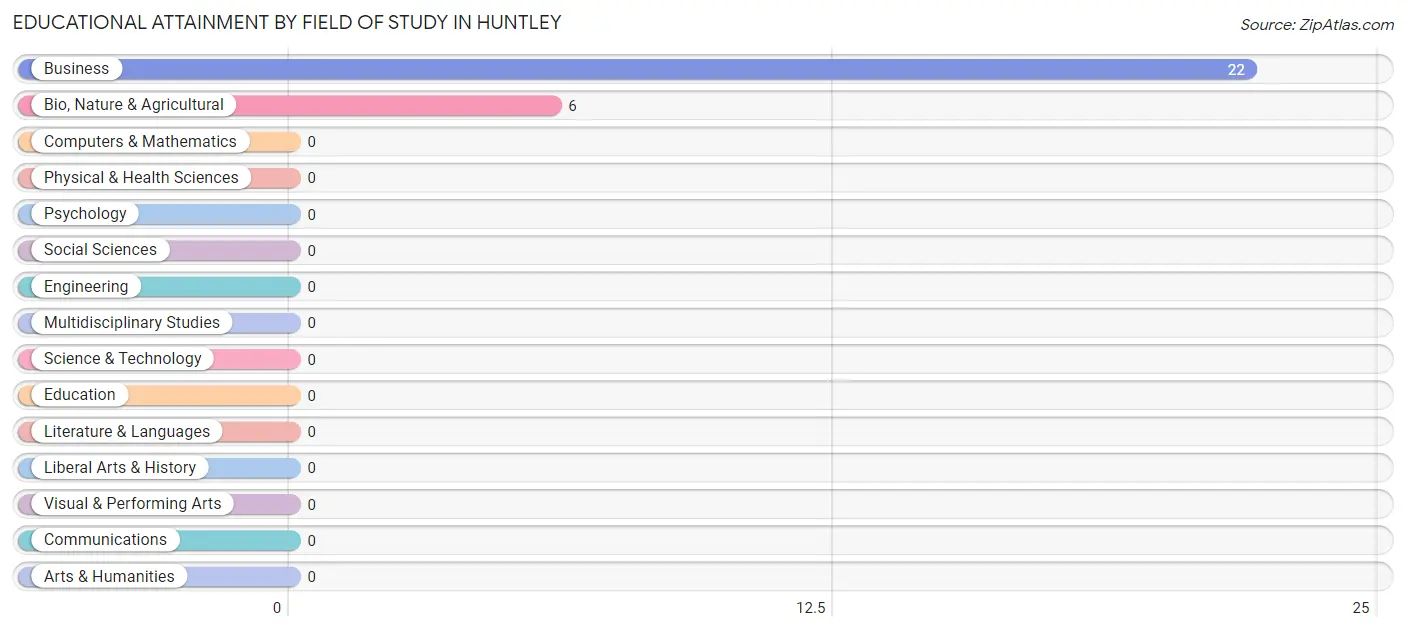
| Field of Study | # Graduates | % Graduates |
| Computers & Mathematics | 0 | 0.0% |
| Bio, Nature & Agricultural | 6 | 21.4% |
| Physical & Health Sciences | 0 | 0.0% |
| Psychology | 0 | 0.0% |
| Social Sciences | 0 | 0.0% |
| Engineering | 0 | 0.0% |
| Multidisciplinary Studies | 0 | 0.0% |
| Science & Technology | 0 | 0.0% |
| Business | 22 | 78.6% |
| Education | 0 | 0.0% |
| Literature & Languages | 0 | 0.0% |
| Liberal Arts & History | 0 | 0.0% |
| Visual & Performing Arts | 0 | 0.0% |
| Communications | 0 | 0.0% |
| Arts & Humanities | 0 | 0.0% |
| Total | 28 | 100.0% |
Transportation & Commute in Huntley
Vehicle Availability by Sex in Huntley
The most prevalent vehicle ownership categories in Huntley are males with 2 vehicles (56, accounting for 57.7%) and females with 2 vehicles (3, making up 224.0%).
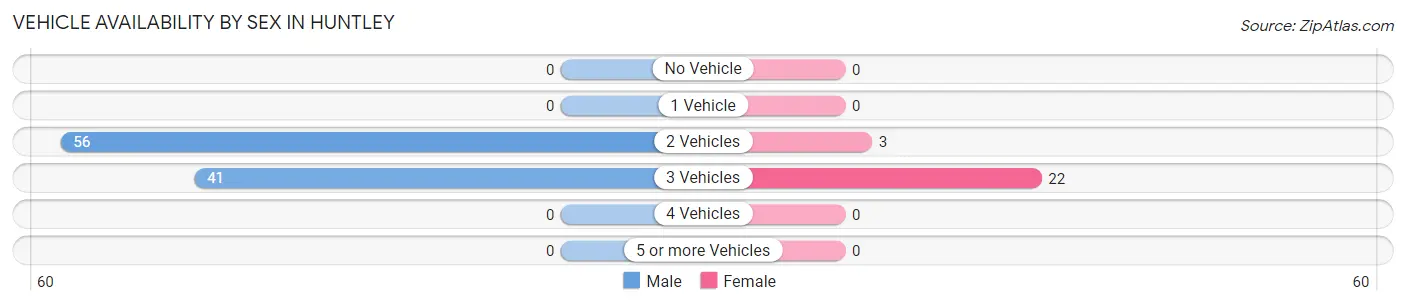
| Vehicles Available | Male | Female |
| No Vehicle | 0 (0.0%) | 0 (0.0%) |
| 1 Vehicle | 0 (0.0%) | 0 (0.0%) |
| 2 Vehicles | 56 (57.7%) | 3 (12.0%) |
| 3 Vehicles | 41 (42.3%) | 22 (88.0%) |
| 4 Vehicles | 0 (0.0%) | 0 (0.0%) |
| 5 or more Vehicles | 0 (0.0%) | 0 (0.0%) |
| Total | 97 (100.0%) | 25 (100.0%) |
Commute Time in Huntley
The most frequently occuring commute durations in Huntley are 90 or more minutes (53 commuters, 44.5%), 20 to 24 minutes (44 commuters, 37.0%), and less than 5 minutes (10 commuters, 8.4%).
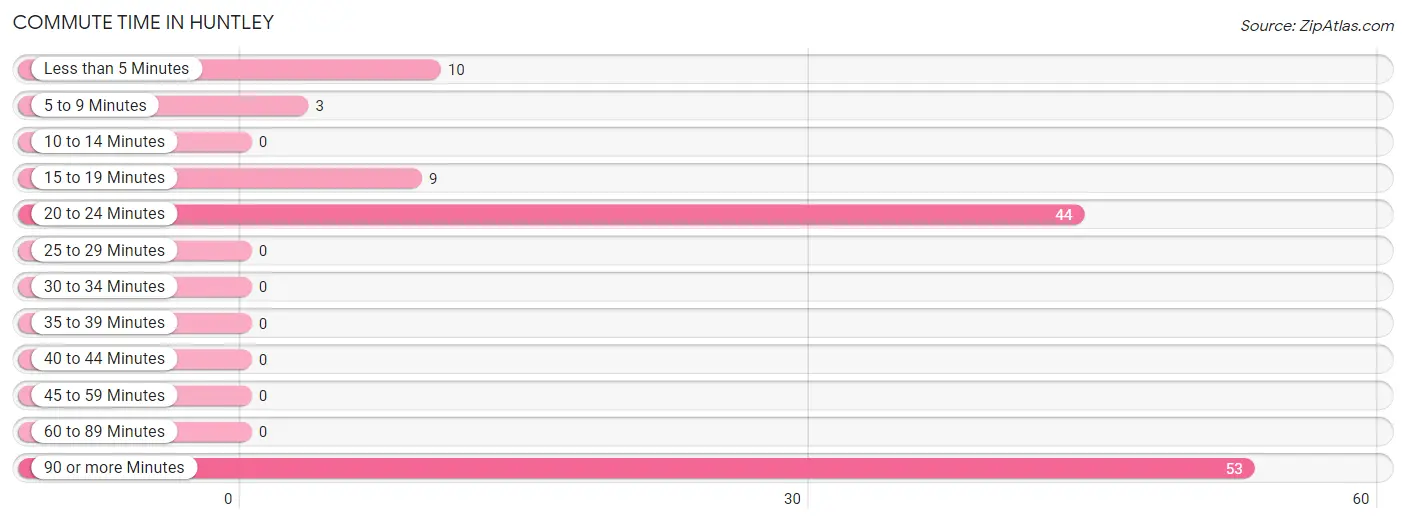
| Commute Time | # Commuters | % Commuters |
| Less than 5 Minutes | 10 | 8.4% |
| 5 to 9 Minutes | 3 | 2.5% |
| 10 to 14 Minutes | 0 | 0.0% |
| 15 to 19 Minutes | 9 | 7.6% |
| 20 to 24 Minutes | 44 | 37.0% |
| 25 to 29 Minutes | 0 | 0.0% |
| 30 to 34 Minutes | 0 | 0.0% |
| 35 to 39 Minutes | 0 | 0.0% |
| 40 to 44 Minutes | 0 | 0.0% |
| 45 to 59 Minutes | 0 | 0.0% |
| 60 to 89 Minutes | 0 | 0.0% |
| 90 or more Minutes | 53 | 44.5% |
Commute Time by Sex in Huntley
The most common commute times in Huntley are 90 or more minutes (53 commuters, 54.6%) for males and 20 to 24 minutes (22 commuters, 100.0%) for females.
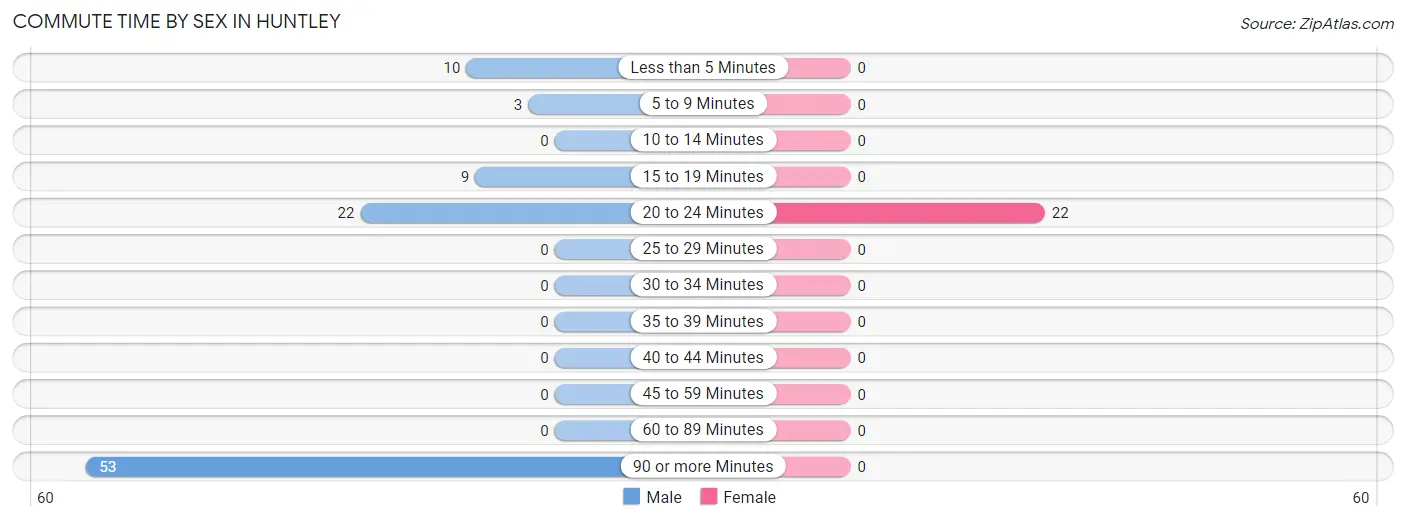
| Commute Time | Male | Female |
| Less than 5 Minutes | 10 (10.3%) | 0 (0.0%) |
| 5 to 9 Minutes | 3 (3.1%) | 0 (0.0%) |
| 10 to 14 Minutes | 0 (0.0%) | 0 (0.0%) |
| 15 to 19 Minutes | 9 (9.3%) | 0 (0.0%) |
| 20 to 24 Minutes | 22 (22.7%) | 22 (100.0%) |
| 25 to 29 Minutes | 0 (0.0%) | 0 (0.0%) |
| 30 to 34 Minutes | 0 (0.0%) | 0 (0.0%) |
| 35 to 39 Minutes | 0 (0.0%) | 0 (0.0%) |
| 40 to 44 Minutes | 0 (0.0%) | 0 (0.0%) |
| 45 to 59 Minutes | 0 (0.0%) | 0 (0.0%) |
| 60 to 89 Minutes | 0 (0.0%) | 0 (0.0%) |
| 90 or more Minutes | 53 (54.6%) | 0 (0.0%) |
Time of Departure to Work by Sex in Huntley
The most frequent times of departure to work in Huntley are 4:00 PM to 11:59 PM (53, 54.6%) for males and 6:30 AM to 6:59 AM (22, 100.0%) for females.
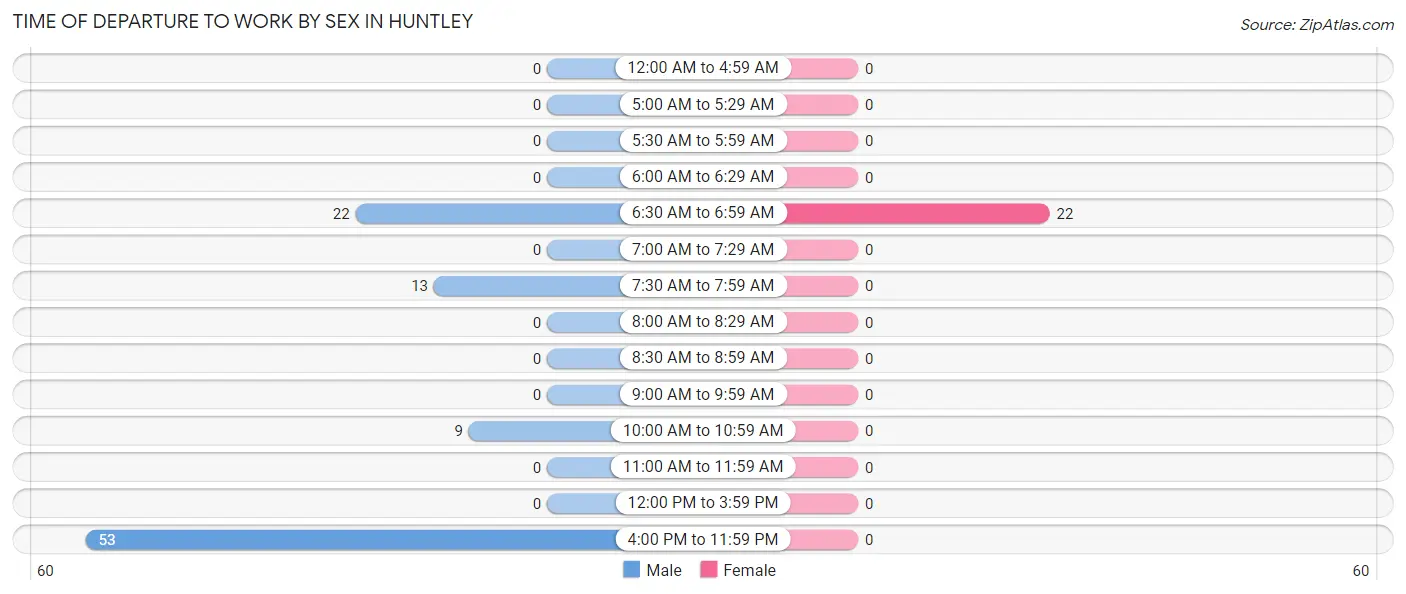
| Time of Departure | Male | Female |
| 12:00 AM to 4:59 AM | 0 (0.0%) | 0 (0.0%) |
| 5:00 AM to 5:29 AM | 0 (0.0%) | 0 (0.0%) |
| 5:30 AM to 5:59 AM | 0 (0.0%) | 0 (0.0%) |
| 6:00 AM to 6:29 AM | 0 (0.0%) | 0 (0.0%) |
| 6:30 AM to 6:59 AM | 22 (22.7%) | 22 (100.0%) |
| 7:00 AM to 7:29 AM | 0 (0.0%) | 0 (0.0%) |
| 7:30 AM to 7:59 AM | 13 (13.4%) | 0 (0.0%) |
| 8:00 AM to 8:29 AM | 0 (0.0%) | 0 (0.0%) |
| 8:30 AM to 8:59 AM | 0 (0.0%) | 0 (0.0%) |
| 9:00 AM to 9:59 AM | 0 (0.0%) | 0 (0.0%) |
| 10:00 AM to 10:59 AM | 9 (9.3%) | 0 (0.0%) |
| 11:00 AM to 11:59 AM | 0 (0.0%) | 0 (0.0%) |
| 12:00 PM to 3:59 PM | 0 (0.0%) | 0 (0.0%) |
| 4:00 PM to 11:59 PM | 53 (54.6%) | 0 (0.0%) |
| Total | 97 (100.0%) | 22 (100.0%) |
Housing Occupancy in Huntley
Occupancy by Ownership in Huntley
Of the total 159 dwellings in Huntley, owner-occupied units account for 137 (86.2%), while renter-occupied units make up 22 (13.8%).

| Occupancy | # Housing Units | % Housing Units |
| Owner Occupied Housing Units | 137 | 86.2% |
| Renter-Occupied Housing Units | 22 | 13.8% |
| Total Occupied Housing Units | 159 | 100.0% |
Occupancy by Household Size in Huntley
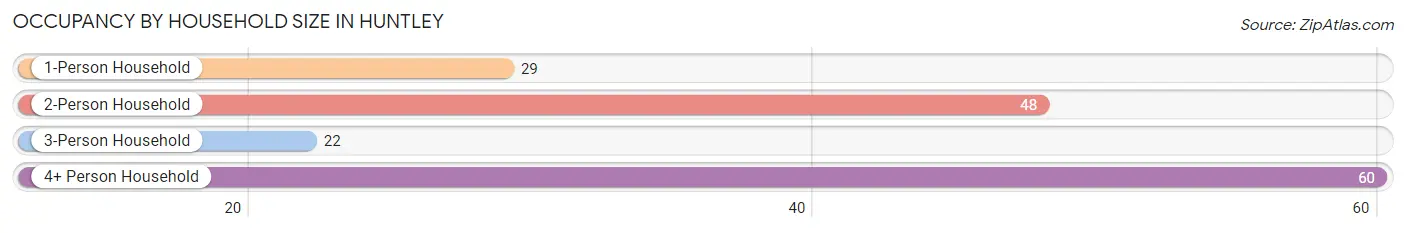
| Household Size | # Housing Units | % Housing Units |
| 1-Person Household | 29 | 18.2% |
| 2-Person Household | 48 | 30.2% |
| 3-Person Household | 22 | 13.8% |
| 4+ Person Household | 60 | 37.7% |
| Total Housing Units | 159 | 100.0% |
Occupancy by Ownership by Household Size in Huntley
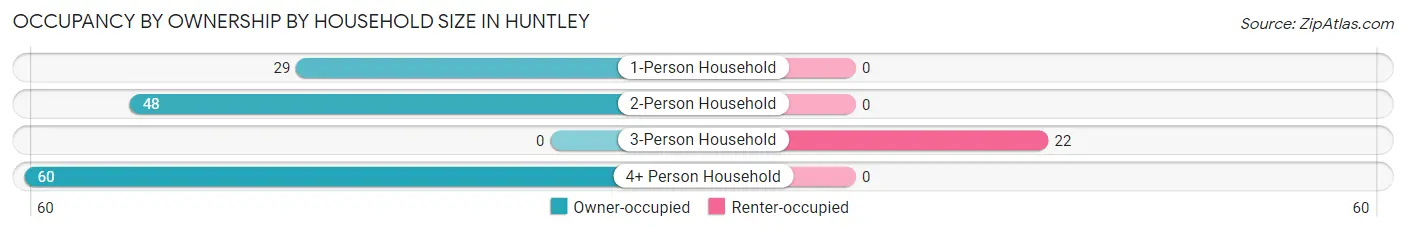
| Household Size | Owner-occupied | Renter-occupied |
| 1-Person Household | 29 (100.0%) | 0 (0.0%) |
| 2-Person Household | 48 (100.0%) | 0 (0.0%) |
| 3-Person Household | 0 (0.0%) | 22 (100.0%) |
| 4+ Person Household | 60 (100.0%) | 0 (0.0%) |
| Total Housing Units | 137 (86.2%) | 22 (13.8%) |
Occupancy by Educational Attainment in Huntley
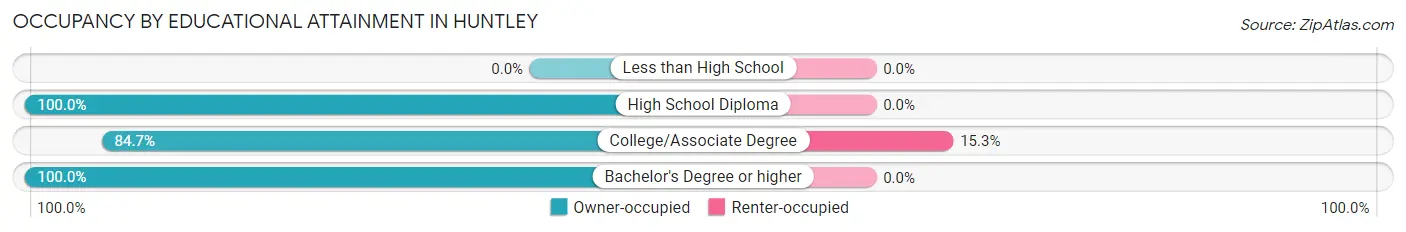
| Household Size | Owner-occupied | Renter-occupied |
| Less than High School | 0 (0.0%) | 0 (0.0%) |
| High School Diploma | 12 (100.0%) | 0 (0.0%) |
| College/Associate Degree | 122 (84.7%) | 22 (15.3%) |
| Bachelor's Degree or higher | 3 (100.0%) | 0 (0.0%) |
Occupancy by Age of Householder in Huntley
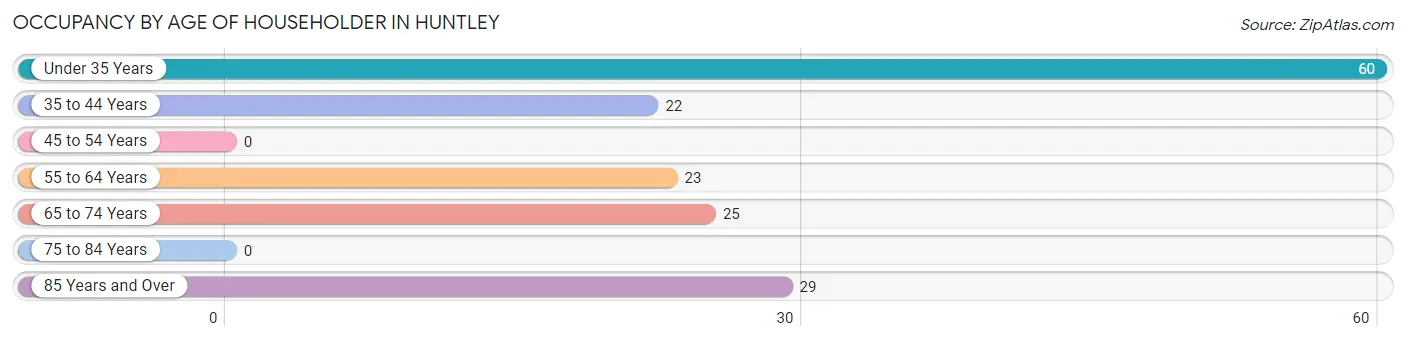
| Age Bracket | # Households | % Households |
| Under 35 Years | 60 | 37.7% |
| 35 to 44 Years | 22 | 13.8% |
| 45 to 54 Years | 0 | 0.0% |
| 55 to 64 Years | 23 | 14.5% |
| 65 to 74 Years | 25 | 15.7% |
| 75 to 84 Years | 0 | 0.0% |
| 85 Years and Over | 29 | 18.2% |
| Total | 159 | 100.0% |
Housing Finances in Huntley
Median Income by Occupancy in Huntley
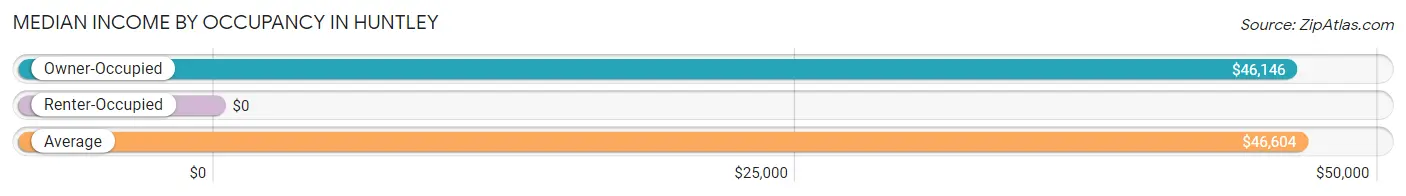
| Occupancy Type | # Households | Median Income |
| Owner-Occupied | 137 (86.2%) | $46,146 |
| Renter-Occupied | 22 (13.8%) | $0 |
| Average | 159 (100.0%) | $46,604 |
Occupancy by Householder Income Bracket in Huntley
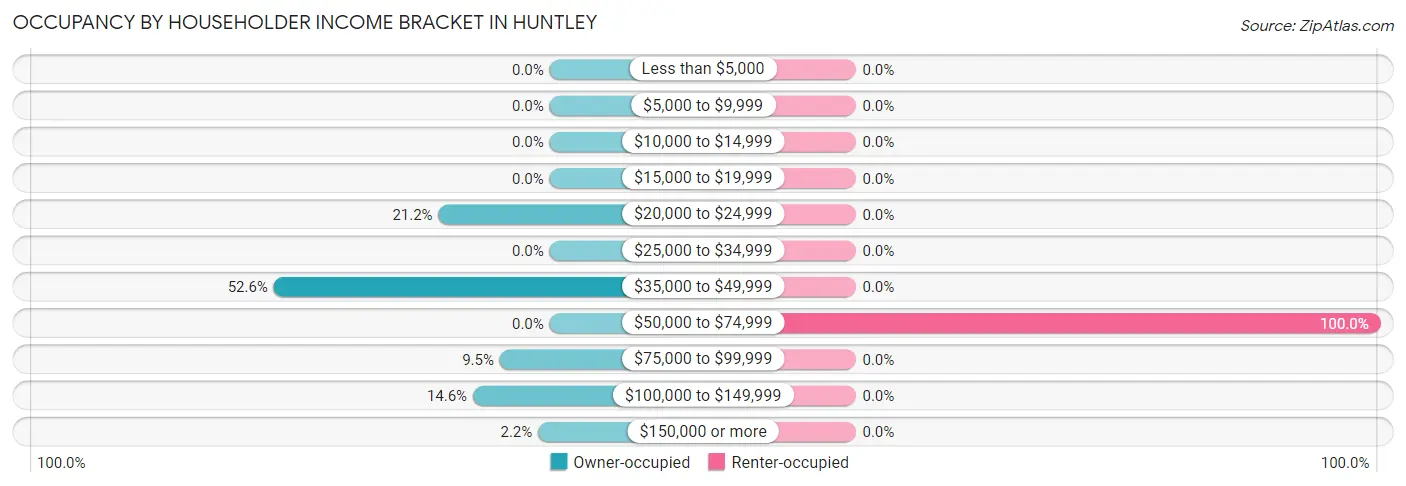
| Income Bracket | Owner-occupied | Renter-occupied |
| Less than $5,000 | 0 (0.0%) | 0 (0.0%) |
| $5,000 to $9,999 | 0 (0.0%) | 0 (0.0%) |
| $10,000 to $14,999 | 0 (0.0%) | 0 (0.0%) |
| $15,000 to $19,999 | 0 (0.0%) | 0 (0.0%) |
| $20,000 to $24,999 | 29 (21.2%) | 0 (0.0%) |
| $25,000 to $34,999 | 0 (0.0%) | 0 (0.0%) |
| $35,000 to $49,999 | 72 (52.5%) | 0 (0.0%) |
| $50,000 to $74,999 | 0 (0.0%) | 22 (100.0%) |
| $75,000 to $99,999 | 13 (9.5%) | 0 (0.0%) |
| $100,000 to $149,999 | 20 (14.6%) | 0 (0.0%) |
| $150,000 or more | 3 (2.2%) | 0 (0.0%) |
| Total | 137 (100.0%) | 22 (100.0%) |
Monthly Housing Cost Tiers in Huntley
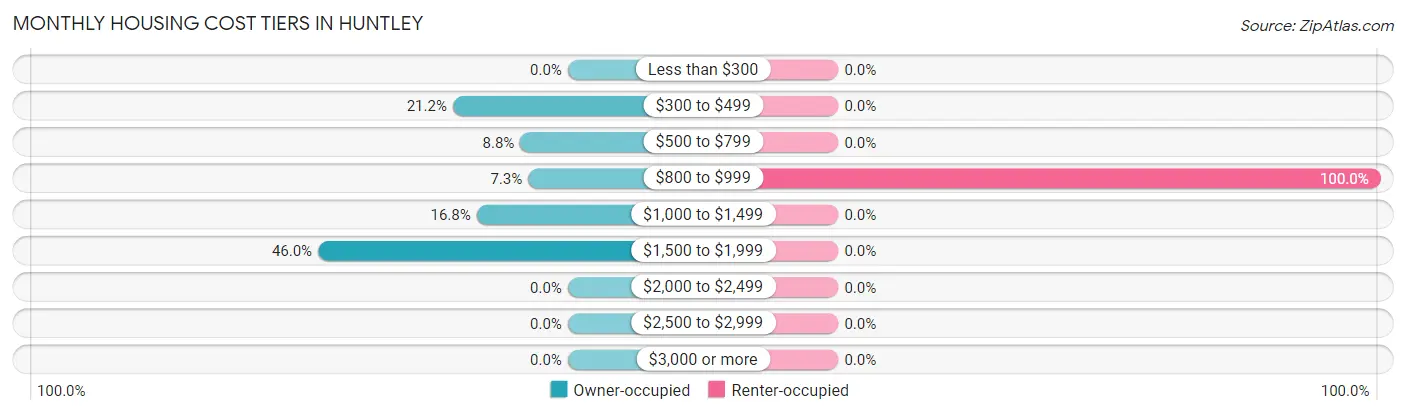
| Monthly Cost | Owner-occupied | Renter-occupied |
| Less than $300 | 0 (0.0%) | 0 (0.0%) |
| $300 to $499 | 29 (21.2%) | 0 (0.0%) |
| $500 to $799 | 12 (8.8%) | 0 (0.0%) |
| $800 to $999 | 10 (7.3%) | 22 (100.0%) |
| $1,000 to $1,499 | 23 (16.8%) | 0 (0.0%) |
| $1,500 to $1,999 | 63 (46.0%) | 0 (0.0%) |
| $2,000 to $2,499 | 0 (0.0%) | 0 (0.0%) |
| $2,500 to $2,999 | 0 (0.0%) | 0 (0.0%) |
| $3,000 or more | 0 (0.0%) | 0 (0.0%) |
| Total | 137 (100.0%) | 22 (100.0%) |
Physical Housing Characteristics in Huntley
Housing Structures in Huntley
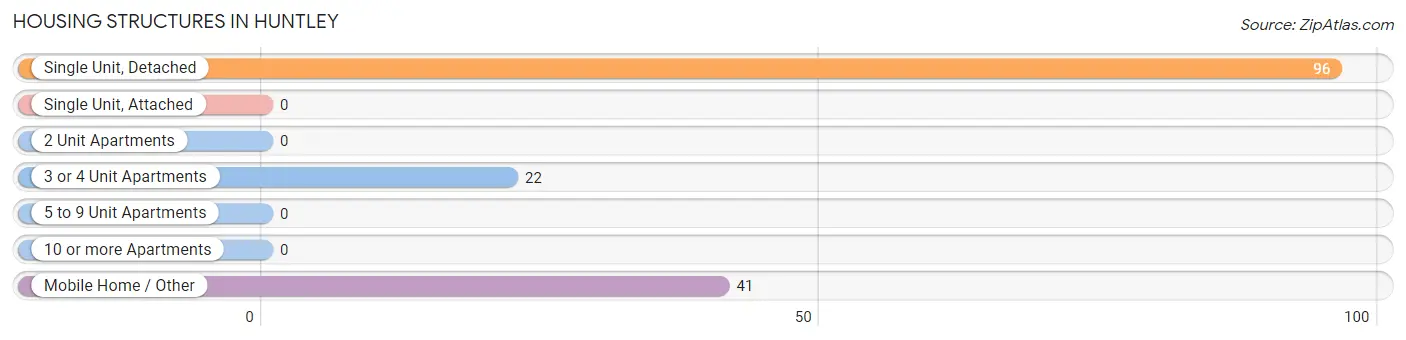
| Structure Type | # Housing Units | % Housing Units |
| Single Unit, Detached | 96 | 60.4% |
| Single Unit, Attached | 0 | 0.0% |
| 2 Unit Apartments | 0 | 0.0% |
| 3 or 4 Unit Apartments | 22 | 13.8% |
| 5 to 9 Unit Apartments | 0 | 0.0% |
| 10 or more Apartments | 0 | 0.0% |
| Mobile Home / Other | 41 | 25.8% |
| Total | 159 | 100.0% |
Housing Structures by Occupancy in Huntley
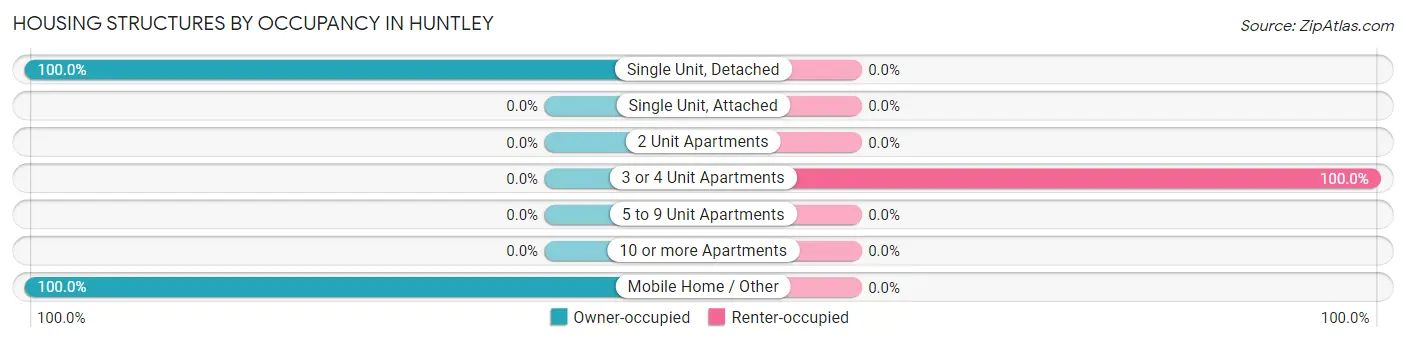
| Structure Type | Owner-occupied | Renter-occupied |
| Single Unit, Detached | 96 (100.0%) | 0 (0.0%) |
| Single Unit, Attached | 0 (0.0%) | 0 (0.0%) |
| 2 Unit Apartments | 0 (0.0%) | 0 (0.0%) |
| 3 or 4 Unit Apartments | 0 (0.0%) | 22 (100.0%) |
| 5 to 9 Unit Apartments | 0 (0.0%) | 0 (0.0%) |
| 10 or more Apartments | 0 (0.0%) | 0 (0.0%) |
| Mobile Home / Other | 41 (100.0%) | 0 (0.0%) |
| Total | 137 (86.2%) | 22 (13.8%) |
Housing Structures by Number of Rooms in Huntley
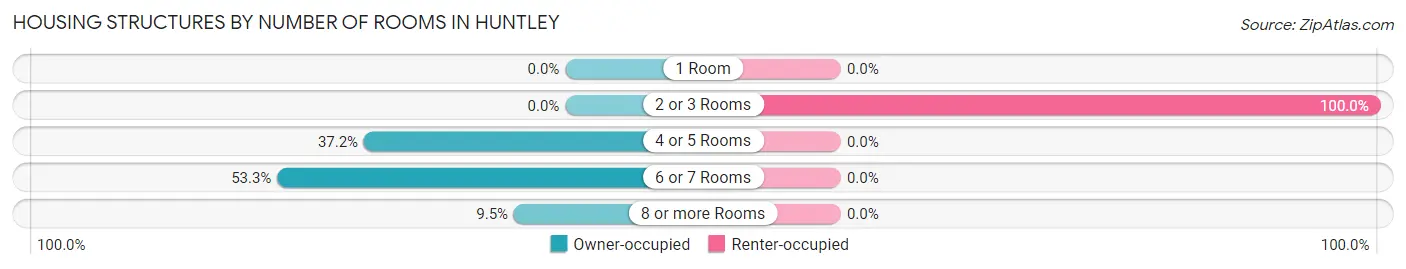
| Number of Rooms | Owner-occupied | Renter-occupied |
| 1 Room | 0 (0.0%) | 0 (0.0%) |
| 2 or 3 Rooms | 0 (0.0%) | 22 (100.0%) |
| 4 or 5 Rooms | 51 (37.2%) | 0 (0.0%) |
| 6 or 7 Rooms | 73 (53.3%) | 0 (0.0%) |
| 8 or more Rooms | 13 (9.5%) | 0 (0.0%) |
| Total | 137 (100.0%) | 22 (100.0%) |
Housing Structure by Heating Type in Huntley
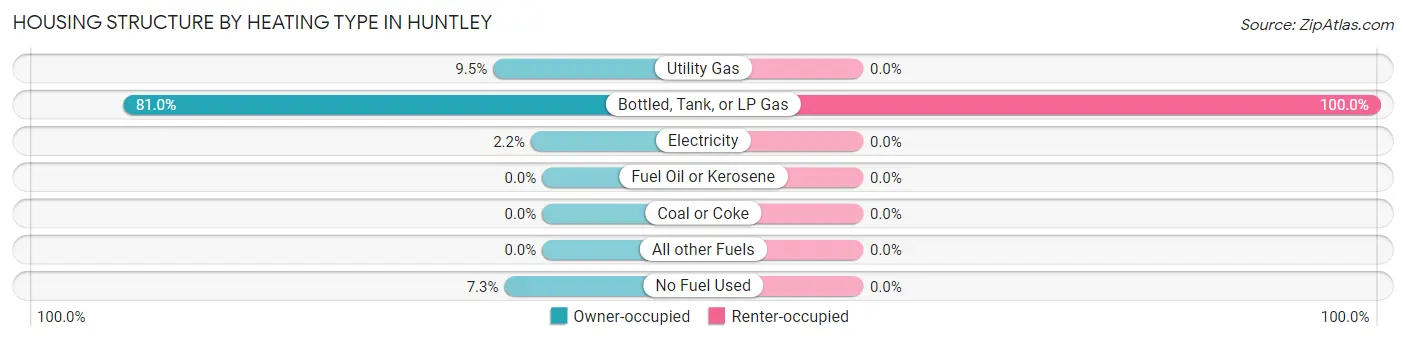
| Heating Type | Owner-occupied | Renter-occupied |
| Utility Gas | 13 (9.5%) | 0 (0.0%) |
| Bottled, Tank, or LP Gas | 111 (81.0%) | 22 (100.0%) |
| Electricity | 3 (2.2%) | 0 (0.0%) |
| Fuel Oil or Kerosene | 0 (0.0%) | 0 (0.0%) |
| Coal or Coke | 0 (0.0%) | 0 (0.0%) |
| All other Fuels | 0 (0.0%) | 0 (0.0%) |
| No Fuel Used | 10 (7.3%) | 0 (0.0%) |
| Total | 137 (100.0%) | 22 (100.0%) |
Household Vehicle Usage in Huntley
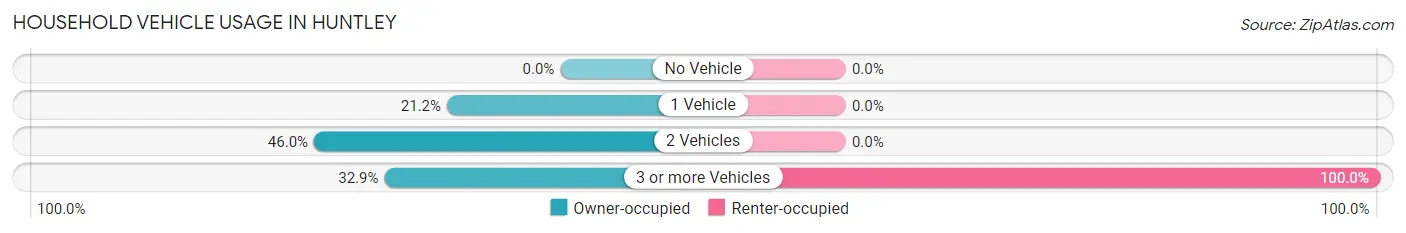
| Vehicles per Household | Owner-occupied | Renter-occupied |
| No Vehicle | 0 (0.0%) | 0 (0.0%) |
| 1 Vehicle | 29 (21.2%) | 0 (0.0%) |
| 2 Vehicles | 63 (46.0%) | 0 (0.0%) |
| 3 or more Vehicles | 45 (32.9%) | 22 (100.0%) |
| Total | 137 (100.0%) | 22 (100.0%) |
Real Estate & Mortgages in Huntley
Real Estate and Mortgage Overview in Huntley
| Characteristic | Without Mortgage | With Mortgage |
| Housing Units | 51 | 86 |
| Median Property Value | - | - |
| Median Household Income | - | - |
| Monthly Housing Costs | - | - |
| Real Estate Taxes | $199 | $60 |
Property Value by Mortgage Status in Huntley
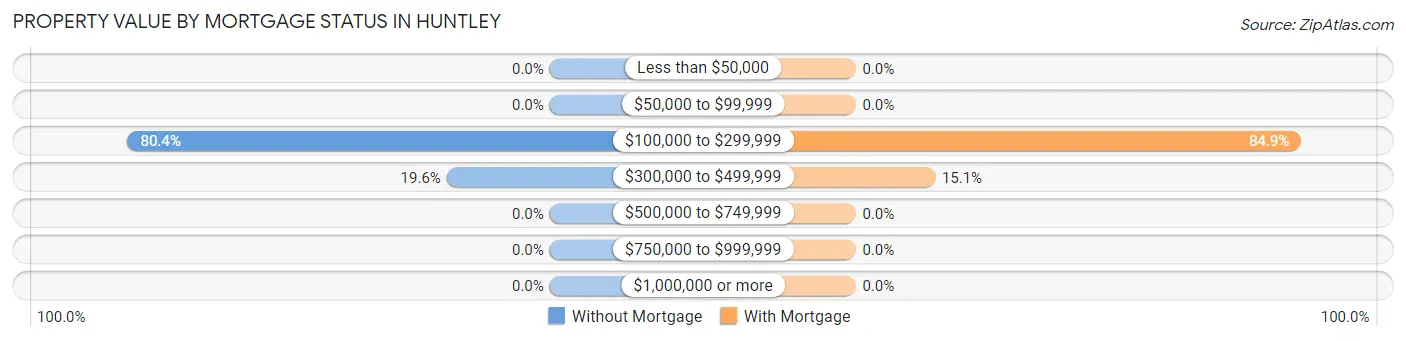
| Property Value | Without Mortgage | With Mortgage |
| Less than $50,000 | 0 (0.0%) | 0 (0.0%) |
| $50,000 to $99,999 | 0 (0.0%) | 0 (0.0%) |
| $100,000 to $299,999 | 41 (80.4%) | 73 (84.9%) |
| $300,000 to $499,999 | 10 (19.6%) | 13 (15.1%) |
| $500,000 to $749,999 | 0 (0.0%) | 0 (0.0%) |
| $750,000 to $999,999 | 0 (0.0%) | 0 (0.0%) |
| $1,000,000 or more | 0 (0.0%) | 0 (0.0%) |
| Total | 51 (100.0%) | 86 (100.0%) |
Household Income by Mortgage Status in Huntley
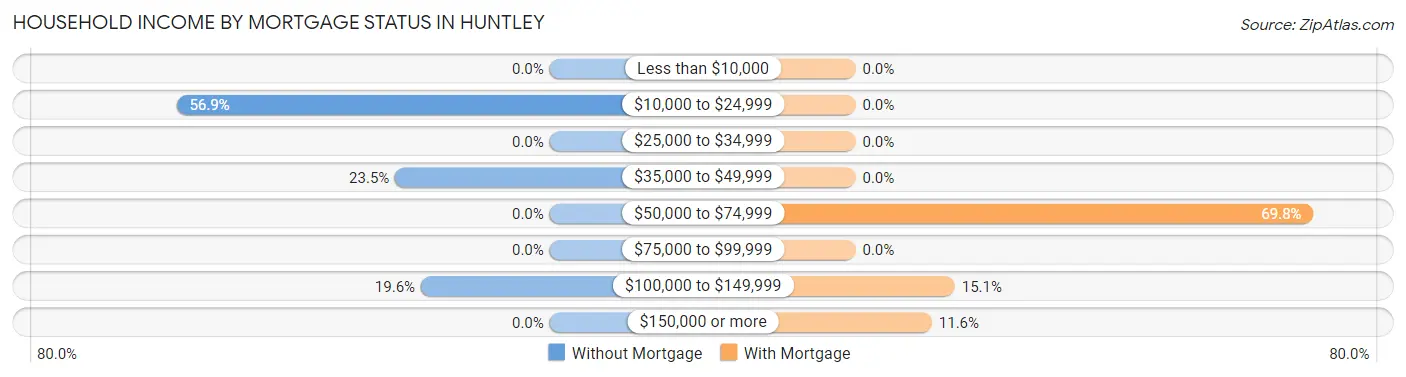
| Household Income | Without Mortgage | With Mortgage |
| Less than $10,000 | 0 (0.0%) | 0 (0.0%) |
| $10,000 to $24,999 | 29 (56.9%) | 0 (0.0%) |
| $25,000 to $34,999 | 0 (0.0%) | 0 (0.0%) |
| $35,000 to $49,999 | 12 (23.5%) | 0 (0.0%) |
| $50,000 to $74,999 | 0 (0.0%) | 60 (69.8%) |
| $75,000 to $99,999 | 0 (0.0%) | 0 (0.0%) |
| $100,000 to $149,999 | 10 (19.6%) | 13 (15.1%) |
| $150,000 or more | 0 (0.0%) | 10 (11.6%) |
| Total | 51 (100.0%) | 86 (100.0%) |
Property Value to Household Income Ratio in Huntley
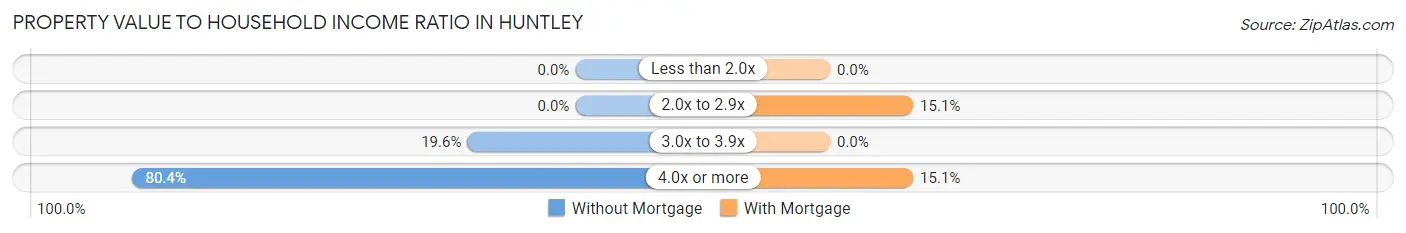
| Value-to-Income Ratio | Without Mortgage | With Mortgage |
| Less than 2.0x | 0 (0.0%) | 0 (0.0%) |
| 2.0x to 2.9x | 0 (0.0%) | 13 (15.1%) |
| 3.0x to 3.9x | 10 (19.6%) | 0 (0.0%) |
| 4.0x or more | 41 (80.4%) | 13 (15.1%) |
| Total | 51 (100.0%) | 86 (100.0%) |
Real Estate Taxes by Mortgage Status in Huntley
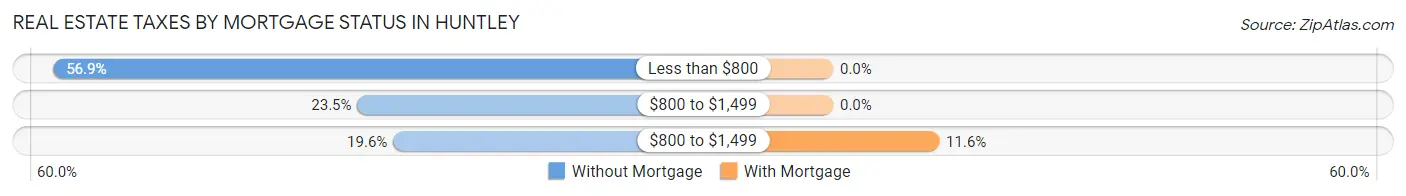
| Property Taxes | Without Mortgage | With Mortgage |
| Less than $800 | 29 (56.9%) | 0 (0.0%) |
| $800 to $1,499 | 12 (23.5%) | 0 (0.0%) |
| $800 to $1,499 | 10 (19.6%) | 10 (11.6%) |
| Total | 51 (100.0%) | 86 (100.0%) |
Health & Disability in Huntley
Health Insurance Coverage by Age in Huntley
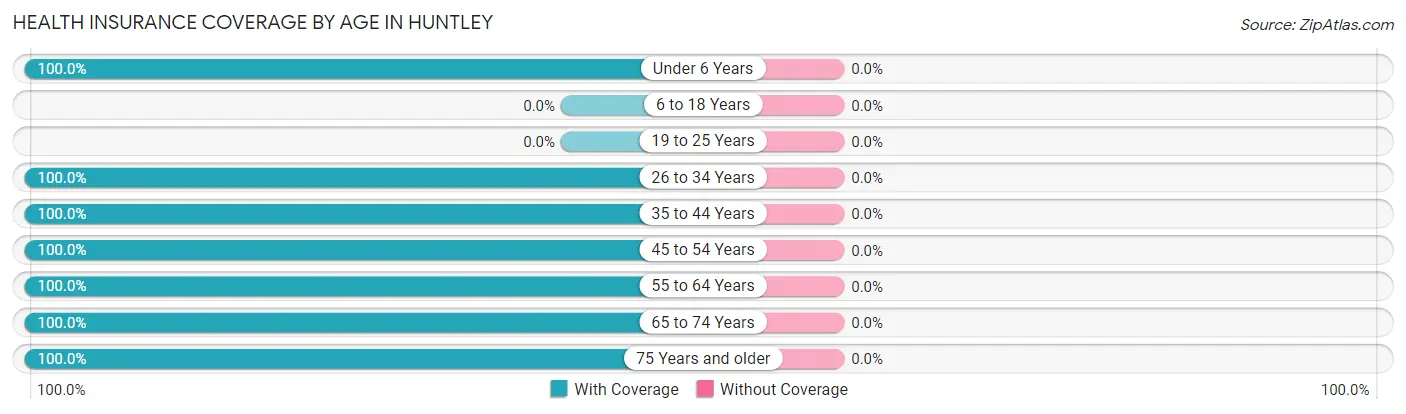
| Age Bracket | With Coverage | Without Coverage |
| Under 6 Years | 100 (100.0%) | 0 (0.0%) |
| 6 to 18 Years | 0 (0.0%) | 0 (0.0%) |
| 19 to 25 Years | 0 (0.0%) | 0 (0.0%) |
| 26 to 34 Years | 60 (100.0%) | 0 (0.0%) |
| 35 to 44 Years | 97 (100.0%) | 0 (0.0%) |
| 45 to 54 Years | 9 (100.0%) | 0 (0.0%) |
| 55 to 64 Years | 47 (100.0%) | 0 (0.0%) |
| 65 to 74 Years | 38 (100.0%) | 0 (0.0%) |
| 75 Years and older | 29 (100.0%) | 0 (0.0%) |
| Total | 380 (100.0%) | 0 (0.0%) |
Health Insurance Coverage by Citizenship Status in Huntley
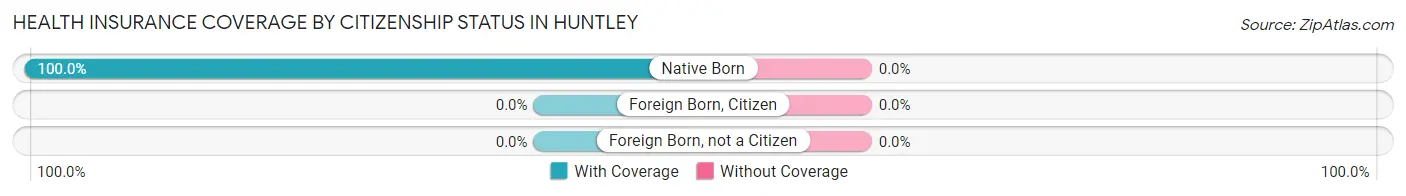
| Citizenship Status | With Coverage | Without Coverage |
| Native Born | 100 (100.0%) | 0 (0.0%) |
| Foreign Born, Citizen | 0 (0.0%) | 0 (0.0%) |
| Foreign Born, not a Citizen | 0 (0.0%) | 0 (0.0%) |
Health Insurance Coverage by Household Income in Huntley
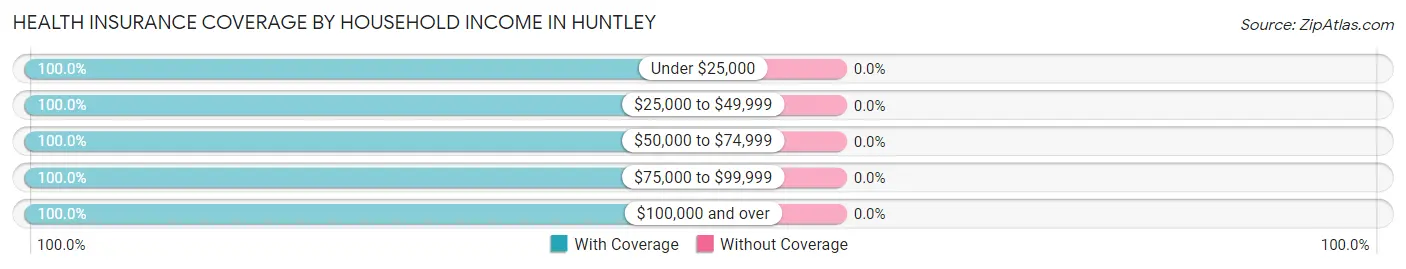
| Household Income | With Coverage | Without Coverage |
| Under $25,000 | 29 (100.0%) | 0 (0.0%) |
| $25,000 to $49,999 | 216 (100.0%) | 0 (0.0%) |
| $50,000 to $74,999 | 65 (100.0%) | 0 (0.0%) |
| $75,000 to $99,999 | 26 (100.0%) | 0 (0.0%) |
| $100,000 and over | 44 (100.0%) | 0 (0.0%) |
Public vs Private Health Insurance Coverage by Age in Huntley
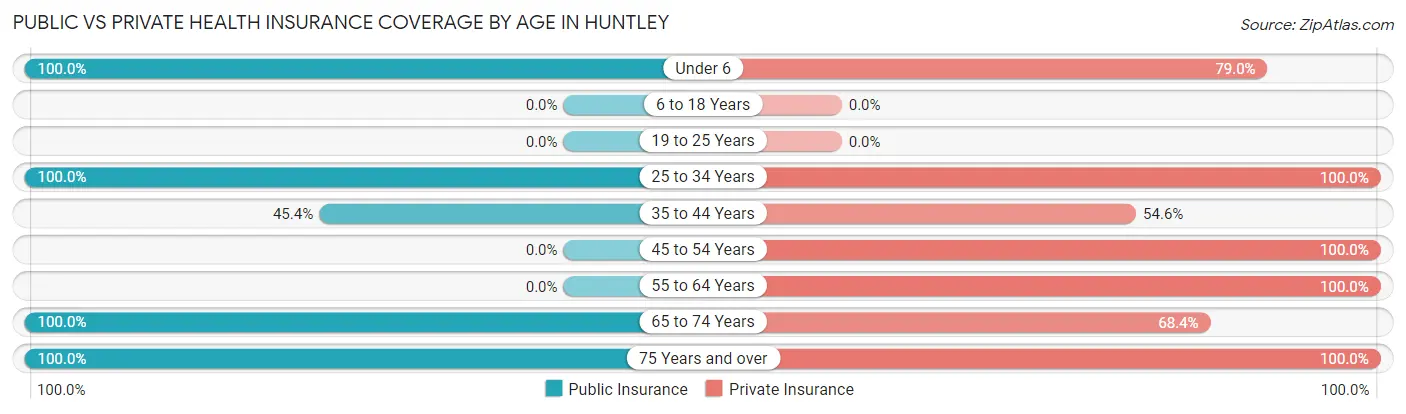
| Age Bracket | Public Insurance | Private Insurance |
| Under 6 | 100 (100.0%) | 79 (79.0%) |
| 6 to 18 Years | 0 (0.0%) | 0 (0.0%) |
| 19 to 25 Years | 0 (0.0%) | 0 (0.0%) |
| 25 to 34 Years | 60 (100.0%) | 60 (100.0%) |
| 35 to 44 Years | 44 (45.4%) | 53 (54.6%) |
| 45 to 54 Years | 0 (0.0%) | 9 (100.0%) |
| 55 to 64 Years | 0 (0.0%) | 47 (100.0%) |
| 65 to 74 Years | 38 (100.0%) | 26 (68.4%) |
| 75 Years and over | 29 (100.0%) | 29 (100.0%) |
| Total | 271 (71.3%) | 303 (79.7%) |
Disability Status by Sex by Age in Huntley
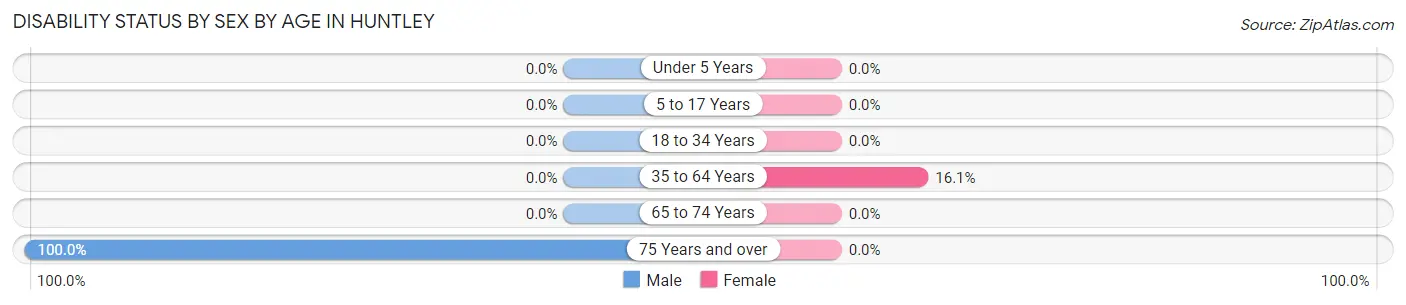
| Age Bracket | Male | Female |
| Under 5 Years | 0 (0.0%) | 0 (0.0%) |
| 5 to 17 Years | 0 (0.0%) | 0 (0.0%) |
| 18 to 34 Years | 0 (0.0%) | 0 (0.0%) |
| 35 to 64 Years | 0 (0.0%) | 9 (16.1%) |
| 65 to 74 Years | 0 (0.0%) | 0 (0.0%) |
| 75 Years and over | 29 (100.0%) | 0 (0.0%) |
Disability Class by Sex by Age in Huntley
Disability Class: Hearing Difficulty
| Age Bracket | Male | Female |
| Under 5 Years | 0 (0.0%) | 0 (0.0%) |
| 5 to 17 Years | 0 (0.0%) | 0 (0.0%) |
| 18 to 34 Years | 0 (0.0%) | 0 (0.0%) |
| 35 to 64 Years | 0 (0.0%) | 0 (0.0%) |
| 65 to 74 Years | 0 (0.0%) | 0 (0.0%) |
| 75 Years and over | 0 (0.0%) | 0 (0.0%) |
Disability Class: Vision Difficulty
| Age Bracket | Male | Female |
| Under 5 Years | 0 (0.0%) | 0 (0.0%) |
| 5 to 17 Years | 0 (0.0%) | 0 (0.0%) |
| 18 to 34 Years | 0 (0.0%) | 0 (0.0%) |
| 35 to 64 Years | 0 (0.0%) | 0 (0.0%) |
| 65 to 74 Years | 0 (0.0%) | 0 (0.0%) |
| 75 Years and over | 0 (0.0%) | 0 (0.0%) |
Disability Class: Cognitive Difficulty
| Age Bracket | Male | Female |
| 5 to 17 Years | 0 (0.0%) | 0 (0.0%) |
| 18 to 34 Years | 0 (0.0%) | 0 (0.0%) |
| 35 to 64 Years | 0 (0.0%) | 0 (0.0%) |
| 65 to 74 Years | 0 (0.0%) | 0 (0.0%) |
| 75 Years and over | 0 (0.0%) | 0 (0.0%) |
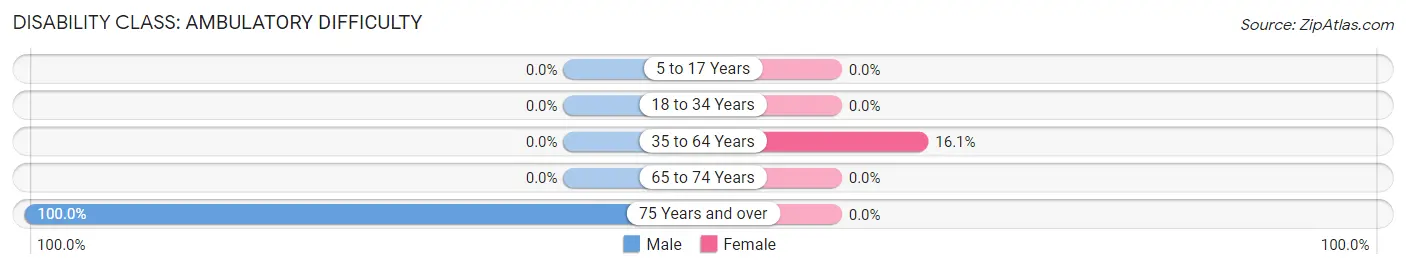
Disability Class: Ambulatory Difficulty
| Age Bracket | Male | Female |
| 5 to 17 Years | 0 (0.0%) | 0 (0.0%) |
| 18 to 34 Years | 0 (0.0%) | 0 (0.0%) |
| 35 to 64 Years | 0 (0.0%) | 9 (16.1%) |
| 65 to 74 Years | 0 (0.0%) | 0 (0.0%) |
| 75 Years and over | 29 (100.0%) | 0 (0.0%) |
Disability Class: Self-Care Difficulty
| Age Bracket | Male | Female |
| 5 to 17 Years | 0 (0.0%) | 0 (0.0%) |
| 18 to 34 Years | 0 (0.0%) | 0 (0.0%) |
| 35 to 64 Years | 0 (0.0%) | 0 (0.0%) |
| 65 to 74 Years | 0 (0.0%) | 0 (0.0%) |
| 75 Years and over | 0 (0.0%) | 0 (0.0%) |
Technology Access in Huntley
Computing Device Access in Huntley
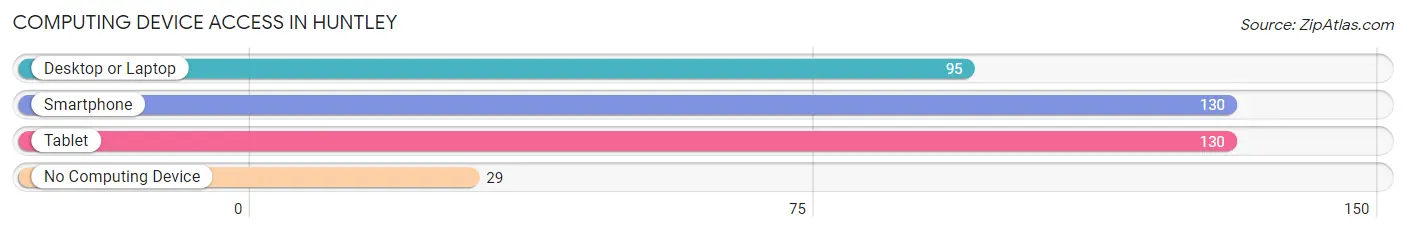
| Device Type | # Households | % Households |
| Desktop or Laptop | 95 | 59.8% |
| Smartphone | 130 | 81.8% |
| Tablet | 130 | 81.8% |
| No Computing Device | 29 | 18.2% |
| Total | 159 | 100.0% |
Internet Access in Huntley
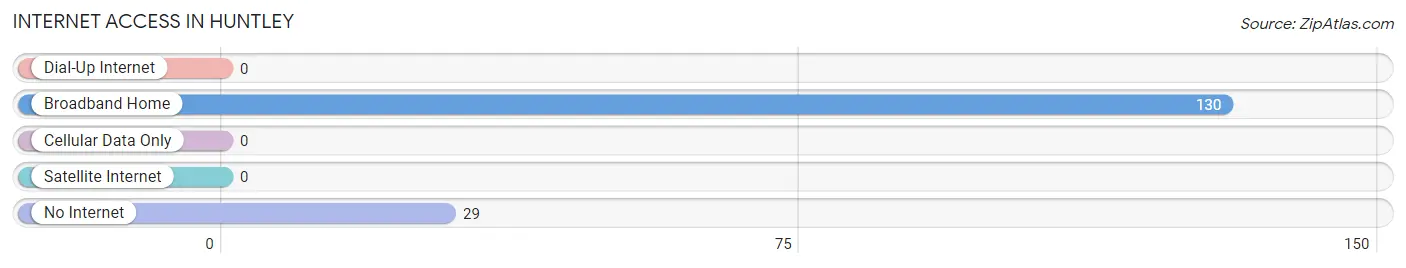
| Internet Type | # Households | % Households |
| Dial-Up Internet | 0 | 0.0% |
| Broadband Home | 130 | 81.8% |
| Cellular Data Only | 0 | 0.0% |
| Satellite Internet | 0 | 0.0% |
| No Internet | 29 | 18.2% |
| Total | 159 | 100.0% |
Huntley Summary
History
The town of Huntley, Montana is located in Yellowstone County, and is part of the Billings Metropolitan Statistical Area. The town was founded in 1882 by the Northern Pacific Railroad, and was named after the railroad’s president, Edward Huntley. The town was originally a stop on the railroad, and was a popular spot for travelers and settlers.
The town of Huntley was originally a farming community, and the main crops grown were wheat, barley, and oats. The town also had a few small businesses, such as a general store, a blacksmith, and a saloon. The town grew slowly, but steadily, and by the early 1900s, it had a population of around 500 people.
In the early 1900s, Huntley began to experience a population boom, as more and more people moved to the area to take advantage of the fertile soil and the abundance of natural resources. The town was also a popular spot for tourists, as it was close to Yellowstone National Park.
By the mid-1900s, Huntley had become a thriving community, with a population of over 1,000 people. The town had a variety of businesses, including a bank, a hotel, a movie theater, and several restaurants. The town also had a school, a library, and a post office.
Geography
Huntley is located in the Yellowstone Valley, in the northern part of Yellowstone County. The town is situated on the banks of the Yellowstone River, and is surrounded by rolling hills and grasslands. The town is located at an elevation of 3,400 feet, and has a total area of 1.2 square miles.
The climate in Huntley is semi-arid, with hot summers and cold winters. The average annual temperature is around 50 degrees Fahrenheit, and the average annual precipitation is around 15 inches.
Economy
The economy of Huntley is largely based on agriculture and tourism. The town is home to several farms, which produce a variety of crops, including wheat, barley, oats, and hay. The town is also home to several tourist attractions, including the Yellowstone National Park, the Little Bighorn Battlefield, and the Pompeys Pillar National Monument.
The town also has a few small businesses, including a general store, a hardware store, and a few restaurants. The town also has a bank, a post office, and a library.
Demographics
As of the 2010 census, the population of Huntley was 1,093. The racial makeup of the town was 97.3% White, 0.7% Native American, 0.3% Asian, 0.2% from other races, and 1.5% from two or more races. The median household income was $45,000, and the median family income was $50,000. The per capita income was $20,000.
Conclusion
Huntley, Montana is a small town located in Yellowstone County. The town was founded in 1882 by the Northern Pacific Railroad, and was originally a farming community. The town has since grown to become a thriving community, with a population of over 1,000 people. The economy of Huntley is largely based on agriculture and tourism, and the town is home to several tourist attractions, including Yellowstone National Park. The town has a diverse population, with a median household income of $45,000.
Common Questions
What is Per Capita Income in Huntley?
Per Capita income in Huntley is $22,613.
What is the Median Family Income in Huntley?
Median Family Income in Huntley is $46,292.
What is the Median Household income in Huntley?
Median Household Income in Huntley is $46,604.
What is Income or Wage Gap in Huntley?
Income or Wage Gap in Huntley is 92.5%.
Women in Huntley earn 7.5 cents for every dollar earned by a man.
What is Inequality or Gini Index in Huntley?
Inequality or Gini Index in Huntley is 0.28.
What is the Total Population of Huntley?
Total Population of Huntley is 380.
What is the Total Male Population of Huntley?
Total Male Population of Huntley is 204.
What is the Total Female Population of Huntley?
Total Female Population of Huntley is 176.
What is the Ratio of Males per 100 Females in Huntley?
There are 115.91 Males per 100 Females in Huntley.
What is the Ratio of Females per 100 Males in Huntley?
There are 86.27 Females per 100 Males in Huntley.
What is the Median Population Age in Huntley?
Median Population Age in Huntley is 38.1 Years.
What is the Average Family Size in Huntley
Average Family Size in Huntley is 2.5 People.
What is the Average Household Size in Huntley
Average Household Size in Huntley is 2.4 People.
How Large is the Labor Force in Huntley?
There are 122 People in the Labor Forcein in Huntley.
What is the Percentage of People in the Labor Force in Huntley?
43.6% of People are in the Labor Force in Huntley.