Pinesdale, MT Map & Demographics
Pinesdale Map
Pinesdale Overview
$20,312
PER CAPITA INCOME
$79,643
AVG FAMILY INCOME
$78,036
AVG HOUSEHOLD INCOME
69.1%
WAGE / INCOME GAP [ % ]
30.9¢/ $1
WAGE / INCOME GAP [ $ ]
0.37
INEQUALITY / GINI INDEX
904
TOTAL POPULATION
460
MALE POPULATION
444
FEMALE POPULATION
103.60
MALES / 100 FEMALES
96.52
FEMALES / 100 MALES
21.7
MEDIAN AGE
4.9
AVG FAMILY SIZE
4.4
AVG HOUSEHOLD SIZE
455
LABOR FORCE [ PEOPLE ]
73.7%
PERCENT IN LABOR FORCE
2.2%
UNEMPLOYMENT RATE
Pinesdale Zip Codes
Pinesdale Area Codes
Income in Pinesdale
Income Overview in Pinesdale
Per Capita Income in Pinesdale is $20,312, while median incomes of families and households are $79,643 and $78,036 respectively.
| Characteristic | Number | Measure |
| Per Capita Income | 904 | $20,312 |
| Median Family Income | 174 | $79,643 |
| Mean Family Income | 174 | $83,346 |
| Median Household Income | 205 | $78,036 |
| Mean Household Income | 205 | $78,431 |
| Income Deficit | 174 | $0 |
| Wage / Income Gap (%) | 904 | 69.08% |
| Wage / Income Gap ($) | 904 | 30.92¢ per $1 |
| Gini / Inequality Index | 904 | 0.37 |
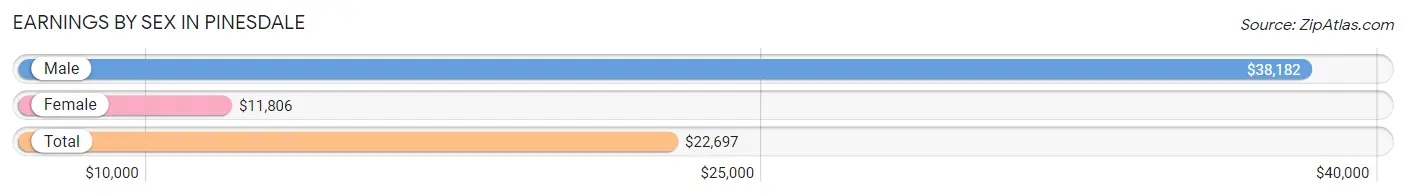
Earnings by Sex in Pinesdale
Average Earnings in Pinesdale are $22,697, $38,182 for men and $11,806 for women, a difference of 69.1%.
| Sex | Number | Average Earnings |
| Male | 262 (53.7%) | $38,182 |
| Female | 226 (46.3%) | $11,806 |
| Total | 488 (100.0%) | $22,697 |
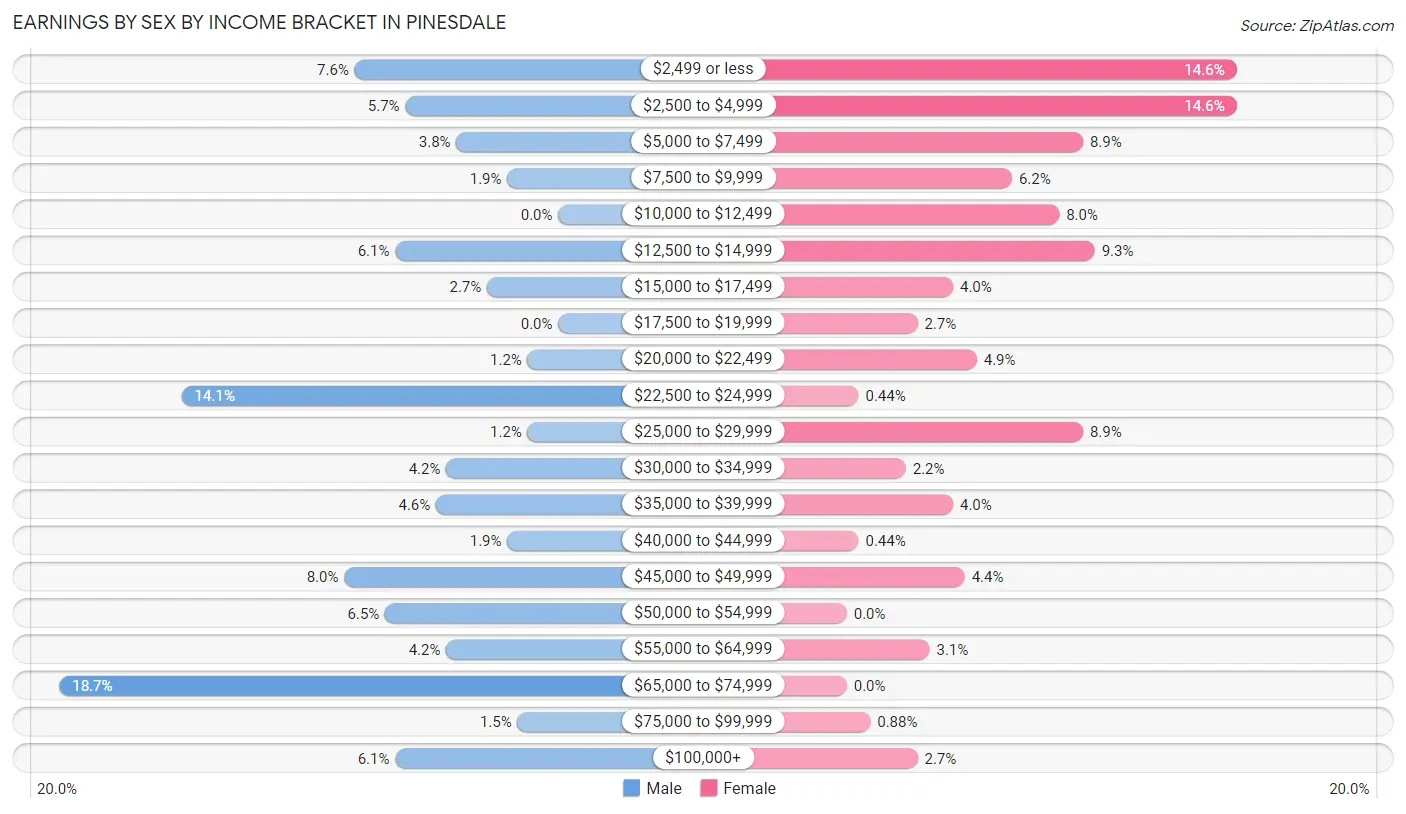
Earnings by Sex by Income Bracket in Pinesdale
The most common earnings brackets in Pinesdale are $65,000 to $74,999 for men (49 | 18.7%) and $2,499 or less for women (33 | 14.6%).
| Income | Male | Female |
| $2,499 or less | 20 (7.6%) | 33 (14.6%) |
| $2,500 to $4,999 | 15 (5.7%) | 33 (14.6%) |
| $5,000 to $7,499 | 10 (3.8%) | 20 (8.8%) |
| $7,500 to $9,999 | 5 (1.9%) | 14 (6.2%) |
| $10,000 to $12,499 | 0 (0.0%) | 18 (8.0%) |
| $12,500 to $14,999 | 16 (6.1%) | 21 (9.3%) |
| $15,000 to $17,499 | 7 (2.7%) | 9 (4.0%) |
| $17,500 to $19,999 | 0 (0.0%) | 6 (2.6%) |
| $20,000 to $22,499 | 3 (1.1%) | 11 (4.9%) |
| $22,500 to $24,999 | 37 (14.1%) | 1 (0.4%) |
| $25,000 to $29,999 | 3 (1.1%) | 20 (8.8%) |
| $30,000 to $34,999 | 11 (4.2%) | 5 (2.2%) |
| $35,000 to $39,999 | 12 (4.6%) | 9 (4.0%) |
| $40,000 to $44,999 | 5 (1.9%) | 1 (0.4%) |
| $45,000 to $49,999 | 21 (8.0%) | 10 (4.4%) |
| $50,000 to $54,999 | 17 (6.5%) | 0 (0.0%) |
| $55,000 to $64,999 | 11 (4.2%) | 7 (3.1%) |
| $65,000 to $74,999 | 49 (18.7%) | 0 (0.0%) |
| $75,000 to $99,999 | 4 (1.5%) | 2 (0.9%) |
| $100,000+ | 16 (6.1%) | 6 (2.6%) |
| Total | 262 (100.0%) | 226 (100.0%) |
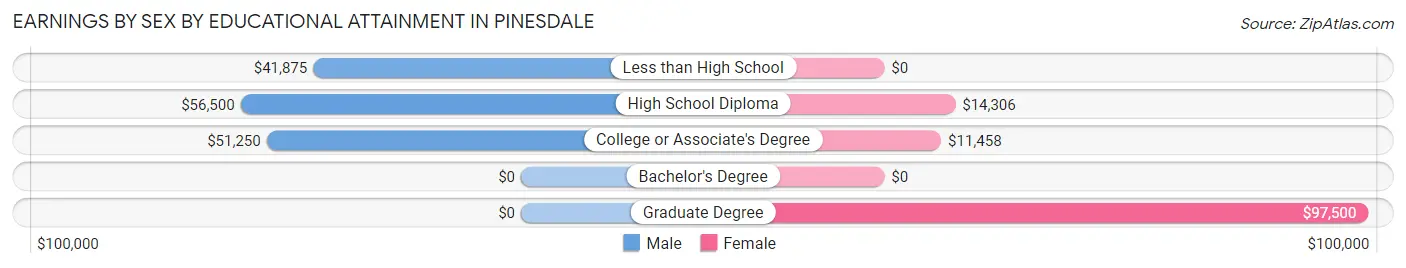
Earnings by Sex by Educational Attainment in Pinesdale
Average earnings in Pinesdale are $50,000 for men and $13,929 for women, a difference of 72.1%. Men with an educational attainment of high school diploma enjoy the highest average annual earnings of $56,500, while those with less than high school education earn the least with $41,875. Women with an educational attainment of graduate degree earn the most with the average annual earnings of $97,500, while those with college or associate's degree education have the smallest earnings of $11,458.
| Educational Attainment | Male Income | Female Income |
| Less than High School | $41,875 | $0 |
| High School Diploma | $56,500 | $14,306 |
| College or Associate's Degree | $51,250 | $11,458 |
| Bachelor's Degree | - | - |
| Graduate Degree | - | - |
| Total | $50,000 | $13,929 |
Family Income in Pinesdale
Family Income Brackets in Pinesdale
According to the Pinesdale family income data, there are 54 families falling into the $75,000 to $99,999 income range, which is the most common income bracket and makes up 31.0% of all families. Conversely, the $10,000 to $14,999 income bracket is the least frequent group with only 4 families (2.3%) belonging to this category.
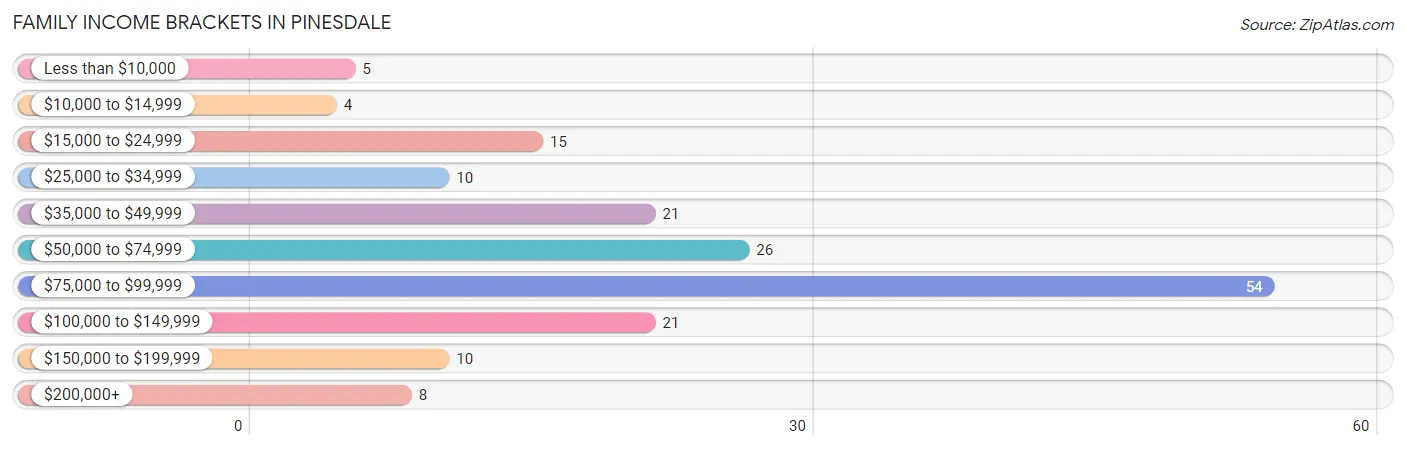
| Income Bracket | # Families | % Families |
| Less than $10,000 | 5 | 2.9% |
| $10,000 to $14,999 | 4 | 2.3% |
| $15,000 to $24,999 | 15 | 8.6% |
| $25,000 to $34,999 | 10 | 5.7% |
| $35,000 to $49,999 | 21 | 12.1% |
| $50,000 to $74,999 | 26 | 14.9% |
| $75,000 to $99,999 | 54 | 31.0% |
| $100,000 to $149,999 | 21 | 12.1% |
| $150,000 to $199,999 | 10 | 5.7% |
| $200,000+ | 8 | 4.6% |
Family Income by Famaliy Size in Pinesdale
7+ person families (31 | 17.8%) account for the highest median family income in Pinesdale with $120,313 per family, while 3-person families (30 | 17.2%) have the highest median income of $17,619 per family member.
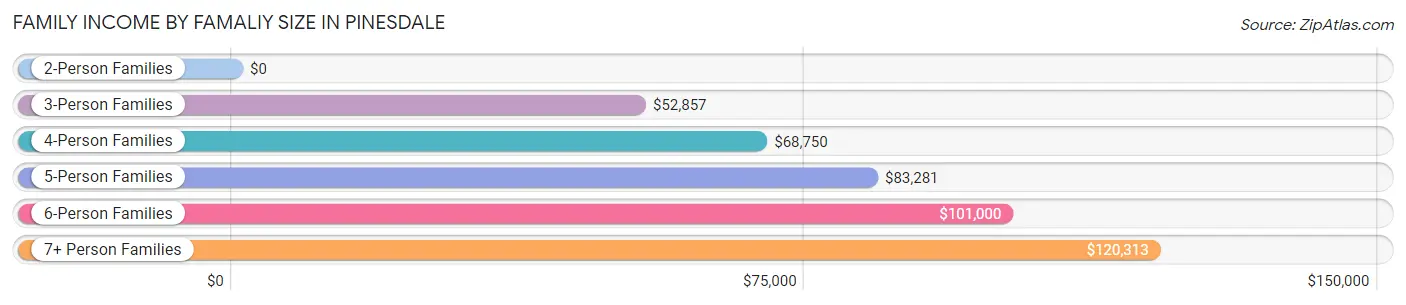
| Income Bracket | # Families | Median Income |
| 2-Person Families | 38 (21.8%) | $0 |
| 3-Person Families | 30 (17.2%) | $52,857 |
| 4-Person Families | 22 (12.6%) | $68,750 |
| 5-Person Families | 41 (23.6%) | $83,281 |
| 6-Person Families | 12 (6.9%) | $101,000 |
| 7+ Person Families | 31 (17.8%) | $120,313 |
| Total | 174 (100.0%) | $79,643 |
Family Income by Number of Earners in Pinesdale
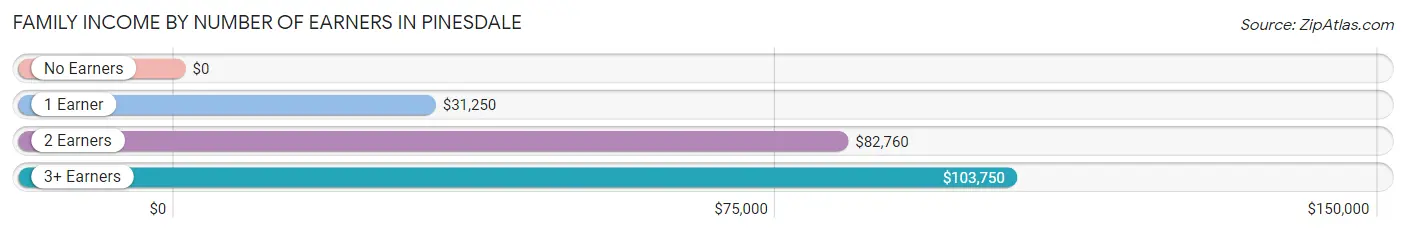
| Number of Earners | # Families | Median Income |
| No Earners | 5 (2.9%) | $0 |
| 1 Earner | 41 (23.6%) | $31,250 |
| 2 Earners | 91 (52.3%) | $82,760 |
| 3+ Earners | 37 (21.3%) | $103,750 |
| Total | 174 (100.0%) | $79,643 |
Household Income in Pinesdale
Household Income Brackets in Pinesdale
With 64 households falling in the category, the $75,000 to $99,999 income range is the most frequent in Pinesdale, accounting for 31.2% of all households. In contrast, only 4 households (1.9%) fall into the $10,000 to $14,999 income bracket, making it the least populous group.
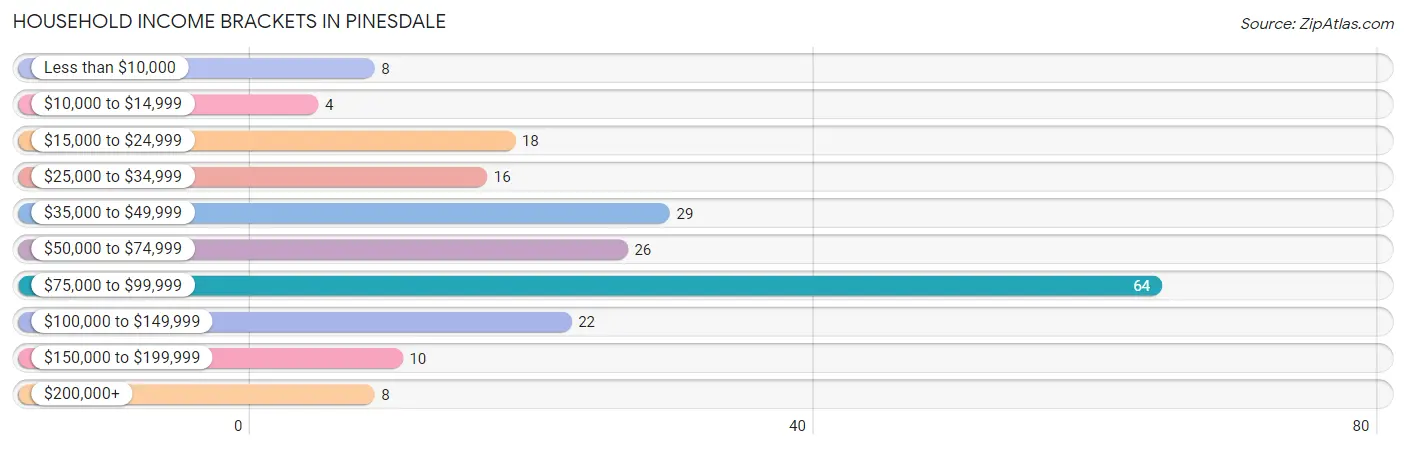
| Income Bracket | # Households | % Households |
| Less than $10,000 | 8 | 3.9% |
| $10,000 to $14,999 | 4 | 2.0% |
| $15,000 to $24,999 | 18 | 8.8% |
| $25,000 to $34,999 | 16 | 7.8% |
| $35,000 to $49,999 | 29 | 14.1% |
| $50,000 to $74,999 | 26 | 12.7% |
| $75,000 to $99,999 | 64 | 31.2% |
| $100,000 to $149,999 | 22 | 10.7% |
| $150,000 to $199,999 | 10 | 4.9% |
| $200,000+ | 8 | 3.9% |
Household Income by Householder Age in Pinesdale
The median household income in Pinesdale is $78,036, with the highest median household income of $81,719 found in the 15 to 24 years age bracket for the primary householder. A total of 21 households (10.2%) fall into this category. Meanwhile, the 65+ years age bracket for the primary householder has the lowest median household income of $33,333, with 26 households (12.7%) in this group.
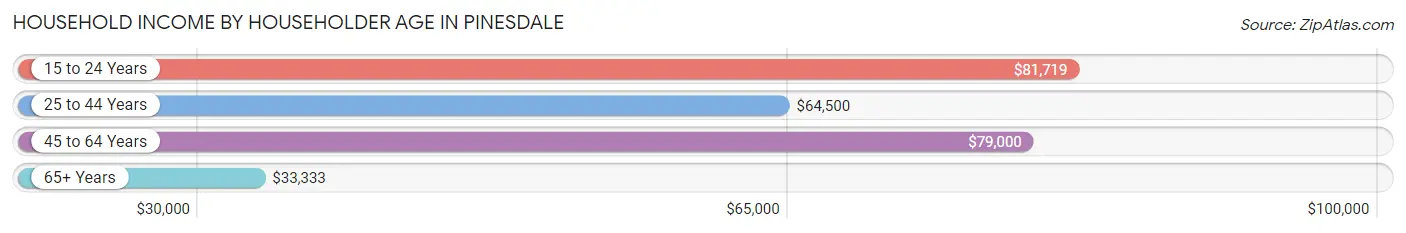
| Income Bracket | # Households | Median Income |
| 15 to 24 Years | 21 (10.2%) | $81,719 |
| 25 to 44 Years | 82 (40.0%) | $64,500 |
| 45 to 64 Years | 76 (37.1%) | $79,000 |
| 65+ Years | 26 (12.7%) | $33,333 |
| Total | 205 (100.0%) | $78,036 |
Poverty in Pinesdale
Income Below Poverty by Sex and Age in Pinesdale
With 13.5% poverty level for males and 15.8% for females among the residents of Pinesdale, 65 to 74 year old males and 65 to 74 year old females are the most vulnerable to poverty, with 6 males (60.0%) and 5 females (41.7%) in their respective age groups living below the poverty level.
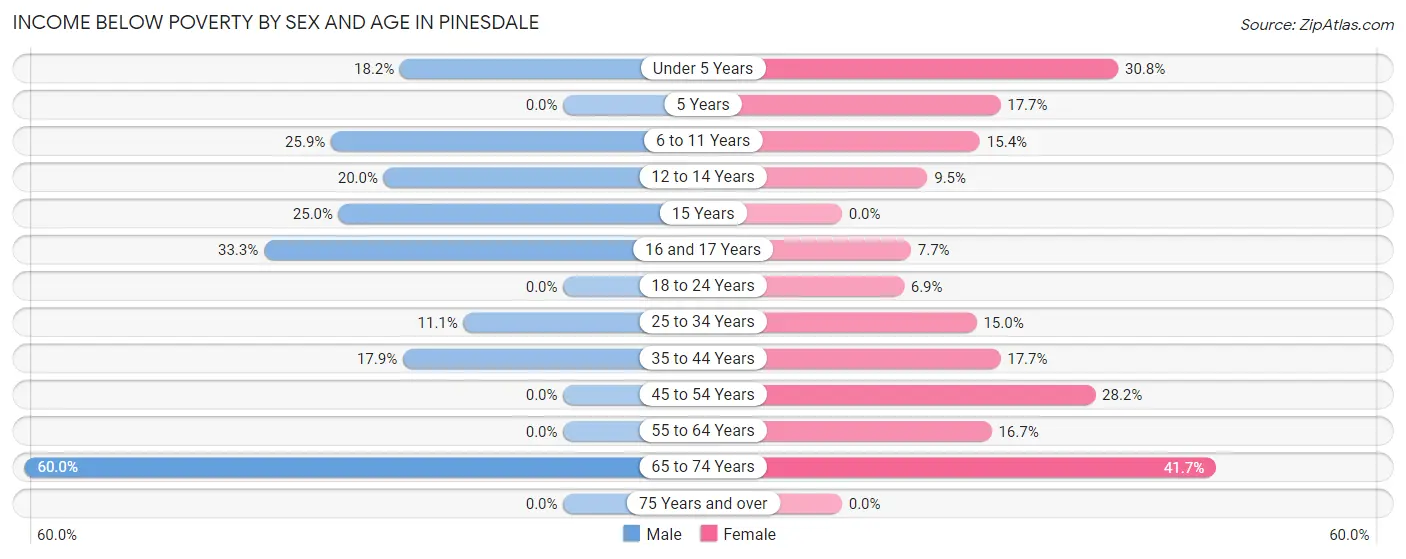
| Age Bracket | Male | Female |
| Under 5 Years | 6 (18.2%) | 16 (30.8%) |
| 5 Years | 0 (0.0%) | 3 (17.6%) |
| 6 to 11 Years | 15 (25.9%) | 4 (15.4%) |
| 12 to 14 Years | 8 (20.0%) | 2 (9.5%) |
| 15 Years | 5 (25.0%) | 0 (0.0%) |
| 16 and 17 Years | 10 (33.3%) | 2 (7.7%) |
| 18 to 24 Years | 0 (0.0%) | 6 (6.9%) |
| 25 to 34 Years | 7 (11.1%) | 9 (15.0%) |
| 35 to 44 Years | 5 (17.9%) | 6 (17.6%) |
| 45 to 54 Years | 0 (0.0%) | 11 (28.2%) |
| 55 to 64 Years | 0 (0.0%) | 6 (16.7%) |
| 65 to 74 Years | 6 (60.0%) | 5 (41.7%) |
| 75 Years and over | 0 (0.0%) | 0 (0.0%) |
| Total | 62 (13.5%) | 70 (15.8%) |
Income Above Poverty by Sex and Age in Pinesdale
According to the poverty statistics in Pinesdale, males aged 18 to 24 years and females aged 15 years are the age groups that are most secure financially, with 100.0% of males and 100.0% of females in these age groups living above the poverty line.
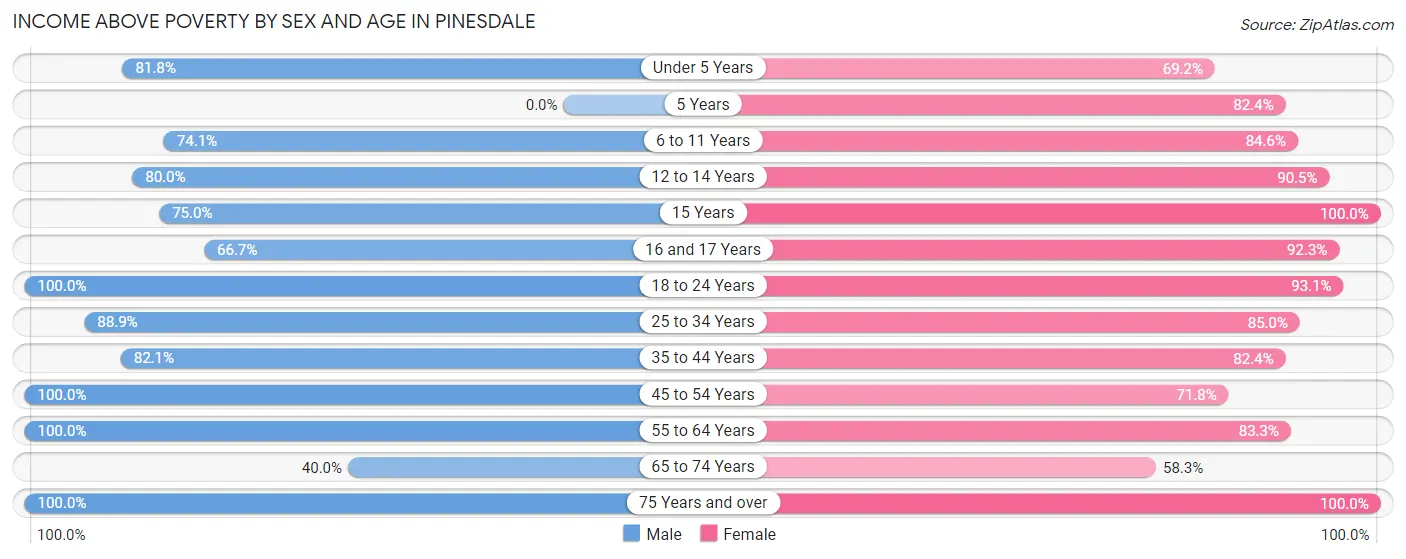
| Age Bracket | Male | Female |
| Under 5 Years | 27 (81.8%) | 36 (69.2%) |
| 5 Years | 0 (0.0%) | 14 (82.4%) |
| 6 to 11 Years | 43 (74.1%) | 22 (84.6%) |
| 12 to 14 Years | 32 (80.0%) | 19 (90.5%) |
| 15 Years | 15 (75.0%) | 18 (100.0%) |
| 16 and 17 Years | 20 (66.7%) | 24 (92.3%) |
| 18 to 24 Years | 120 (100.0%) | 81 (93.1%) |
| 25 to 34 Years | 56 (88.9%) | 51 (85.0%) |
| 35 to 44 Years | 23 (82.1%) | 28 (82.4%) |
| 45 to 54 Years | 24 (100.0%) | 28 (71.8%) |
| 55 to 64 Years | 24 (100.0%) | 30 (83.3%) |
| 65 to 74 Years | 4 (40.0%) | 7 (58.3%) |
| 75 Years and over | 8 (100.0%) | 16 (100.0%) |
| Total | 396 (86.5%) | 374 (84.2%) |
Income Below Poverty Among Married-Couple Families in Pinesdale
The poverty statistics for married-couple families in Pinesdale show that 10.5% or 12 of the total 114 families live below the poverty line. Families with no children have the highest poverty rate of 19.4%, comprising of 6 families. On the other hand, families with 3 or 4 children have the lowest poverty rate of 0.0%, which includes 0 families.
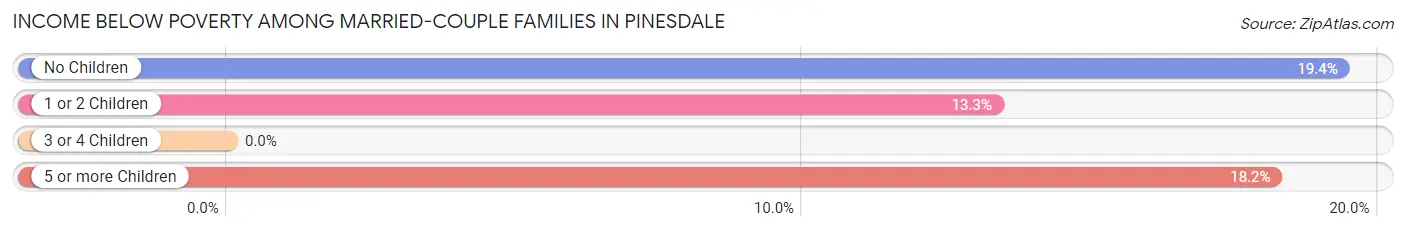
| Children | Above Poverty | Below Poverty |
| No Children | 25 (80.6%) | 6 (19.4%) |
| 1 or 2 Children | 26 (86.7%) | 4 (13.3%) |
| 3 or 4 Children | 42 (100.0%) | 0 (0.0%) |
| 5 or more Children | 9 (81.8%) | 2 (18.2%) |
| Total | 102 (89.5%) | 12 (10.5%) |
Income Below Poverty Among Single-Parent Households in Pinesdale
According to the poverty data in Pinesdale, 15.8% or 3 single-father households and 26.8% or 11 single-mother households are living below the poverty line. Among single-father households, those with 5 or more children have the highest poverty rate, with 3 households (100.0%) experiencing poverty. Likewise, among single-mother households, those with 3 or 4 children have the highest poverty rate, with 6 households (35.3%) falling below the poverty line.
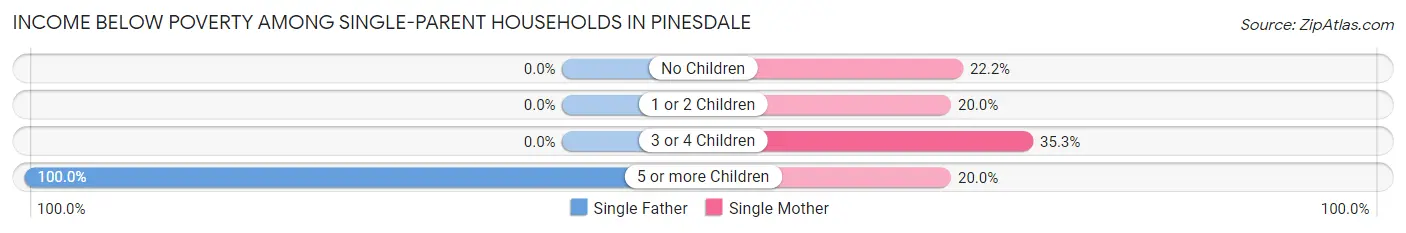
| Children | Single Father | Single Mother |
| No Children | 0 (0.0%) | 2 (22.2%) |
| 1 or 2 Children | 0 (0.0%) | 2 (20.0%) |
| 3 or 4 Children | 0 (0.0%) | 6 (35.3%) |
| 5 or more Children | 3 (100.0%) | 1 (20.0%) |
| Total | 3 (15.8%) | 11 (26.8%) |
Income Below Poverty Among Married-Couple vs Single-Parent Households in Pinesdale
The poverty data for Pinesdale shows that 12 of the married-couple family households (10.5%) and 14 of the single-parent households (23.3%) are living below the poverty level. Within the married-couple family households, those with no children have the highest poverty rate, with 6 households (19.4%) falling below the poverty line. Among the single-parent households, those with 5 or more children have the highest poverty rate, with 4 household (50.0%) living below poverty.
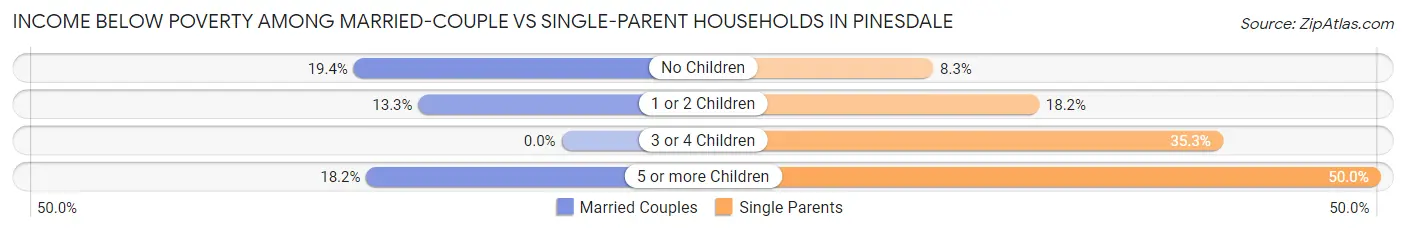
| Children | Married-Couple Families | Single-Parent Households |
| No Children | 6 (19.4%) | 2 (8.3%) |
| 1 or 2 Children | 4 (13.3%) | 2 (18.2%) |
| 3 or 4 Children | 0 (0.0%) | 6 (35.3%) |
| 5 or more Children | 2 (18.2%) | 4 (50.0%) |
| Total | 12 (10.5%) | 14 (23.3%) |
Race in Pinesdale
The most populous races in Pinesdale are White / Caucasian (848 | 93.8%), Hispanic or Latino (54 | 6.0%), and Two or more Races (52 | 5.8%).
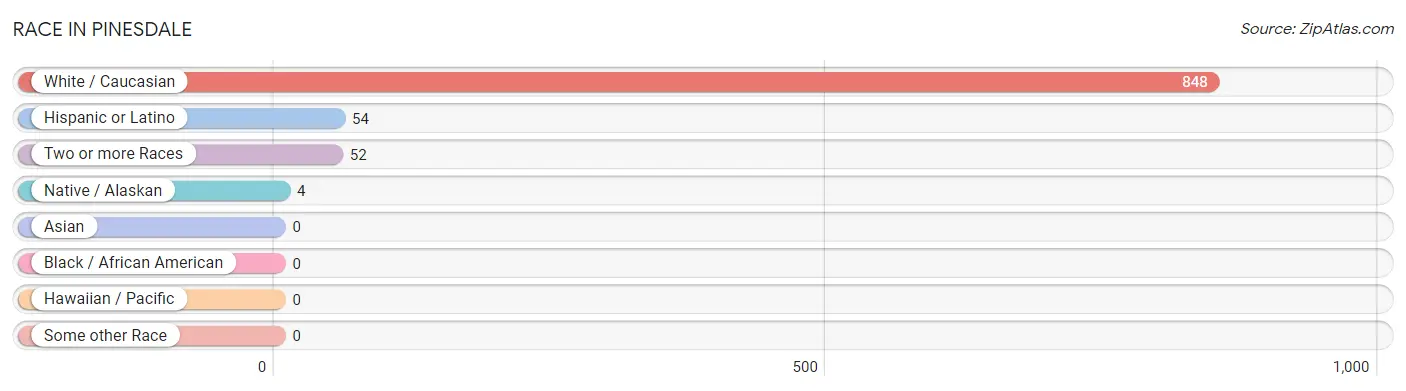
| Race | # Population | % Population |
| Asian | 0 | 0.0% |
| Black / African American | 0 | 0.0% |
| Hawaiian / Pacific | 0 | 0.0% |
| Hispanic or Latino | 54 | 6.0% |
| Native / Alaskan | 4 | 0.4% |
| White / Caucasian | 848 | 93.8% |
| Two or more Races | 52 | 5.8% |
| Some other Race | 0 | 0.0% |
| Total | 904 | 100.0% |
Ancestry in Pinesdale
The most populous ancestries reported in Pinesdale are English (208 | 23.0%), German (197 | 21.8%), American (97 | 10.7%), Irish (67 | 7.4%), and Scottish (67 | 7.4%), together accounting for 70.4% of all Pinesdale residents.
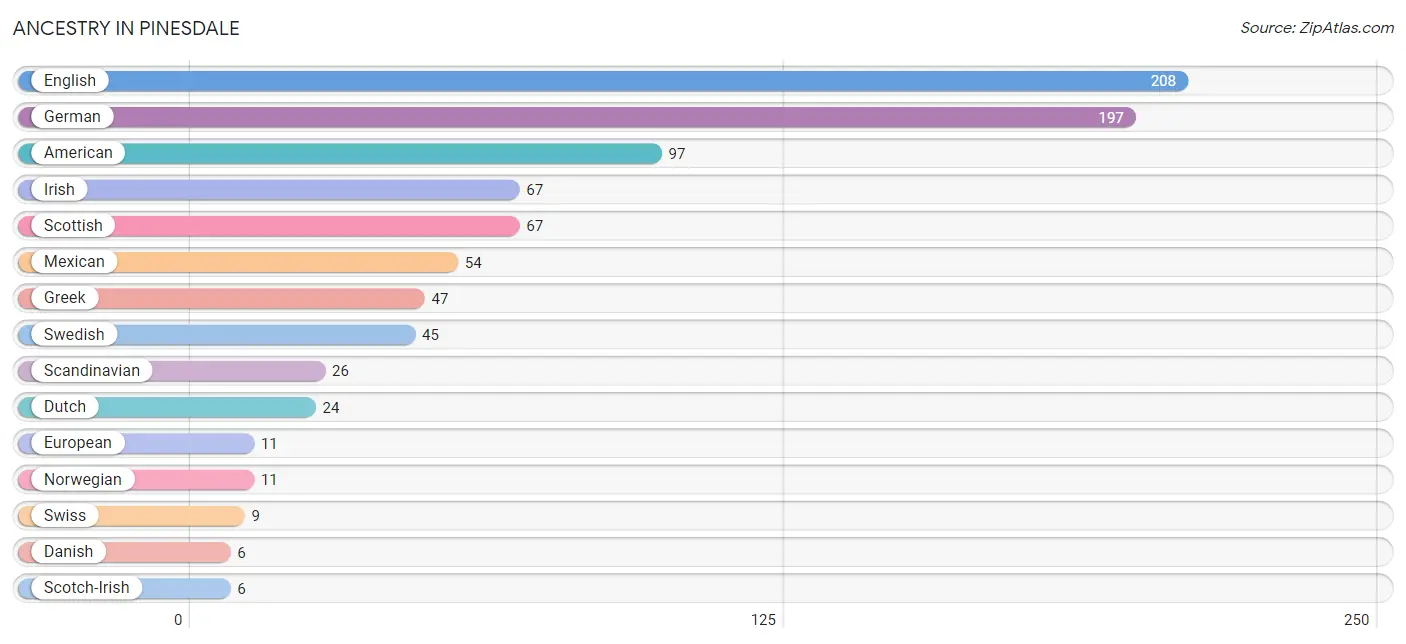
| Ancestry | # Population | % Population |
| American | 97 | 10.7% |
| Danish | 6 | 0.7% |
| Dutch | 24 | 2.6% |
| English | 208 | 23.0% |
| European | 11 | 1.2% |
| French | 2 | 0.2% |
| German | 197 | 21.8% |
| Greek | 47 | 5.2% |
| Hopi | 4 | 0.4% |
| Irish | 67 | 7.4% |
| Mexican | 54 | 6.0% |
| Northern European | 4 | 0.4% |
| Norwegian | 11 | 1.2% |
| Scandinavian | 26 | 2.9% |
| Scotch-Irish | 6 | 0.7% |
| Scottish | 67 | 7.4% |
| Swedish | 45 | 5.0% |
| Swiss | 9 | 1.0% |
| Welsh | 2 | 0.2% | View All 19 Rows |
Immigrants in Pinesdale
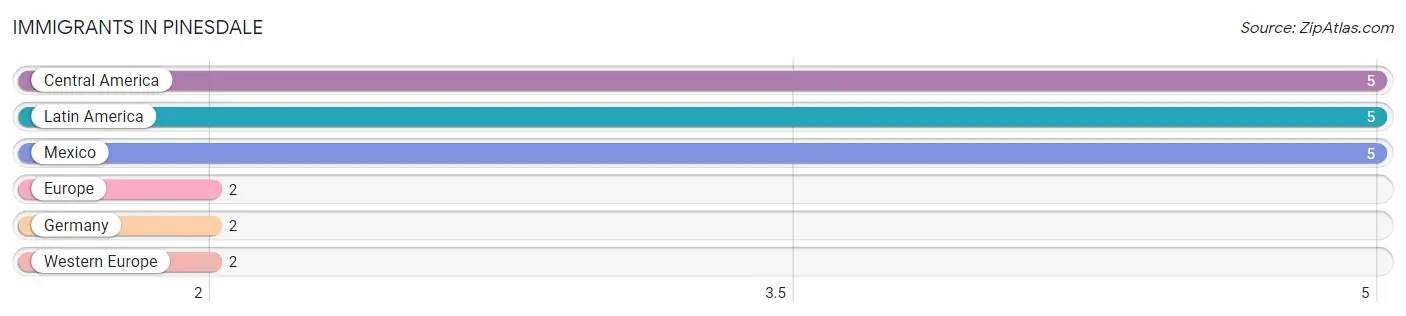
The most numerous immigrant groups reported in Pinesdale came from Central America (5 | 0.5%), Latin America (5 | 0.5%), Mexico (5 | 0.5%), Europe (2 | 0.2%), and Germany (2 | 0.2%), together accounting for 2.1% of all Pinesdale residents.
| Immigration Origin | # Population | % Population |
| Central America | 5 | 0.5% |
| Europe | 2 | 0.2% |
| Germany | 2 | 0.2% |
| Latin America | 5 | 0.5% |
| Mexico | 5 | 0.5% |
| Western Europe | 2 | 0.2% | View All 6 Rows |
Sex and Age in Pinesdale
Sex and Age in Pinesdale
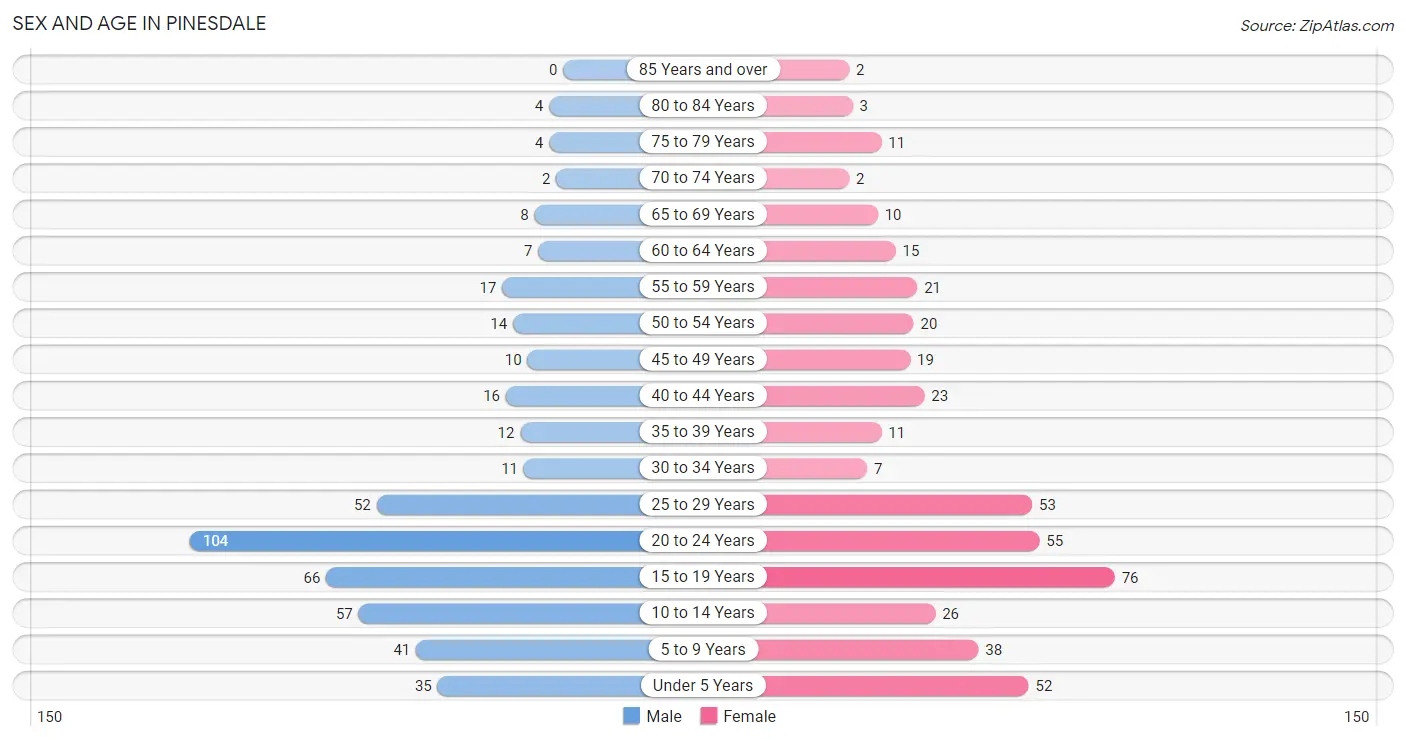
The most populous age groups in Pinesdale are 20 to 24 Years (104 | 22.6%) for men and 15 to 19 Years (76 | 17.1%) for women.
| Age Bracket | Male | Female |
| Under 5 Years | 35 (7.6%) | 52 (11.7%) |
| 5 to 9 Years | 41 (8.9%) | 38 (8.6%) |
| 10 to 14 Years | 57 (12.4%) | 26 (5.9%) |
| 15 to 19 Years | 66 (14.3%) | 76 (17.1%) |
| 20 to 24 Years | 104 (22.6%) | 55 (12.4%) |
| 25 to 29 Years | 52 (11.3%) | 53 (11.9%) |
| 30 to 34 Years | 11 (2.4%) | 7 (1.6%) |
| 35 to 39 Years | 12 (2.6%) | 11 (2.5%) |
| 40 to 44 Years | 16 (3.5%) | 23 (5.2%) |
| 45 to 49 Years | 10 (2.2%) | 19 (4.3%) |
| 50 to 54 Years | 14 (3.0%) | 20 (4.5%) |
| 55 to 59 Years | 17 (3.7%) | 21 (4.7%) |
| 60 to 64 Years | 7 (1.5%) | 15 (3.4%) |
| 65 to 69 Years | 8 (1.7%) | 10 (2.2%) |
| 70 to 74 Years | 2 (0.4%) | 2 (0.4%) |
| 75 to 79 Years | 4 (0.9%) | 11 (2.5%) |
| 80 to 84 Years | 4 (0.9%) | 3 (0.7%) |
| 85 Years and over | 0 (0.0%) | 2 (0.4%) |
| Total | 460 (100.0%) | 444 (100.0%) |
Families and Households in Pinesdale
Median Family Size in Pinesdale
The median family size in Pinesdale is 4.87 persons per family, with single female/mother families (41 | 23.6%) accounting for the largest median family size of 5.54 persons per family. On the other hand, single male/father families (19 | 10.9%) represent the smallest median family size with 4.16 persons per family.
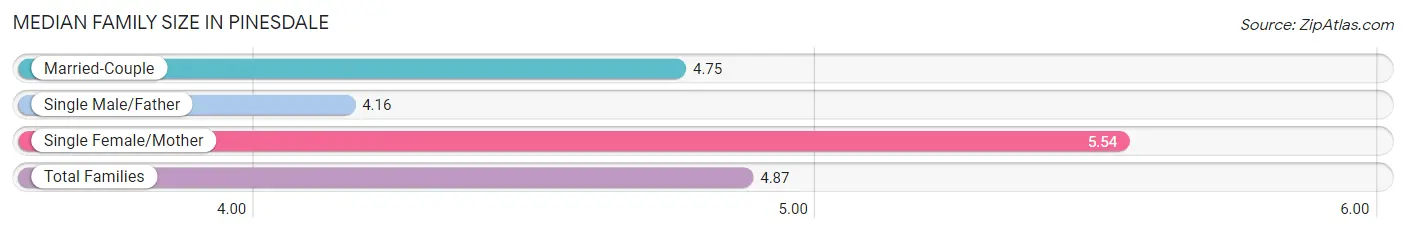
| Family Type | # Families | Family Size |
| Married-Couple | 114 (65.5%) | 4.75 |
| Single Male/Father | 19 (10.9%) | 4.16 |
| Single Female/Mother | 41 (23.6%) | 5.54 |
| Total Families | 174 (100.0%) | 4.87 |
Median Household Size in Pinesdale
The median household size in Pinesdale is 4.41 persons per household, with single female/mother households (41 | 20.0%) accounting for the largest median household size of 5.54 persons per household. non-family households (31 | 15.1%) represent the smallest median household size with 1.26 persons per household.
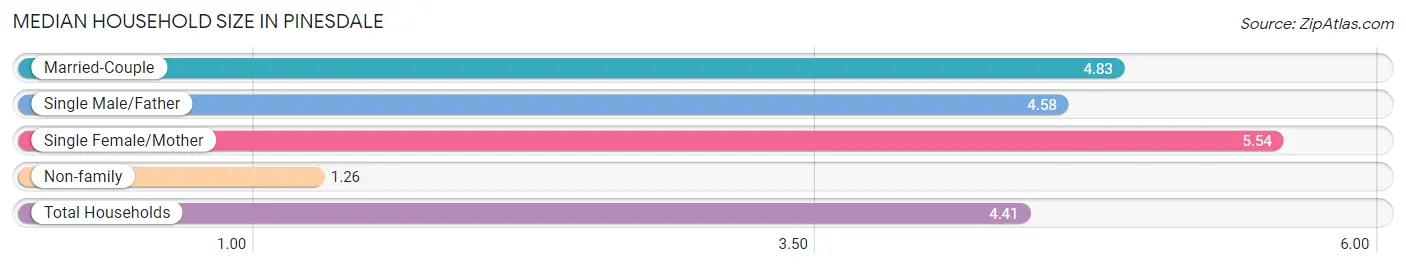
| Household Type | # Households | Household Size |
| Married-Couple | 114 (55.6%) | 4.83 |
| Single Male/Father | 19 (9.3%) | 4.58 |
| Single Female/Mother | 41 (20.0%) | 5.54 |
| Non-family | 31 (15.1%) | 1.26 |
| Total Households | 205 (100.0%) | 4.41 |
Household Size by Marriage Status in Pinesdale
Out of a total of 205 households in Pinesdale, 174 (84.9%) are family households, while 31 (15.1%) are nonfamily households. The most numerous type of family households are 5-person households, comprising 48, and the most common type of nonfamily households are 1-person households, comprising 21.
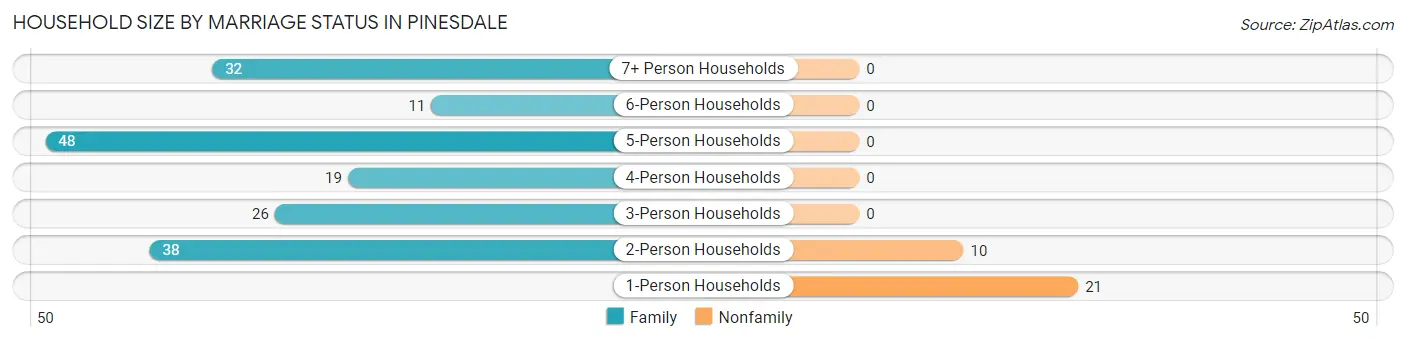
| Household Size | Family Households | Nonfamily Households |
| 1-Person Households | - | 21 (10.2%) |
| 2-Person Households | 38 (18.5%) | 10 (4.9%) |
| 3-Person Households | 26 (12.7%) | 0 (0.0%) |
| 4-Person Households | 19 (9.3%) | 0 (0.0%) |
| 5-Person Households | 48 (23.4%) | 0 (0.0%) |
| 6-Person Households | 11 (5.4%) | 0 (0.0%) |
| 7+ Person Households | 32 (15.6%) | 0 (0.0%) |
| Total | 174 (84.9%) | 31 (15.1%) |
Female Fertility in Pinesdale
Fertility by Age in Pinesdale
Average fertility rate in Pinesdale is 97.0 births per 1,000 women. Women in the age bracket of 20 to 34 years have the highest fertility rate with 174.0 births per 1,000 women. Women in the age bracket of 20 to 34 years acount for 83.3% of all women with births.
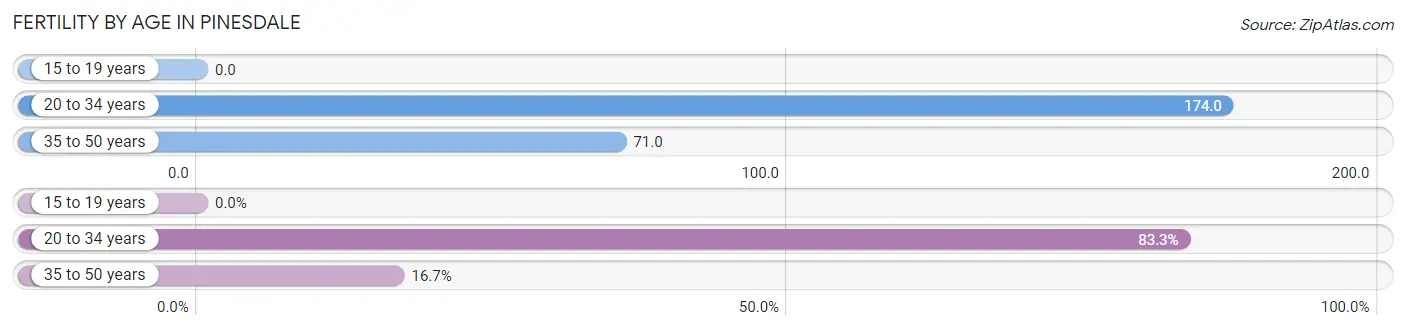
| Age Bracket | Women with Births | Births / 1,000 Women |
| 15 to 19 years | 0 (0.0%) | 0.0 |
| 20 to 34 years | 20 (83.3%) | 174.0 |
| 35 to 50 years | 4 (16.7%) | 71.0 |
| Total | 24 (100.0%) | 97.0 |
Fertility by Age by Marriage Status in Pinesdale
91.7% of women with births (24) in Pinesdale are married. The highest percentage of unmarried women with births falls into 35 to 50 years age bracket with 50.0% of them unmarried at the time of birth, while the lowest percentage of unmarried women with births belong to 20 to 34 years age bracket with 0.0% of them unmarried.
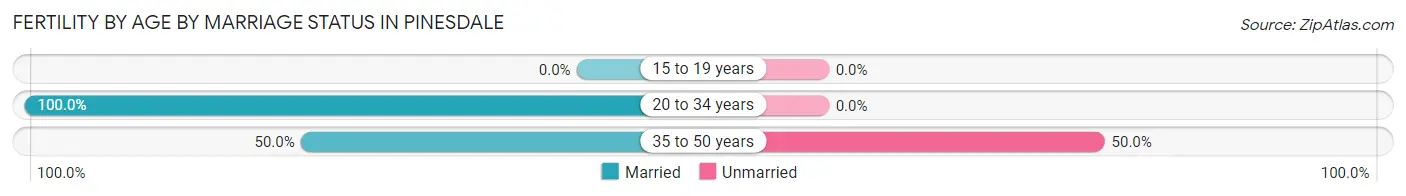
| Age Bracket | Married | Unmarried |
| 15 to 19 years | 0 (0.0%) | 0 (0.0%) |
| 20 to 34 years | 20 (100.0%) | 0 (0.0%) |
| 35 to 50 years | 2 (50.0%) | 2 (50.0%) |
| Total | 22 (91.7%) | 2 (8.3%) |
Fertility by Education in Pinesdale
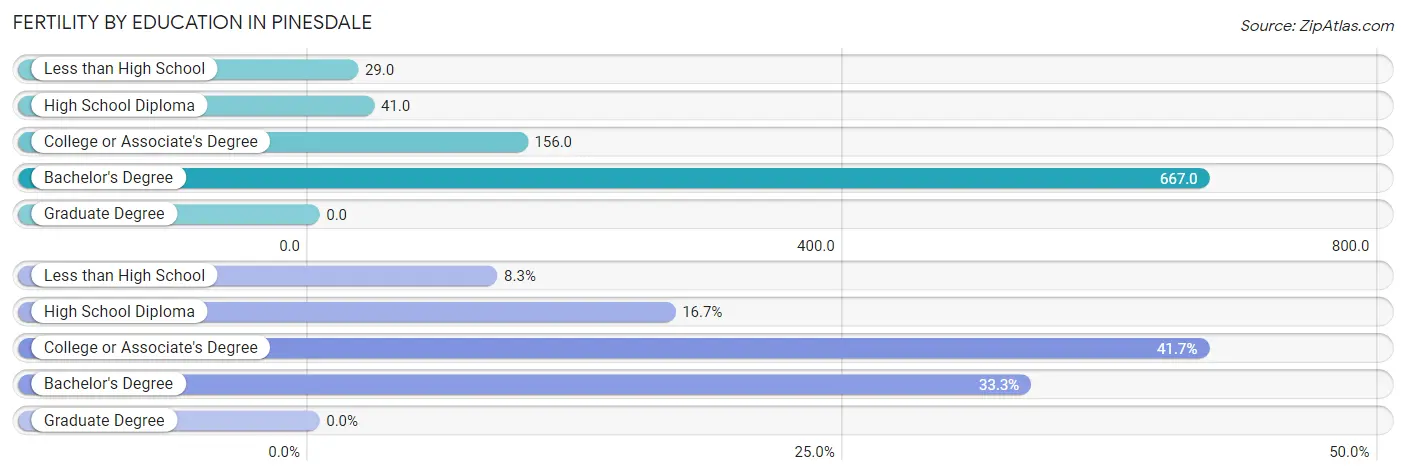
| Educational Attainment | Women with Births | Births / 1,000 Women |
| Less than High School | 2 (8.3%) | 29.0 |
| High School Diploma | 4 (16.7%) | 41.0 |
| College or Associate's Degree | 10 (41.7%) | 156.0 |
| Bachelor's Degree | 8 (33.3%) | 667.0 |
| Graduate Degree | 0 (0.0%) | 0.0 |
| Total | 24 (100.0%) | 97.0 |
Fertility by Education by Marriage Status in Pinesdale
8.3% of women with births in Pinesdale are unmarried. Women with the educational attainment of less than high school are most likely to be married with 100.0% of them married at childbirth, while women with the educational attainment of high school diploma are least likely to be married with 50.0% of them unmarried at childbirth.
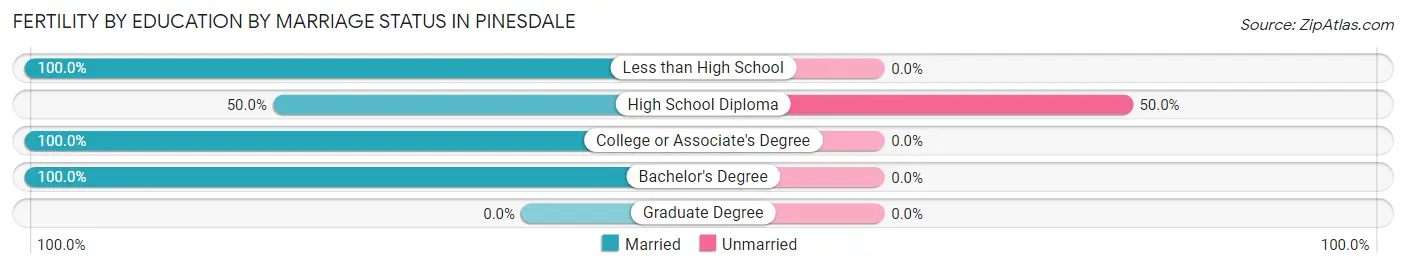
| Educational Attainment | Married | Unmarried |
| Less than High School | 2 (100.0%) | 0 (0.0%) |
| High School Diploma | 2 (50.0%) | 2 (50.0%) |
| College or Associate's Degree | 10 (100.0%) | 0 (0.0%) |
| Bachelor's Degree | 8 (100.0%) | 0 (0.0%) |
| Graduate Degree | 0 (0.0%) | 0 (0.0%) |
| Total | 22 (91.7%) | 2 (8.3%) |
Employment Characteristics in Pinesdale
Employment by Class of Employer in Pinesdale
Among the 433 employed individuals in Pinesdale, private company employees (299 | 69.1%), self-employed (not incorporated) (37 | 8.6%), and self-employed (incorporated) (33 | 7.6%) make up the most common classes of employment.
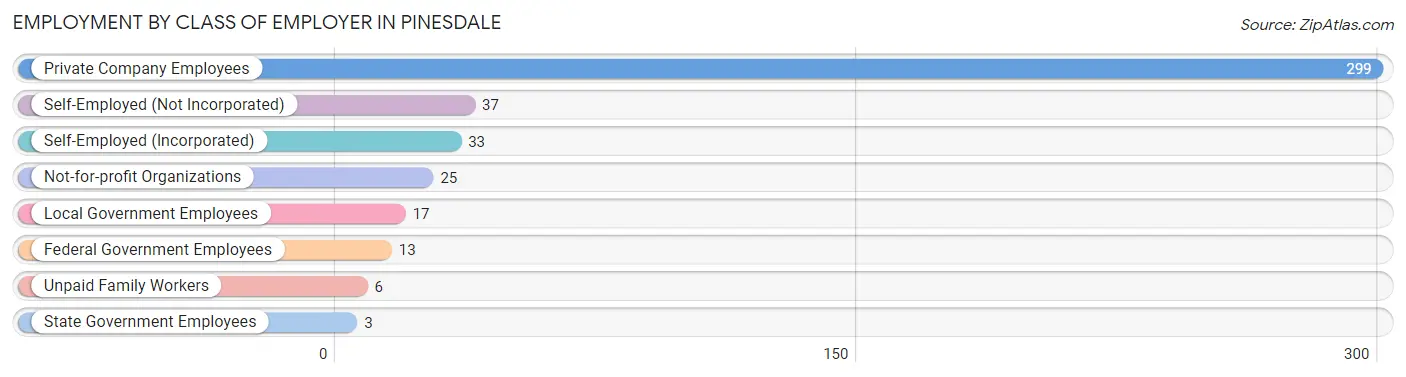
| Employer Class | # Employees | % Employees |
| Private Company Employees | 299 | 69.1% |
| Self-Employed (Incorporated) | 33 | 7.6% |
| Self-Employed (Not Incorporated) | 37 | 8.6% |
| Not-for-profit Organizations | 25 | 5.8% |
| Local Government Employees | 17 | 3.9% |
| State Government Employees | 3 | 0.7% |
| Federal Government Employees | 13 | 3.0% |
| Unpaid Family Workers | 6 | 1.4% |
| Total | 433 | 100.0% |
Employment Status by Age in Pinesdale
According to the labor force statistics for Pinesdale, out of the total population over 16 years of age (617), 73.7% or 455 individuals are in the labor force, with 2.2% or 10 of them unemployed. The age group with the highest labor force participation rate is 45 to 54 years, with 93.7% or 59 individuals in the labor force. Within the labor force, the 55 to 59 years age range has the highest percentage of unemployed individuals, with 7.1% or 2 of them being unemployed.
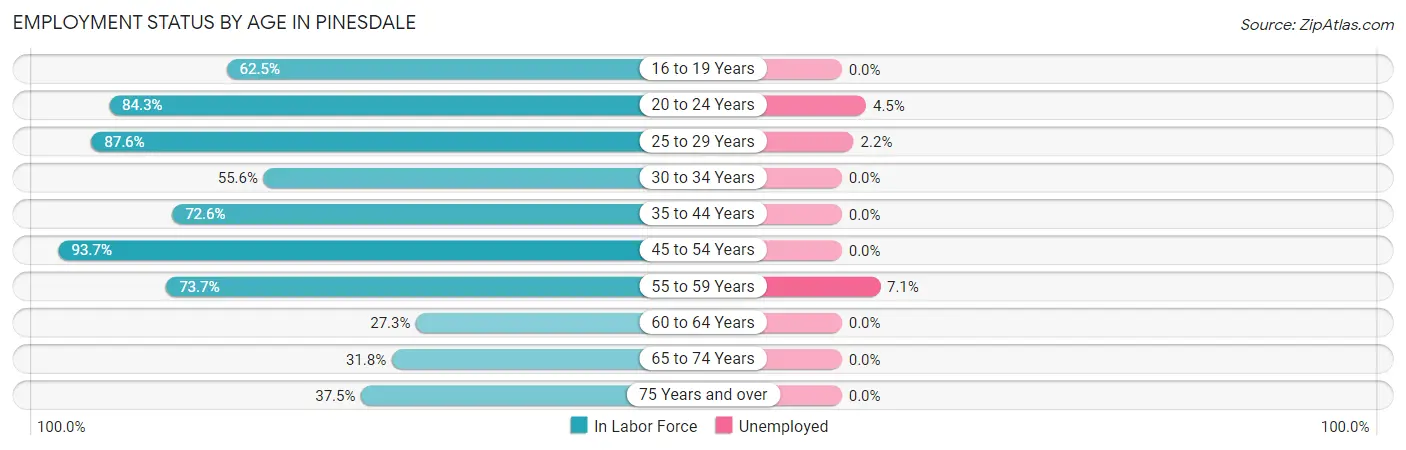
| Age Bracket | In Labor Force | Unemployed |
| 16 to 19 Years | 65 (62.5%) | 0 (0.0%) |
| 20 to 24 Years | 134 (84.3%) | 6 (4.5%) |
| 25 to 29 Years | 92 (87.6%) | 2 (2.2%) |
| 30 to 34 Years | 10 (55.6%) | 0 (0.0%) |
| 35 to 44 Years | 45 (72.6%) | 0 (0.0%) |
| 45 to 54 Years | 59 (93.7%) | 0 (0.0%) |
| 55 to 59 Years | 28 (73.7%) | 2 (7.1%) |
| 60 to 64 Years | 6 (27.3%) | 0 (0.0%) |
| 65 to 74 Years | 7 (31.8%) | 0 (0.0%) |
| 75 Years and over | 9 (37.5%) | 0 (0.0%) |
| Total | 455 (73.7%) | 10 (2.2%) |
Employment Status by Educational Attainment in Pinesdale
According to labor force statistics for Pinesdale, 77.9% of individuals (240) out of the total population between 25 and 64 years of age (308) are in the labor force, with 1.7% or 4 of them being unemployed. The group with the highest labor force participation rate are those with the educational attainment of college / associate degree, with 91.1% or 51 individuals in the labor force. Within the labor force, individuals with college / associate degree education have the highest percentage of unemployment, with 3.9% or 2 of them being unemployed.
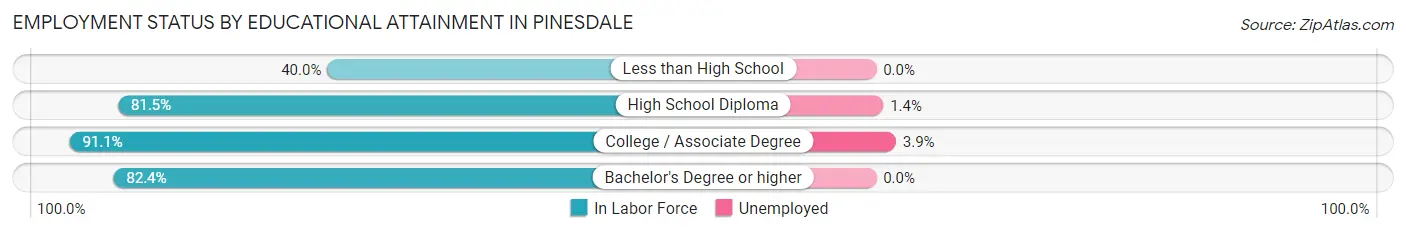
| Educational Attainment | In Labor Force | Unemployed |
| Less than High School | 16 (40.0%) | 0 (0.0%) |
| High School Diploma | 145 (81.5%) | 2 (1.4%) |
| College / Associate Degree | 51 (91.1%) | 2 (3.9%) |
| Bachelor's Degree or higher | 28 (82.4%) | 0 (0.0%) |
| Total | 240 (77.9%) | 5 (1.7%) |
Employment Occupations by Sex in Pinesdale
Management, Business, Science and Arts Occupations
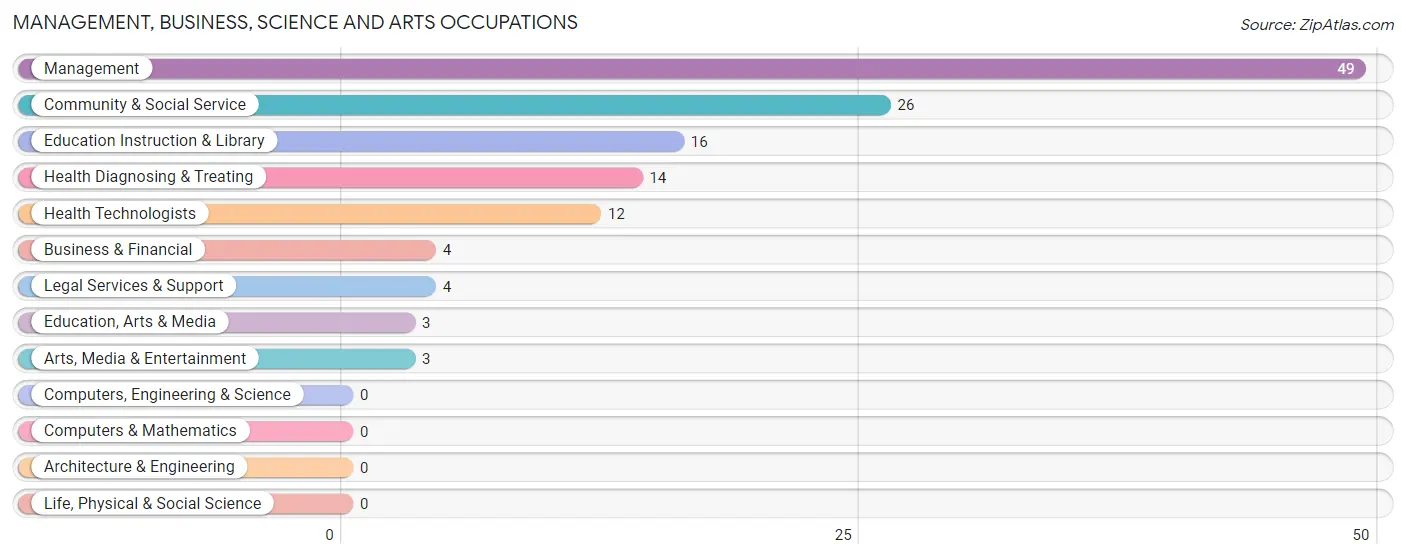
The most common Management, Business, Science and Arts occupations in Pinesdale are Management (49 | 11.0%), Community & Social Service (26 | 5.8%), Education Instruction & Library (16 | 3.6%), Health Diagnosing & Treating (14 | 3.2%), and Health Technologists (12 | 2.7%).
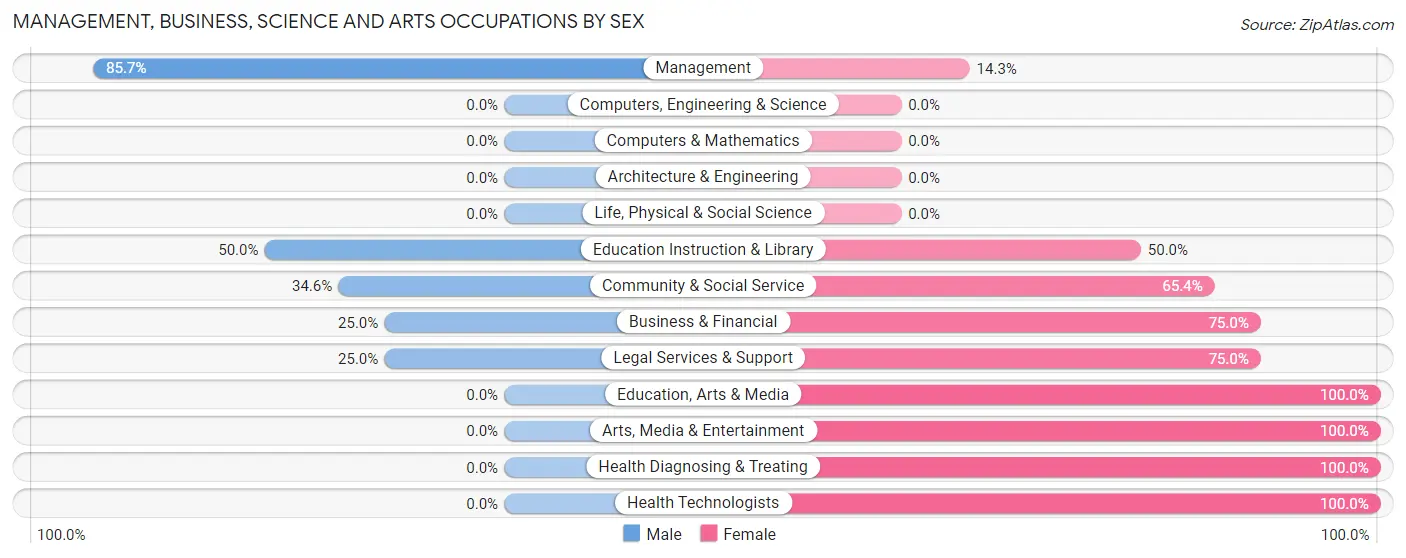
Management, Business, Science and Arts Occupations by Sex
Within the Management, Business, Science and Arts occupations in Pinesdale, the most male-oriented occupations are Management (85.7%), Education Instruction & Library (50.0%), and Community & Social Service (34.6%), while the most female-oriented occupations are Education, Arts & Media (100.0%), Arts, Media & Entertainment (100.0%), and Health Diagnosing & Treating (100.0%).
| Occupation | Male | Female |
| Management | 42 (85.7%) | 7 (14.3%) |
| Business & Financial | 1 (25.0%) | 3 (75.0%) |
| Computers, Engineering & Science | 0 (0.0%) | 0 (0.0%) |
| Computers & Mathematics | 0 (0.0%) | 0 (0.0%) |
| Architecture & Engineering | 0 (0.0%) | 0 (0.0%) |
| Life, Physical & Social Science | 0 (0.0%) | 0 (0.0%) |
| Community & Social Service | 9 (34.6%) | 17 (65.4%) |
| Education, Arts & Media | 0 (0.0%) | 3 (100.0%) |
| Legal Services & Support | 1 (25.0%) | 3 (75.0%) |
| Education Instruction & Library | 8 (50.0%) | 8 (50.0%) |
| Arts, Media & Entertainment | 0 (0.0%) | 3 (100.0%) |
| Health Diagnosing & Treating | 0 (0.0%) | 14 (100.0%) |
| Health Technologists | 0 (0.0%) | 12 (100.0%) |
| Total (Category) | 52 (55.9%) | 41 (44.1%) |
| Total (Overall) | 244 (54.8%) | 201 (45.2%) |
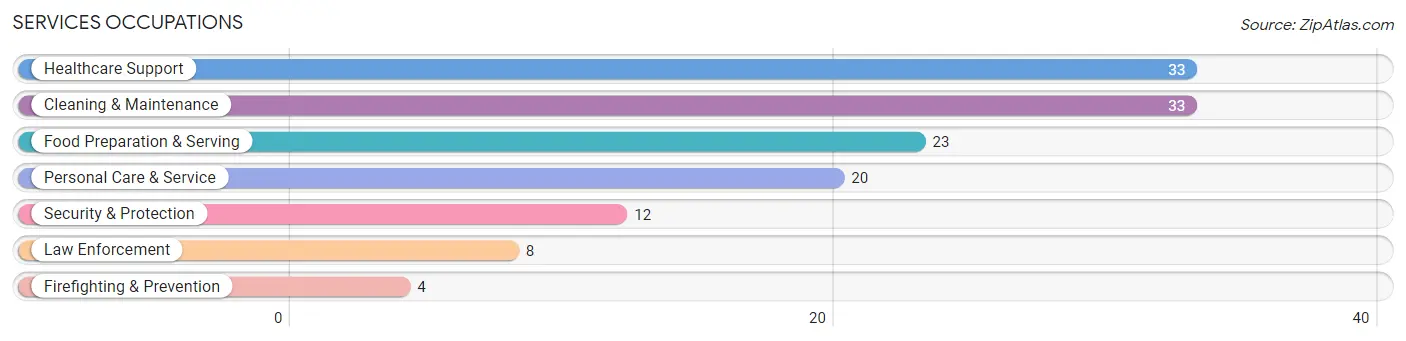
Services Occupations
The most common Services occupations in Pinesdale are Healthcare Support (33 | 7.4%), Cleaning & Maintenance (33 | 7.4%), Food Preparation & Serving (23 | 5.2%), Personal Care & Service (20 | 4.5%), and Security & Protection (12 | 2.7%).
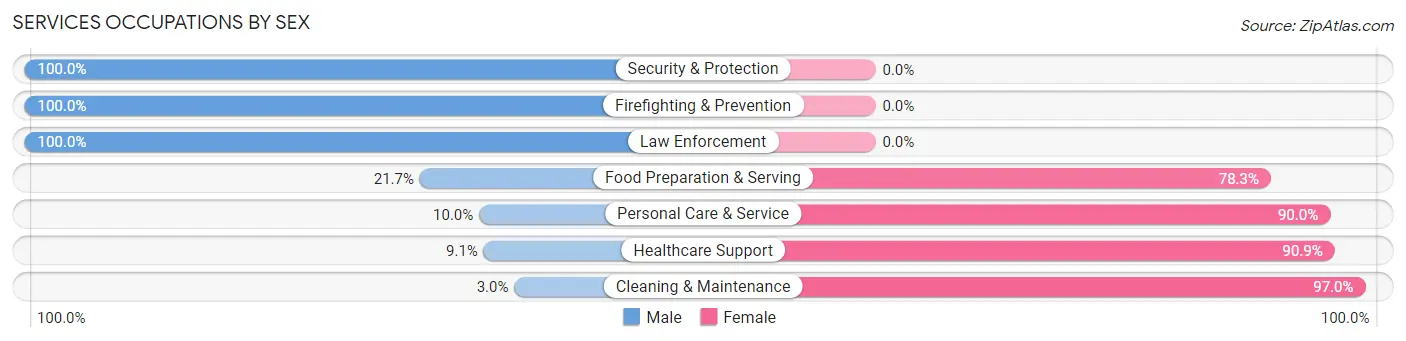
Services Occupations by Sex
Within the Services occupations in Pinesdale, the most male-oriented occupations are Security & Protection (100.0%), Firefighting & Prevention (100.0%), and Law Enforcement (100.0%), while the most female-oriented occupations are Cleaning & Maintenance (97.0%), Healthcare Support (90.9%), and Personal Care & Service (90.0%).
| Occupation | Male | Female |
| Healthcare Support | 3 (9.1%) | 30 (90.9%) |
| Security & Protection | 12 (100.0%) | 0 (0.0%) |
| Firefighting & Prevention | 4 (100.0%) | 0 (0.0%) |
| Law Enforcement | 8 (100.0%) | 0 (0.0%) |
| Food Preparation & Serving | 5 (21.7%) | 18 (78.3%) |
| Cleaning & Maintenance | 1 (3.0%) | 32 (97.0%) |
| Personal Care & Service | 2 (10.0%) | 18 (90.0%) |
| Total (Category) | 23 (19.0%) | 98 (81.0%) |
| Total (Overall) | 244 (54.8%) | 201 (45.2%) |
Sales and Office Occupations
The most common Sales and Office occupations in Pinesdale are Office & Administration (48 | 10.8%), and Sales & Related (24 | 5.4%).
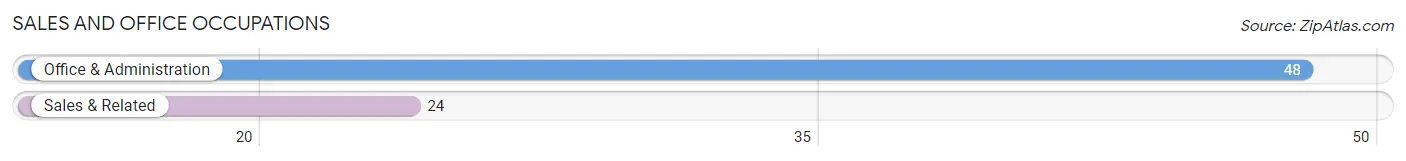
Sales and Office Occupations by Sex

| Occupation | Male | Female |
| Sales & Related | 13 (54.2%) | 11 (45.8%) |
| Office & Administration | 4 (8.3%) | 44 (91.7%) |
| Total (Category) | 17 (23.6%) | 55 (76.4%) |
| Total (Overall) | 244 (54.8%) | 201 (45.2%) |
Natural Resources, Construction and Maintenance Occupations
The most common Natural Resources, Construction and Maintenance occupations in Pinesdale are Construction & Extraction (88 | 19.8%), Installation, Maintenance & Repair (8 | 1.8%), and Farming, Fishing & Forestry (2 | 0.4%).
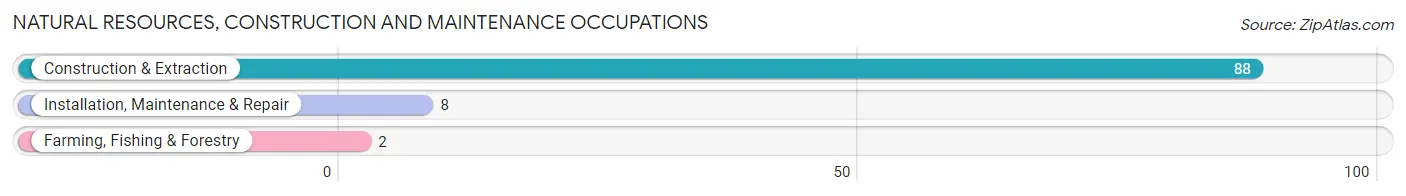
Natural Resources, Construction and Maintenance Occupations by Sex
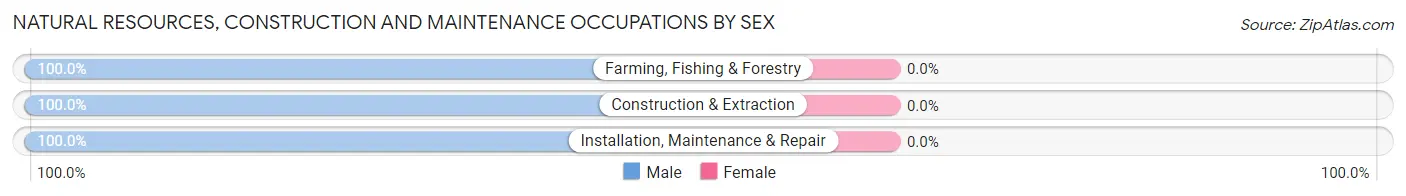
| Occupation | Male | Female |
| Farming, Fishing & Forestry | 2 (100.0%) | 0 (0.0%) |
| Construction & Extraction | 88 (100.0%) | 0 (0.0%) |
| Installation, Maintenance & Repair | 8 (100.0%) | 0 (0.0%) |
| Total (Category) | 98 (100.0%) | 0 (0.0%) |
| Total (Overall) | 244 (54.8%) | 201 (45.2%) |
Production, Transportation and Moving Occupations
The most common Production, Transportation and Moving occupations in Pinesdale are Production (28 | 6.3%), Material Moving (25 | 5.6%), and Transportation (8 | 1.8%).
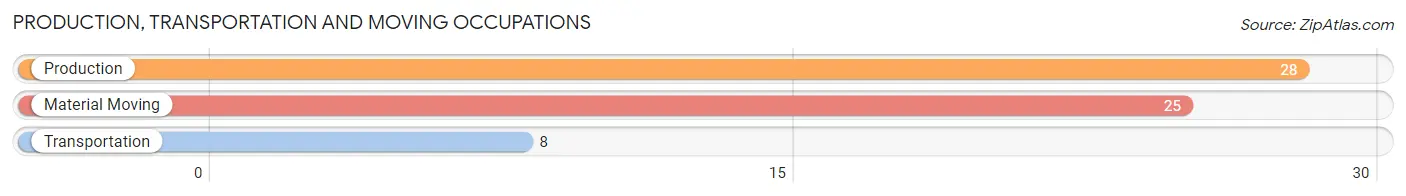
Production, Transportation and Moving Occupations by Sex
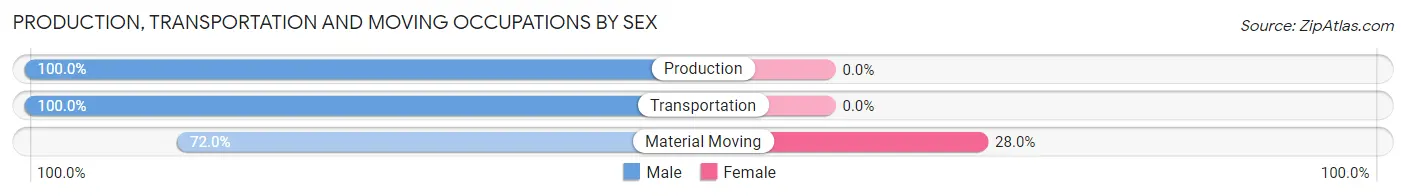
| Occupation | Male | Female |
| Production | 28 (100.0%) | 0 (0.0%) |
| Transportation | 8 (100.0%) | 0 (0.0%) |
| Material Moving | 18 (72.0%) | 7 (28.0%) |
| Total (Category) | 54 (88.5%) | 7 (11.5%) |
| Total (Overall) | 244 (54.8%) | 201 (45.2%) |
Employment Industries by Sex in Pinesdale
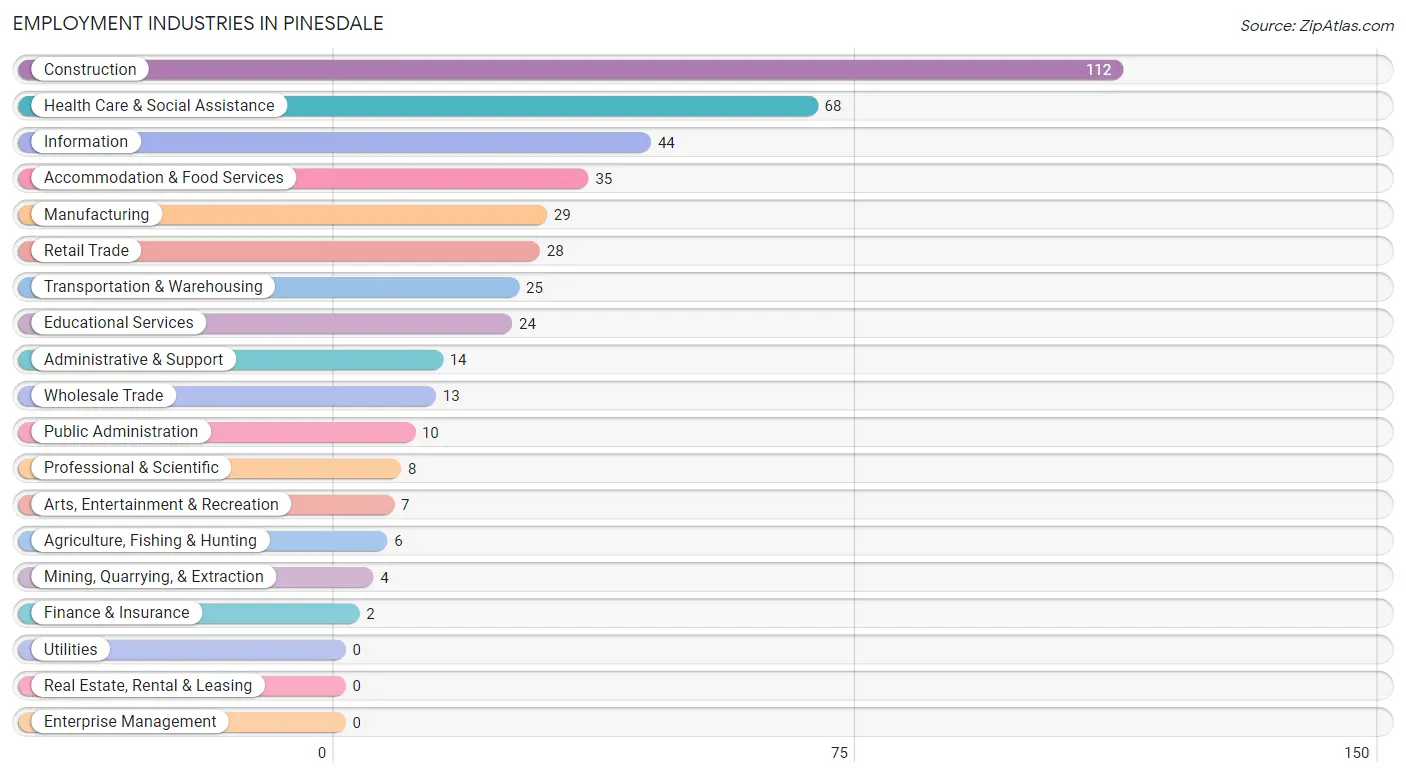
Employment Industries in Pinesdale
The major employment industries in Pinesdale include Construction (112 | 25.2%), Health Care & Social Assistance (68 | 15.3%), Information (44 | 9.9%), Accommodation & Food Services (35 | 7.9%), and Manufacturing (29 | 6.5%).
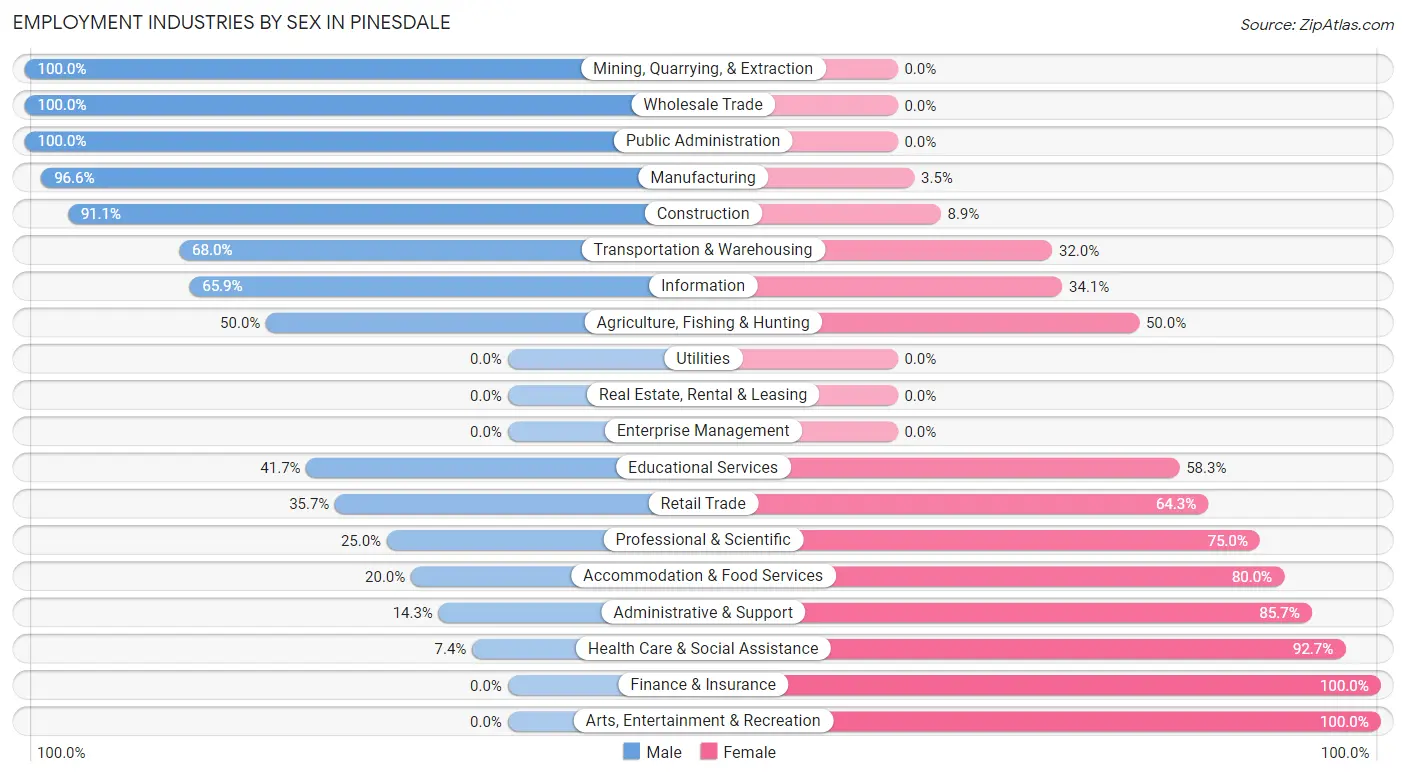
Employment Industries by Sex in Pinesdale
The Pinesdale industries that see more men than women are Mining, Quarrying, & Extraction (100.0%), Wholesale Trade (100.0%), and Public Administration (100.0%), whereas the industries that tend to have a higher number of women are Finance & Insurance (100.0%), Arts, Entertainment & Recreation (100.0%), and Health Care & Social Assistance (92.6%).
| Industry | Male | Female |
| Agriculture, Fishing & Hunting | 3 (50.0%) | 3 (50.0%) |
| Mining, Quarrying, & Extraction | 4 (100.0%) | 0 (0.0%) |
| Construction | 102 (91.1%) | 10 (8.9%) |
| Manufacturing | 28 (96.6%) | 1 (3.5%) |
| Wholesale Trade | 13 (100.0%) | 0 (0.0%) |
| Retail Trade | 10 (35.7%) | 18 (64.3%) |
| Transportation & Warehousing | 17 (68.0%) | 8 (32.0%) |
| Utilities | 0 (0.0%) | 0 (0.0%) |
| Information | 29 (65.9%) | 15 (34.1%) |
| Finance & Insurance | 0 (0.0%) | 2 (100.0%) |
| Real Estate, Rental & Leasing | 0 (0.0%) | 0 (0.0%) |
| Professional & Scientific | 2 (25.0%) | 6 (75.0%) |
| Enterprise Management | 0 (0.0%) | 0 (0.0%) |
| Administrative & Support | 2 (14.3%) | 12 (85.7%) |
| Educational Services | 10 (41.7%) | 14 (58.3%) |
| Health Care & Social Assistance | 5 (7.3%) | 63 (92.6%) |
| Arts, Entertainment & Recreation | 0 (0.0%) | 7 (100.0%) |
| Accommodation & Food Services | 7 (20.0%) | 28 (80.0%) |
| Public Administration | 10 (100.0%) | 0 (0.0%) |
| Total | 244 (54.8%) | 201 (45.2%) |
Education in Pinesdale
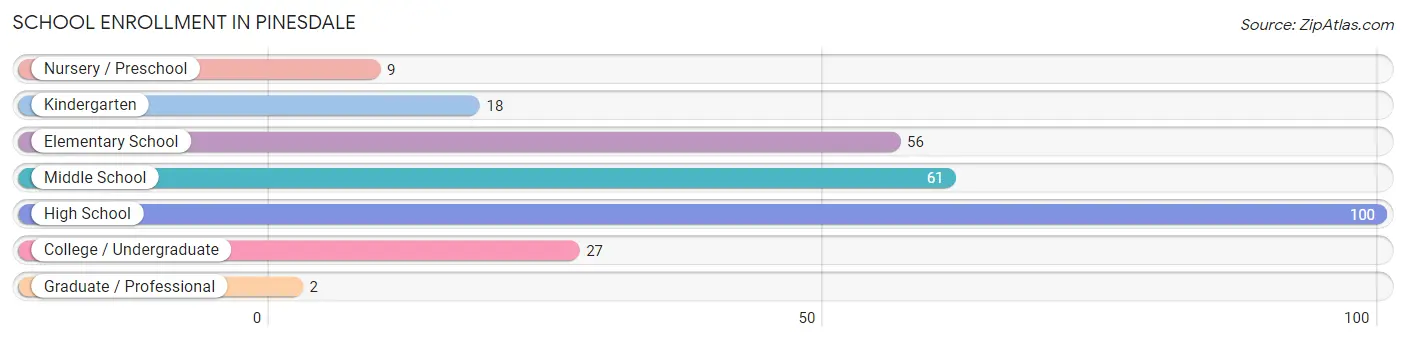
School Enrollment in Pinesdale
The most common levels of schooling among the 273 students in Pinesdale are high school (100 | 36.6%), middle school (61 | 22.3%), and elementary school (56 | 20.5%).
| School Level | # Students | % Students |
| Nursery / Preschool | 9 | 3.3% |
| Kindergarten | 18 | 6.6% |
| Elementary School | 56 | 20.5% |
| Middle School | 61 | 22.3% |
| High School | 100 | 36.6% |
| College / Undergraduate | 27 | 9.9% |
| Graduate / Professional | 2 | 0.7% |
| Total | 273 | 100.0% |
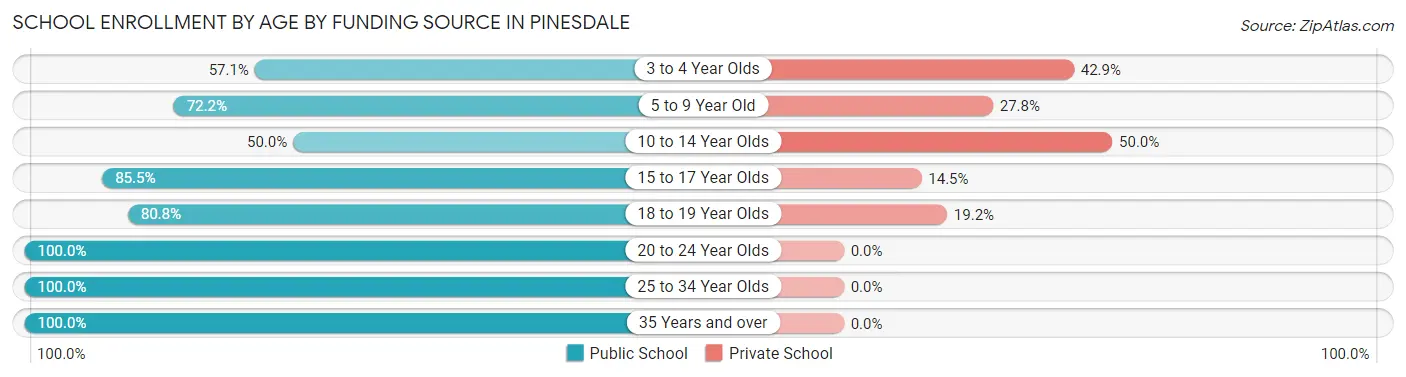
School Enrollment by Age by Funding Source in Pinesdale
Out of a total of 273 students who are enrolled in schools in Pinesdale, 77 (28.2%) attend a private institution, while the remaining 196 (71.8%) are enrolled in public schools. The age group of 10 to 14 year olds has the highest likelihood of being enrolled in private schools, with 38 (50.0% in the age bracket) enrolled. Conversely, the age group of 20 to 24 year olds has the lowest likelihood of being enrolled in a private school, with 6 (100.0% in the age bracket) attending a public institution.
| Age Bracket | Public School | Private School |
| 3 to 4 Year Olds | 4 (57.1%) | 3 (42.9%) |
| 5 to 9 Year Old | 52 (72.2%) | 20 (27.8%) |
| 10 to 14 Year Olds | 38 (50.0%) | 38 (50.0%) |
| 15 to 17 Year Olds | 65 (85.5%) | 11 (14.5%) |
| 18 to 19 Year Olds | 21 (80.8%) | 5 (19.2%) |
| 20 to 24 Year Olds | 6 (100.0%) | 0 (0.0%) |
| 25 to 34 Year Olds | 8 (100.0%) | 0 (0.0%) |
| 35 Years and over | 2 (100.0%) | 0 (0.0%) |
| Total | 196 (71.8%) | 77 (28.2%) |
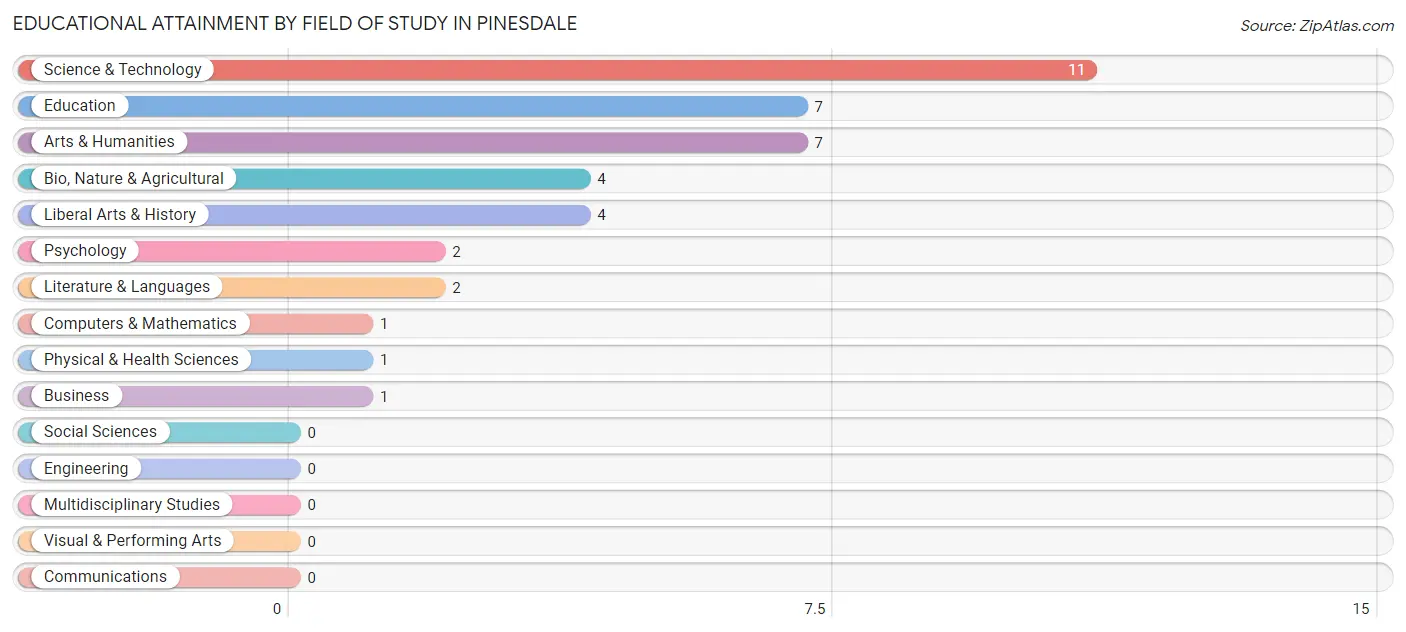
Educational Attainment by Field of Study in Pinesdale
Science & technology (11 | 27.5%), education (7 | 17.5%), arts & humanities (7 | 17.5%), bio, nature & agricultural (4 | 10.0%), and liberal arts & history (4 | 10.0%) are the most common fields of study among 40 individuals in Pinesdale who have obtained a bachelor's degree or higher.
| Field of Study | # Graduates | % Graduates |
| Computers & Mathematics | 1 | 2.5% |
| Bio, Nature & Agricultural | 4 | 10.0% |
| Physical & Health Sciences | 1 | 2.5% |
| Psychology | 2 | 5.0% |
| Social Sciences | 0 | 0.0% |
| Engineering | 0 | 0.0% |
| Multidisciplinary Studies | 0 | 0.0% |
| Science & Technology | 11 | 27.5% |
| Business | 1 | 2.5% |
| Education | 7 | 17.5% |
| Literature & Languages | 2 | 5.0% |
| Liberal Arts & History | 4 | 10.0% |
| Visual & Performing Arts | 0 | 0.0% |
| Communications | 0 | 0.0% |
| Arts & Humanities | 7 | 17.5% |
| Total | 40 | 100.0% |
Transportation & Commute in Pinesdale
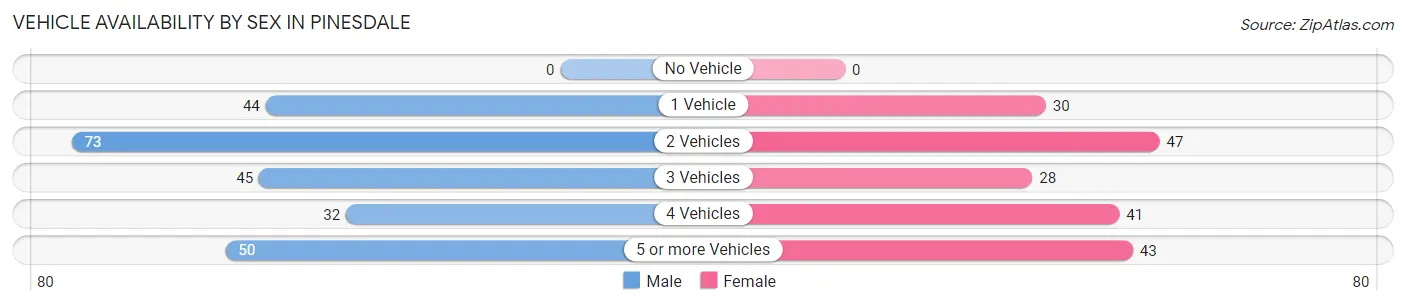
Vehicle Availability by Sex in Pinesdale
The most prevalent vehicle ownership categories in Pinesdale are males with 2 vehicles (73, accounting for 29.9%) and females with 2 vehicles (47, making up 38.6%).
| Vehicles Available | Male | Female |
| No Vehicle | 0 (0.0%) | 0 (0.0%) |
| 1 Vehicle | 44 (18.0%) | 30 (15.9%) |
| 2 Vehicles | 73 (29.9%) | 47 (24.9%) |
| 3 Vehicles | 45 (18.4%) | 28 (14.8%) |
| 4 Vehicles | 32 (13.1%) | 41 (21.7%) |
| 5 or more Vehicles | 50 (20.5%) | 43 (22.8%) |
| Total | 244 (100.0%) | 189 (100.0%) |
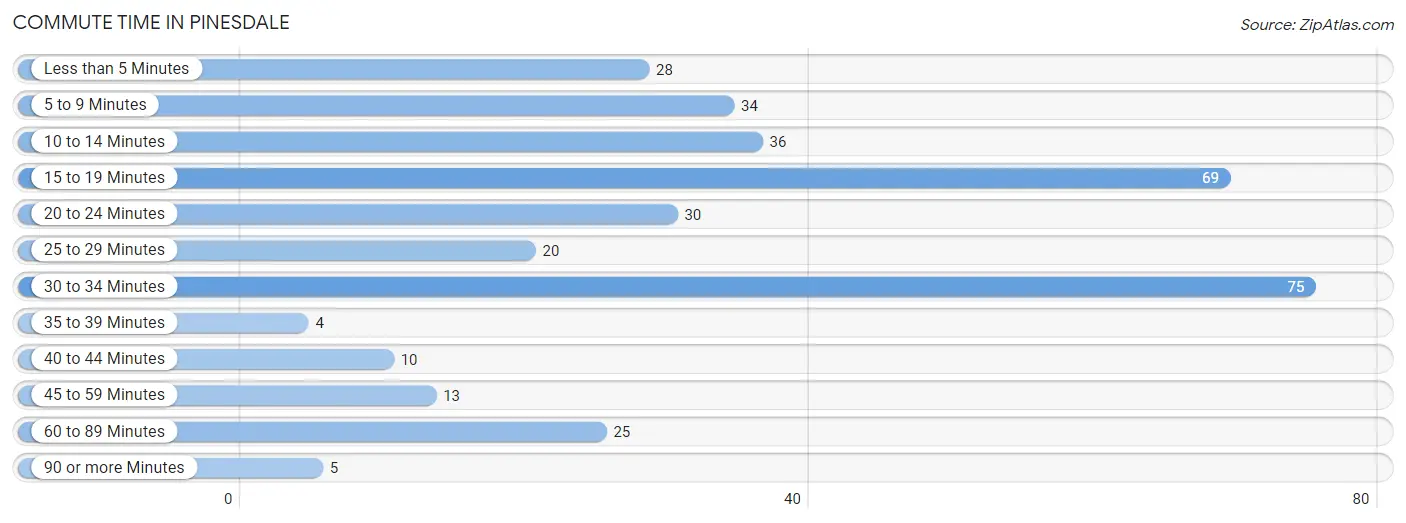
Commute Time in Pinesdale
The most frequently occuring commute durations in Pinesdale are 30 to 34 minutes (75 commuters, 21.5%), 15 to 19 minutes (69 commuters, 19.8%), and 10 to 14 minutes (36 commuters, 10.3%).
| Commute Time | # Commuters | % Commuters |
| Less than 5 Minutes | 28 | 8.0% |
| 5 to 9 Minutes | 34 | 9.7% |
| 10 to 14 Minutes | 36 | 10.3% |
| 15 to 19 Minutes | 69 | 19.8% |
| 20 to 24 Minutes | 30 | 8.6% |
| 25 to 29 Minutes | 20 | 5.7% |
| 30 to 34 Minutes | 75 | 21.5% |
| 35 to 39 Minutes | 4 | 1.1% |
| 40 to 44 Minutes | 10 | 2.9% |
| 45 to 59 Minutes | 13 | 3.7% |
| 60 to 89 Minutes | 25 | 7.2% |
| 90 or more Minutes | 5 | 1.4% |
Commute Time by Sex in Pinesdale
The most common commute times in Pinesdale are 30 to 34 minutes (36 commuters, 18.2%) for males and 15 to 19 minutes (42 commuters, 27.8%) for females.
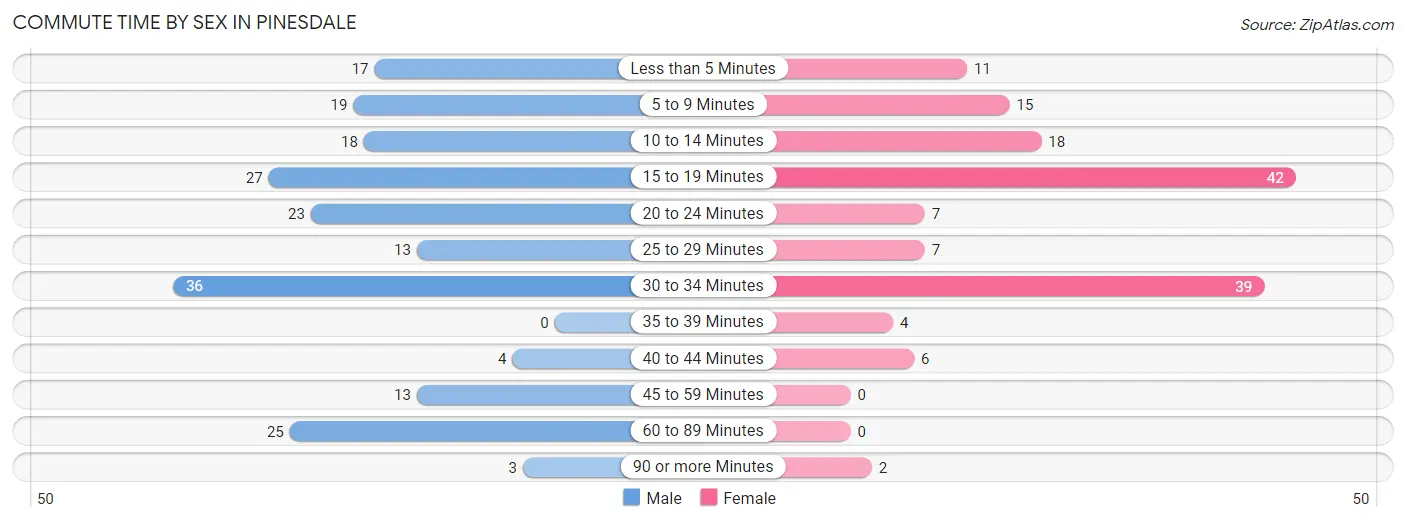
| Commute Time | Male | Female |
| Less than 5 Minutes | 17 (8.6%) | 11 (7.3%) |
| 5 to 9 Minutes | 19 (9.6%) | 15 (9.9%) |
| 10 to 14 Minutes | 18 (9.1%) | 18 (11.9%) |
| 15 to 19 Minutes | 27 (13.6%) | 42 (27.8%) |
| 20 to 24 Minutes | 23 (11.6%) | 7 (4.6%) |
| 25 to 29 Minutes | 13 (6.6%) | 7 (4.6%) |
| 30 to 34 Minutes | 36 (18.2%) | 39 (25.8%) |
| 35 to 39 Minutes | 0 (0.0%) | 4 (2.6%) |
| 40 to 44 Minutes | 4 (2.0%) | 6 (4.0%) |
| 45 to 59 Minutes | 13 (6.6%) | 0 (0.0%) |
| 60 to 89 Minutes | 25 (12.6%) | 0 (0.0%) |
| 90 or more Minutes | 3 (1.5%) | 2 (1.3%) |
Time of Departure to Work by Sex in Pinesdale
The most frequent times of departure to work in Pinesdale are 7:30 AM to 7:59 AM (54, 27.3%) for males and 8:30 AM to 8:59 AM (35, 23.2%) for females.
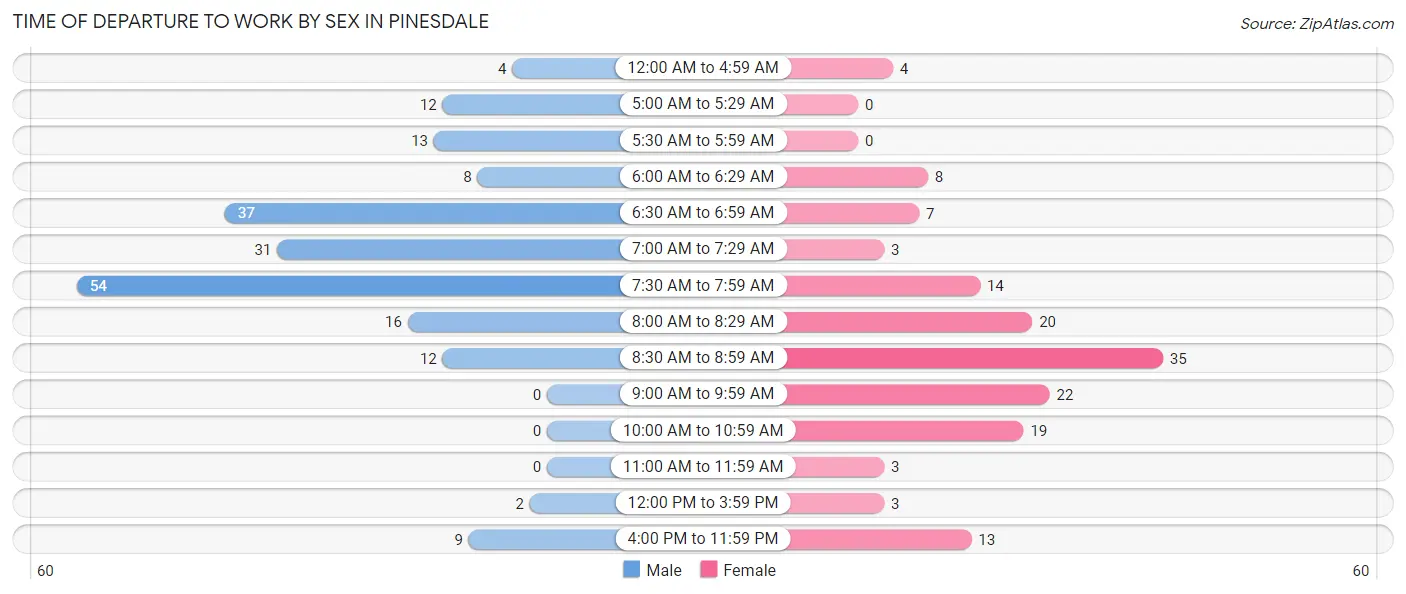
| Time of Departure | Male | Female |
| 12:00 AM to 4:59 AM | 4 (2.0%) | 4 (2.6%) |
| 5:00 AM to 5:29 AM | 12 (6.1%) | 0 (0.0%) |
| 5:30 AM to 5:59 AM | 13 (6.6%) | 0 (0.0%) |
| 6:00 AM to 6:29 AM | 8 (4.0%) | 8 (5.3%) |
| 6:30 AM to 6:59 AM | 37 (18.7%) | 7 (4.6%) |
| 7:00 AM to 7:29 AM | 31 (15.7%) | 3 (2.0%) |
| 7:30 AM to 7:59 AM | 54 (27.3%) | 14 (9.3%) |
| 8:00 AM to 8:29 AM | 16 (8.1%) | 20 (13.3%) |
| 8:30 AM to 8:59 AM | 12 (6.1%) | 35 (23.2%) |
| 9:00 AM to 9:59 AM | 0 (0.0%) | 22 (14.6%) |
| 10:00 AM to 10:59 AM | 0 (0.0%) | 19 (12.6%) |
| 11:00 AM to 11:59 AM | 0 (0.0%) | 3 (2.0%) |
| 12:00 PM to 3:59 PM | 2 (1.0%) | 3 (2.0%) |
| 4:00 PM to 11:59 PM | 9 (4.5%) | 13 (8.6%) |
| Total | 198 (100.0%) | 151 (100.0%) |
Housing Occupancy in Pinesdale
Occupancy by Ownership in Pinesdale
Of the total 205 dwellings in Pinesdale, owner-occupied units account for 139 (67.8%), while renter-occupied units make up 66 (32.2%).
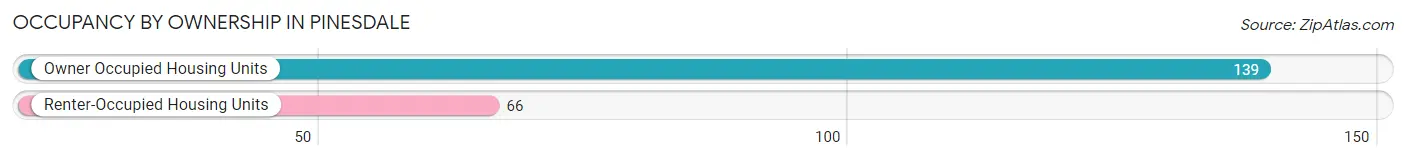
| Occupancy | # Housing Units | % Housing Units |
| Owner Occupied Housing Units | 139 | 67.8% |
| Renter-Occupied Housing Units | 66 | 32.2% |
| Total Occupied Housing Units | 205 | 100.0% |
Occupancy by Household Size in Pinesdale
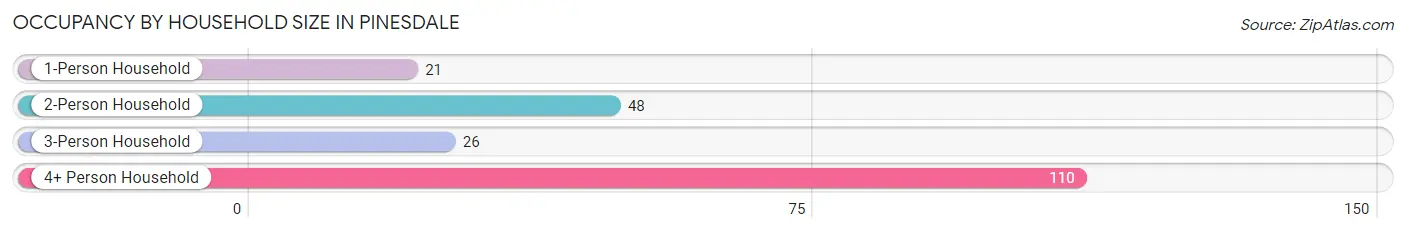
| Household Size | # Housing Units | % Housing Units |
| 1-Person Household | 21 | 10.2% |
| 2-Person Household | 48 | 23.4% |
| 3-Person Household | 26 | 12.7% |
| 4+ Person Household | 110 | 53.7% |
| Total Housing Units | 205 | 100.0% |
Occupancy by Ownership by Household Size in Pinesdale
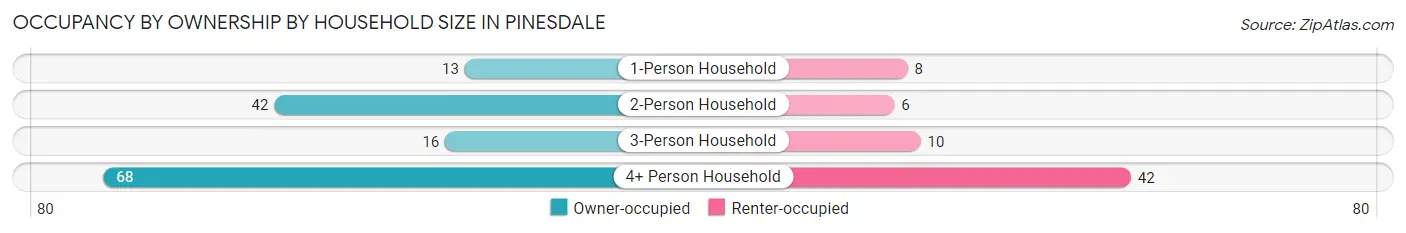
| Household Size | Owner-occupied | Renter-occupied |
| 1-Person Household | 13 (61.9%) | 8 (38.1%) |
| 2-Person Household | 42 (87.5%) | 6 (12.5%) |
| 3-Person Household | 16 (61.5%) | 10 (38.5%) |
| 4+ Person Household | 68 (61.8%) | 42 (38.2%) |
| Total Housing Units | 139 (67.8%) | 66 (32.2%) |
Occupancy by Educational Attainment in Pinesdale
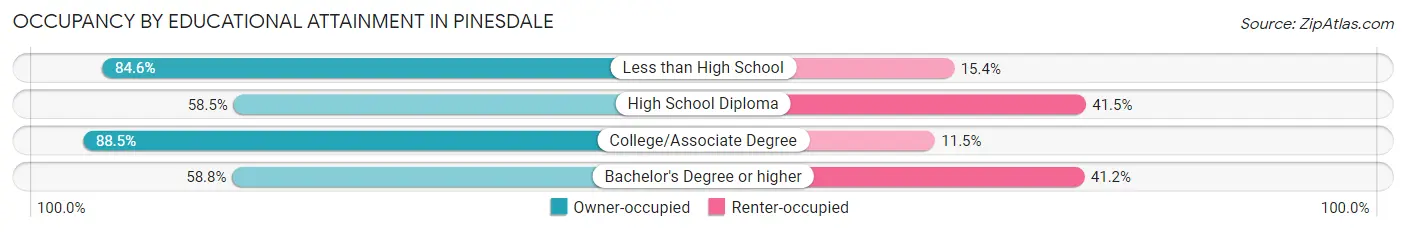
| Household Size | Owner-occupied | Renter-occupied |
| Less than High School | 11 (84.6%) | 2 (15.4%) |
| High School Diploma | 72 (58.5%) | 51 (41.5%) |
| College/Associate Degree | 46 (88.5%) | 6 (11.5%) |
| Bachelor's Degree or higher | 10 (58.8%) | 7 (41.2%) |
Occupancy by Age of Householder in Pinesdale
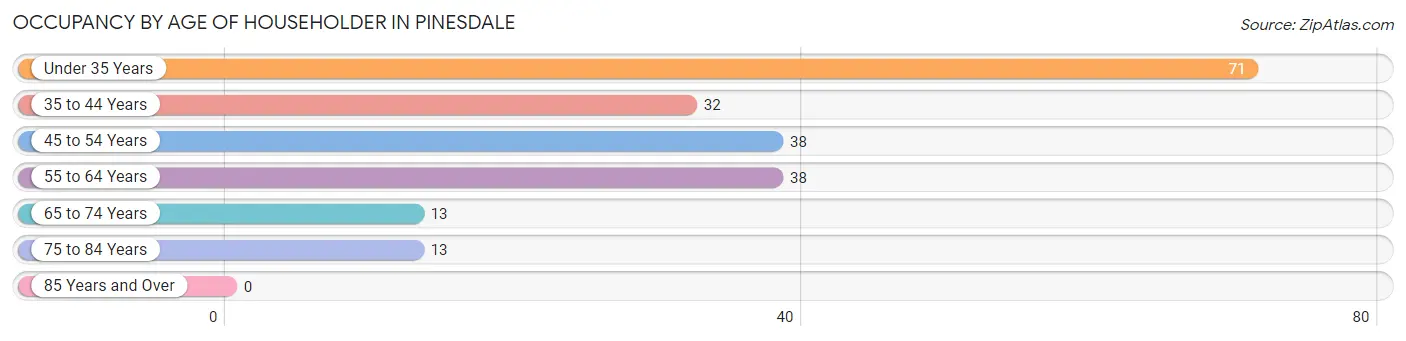
| Age Bracket | # Households | % Households |
| Under 35 Years | 71 | 34.6% |
| 35 to 44 Years | 32 | 15.6% |
| 45 to 54 Years | 38 | 18.5% |
| 55 to 64 Years | 38 | 18.5% |
| 65 to 74 Years | 13 | 6.3% |
| 75 to 84 Years | 13 | 6.3% |
| 85 Years and Over | 0 | 0.0% |
| Total | 205 | 100.0% |
Housing Finances in Pinesdale
Median Income by Occupancy in Pinesdale
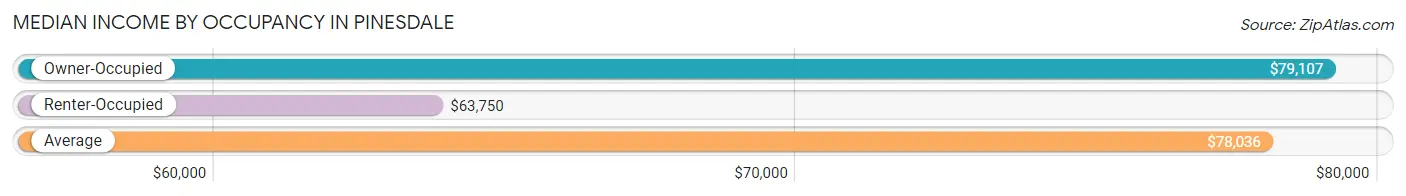
| Occupancy Type | # Households | Median Income |
| Owner-Occupied | 139 (67.8%) | $79,107 |
| Renter-Occupied | 66 (32.2%) | $63,750 |
| Average | 205 (100.0%) | $78,036 |
Occupancy by Householder Income Bracket in Pinesdale
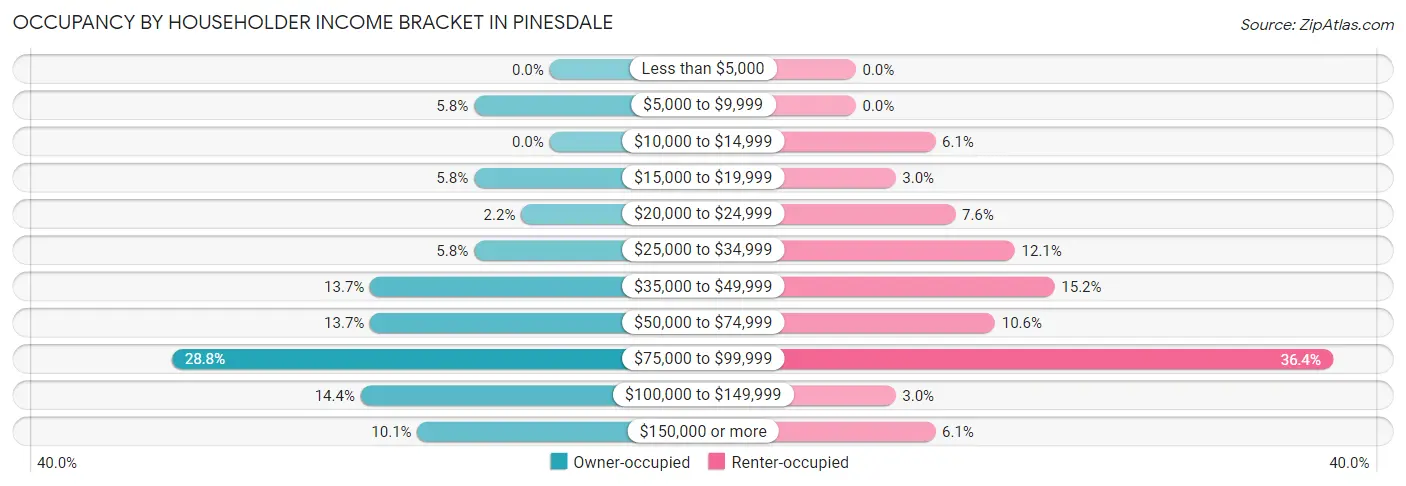
| Income Bracket | Owner-occupied | Renter-occupied |
| Less than $5,000 | 0 (0.0%) | 0 (0.0%) |
| $5,000 to $9,999 | 8 (5.8%) | 0 (0.0%) |
| $10,000 to $14,999 | 0 (0.0%) | 4 (6.1%) |
| $15,000 to $19,999 | 8 (5.8%) | 2 (3.0%) |
| $20,000 to $24,999 | 3 (2.2%) | 5 (7.6%) |
| $25,000 to $34,999 | 8 (5.8%) | 8 (12.1%) |
| $35,000 to $49,999 | 19 (13.7%) | 10 (15.1%) |
| $50,000 to $74,999 | 19 (13.7%) | 7 (10.6%) |
| $75,000 to $99,999 | 40 (28.8%) | 24 (36.4%) |
| $100,000 to $149,999 | 20 (14.4%) | 2 (3.0%) |
| $150,000 or more | 14 (10.1%) | 4 (6.1%) |
| Total | 139 (100.0%) | 66 (100.0%) |
Monthly Housing Cost Tiers in Pinesdale
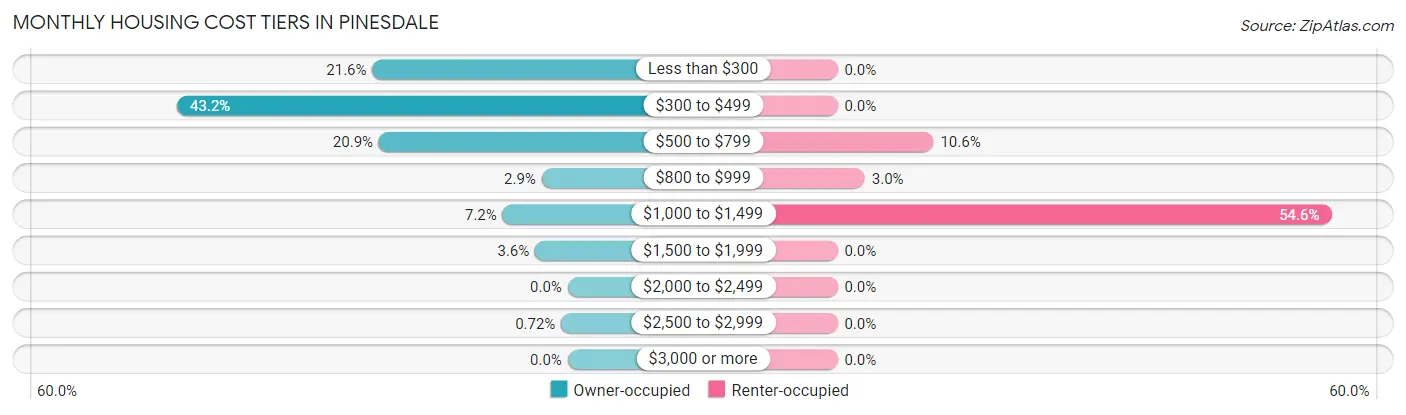
| Monthly Cost | Owner-occupied | Renter-occupied |
| Less than $300 | 30 (21.6%) | 0 (0.0%) |
| $300 to $499 | 60 (43.2%) | 0 (0.0%) |
| $500 to $799 | 29 (20.9%) | 7 (10.6%) |
| $800 to $999 | 4 (2.9%) | 2 (3.0%) |
| $1,000 to $1,499 | 10 (7.2%) | 36 (54.5%) |
| $1,500 to $1,999 | 5 (3.6%) | 0 (0.0%) |
| $2,000 to $2,499 | 0 (0.0%) | 0 (0.0%) |
| $2,500 to $2,999 | 1 (0.7%) | 0 (0.0%) |
| $3,000 or more | 0 (0.0%) | 0 (0.0%) |
| Total | 139 (100.0%) | 66 (100.0%) |
Physical Housing Characteristics in Pinesdale
Housing Structures in Pinesdale
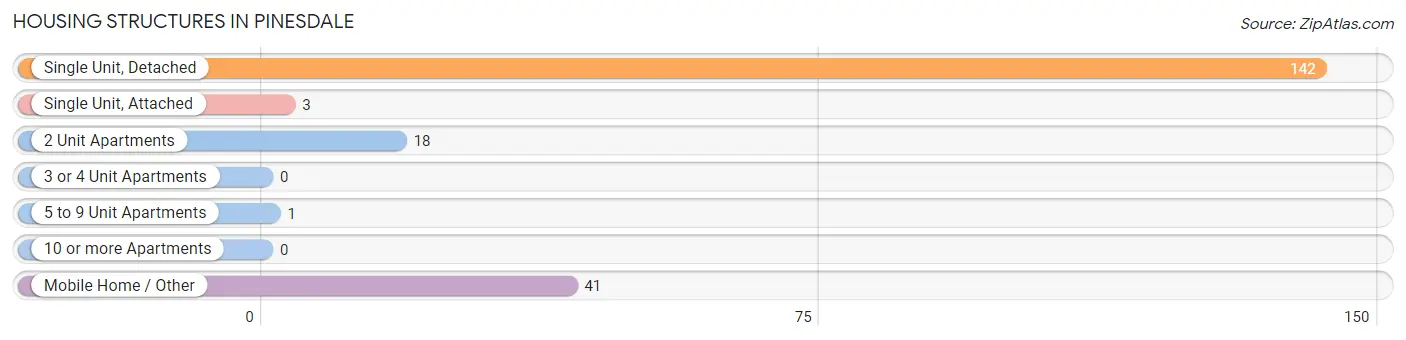
| Structure Type | # Housing Units | % Housing Units |
| Single Unit, Detached | 142 | 69.3% |
| Single Unit, Attached | 3 | 1.5% |
| 2 Unit Apartments | 18 | 8.8% |
| 3 or 4 Unit Apartments | 0 | 0.0% |
| 5 to 9 Unit Apartments | 1 | 0.5% |
| 10 or more Apartments | 0 | 0.0% |
| Mobile Home / Other | 41 | 20.0% |
| Total | 205 | 100.0% |
Housing Structures by Occupancy in Pinesdale
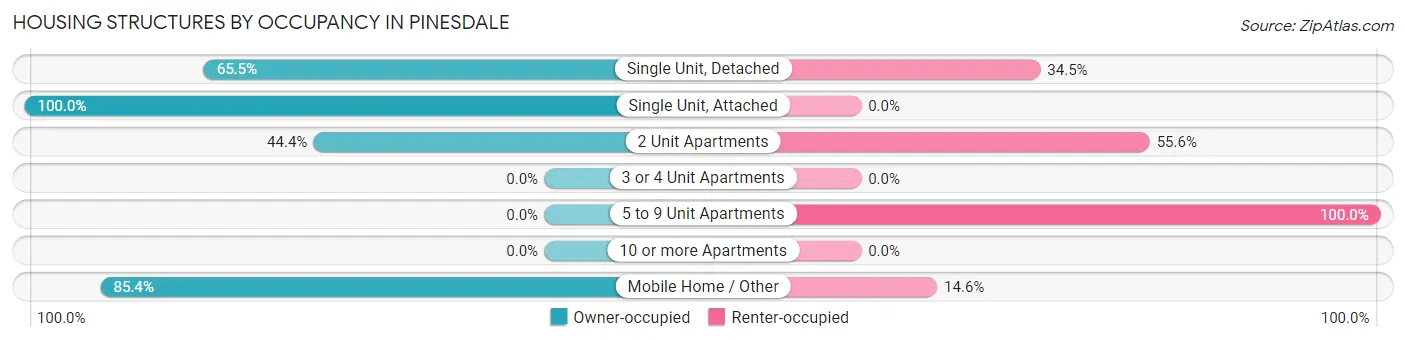
| Structure Type | Owner-occupied | Renter-occupied |
| Single Unit, Detached | 93 (65.5%) | 49 (34.5%) |
| Single Unit, Attached | 3 (100.0%) | 0 (0.0%) |
| 2 Unit Apartments | 8 (44.4%) | 10 (55.6%) |
| 3 or 4 Unit Apartments | 0 (0.0%) | 0 (0.0%) |
| 5 to 9 Unit Apartments | 0 (0.0%) | 1 (100.0%) |
| 10 or more Apartments | 0 (0.0%) | 0 (0.0%) |
| Mobile Home / Other | 35 (85.4%) | 6 (14.6%) |
| Total | 139 (67.8%) | 66 (32.2%) |
Housing Structures by Number of Rooms in Pinesdale
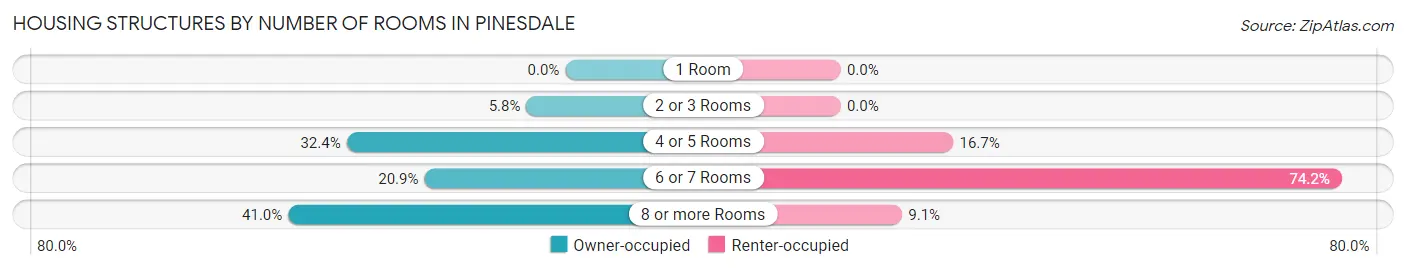
| Number of Rooms | Owner-occupied | Renter-occupied |
| 1 Room | 0 (0.0%) | 0 (0.0%) |
| 2 or 3 Rooms | 8 (5.8%) | 0 (0.0%) |
| 4 or 5 Rooms | 45 (32.4%) | 11 (16.7%) |
| 6 or 7 Rooms | 29 (20.9%) | 49 (74.2%) |
| 8 or more Rooms | 57 (41.0%) | 6 (9.1%) |
| Total | 139 (100.0%) | 66 (100.0%) |
Housing Structure by Heating Type in Pinesdale
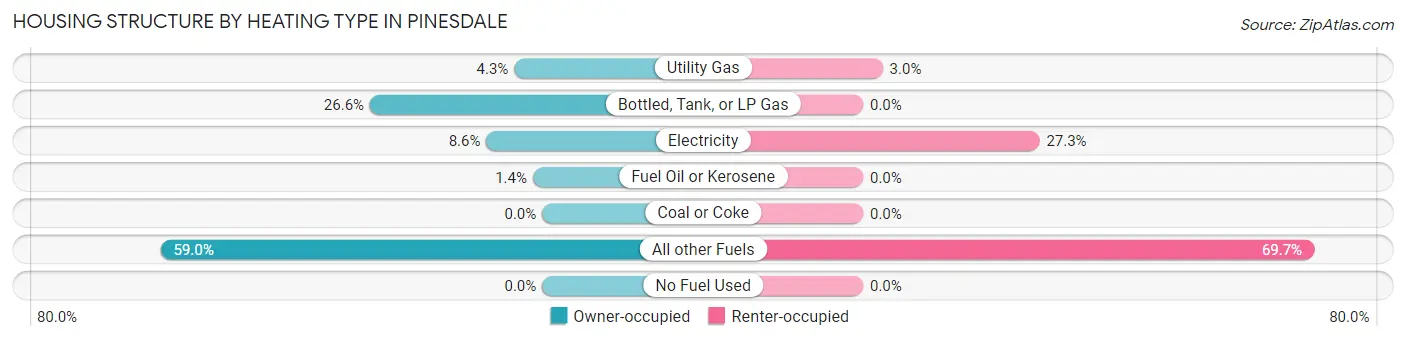
| Heating Type | Owner-occupied | Renter-occupied |
| Utility Gas | 6 (4.3%) | 2 (3.0%) |
| Bottled, Tank, or LP Gas | 37 (26.6%) | 0 (0.0%) |
| Electricity | 12 (8.6%) | 18 (27.3%) |
| Fuel Oil or Kerosene | 2 (1.4%) | 0 (0.0%) |
| Coal or Coke | 0 (0.0%) | 0 (0.0%) |
| All other Fuels | 82 (59.0%) | 46 (69.7%) |
| No Fuel Used | 0 (0.0%) | 0 (0.0%) |
| Total | 139 (100.0%) | 66 (100.0%) |
Household Vehicle Usage in Pinesdale
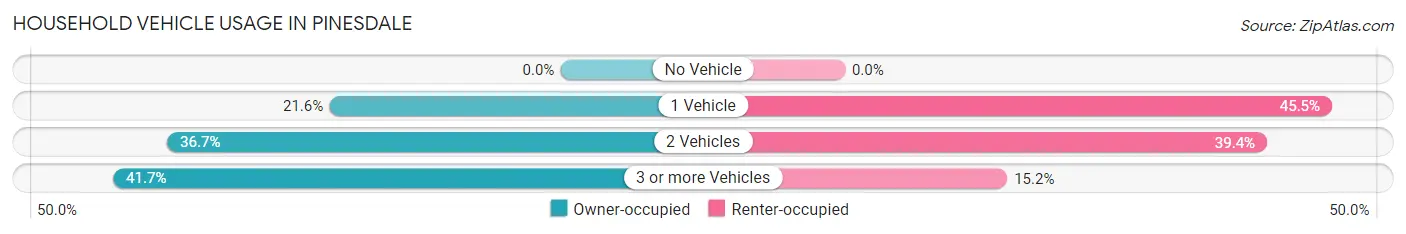
| Vehicles per Household | Owner-occupied | Renter-occupied |
| No Vehicle | 0 (0.0%) | 0 (0.0%) |
| 1 Vehicle | 30 (21.6%) | 30 (45.5%) |
| 2 Vehicles | 51 (36.7%) | 26 (39.4%) |
| 3 or more Vehicles | 58 (41.7%) | 10 (15.1%) |
| Total | 139 (100.0%) | 66 (100.0%) |
Real Estate & Mortgages in Pinesdale
Real Estate and Mortgage Overview in Pinesdale
| Characteristic | Without Mortgage | With Mortgage |
| Housing Units | 124 | 15 |
| Median Property Value | $164,300 | $0 |
| Median Household Income | $78,571 | $4 |
| Monthly Housing Costs | $391 | $0 |
| Real Estate Taxes | $985 | $0 |
Property Value by Mortgage Status in Pinesdale
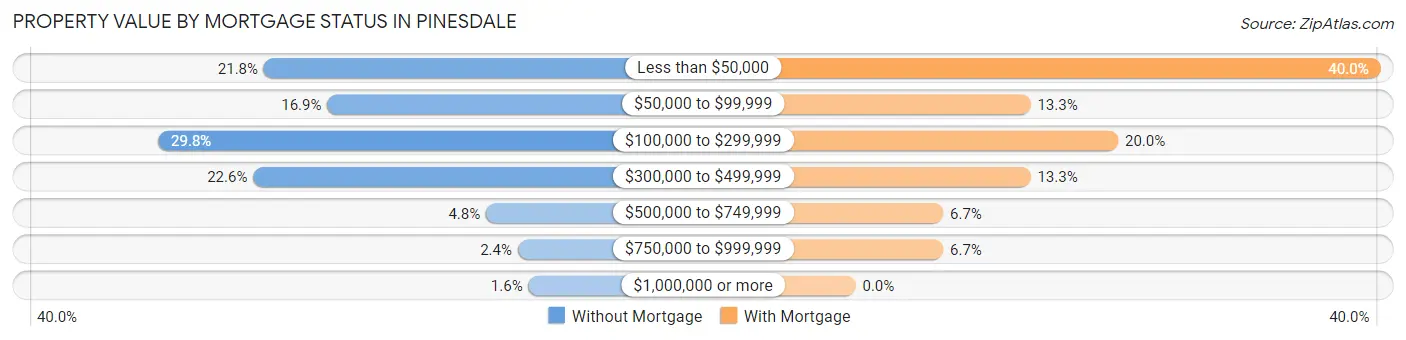
| Property Value | Without Mortgage | With Mortgage |
| Less than $50,000 | 27 (21.8%) | 6 (40.0%) |
| $50,000 to $99,999 | 21 (16.9%) | 2 (13.3%) |
| $100,000 to $299,999 | 37 (29.8%) | 3 (20.0%) |
| $300,000 to $499,999 | 28 (22.6%) | 2 (13.3%) |
| $500,000 to $749,999 | 6 (4.8%) | 1 (6.7%) |
| $750,000 to $999,999 | 3 (2.4%) | 1 (6.7%) |
| $1,000,000 or more | 2 (1.6%) | 0 (0.0%) |
| Total | 124 (100.0%) | 15 (100.0%) |
Household Income by Mortgage Status in Pinesdale
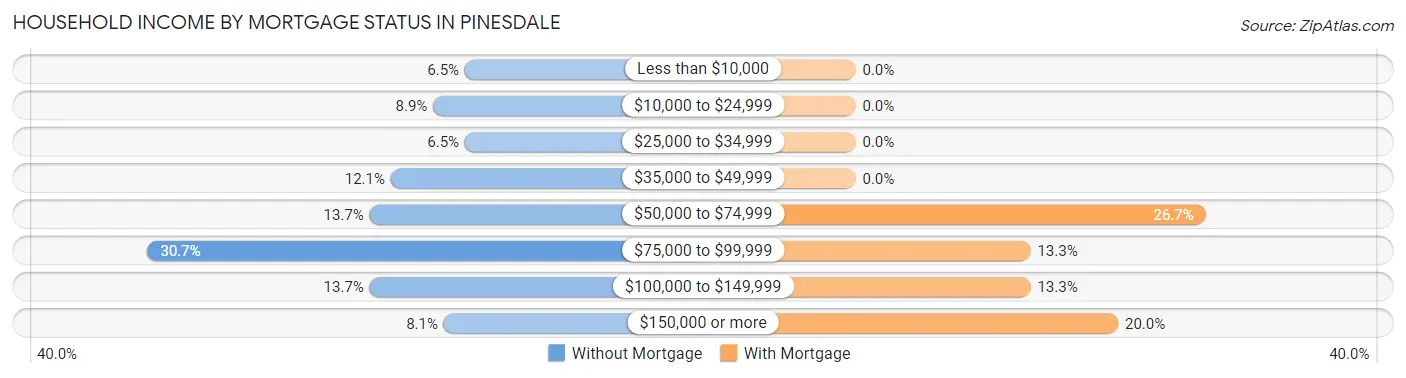
| Household Income | Without Mortgage | With Mortgage |
| Less than $10,000 | 8 (6.5%) | 0 (0.0%) |
| $10,000 to $24,999 | 11 (8.9%) | 0 (0.0%) |
| $25,000 to $34,999 | 8 (6.5%) | 0 (0.0%) |
| $35,000 to $49,999 | 15 (12.1%) | 0 (0.0%) |
| $50,000 to $74,999 | 17 (13.7%) | 4 (26.7%) |
| $75,000 to $99,999 | 38 (30.6%) | 2 (13.3%) |
| $100,000 to $149,999 | 17 (13.7%) | 2 (13.3%) |
| $150,000 or more | 10 (8.1%) | 3 (20.0%) |
| Total | 124 (100.0%) | 15 (100.0%) |
Property Value to Household Income Ratio in Pinesdale
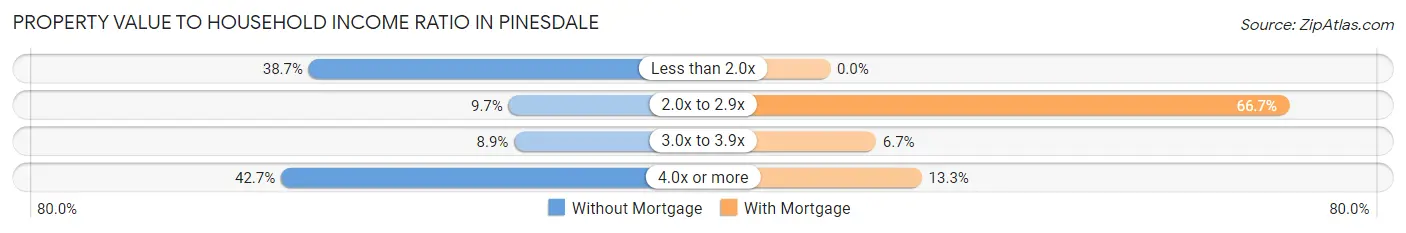
| Value-to-Income Ratio | Without Mortgage | With Mortgage |
| Less than 2.0x | 48 (38.7%) | 0 (0.0%) |
| 2.0x to 2.9x | 12 (9.7%) | 10 (66.7%) |
| 3.0x to 3.9x | 11 (8.9%) | 1 (6.7%) |
| 4.0x or more | 53 (42.7%) | 2 (13.3%) |
| Total | 124 (100.0%) | 15 (100.0%) |
Real Estate Taxes by Mortgage Status in Pinesdale
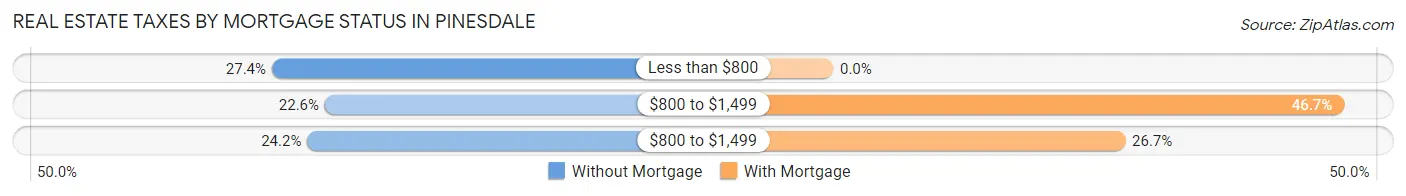
| Property Taxes | Without Mortgage | With Mortgage |
| Less than $800 | 34 (27.4%) | 0 (0.0%) |
| $800 to $1,499 | 28 (22.6%) | 7 (46.7%) |
| $800 to $1,499 | 30 (24.2%) | 4 (26.7%) |
| Total | 124 (100.0%) | 15 (100.0%) |
Health & Disability in Pinesdale
Health Insurance Coverage by Age in Pinesdale
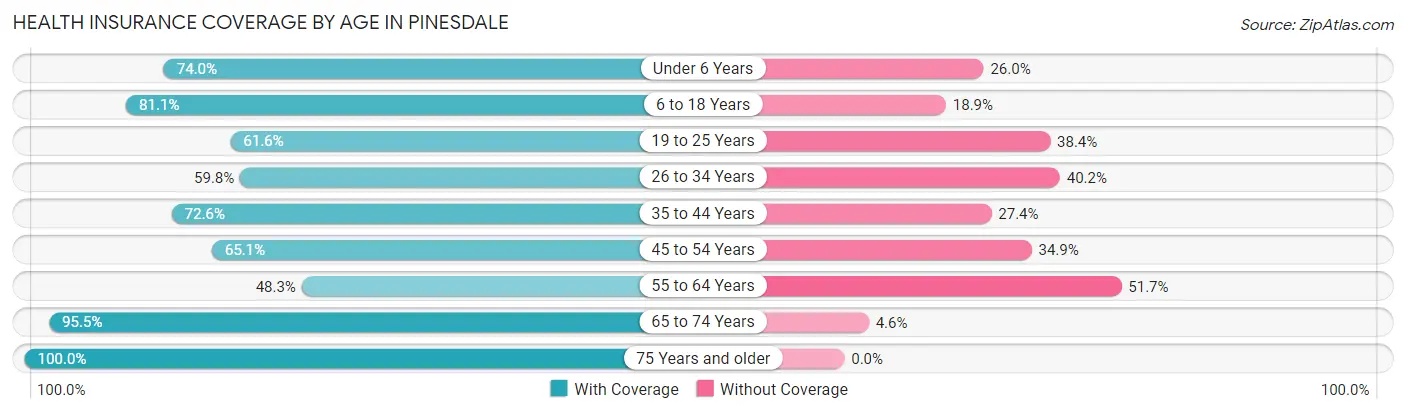
| Age Bracket | With Coverage | Without Coverage |
| Under 6 Years | 77 (74.0%) | 27 (26.0%) |
| 6 to 18 Years | 214 (81.1%) | 50 (18.9%) |
| 19 to 25 Years | 122 (61.6%) | 76 (38.4%) |
| 26 to 34 Years | 64 (59.8%) | 43 (40.2%) |
| 35 to 44 Years | 45 (72.6%) | 17 (27.4%) |
| 45 to 54 Years | 41 (65.1%) | 22 (34.9%) |
| 55 to 64 Years | 29 (48.3%) | 31 (51.7%) |
| 65 to 74 Years | 21 (95.5%) | 1 (4.5%) |
| 75 Years and older | 24 (100.0%) | 0 (0.0%) |
| Total | 637 (70.5%) | 267 (29.5%) |
Health Insurance Coverage by Citizenship Status in Pinesdale
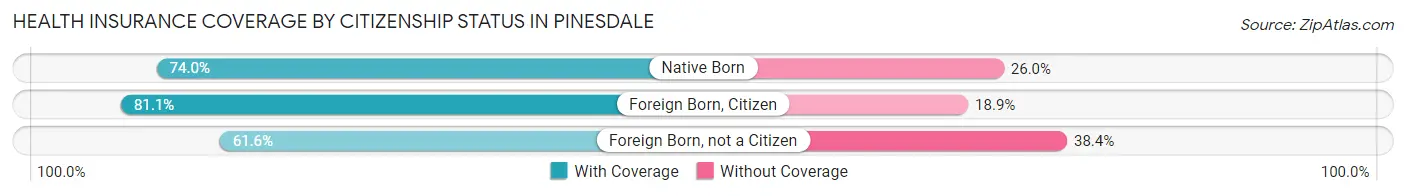
| Citizenship Status | With Coverage | Without Coverage |
| Native Born | 77 (74.0%) | 27 (26.0%) |
| Foreign Born, Citizen | 214 (81.1%) | 50 (18.9%) |
| Foreign Born, not a Citizen | 122 (61.6%) | 76 (38.4%) |
Health Insurance Coverage by Household Income in Pinesdale
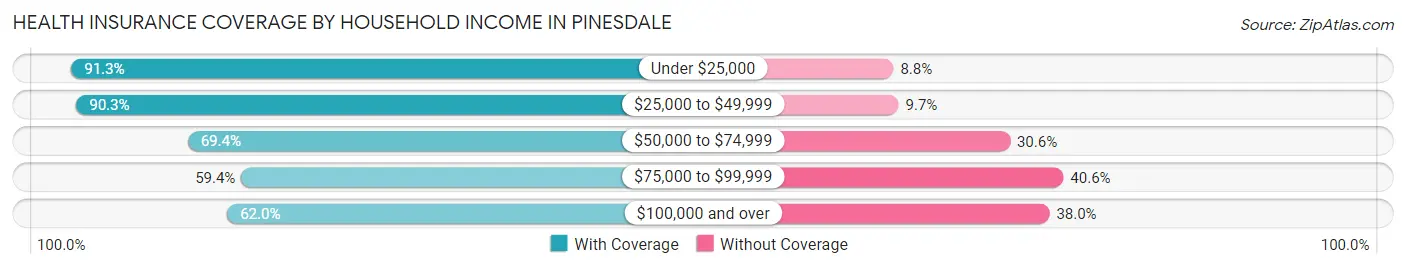
| Household Income | With Coverage | Without Coverage |
| Under $25,000 | 73 (91.2%) | 7 (8.7%) |
| $25,000 to $49,999 | 149 (90.3%) | 16 (9.7%) |
| $50,000 to $74,999 | 109 (69.4%) | 48 (30.6%) |
| $75,000 to $99,999 | 123 (59.4%) | 84 (40.6%) |
| $100,000 and over | 183 (62.0%) | 112 (38.0%) |
Public vs Private Health Insurance Coverage by Age in Pinesdale
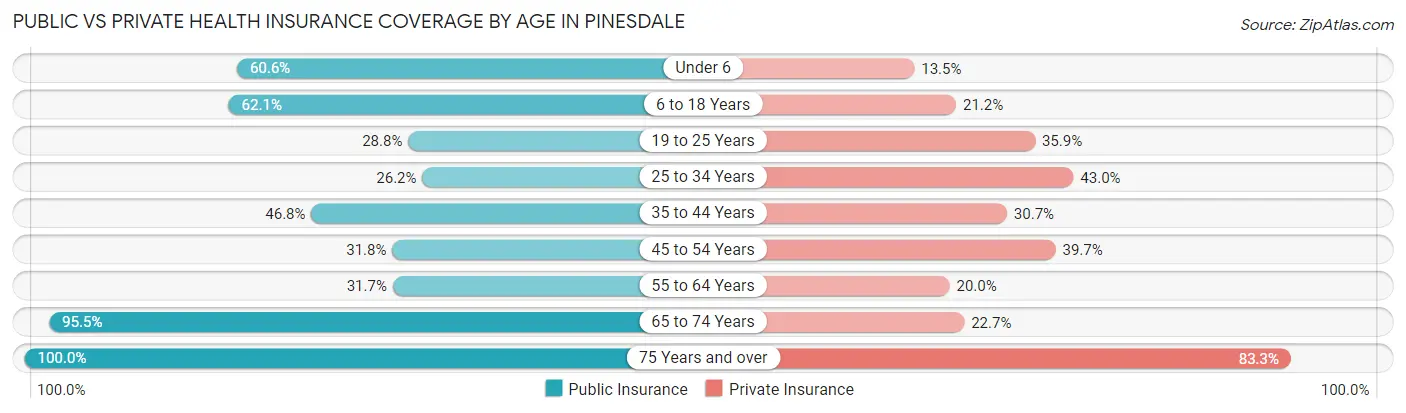
| Age Bracket | Public Insurance | Private Insurance |
| Under 6 | 63 (60.6%) | 14 (13.5%) |
| 6 to 18 Years | 164 (62.1%) | 56 (21.2%) |
| 19 to 25 Years | 57 (28.8%) | 71 (35.9%) |
| 25 to 34 Years | 28 (26.2%) | 46 (43.0%) |
| 35 to 44 Years | 29 (46.8%) | 19 (30.6%) |
| 45 to 54 Years | 20 (31.8%) | 25 (39.7%) |
| 55 to 64 Years | 19 (31.7%) | 12 (20.0%) |
| 65 to 74 Years | 21 (95.5%) | 5 (22.7%) |
| 75 Years and over | 24 (100.0%) | 20 (83.3%) |
| Total | 425 (47.0%) | 268 (29.6%) |
Disability Status by Sex by Age in Pinesdale
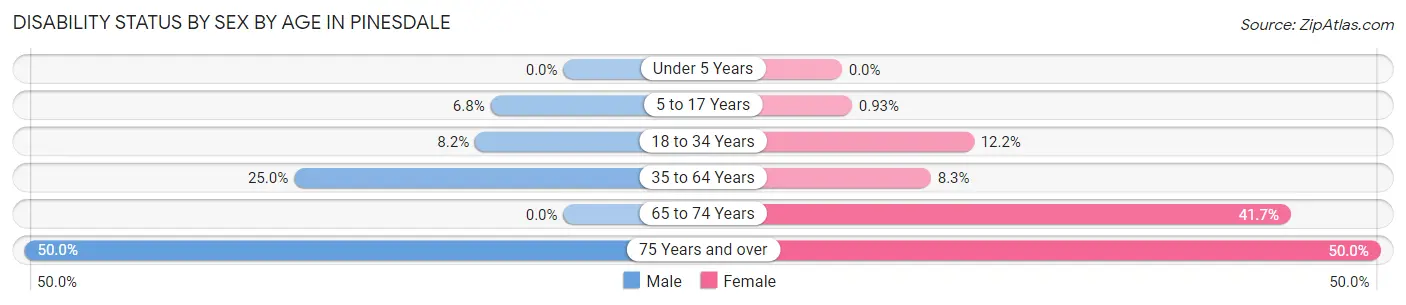
| Age Bracket | Male | Female |
| Under 5 Years | 0 (0.0%) | 0 (0.0%) |
| 5 to 17 Years | 10 (6.8%) | 1 (0.9%) |
| 18 to 34 Years | 15 (8.2%) | 18 (12.2%) |
| 35 to 64 Years | 19 (25.0%) | 9 (8.3%) |
| 65 to 74 Years | 0 (0.0%) | 5 (41.7%) |
| 75 Years and over | 4 (50.0%) | 8 (50.0%) |
Disability Class by Sex by Age in Pinesdale
Disability Class: Hearing Difficulty
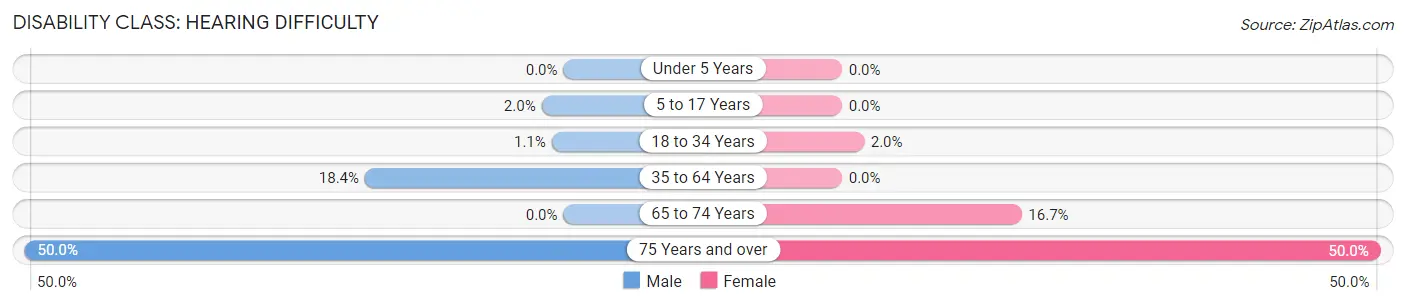
| Age Bracket | Male | Female |
| Under 5 Years | 0 (0.0%) | 0 (0.0%) |
| 5 to 17 Years | 3 (2.0%) | 0 (0.0%) |
| 18 to 34 Years | 2 (1.1%) | 3 (2.0%) |
| 35 to 64 Years | 14 (18.4%) | 0 (0.0%) |
| 65 to 74 Years | 0 (0.0%) | 2 (16.7%) |
| 75 Years and over | 4 (50.0%) | 8 (50.0%) |
Disability Class: Vision Difficulty
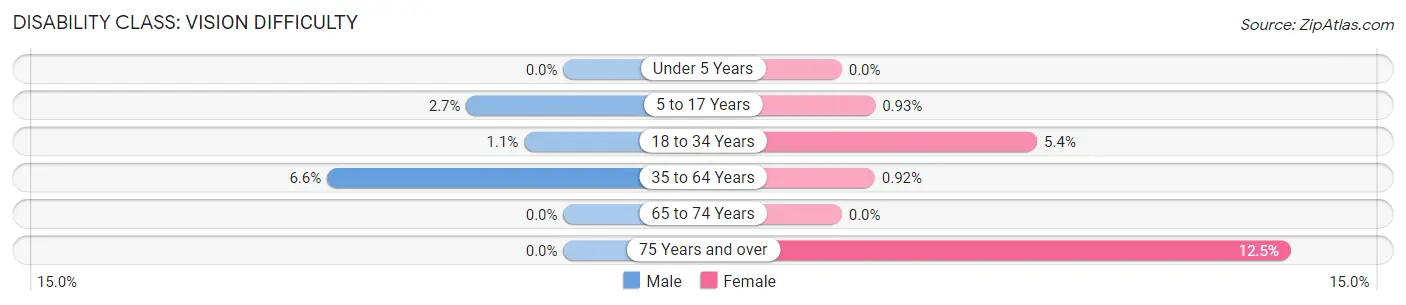
| Age Bracket | Male | Female |
| Under 5 Years | 0 (0.0%) | 0 (0.0%) |
| 5 to 17 Years | 4 (2.7%) | 1 (0.9%) |
| 18 to 34 Years | 2 (1.1%) | 8 (5.4%) |
| 35 to 64 Years | 5 (6.6%) | 1 (0.9%) |
| 65 to 74 Years | 0 (0.0%) | 0 (0.0%) |
| 75 Years and over | 0 (0.0%) | 2 (12.5%) |
Disability Class: Cognitive Difficulty
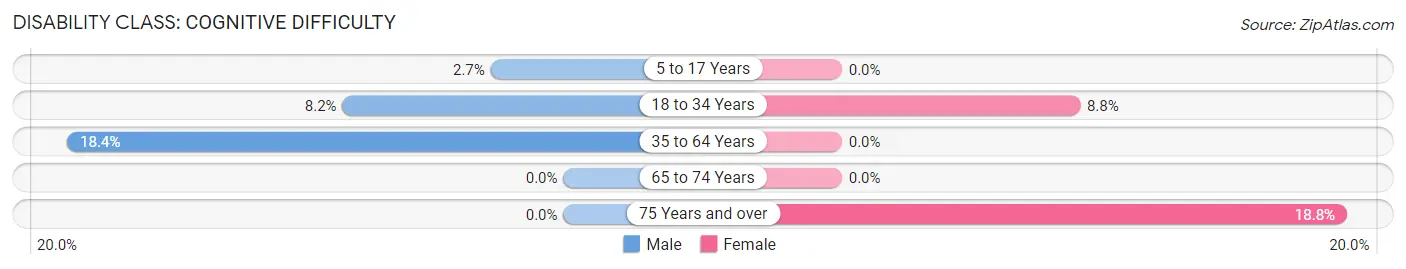
| Age Bracket | Male | Female |
| 5 to 17 Years | 4 (2.7%) | 0 (0.0%) |
| 18 to 34 Years | 15 (8.2%) | 13 (8.8%) |
| 35 to 64 Years | 14 (18.4%) | 0 (0.0%) |
| 65 to 74 Years | 0 (0.0%) | 0 (0.0%) |
| 75 Years and over | 0 (0.0%) | 3 (18.8%) |
Disability Class: Ambulatory Difficulty
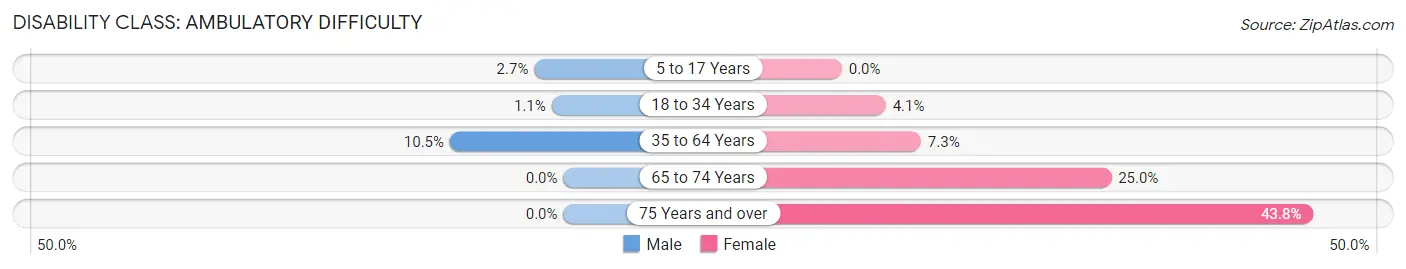
| Age Bracket | Male | Female |
| 5 to 17 Years | 4 (2.7%) | 0 (0.0%) |
| 18 to 34 Years | 2 (1.1%) | 6 (4.1%) |
| 35 to 64 Years | 8 (10.5%) | 8 (7.3%) |
| 65 to 74 Years | 0 (0.0%) | 3 (25.0%) |
| 75 Years and over | 0 (0.0%) | 7 (43.8%) |
Disability Class: Self-Care Difficulty
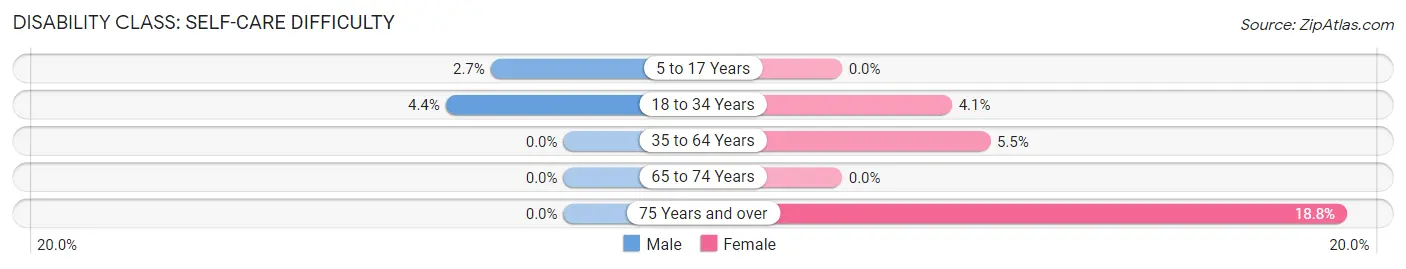
| Age Bracket | Male | Female |
| 5 to 17 Years | 4 (2.7%) | 0 (0.0%) |
| 18 to 34 Years | 8 (4.4%) | 6 (4.1%) |
| 35 to 64 Years | 0 (0.0%) | 6 (5.5%) |
| 65 to 74 Years | 0 (0.0%) | 0 (0.0%) |
| 75 Years and over | 0 (0.0%) | 3 (18.8%) |
Technology Access in Pinesdale
Computing Device Access in Pinesdale
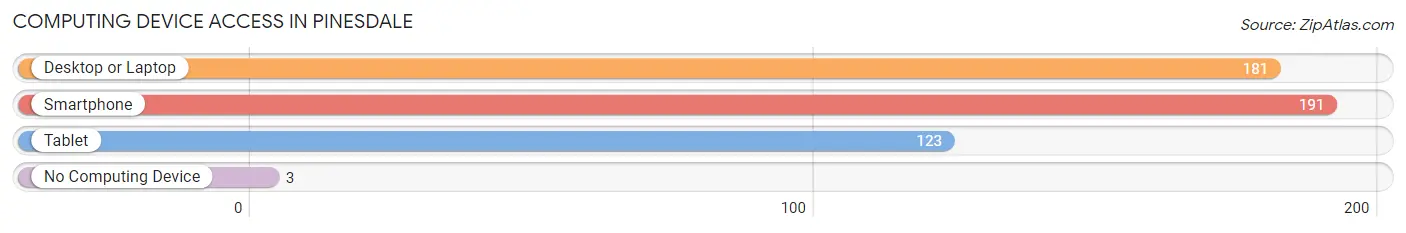
| Device Type | # Households | % Households |
| Desktop or Laptop | 181 | 88.3% |
| Smartphone | 191 | 93.2% |
| Tablet | 123 | 60.0% |
| No Computing Device | 3 | 1.5% |
| Total | 205 | 100.0% |
Internet Access in Pinesdale
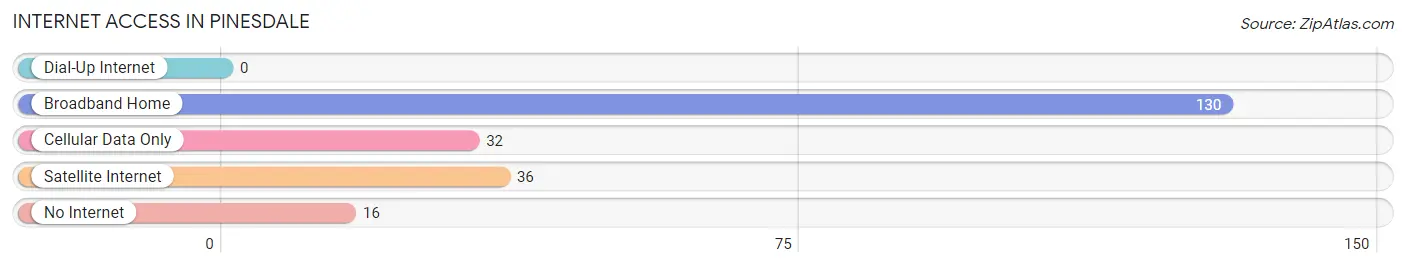
| Internet Type | # Households | % Households |
| Dial-Up Internet | 0 | 0.0% |
| Broadband Home | 130 | 63.4% |
| Cellular Data Only | 32 | 15.6% |
| Satellite Internet | 36 | 17.6% |
| No Internet | 16 | 7.8% |
| Total | 205 | 100.0% |
Pinesdale Summary
Pinesdale is a small unincorporated community located in the Bitterroot Valley of western Montana. It is situated in the foothills of the Bitterroot Mountains, approximately 10 miles south of the city of Hamilton. The population of Pinesdale was estimated to be around 1,000 in 2020.
History
Pinesdale was founded in the late 1800s by homesteaders who were attracted to the area by its abundant natural resources. The first settlers were mostly of German and Scandinavian descent, and the town was named after the abundance of pine trees in the area. The town was officially incorporated in 1909.
In the early 1900s, Pinesdale was a thriving agricultural community, with many of the residents working in the local lumber industry. The town also had a thriving dairy industry, and the local creamery was a major employer.
In the 1950s, the town began to decline as the lumber industry moved away and the dairy industry declined. The population of Pinesdale dropped from a peak of around 1,500 in the 1950s to around 1,000 in 2020.
Geography
Pinesdale is located in the Bitterroot Valley of western Montana. The town is situated in the foothills of the Bitterroot Mountains, approximately 10 miles south of the city of Hamilton. The town is surrounded by rolling hills and forests, and is located near the Bitterroot River.
The climate in Pinesdale is generally mild, with hot summers and cold winters. The average annual temperature is around 50 degrees Fahrenheit, and the average annual precipitation is around 20 inches.
Economy
The economy of Pinesdale is largely based on agriculture and tourism. The town is home to several small farms, and the local farmers’ markets are popular with tourists. The town is also home to several small businesses, including restaurants, shops, and a local brewery.
The town is also home to several outdoor recreation opportunities, including hiking, fishing, and camping. The nearby Bitterroot National Forest is a popular destination for outdoor enthusiasts.
Demographics
The population of Pinesdale was estimated to be around 1,000 in 2020. The town is predominantly white, with around 95% of the population identifying as Caucasian. The median household income in Pinesdale is around $50,000, and the median home value is around $200,000.
The town is home to a diverse religious community, with the majority of residents identifying as Christian. The town is also home to a small Jewish community, and there is a synagogue in town.
Conclusion
Pinesdale is a small unincorporated community located in the Bitterroot Valley of western Montana. The town was founded in the late 1800s by homesteaders, and the population of Pinesdale was estimated to be around 1,000 in 2020. The economy of Pinesdale is largely based on agriculture and tourism, and the town is home to a diverse religious community. Pinesdale is a popular destination for outdoor enthusiasts, and the town is surrounded by rolling hills and forests.
Common Questions
What is Per Capita Income in Pinesdale?
Per Capita income in Pinesdale is $20,312.
What is the Median Family Income in Pinesdale?
Median Family Income in Pinesdale is $79,643.
What is the Median Household income in Pinesdale?
Median Household Income in Pinesdale is $78,036.
What is Income or Wage Gap in Pinesdale?
Income or Wage Gap in Pinesdale is 69.1%.
Women in Pinesdale earn 30.9 cents for every dollar earned by a man.
What is Inequality or Gini Index in Pinesdale?
Inequality or Gini Index in Pinesdale is 0.37.
What is the Total Population of Pinesdale?
Total Population of Pinesdale is 904.
What is the Total Male Population of Pinesdale?
Total Male Population of Pinesdale is 460.
What is the Total Female Population of Pinesdale?
Total Female Population of Pinesdale is 444.
What is the Ratio of Males per 100 Females in Pinesdale?
There are 103.60 Males per 100 Females in Pinesdale.
What is the Ratio of Females per 100 Males in Pinesdale?
There are 96.52 Females per 100 Males in Pinesdale.
What is the Median Population Age in Pinesdale?
Median Population Age in Pinesdale is 21.7 Years.
What is the Average Family Size in Pinesdale
Average Family Size in Pinesdale is 4.9 People.
What is the Average Household Size in Pinesdale
Average Household Size in Pinesdale is 4.4 People.
How Large is the Labor Force in Pinesdale?
There are 455 People in the Labor Forcein in Pinesdale.
What is the Percentage of People in the Labor Force in Pinesdale?
73.7% of People are in the Labor Force in Pinesdale.
What is the Unemployment Rate in Pinesdale?
Unemployment Rate in Pinesdale is 2.2%.