Augusta, MT Map & Demographics
Augusta Map
Augusta Overview
$33,258
PER CAPITA INCOME
$47,708
AVG FAMILY INCOME
$41,118
AVG HOUSEHOLD INCOME
19.8%
WAGE / INCOME GAP [ % ]
80.2¢/ $1
WAGE / INCOME GAP [ $ ]
0.43
INEQUALITY / GINI INDEX
215
TOTAL POPULATION
111
MALE POPULATION
104
FEMALE POPULATION
106.73
MALES / 100 FEMALES
93.69
FEMALES / 100 MALES
63.2
MEDIAN AGE
2.2
AVG FAMILY SIZE
1.8
AVG HOUSEHOLD SIZE
81
LABOR FORCE [ PEOPLE ]
42.0%
PERCENT IN LABOR FORCE
Augusta Zip Codes
Augusta Area Codes
Income in Augusta
Income Overview in Augusta
Per Capita Income in Augusta is $33,258, while median incomes of families and households are $47,708 and $41,118 respectively.
| Characteristic | Number | Measure |
| Per Capita Income | 215 | $33,258 |
| Median Family Income | 77 | $47,708 |
| Mean Family Income | 77 | $65,049 |
| Median Household Income | 123 | $41,118 |
| Mean Household Income | 123 | $61,580 |
| Income Deficit | 77 | $0 |
| Wage / Income Gap (%) | 215 | 19.84% |
| Wage / Income Gap ($) | 215 | 80.16¢ per $1 |
| Gini / Inequality Index | 215 | 0.43 |
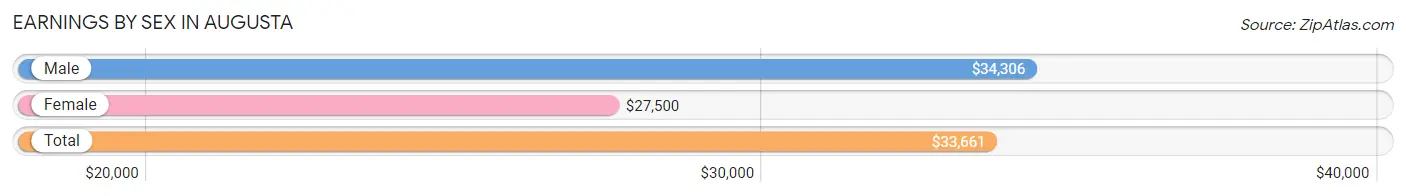
Earnings by Sex in Augusta
Average Earnings in Augusta are $33,661, $34,306 for men and $27,500 for women, a difference of 19.8%.
| Sex | Number | Average Earnings |
| Male | 53 (62.4%) | $34,306 |
| Female | 32 (37.7%) | $27,500 |
| Total | 85 (100.0%) | $33,661 |
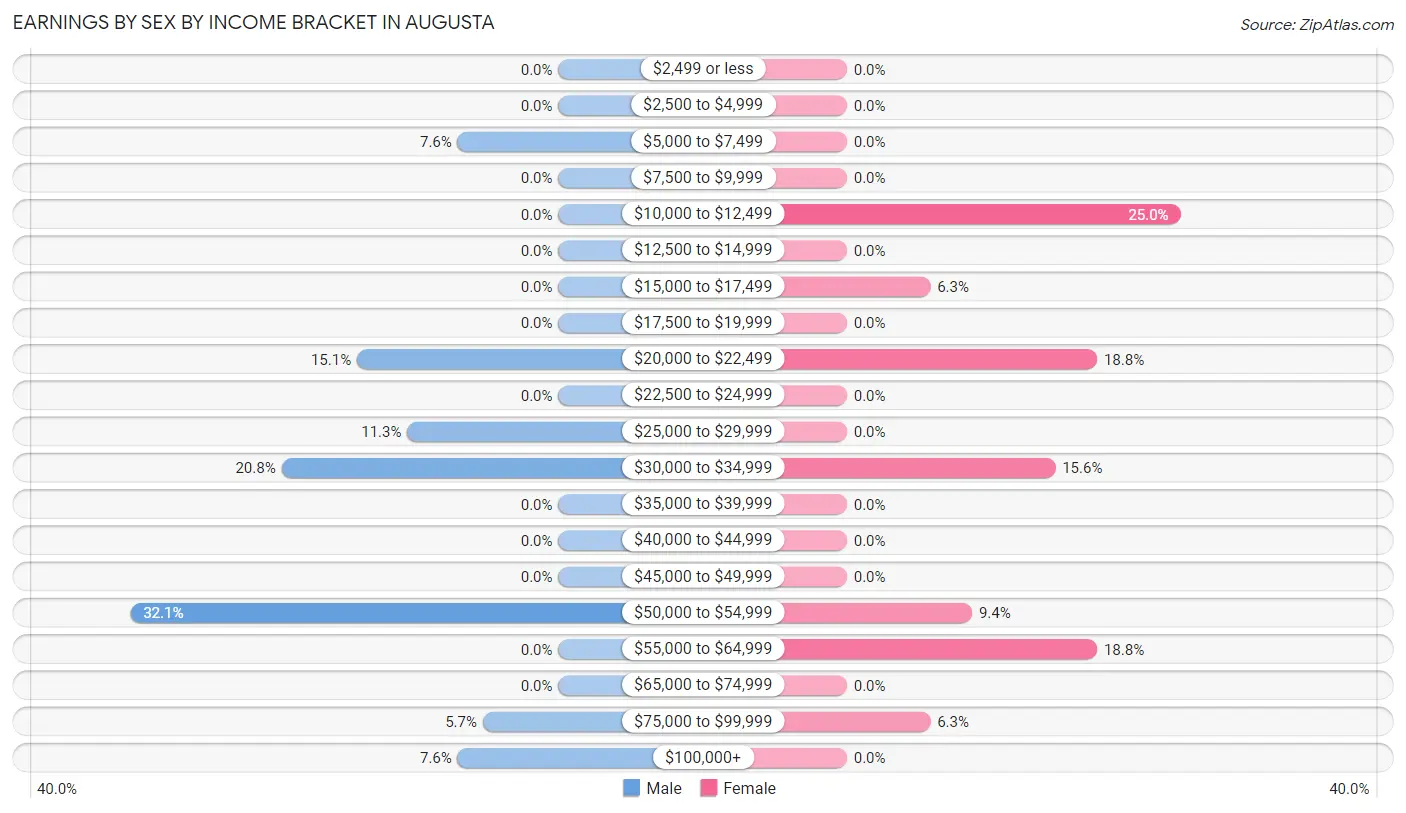
Earnings by Sex by Income Bracket in Augusta
The most common earnings brackets in Augusta are $50,000 to $54,999 for men (17 | 32.1%) and $10,000 to $12,499 for women (8 | 25.0%).
| Income | Male | Female |
| $2,499 or less | 0 (0.0%) | 0 (0.0%) |
| $2,500 to $4,999 | 0 (0.0%) | 0 (0.0%) |
| $5,000 to $7,499 | 4 (7.5%) | 0 (0.0%) |
| $7,500 to $9,999 | 0 (0.0%) | 0 (0.0%) |
| $10,000 to $12,499 | 0 (0.0%) | 8 (25.0%) |
| $12,500 to $14,999 | 0 (0.0%) | 0 (0.0%) |
| $15,000 to $17,499 | 0 (0.0%) | 2 (6.2%) |
| $17,500 to $19,999 | 0 (0.0%) | 0 (0.0%) |
| $20,000 to $22,499 | 8 (15.1%) | 6 (18.8%) |
| $22,500 to $24,999 | 0 (0.0%) | 0 (0.0%) |
| $25,000 to $29,999 | 6 (11.3%) | 0 (0.0%) |
| $30,000 to $34,999 | 11 (20.7%) | 5 (15.6%) |
| $35,000 to $39,999 | 0 (0.0%) | 0 (0.0%) |
| $40,000 to $44,999 | 0 (0.0%) | 0 (0.0%) |
| $45,000 to $49,999 | 0 (0.0%) | 0 (0.0%) |
| $50,000 to $54,999 | 17 (32.1%) | 3 (9.4%) |
| $55,000 to $64,999 | 0 (0.0%) | 6 (18.8%) |
| $65,000 to $74,999 | 0 (0.0%) | 0 (0.0%) |
| $75,000 to $99,999 | 3 (5.7%) | 2 (6.2%) |
| $100,000+ | 4 (7.5%) | 0 (0.0%) |
| Total | 53 (100.0%) | 32 (100.0%) |
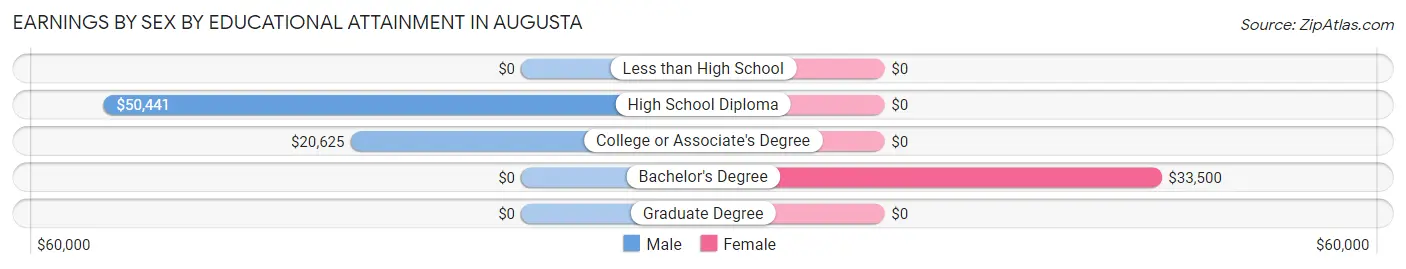
Earnings by Sex by Educational Attainment in Augusta
Average earnings in Augusta are $34,306 for men and $27,500 for women, a difference of 19.8%. Men with an educational attainment of high school diploma enjoy the highest average annual earnings of $50,441, while those with college or associate's degree education earn the least with $20,625. Women with an educational attainment of bachelor's degree earn the most with the average annual earnings of $33,500, while those with bachelor's degree education have the smallest earnings of $33,500.
| Educational Attainment | Male Income | Female Income |
| Less than High School | - | - |
| High School Diploma | $50,441 | $0 |
| College or Associate's Degree | $20,625 | $0 |
| Bachelor's Degree | - | - |
| Graduate Degree | - | - |
| Total | $34,306 | $27,500 |
Family Income in Augusta
Family Income Brackets in Augusta
According to the Augusta family income data, there are 21 families falling into the $100,000 to $149,999 income range, which is the most common income bracket and makes up 27.3% of all families.
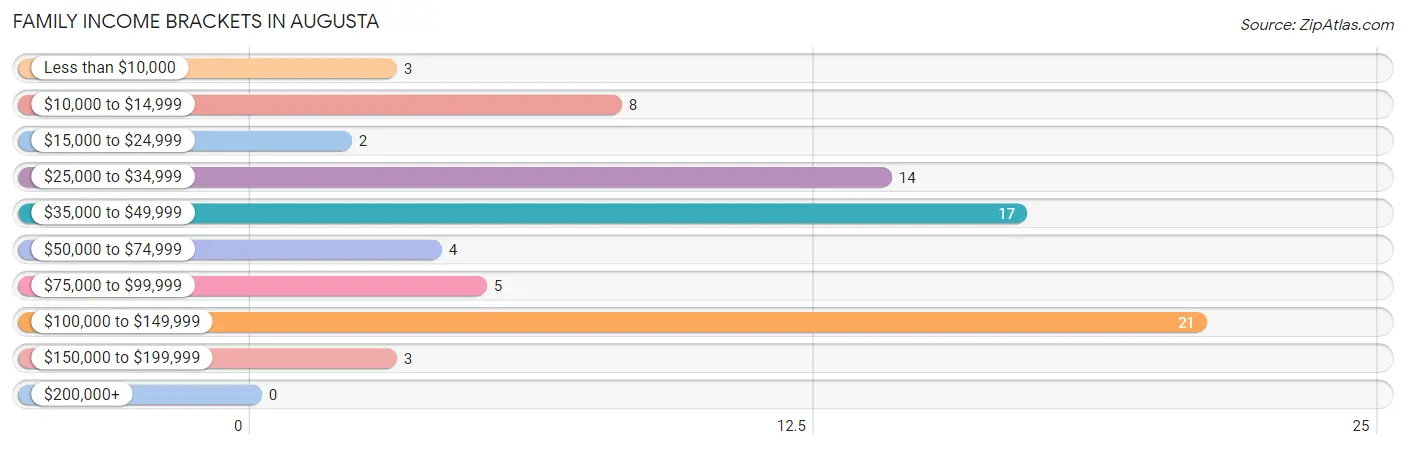
| Income Bracket | # Families | % Families |
| Less than $10,000 | 3 | 3.9% |
| $10,000 to $14,999 | 8 | 10.4% |
| $15,000 to $24,999 | 2 | 2.6% |
| $25,000 to $34,999 | 14 | 18.2% |
| $35,000 to $49,999 | 17 | 22.1% |
| $50,000 to $74,999 | 4 | 5.2% |
| $75,000 to $99,999 | 5 | 6.5% |
| $100,000 to $149,999 | 21 | 27.3% |
| $150,000 to $199,999 | 3 | 3.9% |
| $200,000+ | 0 | 0.0% |
Family Income by Famaliy Size in Augusta
| Income Bracket | # Families | Median Income |
| 2-Person Families | 64 (83.1%) | $0 |
| 3-Person Families | 13 (16.9%) | $0 |
| 4-Person Families | 0 (0.0%) | $0 |
| 5-Person Families | 0 (0.0%) | $0 |
| 6-Person Families | 0 (0.0%) | $0 |
| 7+ Person Families | 0 (0.0%) | $0 |
| Total | 77 (100.0%) | $47,708 |
Family Income by Number of Earners in Augusta
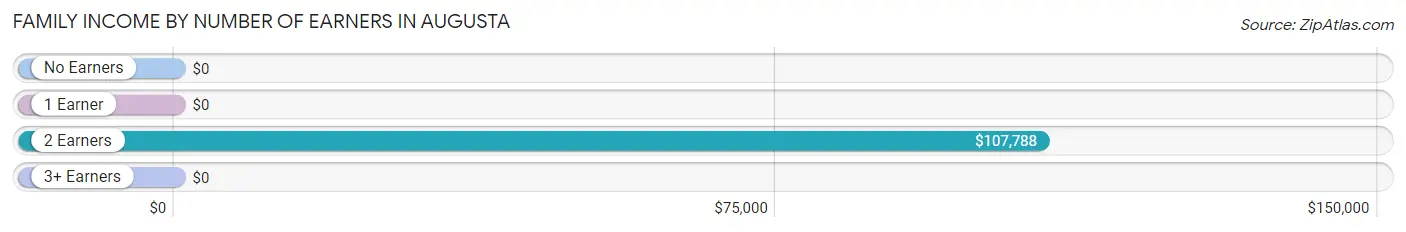
| Number of Earners | # Families | Median Income |
| No Earners | 27 (35.1%) | $0 |
| 1 Earner | 21 (27.3%) | $0 |
| 2 Earners | 29 (37.7%) | $107,788 |
| 3+ Earners | 0 (0.0%) | $0 |
| Total | 77 (100.0%) | $47,708 |
Household Income in Augusta
Household Income Brackets in Augusta
With 31 households falling in the category, the $35,000 to $49,999 income range is the most frequent in Augusta, accounting for 25.2% of all households. In contrast, only 2 households (1.6%) fall into the $200,000+ income bracket, making it the least populous group.
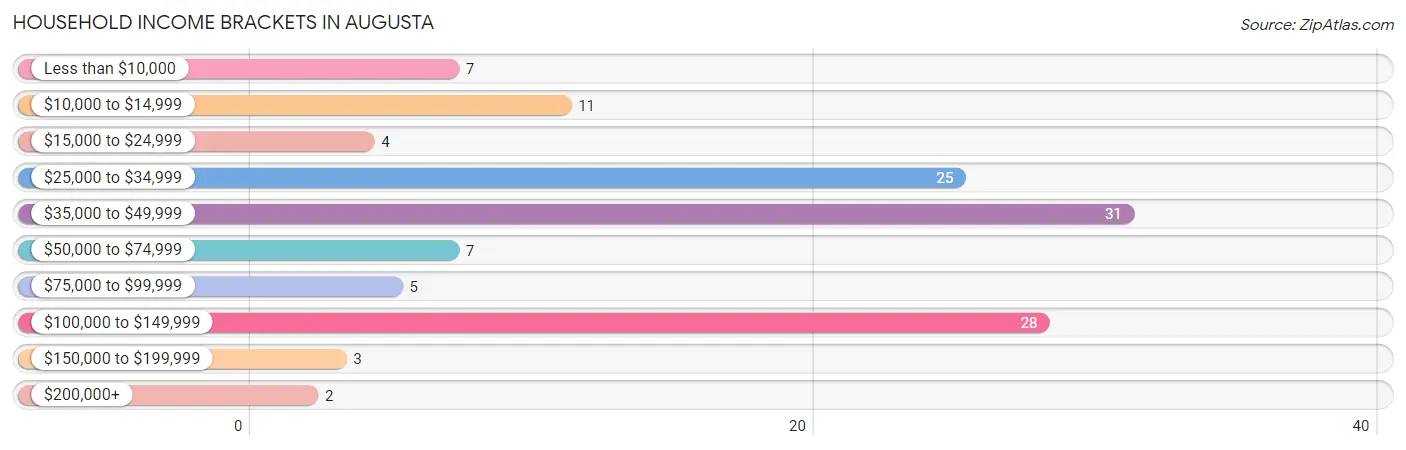
| Income Bracket | # Households | % Households |
| Less than $10,000 | 7 | 5.7% |
| $10,000 to $14,999 | 11 | 8.9% |
| $15,000 to $24,999 | 4 | 3.3% |
| $25,000 to $34,999 | 25 | 20.3% |
| $35,000 to $49,999 | 31 | 25.2% |
| $50,000 to $74,999 | 7 | 5.7% |
| $75,000 to $99,999 | 5 | 4.1% |
| $100,000 to $149,999 | 28 | 22.8% |
| $150,000 to $199,999 | 3 | 2.4% |
| $200,000+ | 2 | 1.6% |
Household Income by Householder Age in Augusta
The median household income in Augusta is $41,118, with the highest median household income of $47,917 found in the 45 to 64 years age bracket for the primary householder. A total of 46 households (37.4%) fall into this category.
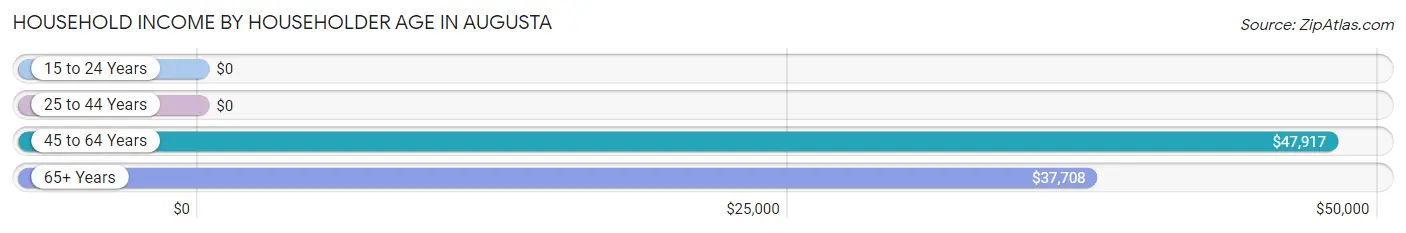
| Income Bracket | # Households | Median Income |
| 15 to 24 Years | 0 (0.0%) | $0 |
| 25 to 44 Years | 26 (21.1%) | $0 |
| 45 to 64 Years | 46 (37.4%) | $47,917 |
| 65+ Years | 51 (41.5%) | $37,708 |
| Total | 123 (100.0%) | $41,118 |
Poverty in Augusta
Income Below Poverty by Sex and Age in Augusta
With 5.4% poverty level for males and 30.8% for females among the residents of Augusta, 75 year old and over males and under 5 year old females are the most vulnerable to poverty, with 3 males (12.5%) and 8 females (100.0%) in their respective age groups living below the poverty level.
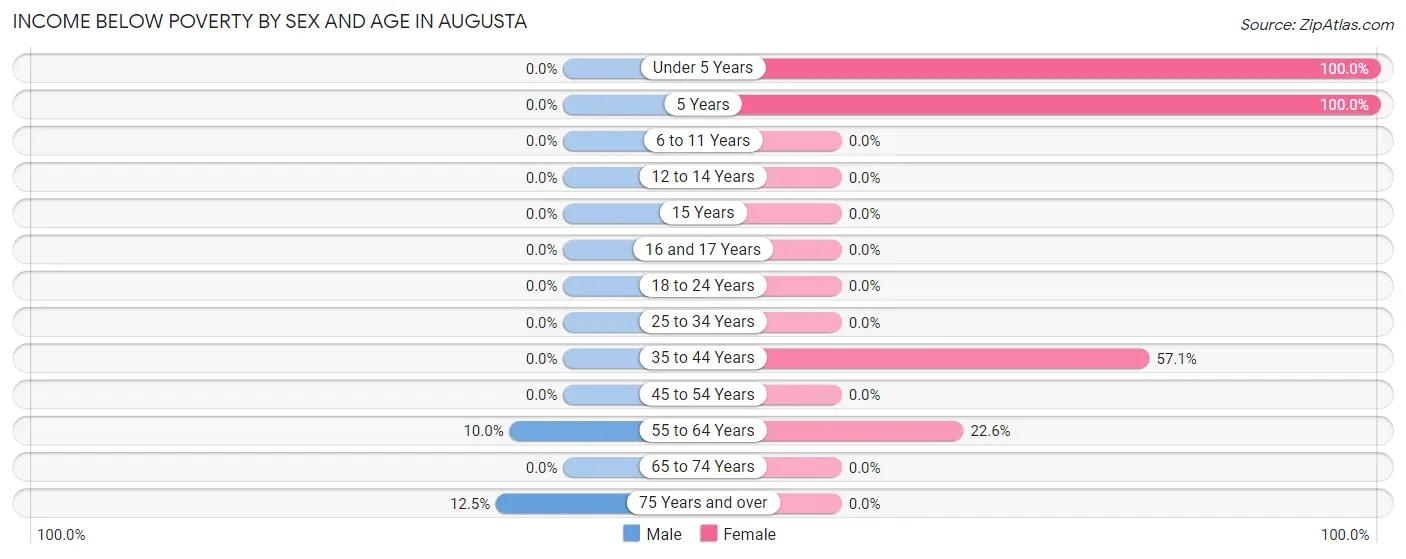
| Age Bracket | Male | Female |
| Under 5 Years | 0 (0.0%) | 8 (100.0%) |
| 5 Years | 0 (0.0%) | 9 (100.0%) |
| 6 to 11 Years | 0 (0.0%) | 0 (0.0%) |
| 12 to 14 Years | 0 (0.0%) | 0 (0.0%) |
| 15 Years | 0 (0.0%) | 0 (0.0%) |
| 16 and 17 Years | 0 (0.0%) | 0 (0.0%) |
| 18 to 24 Years | 0 (0.0%) | 0 (0.0%) |
| 25 to 34 Years | 0 (0.0%) | 0 (0.0%) |
| 35 to 44 Years | 0 (0.0%) | 8 (57.1%) |
| 45 to 54 Years | 0 (0.0%) | 0 (0.0%) |
| 55 to 64 Years | 3 (10.0%) | 7 (22.6%) |
| 65 to 74 Years | 0 (0.0%) | 0 (0.0%) |
| 75 Years and over | 3 (12.5%) | 0 (0.0%) |
| Total | 6 (5.4%) | 32 (30.8%) |
Income Above Poverty by Sex and Age in Augusta
According to the poverty statistics in Augusta, males aged under 5 years and females aged 25 to 34 years are the age groups that are most secure financially, with 100.0% of males and 100.0% of females in these age groups living above the poverty line.
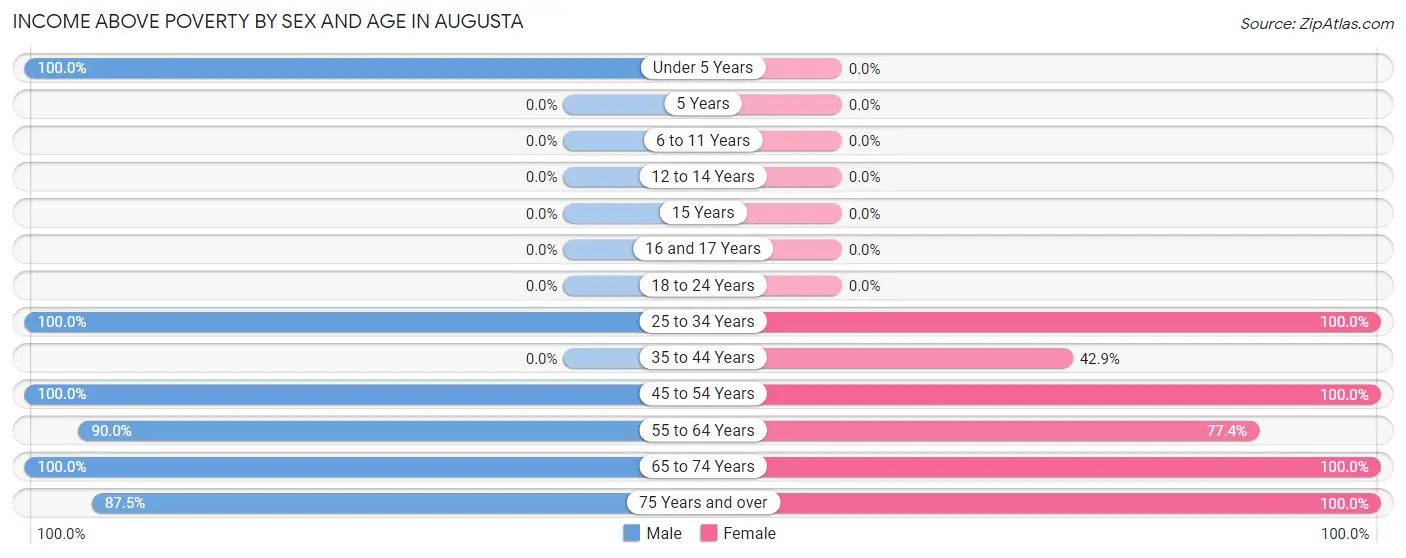
| Age Bracket | Male | Female |
| Under 5 Years | 5 (100.0%) | 0 (0.0%) |
| 5 Years | 0 (0.0%) | 0 (0.0%) |
| 6 to 11 Years | 0 (0.0%) | 0 (0.0%) |
| 12 to 14 Years | 0 (0.0%) | 0 (0.0%) |
| 15 Years | 0 (0.0%) | 0 (0.0%) |
| 16 and 17 Years | 0 (0.0%) | 0 (0.0%) |
| 18 to 24 Years | 0 (0.0%) | 0 (0.0%) |
| 25 to 34 Years | 17 (100.0%) | 5 (100.0%) |
| 35 to 44 Years | 0 (0.0%) | 6 (42.9%) |
| 45 to 54 Years | 7 (100.0%) | 2 (100.0%) |
| 55 to 64 Years | 27 (90.0%) | 24 (77.4%) |
| 65 to 74 Years | 28 (100.0%) | 15 (100.0%) |
| 75 Years and over | 21 (87.5%) | 20 (100.0%) |
| Total | 105 (94.6%) | 72 (69.2%) |
Income Below Poverty Among Married-Couple Families in Augusta
The poverty statistics for married-couple families in Augusta show that 4.5% or 3 of the total 67 families live below the poverty line. Families with no children have the highest poverty rate of 4.8%, comprising of 3 families. On the other hand, families with 1 or 2 children have the lowest poverty rate of 0.0%, which includes 0 families.
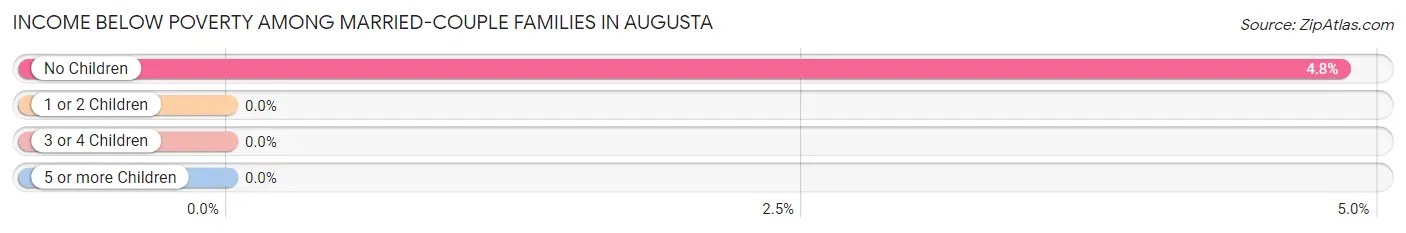
| Children | Above Poverty | Below Poverty |
| No Children | 59 (95.2%) | 3 (4.8%) |
| 1 or 2 Children | 5 (100.0%) | 0 (0.0%) |
| 3 or 4 Children | 0 (0.0%) | 0 (0.0%) |
| 5 or more Children | 0 (0.0%) | 0 (0.0%) |
| Total | 64 (95.5%) | 3 (4.5%) |
Income Below Poverty Among Single-Parent Households in Augusta
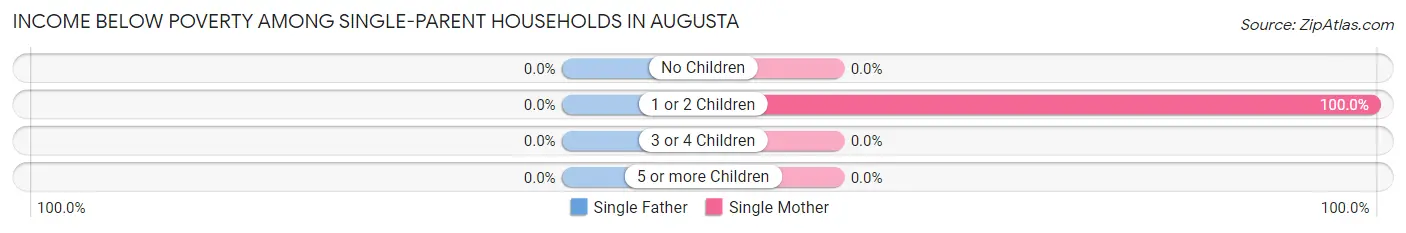
| Children | Single Father | Single Mother |
| No Children | 0 (0.0%) | 0 (0.0%) |
| 1 or 2 Children | 0 (0.0%) | 8 (100.0%) |
| 3 or 4 Children | 0 (0.0%) | 0 (0.0%) |
| 5 or more Children | 0 (0.0%) | 0 (0.0%) |
| Total | 0 (0.0%) | 8 (100.0%) |
Income Below Poverty Among Married-Couple vs Single-Parent Households in Augusta
The poverty data for Augusta shows that 3 of the married-couple family households (4.5%) and 8 of the single-parent households (80.0%) are living below the poverty level. Within the married-couple family households, those with no children have the highest poverty rate, with 3 households (4.8%) falling below the poverty line. Among the single-parent households, those with 1 or 2 children have the highest poverty rate, with 8 household (100.0%) living below poverty.
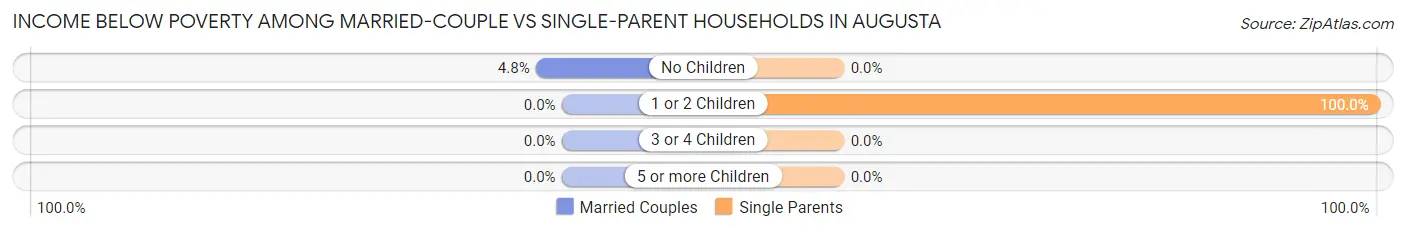
| Children | Married-Couple Families | Single-Parent Households |
| No Children | 3 (4.8%) | 0 (0.0%) |
| 1 or 2 Children | 0 (0.0%) | 8 (100.0%) |
| 3 or 4 Children | 0 (0.0%) | 0 (0.0%) |
| 5 or more Children | 0 (0.0%) | 0 (0.0%) |
| Total | 3 (4.5%) | 8 (80.0%) |
Race in Augusta
The most populous races in Augusta are White / Caucasian (204 | 94.9%), Native / Alaskan (7 | 3.3%), and Two or more Races (4 | 1.9%).
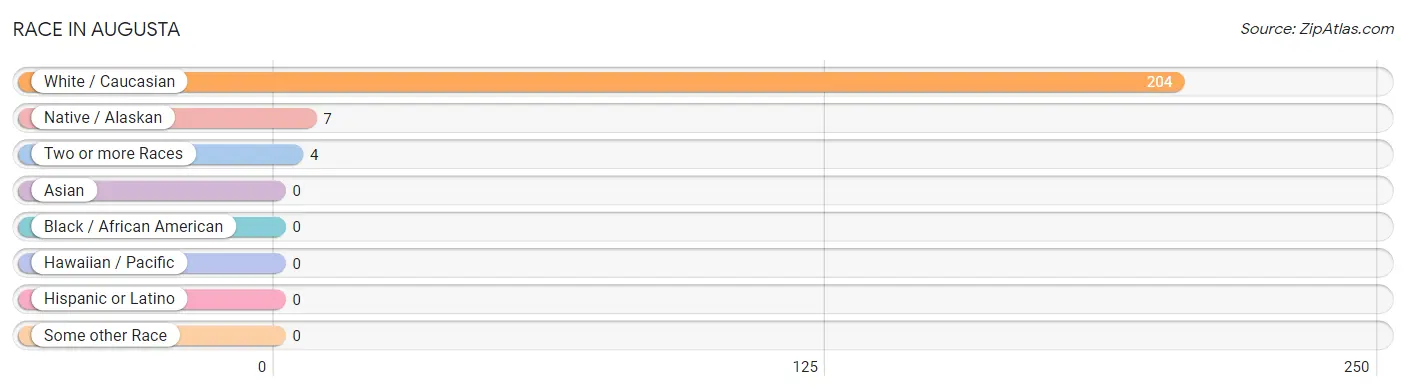
| Race | # Population | % Population |
| Asian | 0 | 0.0% |
| Black / African American | 0 | 0.0% |
| Hawaiian / Pacific | 0 | 0.0% |
| Hispanic or Latino | 0 | 0.0% |
| Native / Alaskan | 7 | 3.3% |
| White / Caucasian | 204 | 94.9% |
| Two or more Races | 4 | 1.9% |
| Some other Race | 0 | 0.0% |
| Total | 215 | 100.0% |
Ancestry in Augusta
The most populous ancestries reported in Augusta are English (36 | 16.7%), German (29 | 13.5%), American (23 | 10.7%), Scotch-Irish (19 | 8.8%), and Norwegian (17 | 7.9%), together accounting for 57.7% of all Augusta residents.
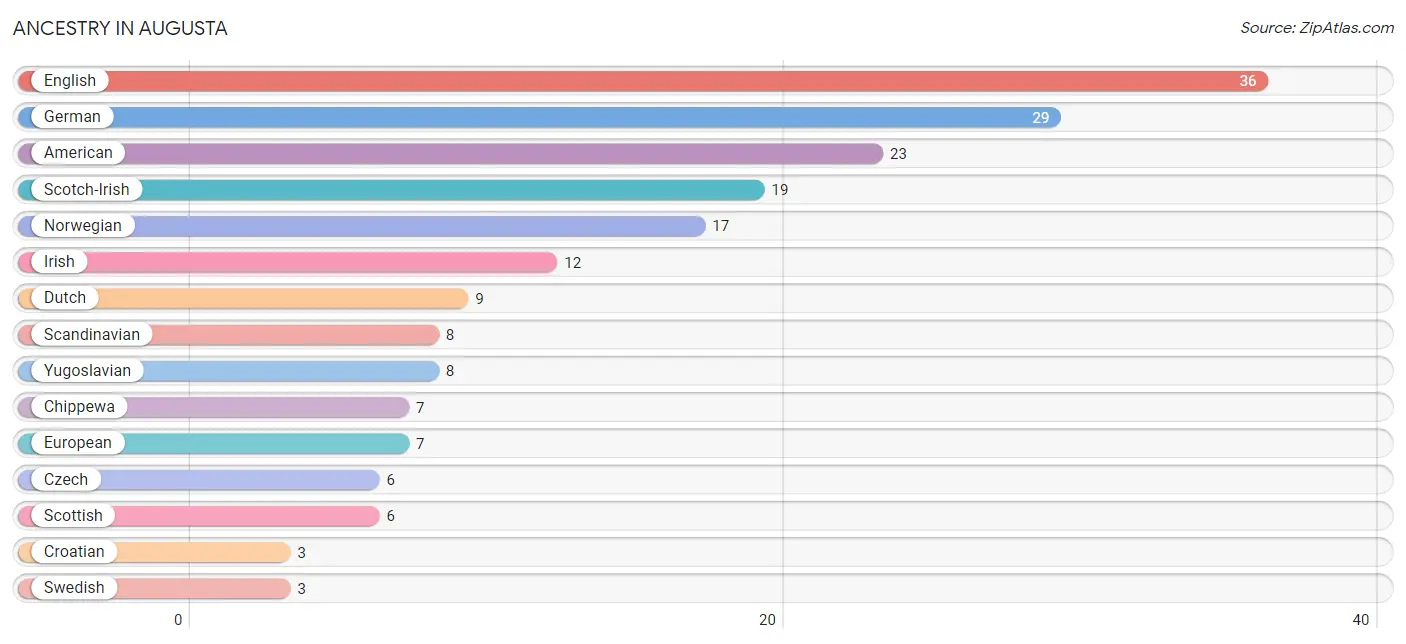
| Ancestry | # Population | % Population |
| American | 23 | 10.7% |
| Chippewa | 7 | 3.3% |
| Croatian | 3 | 1.4% |
| Czech | 6 | 2.8% |
| Dutch | 9 | 4.2% |
| English | 36 | 16.7% |
| European | 7 | 3.3% |
| German | 29 | 13.5% |
| Irish | 12 | 5.6% |
| Norwegian | 17 | 7.9% |
| Polish | 2 | 0.9% |
| Scandinavian | 8 | 3.7% |
| Scotch-Irish | 19 | 8.8% |
| Scottish | 6 | 2.8% |
| Slovak | 2 | 0.9% |
| Swedish | 3 | 1.4% |
| Yugoslavian | 8 | 3.7% | View All 17 Rows |
Immigrants in Augusta
The most numerous immigrant groups reported in Augusta came from , and Canada (6 | 2.8%), together accounting for 2.8% of all Augusta residents.

| Immigration Origin | # Population | % Population |
| Canada | 6 | 2.8% | View All 1 Rows |
Sex and Age in Augusta
Sex and Age in Augusta
The most populous age groups in Augusta are 65 to 69 Years (26 | 23.4%) for men and 60 to 64 Years (26 | 25.0%) for women.
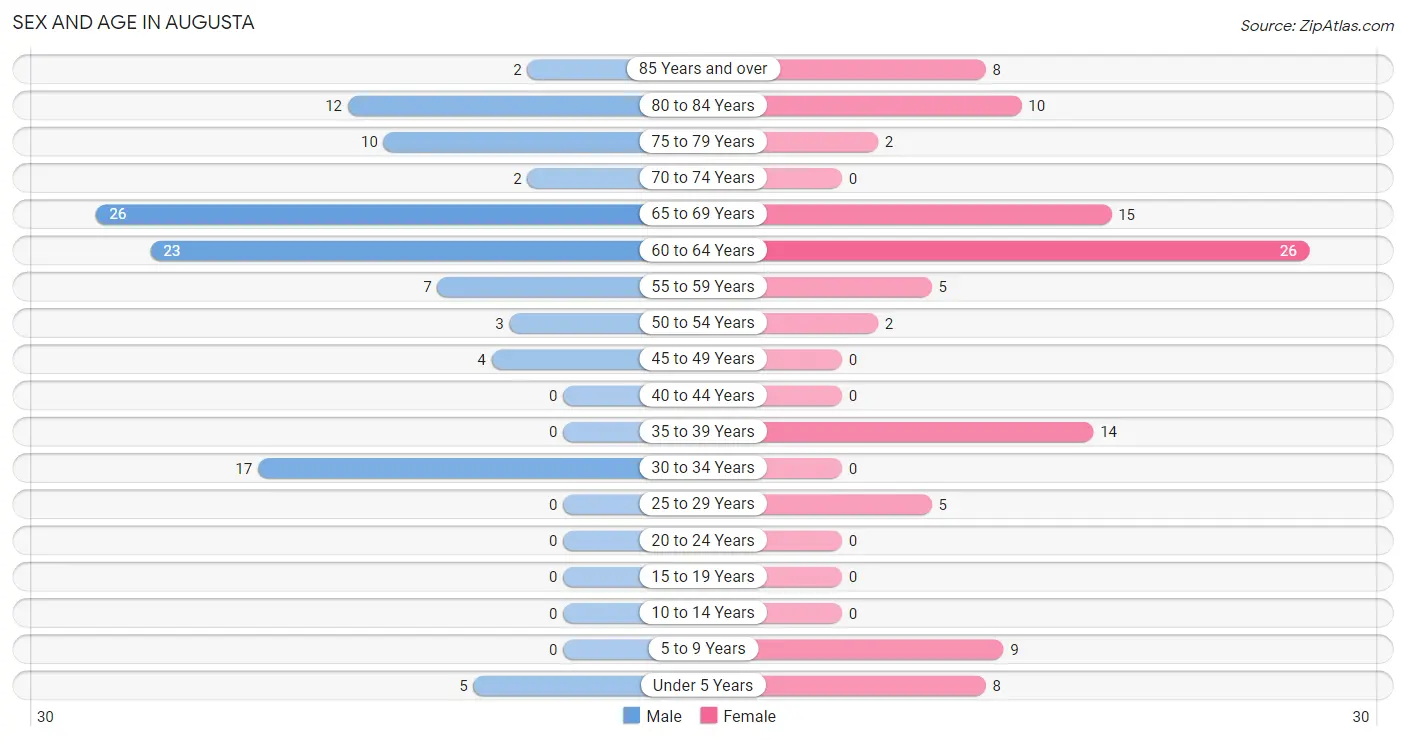
| Age Bracket | Male | Female |
| Under 5 Years | 5 (4.5%) | 8 (7.7%) |
| 5 to 9 Years | 0 (0.0%) | 9 (8.6%) |
| 10 to 14 Years | 0 (0.0%) | 0 (0.0%) |
| 15 to 19 Years | 0 (0.0%) | 0 (0.0%) |
| 20 to 24 Years | 0 (0.0%) | 0 (0.0%) |
| 25 to 29 Years | 0 (0.0%) | 5 (4.8%) |
| 30 to 34 Years | 17 (15.3%) | 0 (0.0%) |
| 35 to 39 Years | 0 (0.0%) | 14 (13.5%) |
| 40 to 44 Years | 0 (0.0%) | 0 (0.0%) |
| 45 to 49 Years | 4 (3.6%) | 0 (0.0%) |
| 50 to 54 Years | 3 (2.7%) | 2 (1.9%) |
| 55 to 59 Years | 7 (6.3%) | 5 (4.8%) |
| 60 to 64 Years | 23 (20.7%) | 26 (25.0%) |
| 65 to 69 Years | 26 (23.4%) | 15 (14.4%) |
| 70 to 74 Years | 2 (1.8%) | 0 (0.0%) |
| 75 to 79 Years | 10 (9.0%) | 2 (1.9%) |
| 80 to 84 Years | 12 (10.8%) | 10 (9.6%) |
| 85 Years and over | 2 (1.8%) | 8 (7.7%) |
| Total | 111 (100.0%) | 104 (100.0%) |
Families and Households in Augusta
Median Family Size in Augusta
The median family size in Augusta is 2.16 persons per family, with single female/mother families (8 | 10.4%) accounting for the largest median family size of 3.13 persons per family. On the other hand, married-couple families (67 | 87.0%) represent the smallest median family size with 2.01 persons per family.
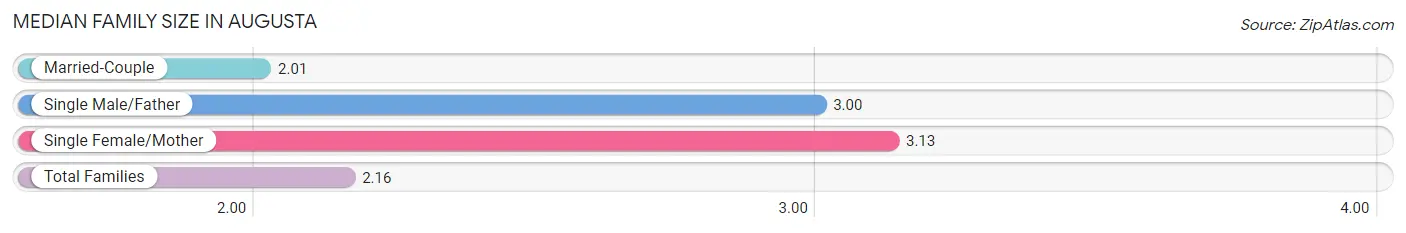
| Family Type | # Families | Family Size |
| Married-Couple | 67 (87.0%) | 2.01 |
| Single Male/Father | 2 (2.6%) | 3.00 |
| Single Female/Mother | 8 (10.4%) | 3.13 |
| Total Families | 77 (100.0%) | 2.16 |
Median Household Size in Augusta
The median household size in Augusta is 1.75 persons per household, with single female/mother households (8 | 6.5%) accounting for the largest median household size of 3.13 persons per household. non-family households (46 | 37.4%) represent the smallest median household size with 1.07 persons per household.
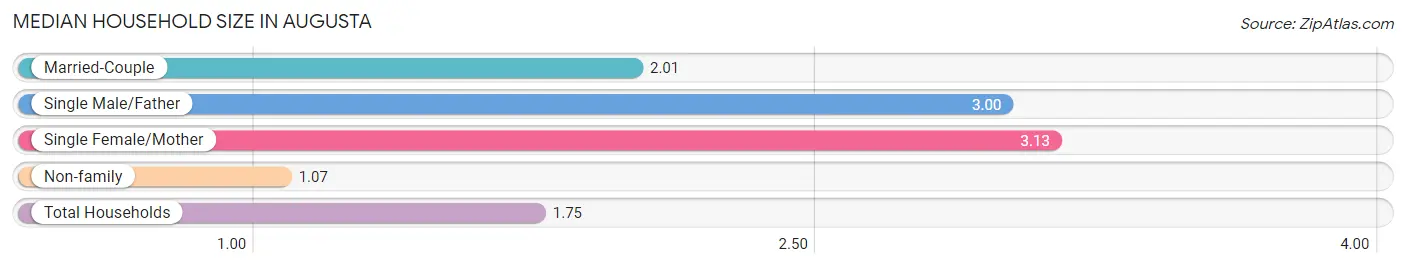
| Household Type | # Households | Household Size |
| Married-Couple | 67 (54.5%) | 2.01 |
| Single Male/Father | 2 (1.6%) | 3.00 |
| Single Female/Mother | 8 (6.5%) | 3.13 |
| Non-family | 46 (37.4%) | 1.07 |
| Total Households | 123 (100.0%) | 1.75 |
Household Size by Marriage Status in Augusta
Out of a total of 123 households in Augusta, 77 (62.6%) are family households, while 46 (37.4%) are nonfamily households. The most numerous type of family households are 2-person households, comprising 64, and the most common type of nonfamily households are 1-person households, comprising 43.
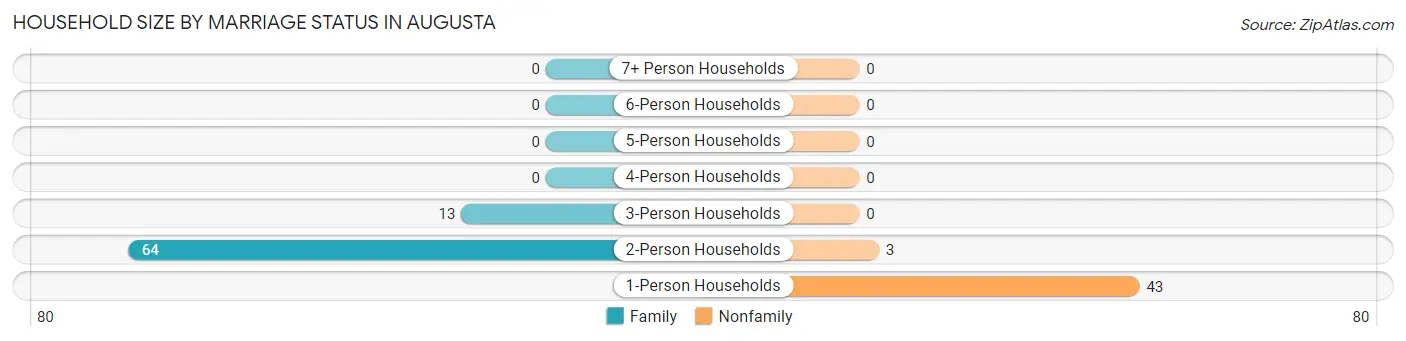
| Household Size | Family Households | Nonfamily Households |
| 1-Person Households | - | 43 (35.0%) |
| 2-Person Households | 64 (52.0%) | 3 (2.4%) |
| 3-Person Households | 13 (10.6%) | 0 (0.0%) |
| 4-Person Households | 0 (0.0%) | 0 (0.0%) |
| 5-Person Households | 0 (0.0%) | 0 (0.0%) |
| 6-Person Households | 0 (0.0%) | 0 (0.0%) |
| 7+ Person Households | 0 (0.0%) | 0 (0.0%) |
| Total | 77 (62.6%) | 46 (37.4%) |
Female Fertility in Augusta
Fertility by Age in Augusta
Average fertility rate in Augusta is 263.0 births per 1,000 women. Women in the age bracket of 20 to 34 years have the highest fertility rate with 1,000.0 births per 1,000 women. Women in the age bracket of 20 to 34 years acount for 100.0% of all women with births.
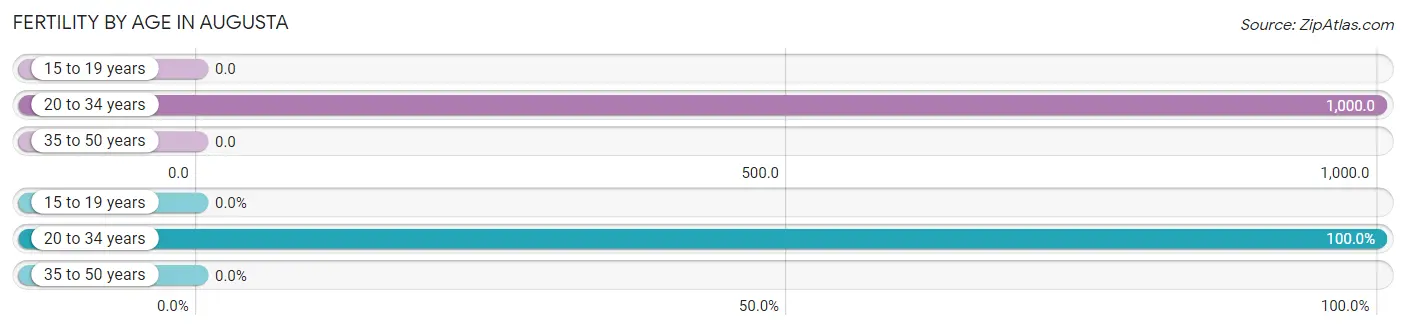
| Age Bracket | Women with Births | Births / 1,000 Women |
| 15 to 19 years | 0 (0.0%) | 0.0 |
| 20 to 34 years | 5 (100.0%) | 1,000.0 |
| 35 to 50 years | 0 (0.0%) | 0.0 |
| Total | 5 (100.0%) | 263.0 |
Fertility by Age by Marriage Status in Augusta
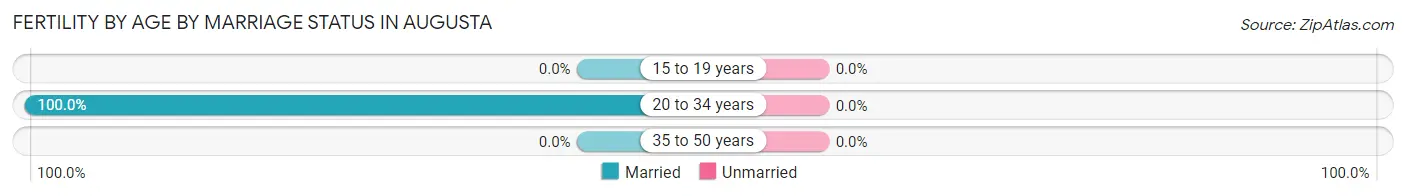
| Age Bracket | Married | Unmarried |
| 15 to 19 years | 0 (0.0%) | 0 (0.0%) |
| 20 to 34 years | 5 (100.0%) | 0 (0.0%) |
| 35 to 50 years | 0 (0.0%) | 0 (0.0%) |
| Total | 5 (100.0%) | 0 (0.0%) |
Fertility by Education in Augusta
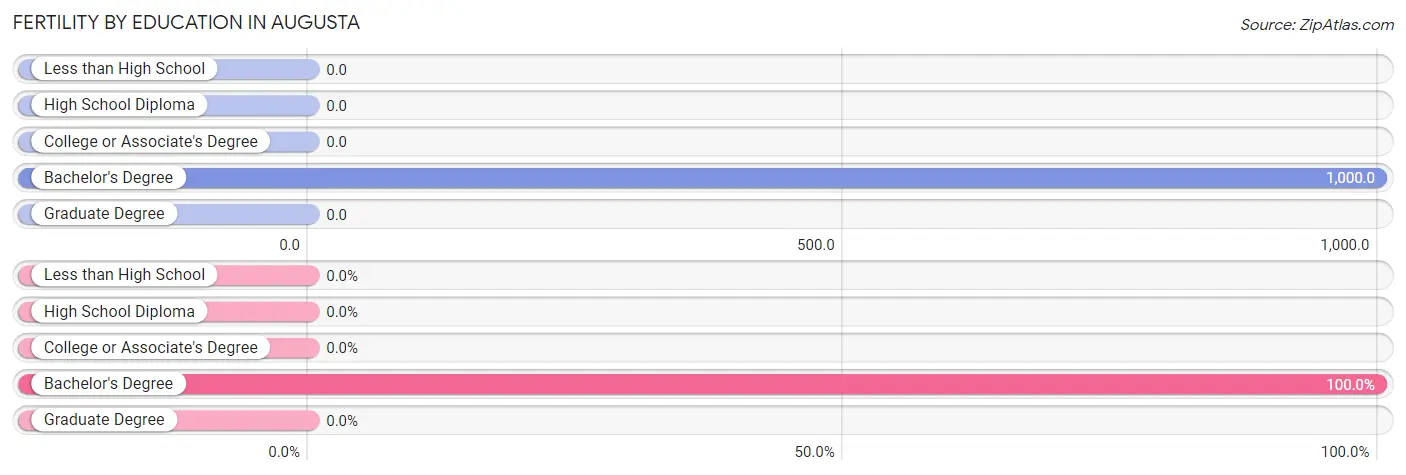
| Educational Attainment | Women with Births | Births / 1,000 Women |
| Less than High School | 0 (0.0%) | 0.0 |
| High School Diploma | 0 (0.0%) | 0.0 |
| College or Associate's Degree | 0 (0.0%) | 0.0 |
| Bachelor's Degree | 5 (100.0%) | 1,000.0 |
| Graduate Degree | 0 (0.0%) | 0.0 |
| Total | 5 (100.0%) | 263.0 |
Fertility by Education by Marriage Status in Augusta
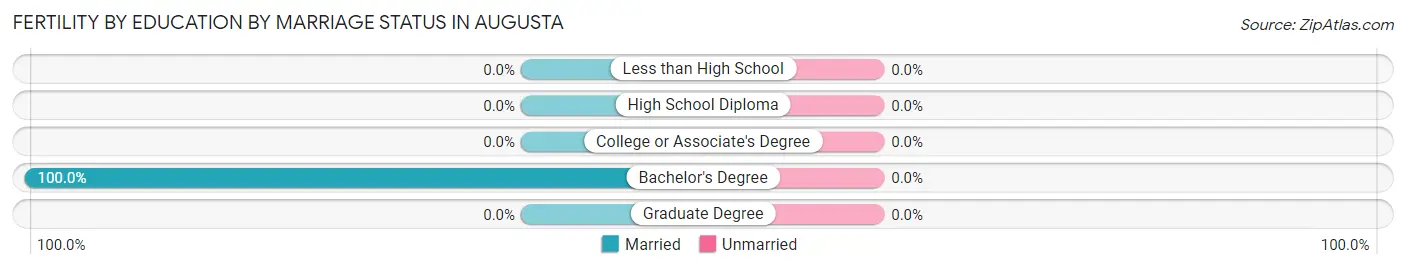
| Educational Attainment | Married | Unmarried |
| Less than High School | 0 (0.0%) | 0 (0.0%) |
| High School Diploma | 0 (0.0%) | 0 (0.0%) |
| College or Associate's Degree | 0 (0.0%) | 0 (0.0%) |
| Bachelor's Degree | 5 (100.0%) | 0 (0.0%) |
| Graduate Degree | 0 (0.0%) | 0 (0.0%) |
| Total | 5 (100.0%) | 0 (0.0%) |
Employment Characteristics in Augusta
Employment by Class of Employer in Augusta
Among the 81 employed individuals in Augusta, private company employees (31 | 38.3%), local government employees (19 | 23.5%), and not-for-profit organizations (12 | 14.8%) make up the most common classes of employment.
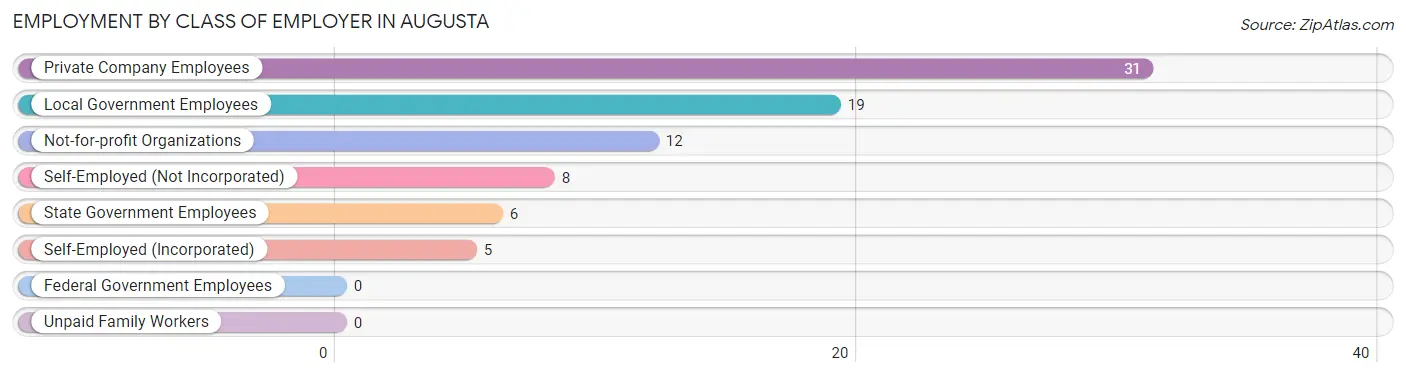
| Employer Class | # Employees | % Employees |
| Private Company Employees | 31 | 38.3% |
| Self-Employed (Incorporated) | 5 | 6.2% |
| Self-Employed (Not Incorporated) | 8 | 9.9% |
| Not-for-profit Organizations | 12 | 14.8% |
| Local Government Employees | 19 | 23.5% |
| State Government Employees | 6 | 7.4% |
| Federal Government Employees | 0 | 0.0% |
| Unpaid Family Workers | 0 | 0.0% |
| Total | 81 | 100.0% |
Employment Status by Age in Augusta
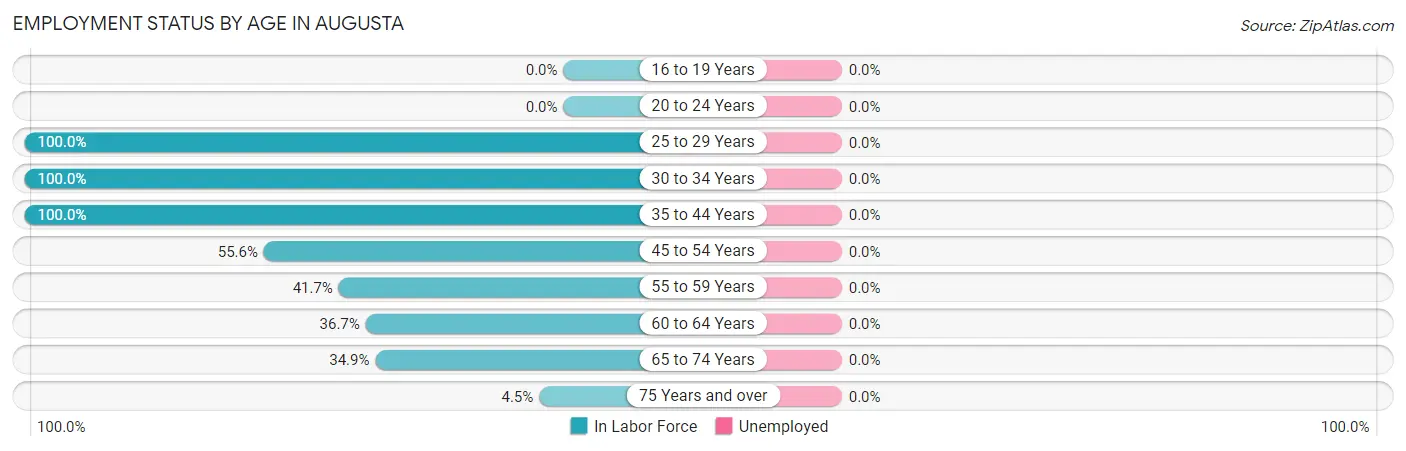
| Age Bracket | In Labor Force | Unemployed |
| 16 to 19 Years | 0 (0.0%) | 0 (0.0%) |
| 20 to 24 Years | 0 (0.0%) | 0 (0.0%) |
| 25 to 29 Years | 5 (100.0%) | 0 (0.0%) |
| 30 to 34 Years | 17 (100.0%) | 0 (0.0%) |
| 35 to 44 Years | 14 (100.0%) | 0 (0.0%) |
| 45 to 54 Years | 5 (55.6%) | 0 (0.0%) |
| 55 to 59 Years | 5 (41.7%) | 0 (0.0%) |
| 60 to 64 Years | 18 (36.7%) | 0 (0.0%) |
| 65 to 74 Years | 15 (34.9%) | 0 (0.0%) |
| 75 Years and over | 2 (4.5%) | 0 (0.0%) |
| Total | 81 (42.0%) | 0 (0.0%) |
Employment Status by Educational Attainment in Augusta
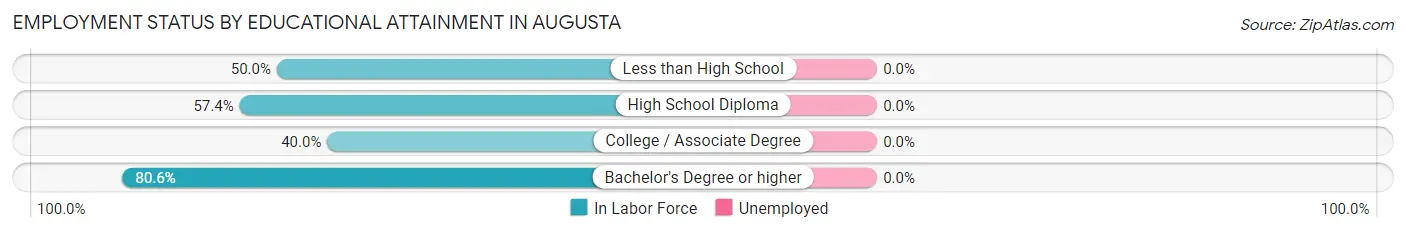
| Educational Attainment | In Labor Force | Unemployed |
| Less than High School | 4 (50.0%) | 0 (0.0%) |
| High School Diploma | 27 (57.4%) | 0 (0.0%) |
| College / Associate Degree | 8 (40.0%) | 0 (0.0%) |
| Bachelor's Degree or higher | 25 (80.6%) | 0 (0.0%) |
| Total | 64 (60.4%) | 0 (0.0%) |
Employment Occupations by Sex in Augusta
Management, Business, Science and Arts Occupations
The most common Management, Business, Science and Arts occupations in Augusta are Community & Social Service (16 | 19.8%), Education Instruction & Library (8 | 9.9%), Education, Arts & Media (6 | 7.4%), and Arts, Media & Entertainment (2 | 2.5%).
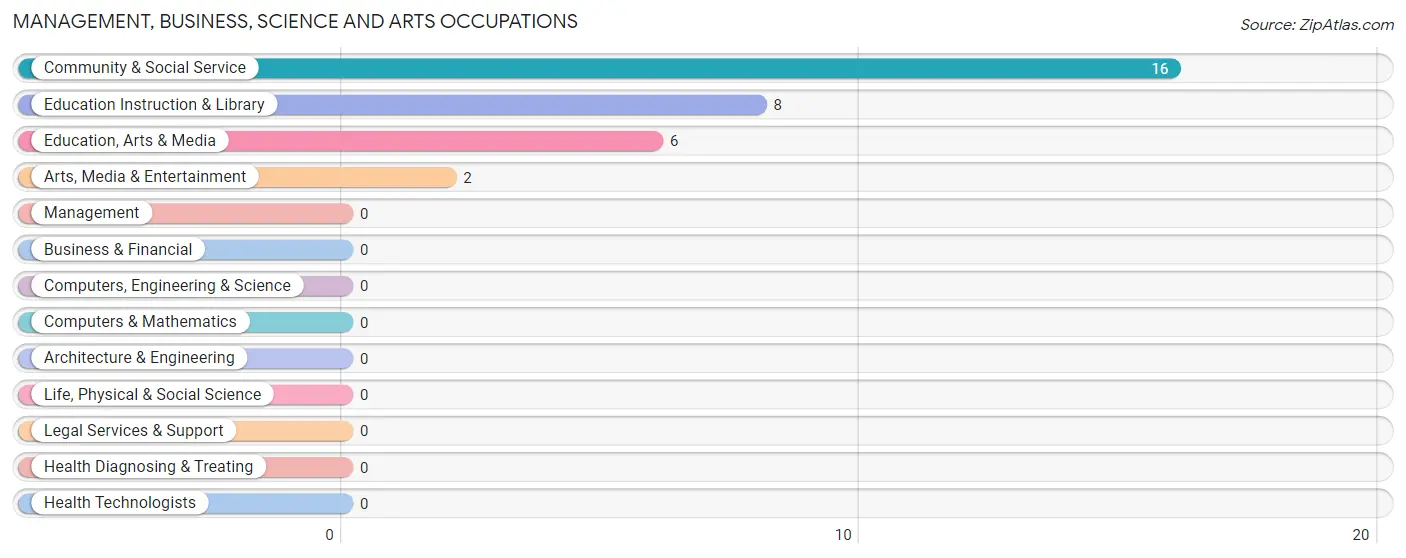
Management, Business, Science and Arts Occupations by Sex
Within the Management, Business, Science and Arts occupations in Augusta, the most male-oriented occupations are Education, Arts & Media (100.0%), Arts, Media & Entertainment (100.0%), and Community & Social Service (50.0%), while the most female-oriented occupations are Education Instruction & Library (100.0%), and Community & Social Service (50.0%).
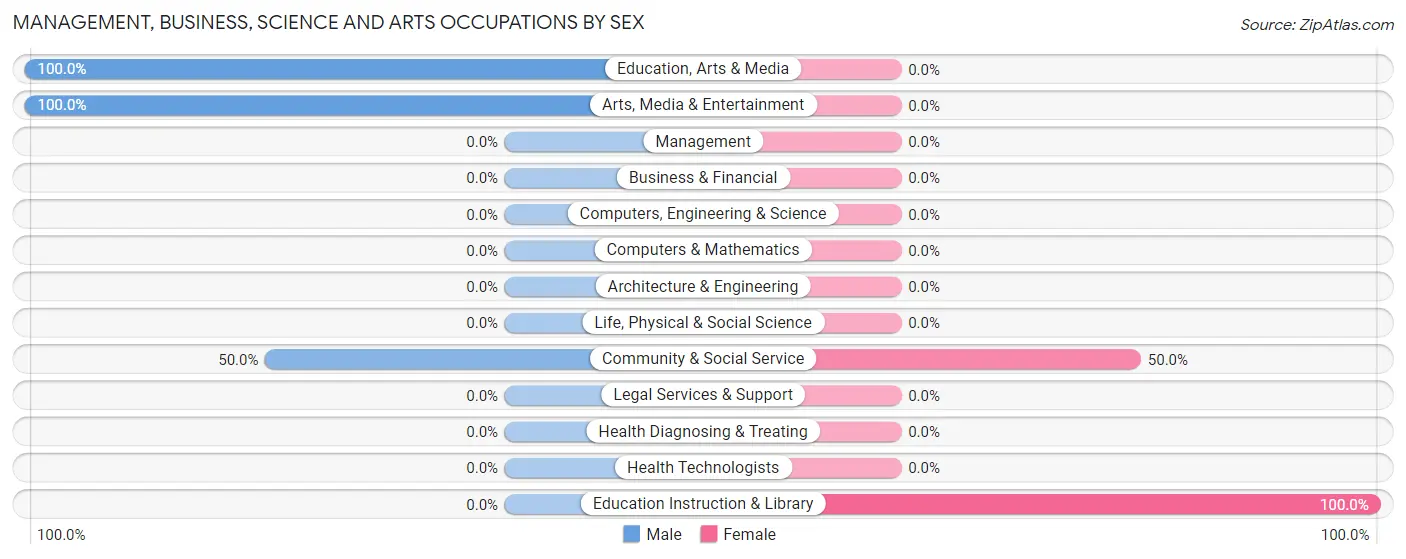
| Occupation | Male | Female |
| Management | 0 (0.0%) | 0 (0.0%) |
| Business & Financial | 0 (0.0%) | 0 (0.0%) |
| Computers, Engineering & Science | 0 (0.0%) | 0 (0.0%) |
| Computers & Mathematics | 0 (0.0%) | 0 (0.0%) |
| Architecture & Engineering | 0 (0.0%) | 0 (0.0%) |
| Life, Physical & Social Science | 0 (0.0%) | 0 (0.0%) |
| Community & Social Service | 8 (50.0%) | 8 (50.0%) |
| Education, Arts & Media | 6 (100.0%) | 0 (0.0%) |
| Legal Services & Support | 0 (0.0%) | 0 (0.0%) |
| Education Instruction & Library | 0 (0.0%) | 8 (100.0%) |
| Arts, Media & Entertainment | 2 (100.0%) | 0 (0.0%) |
| Health Diagnosing & Treating | 0 (0.0%) | 0 (0.0%) |
| Health Technologists | 0 (0.0%) | 0 (0.0%) |
| Total (Category) | 8 (50.0%) | 8 (50.0%) |
| Total (Overall) | 49 (60.5%) | 32 (39.5%) |
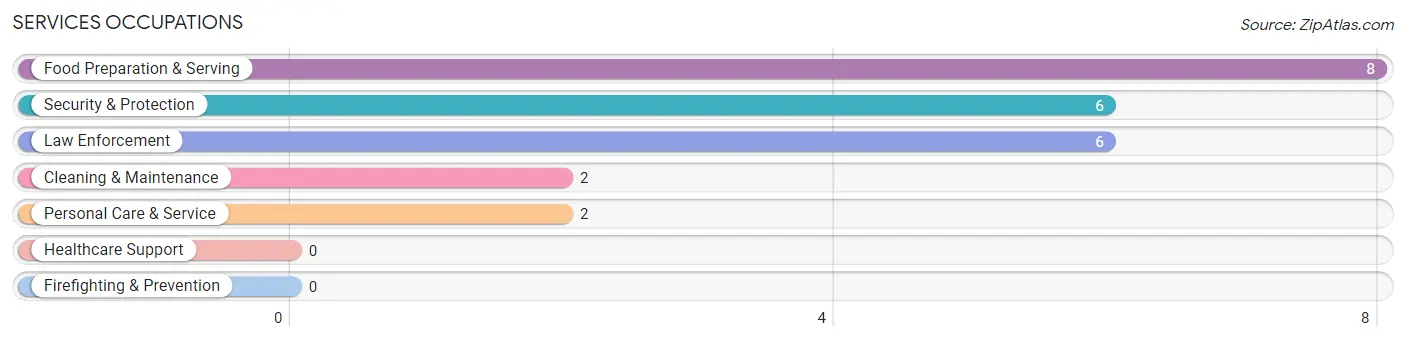
Services Occupations
The most common Services occupations in Augusta are Food Preparation & Serving (8 | 9.9%), Security & Protection (6 | 7.4%), Law Enforcement (6 | 7.4%), Cleaning & Maintenance (2 | 2.5%), and Personal Care & Service (2 | 2.5%).
Services Occupations by Sex
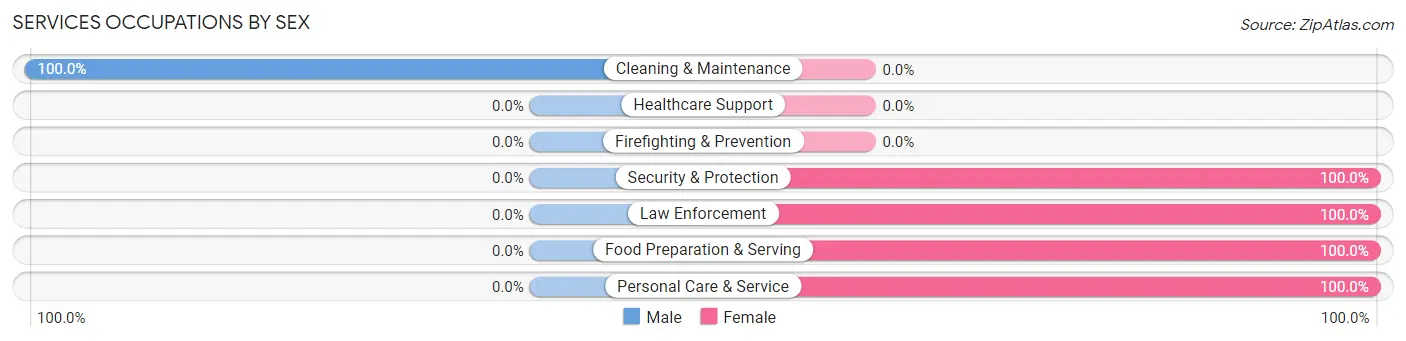
| Occupation | Male | Female |
| Healthcare Support | 0 (0.0%) | 0 (0.0%) |
| Security & Protection | 0 (0.0%) | 6 (100.0%) |
| Firefighting & Prevention | 0 (0.0%) | 0 (0.0%) |
| Law Enforcement | 0 (0.0%) | 6 (100.0%) |
| Food Preparation & Serving | 0 (0.0%) | 8 (100.0%) |
| Cleaning & Maintenance | 2 (100.0%) | 0 (0.0%) |
| Personal Care & Service | 0 (0.0%) | 2 (100.0%) |
| Total (Category) | 2 (11.1%) | 16 (88.9%) |
| Total (Overall) | 49 (60.5%) | 32 (39.5%) |
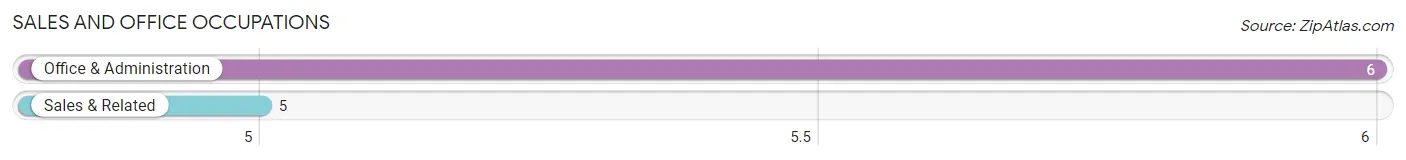
Sales and Office Occupations
The most common Sales and Office occupations in Augusta are Office & Administration (6 | 7.4%), and Sales & Related (5 | 6.2%).
Sales and Office Occupations by Sex
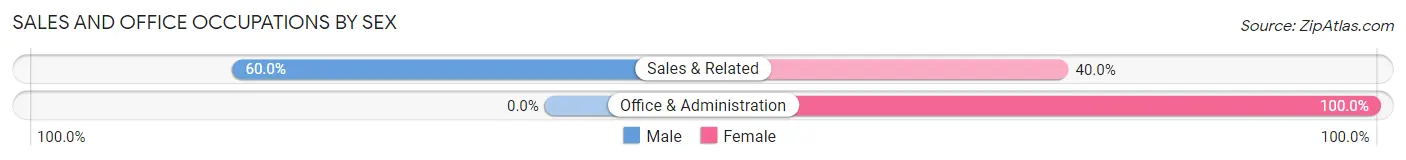
| Occupation | Male | Female |
| Sales & Related | 3 (60.0%) | 2 (40.0%) |
| Office & Administration | 0 (0.0%) | 6 (100.0%) |
| Total (Category) | 3 (27.3%) | 8 (72.7%) |
| Total (Overall) | 49 (60.5%) | 32 (39.5%) |
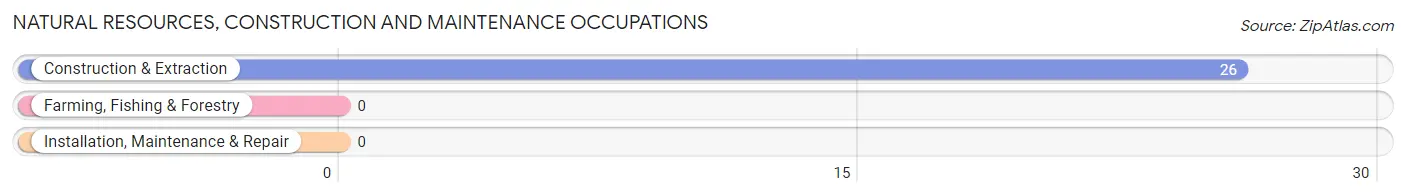
Natural Resources, Construction and Maintenance Occupations
The most common Natural Resources, Construction and Maintenance occupations in Augusta are , and Construction & Extraction (26 | 32.1%).
Natural Resources, Construction and Maintenance Occupations by Sex
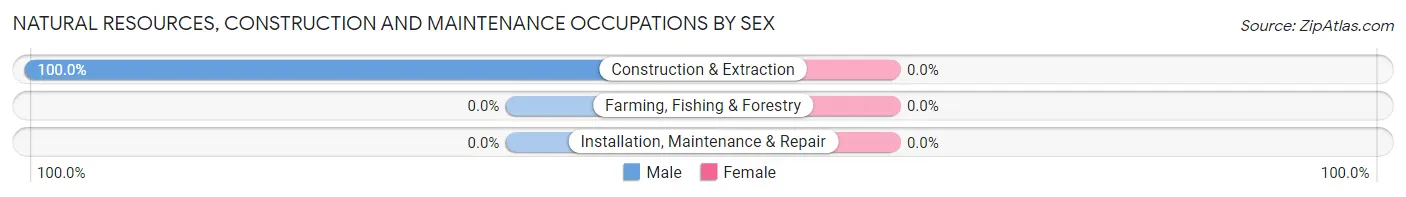
| Occupation | Male | Female |
| Farming, Fishing & Forestry | 0 (0.0%) | 0 (0.0%) |
| Construction & Extraction | 26 (100.0%) | 0 (0.0%) |
| Installation, Maintenance & Repair | 0 (0.0%) | 0 (0.0%) |
| Total (Category) | 26 (100.0%) | 0 (0.0%) |
| Total (Overall) | 49 (60.5%) | 32 (39.5%) |
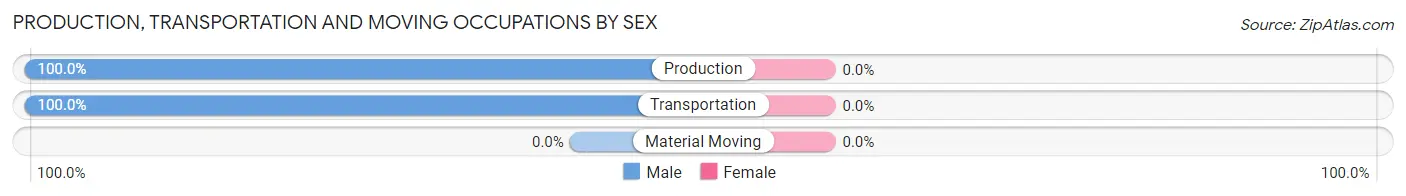
Production, Transportation and Moving Occupations
The most common Production, Transportation and Moving occupations in Augusta are Production (6 | 7.4%), and Transportation (4 | 4.9%).
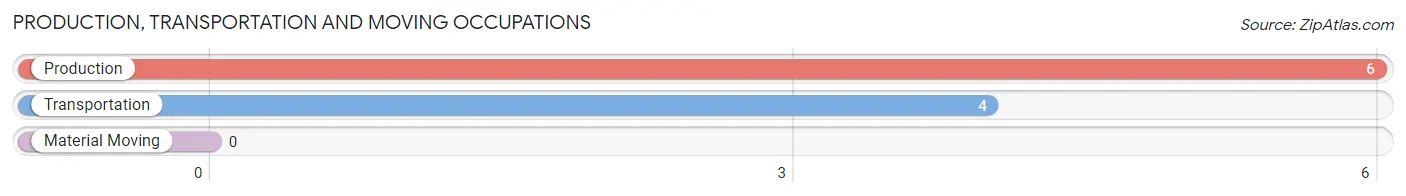
Production, Transportation and Moving Occupations by Sex
| Occupation | Male | Female |
| Production | 6 (100.0%) | 0 (0.0%) |
| Transportation | 4 (100.0%) | 0 (0.0%) |
| Material Moving | 0 (0.0%) | 0 (0.0%) |
| Total (Category) | 10 (100.0%) | 0 (0.0%) |
| Total (Overall) | 49 (60.5%) | 32 (39.5%) |
Employment Industries by Sex in Augusta
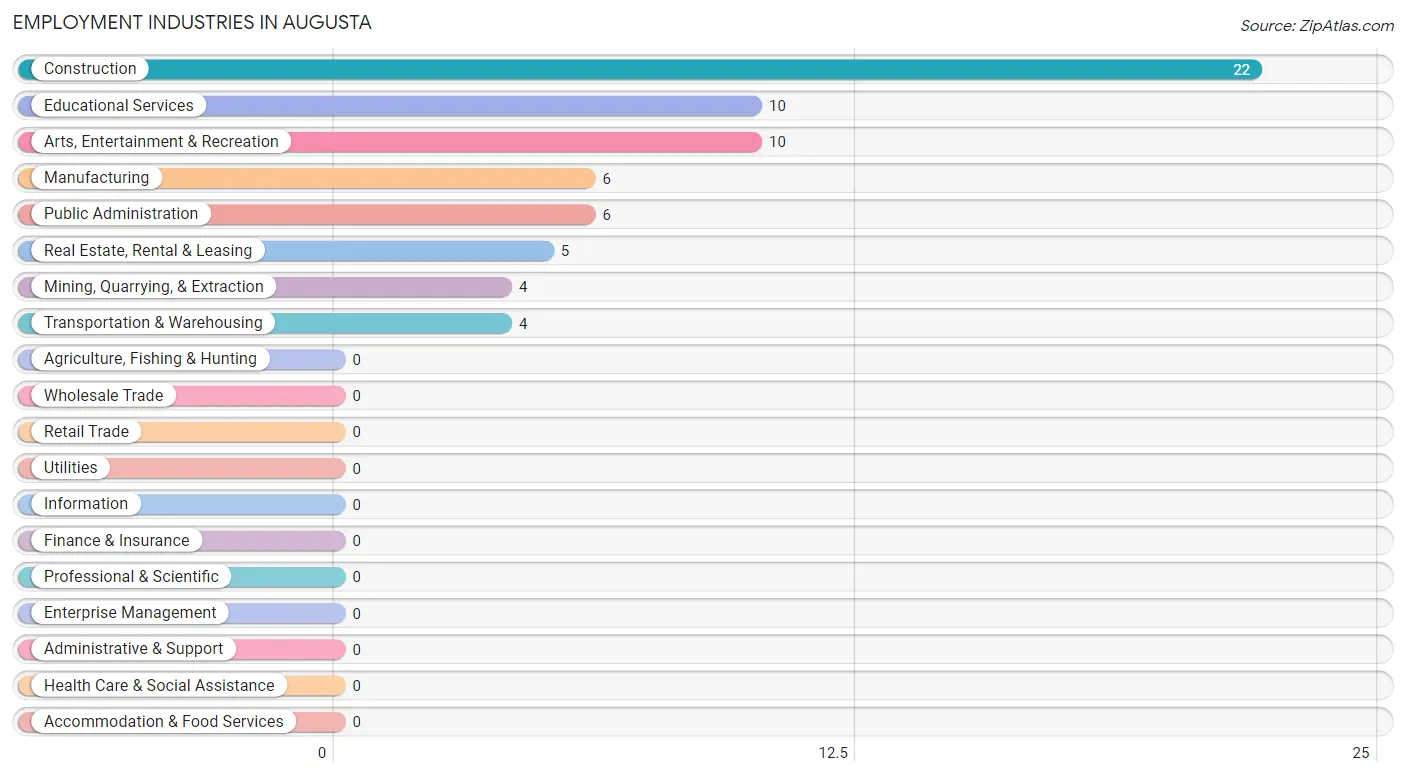
Employment Industries in Augusta
The major employment industries in Augusta include Construction (22 | 27.2%), Educational Services (10 | 12.3%), Arts, Entertainment & Recreation (10 | 12.3%), Manufacturing (6 | 7.4%), and Public Administration (6 | 7.4%).
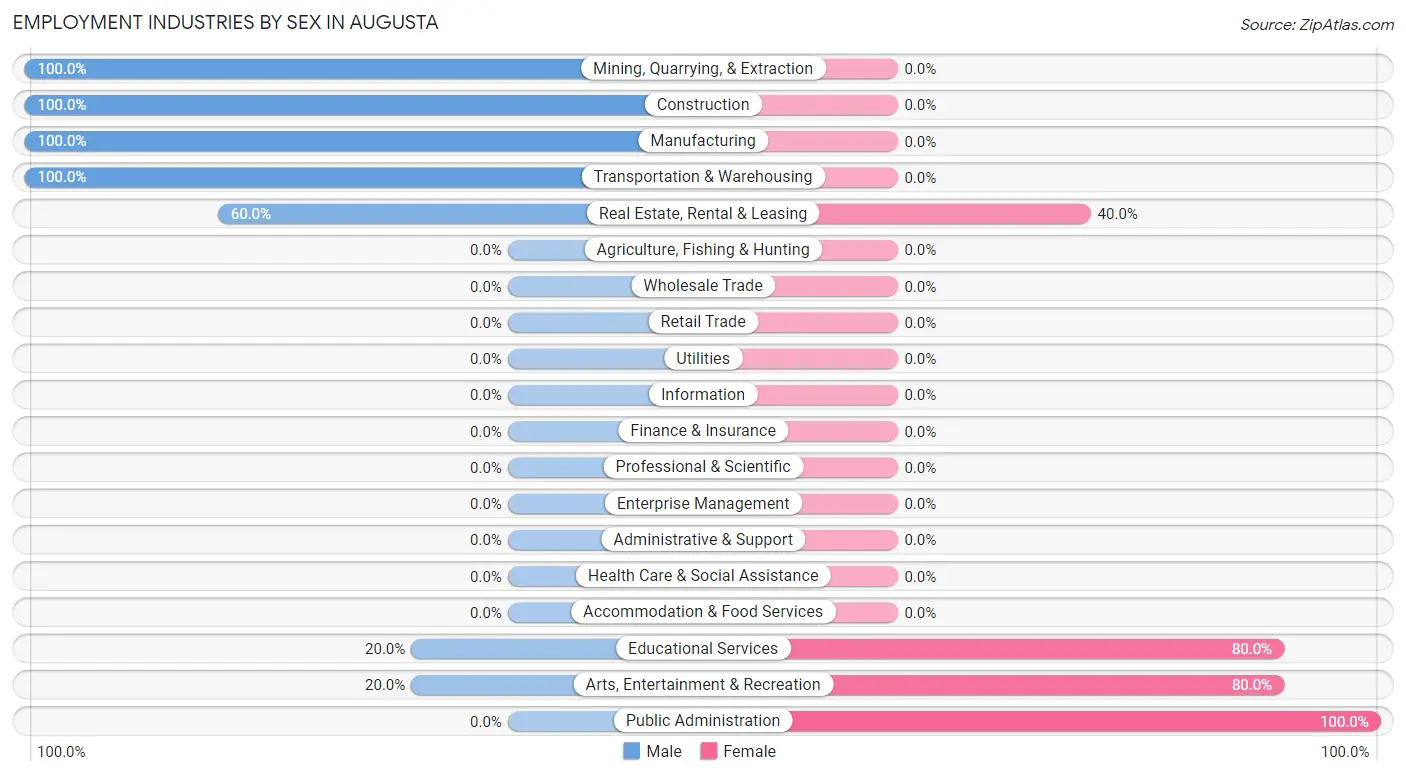
Employment Industries by Sex in Augusta
The Augusta industries that see more men than women are Mining, Quarrying, & Extraction (100.0%), Construction (100.0%), and Manufacturing (100.0%), whereas the industries that tend to have a higher number of women are Public Administration (100.0%), Educational Services (80.0%), and Arts, Entertainment & Recreation (80.0%).
| Industry | Male | Female |
| Agriculture, Fishing & Hunting | 0 (0.0%) | 0 (0.0%) |
| Mining, Quarrying, & Extraction | 4 (100.0%) | 0 (0.0%) |
| Construction | 22 (100.0%) | 0 (0.0%) |
| Manufacturing | 6 (100.0%) | 0 (0.0%) |
| Wholesale Trade | 0 (0.0%) | 0 (0.0%) |
| Retail Trade | 0 (0.0%) | 0 (0.0%) |
| Transportation & Warehousing | 4 (100.0%) | 0 (0.0%) |
| Utilities | 0 (0.0%) | 0 (0.0%) |
| Information | 0 (0.0%) | 0 (0.0%) |
| Finance & Insurance | 0 (0.0%) | 0 (0.0%) |
| Real Estate, Rental & Leasing | 3 (60.0%) | 2 (40.0%) |
| Professional & Scientific | 0 (0.0%) | 0 (0.0%) |
| Enterprise Management | 0 (0.0%) | 0 (0.0%) |
| Administrative & Support | 0 (0.0%) | 0 (0.0%) |
| Educational Services | 2 (20.0%) | 8 (80.0%) |
| Health Care & Social Assistance | 0 (0.0%) | 0 (0.0%) |
| Arts, Entertainment & Recreation | 2 (20.0%) | 8 (80.0%) |
| Accommodation & Food Services | 0 (0.0%) | 0 (0.0%) |
| Public Administration | 0 (0.0%) | 6 (100.0%) |
| Total | 49 (60.5%) | 32 (39.5%) |
Education in Augusta
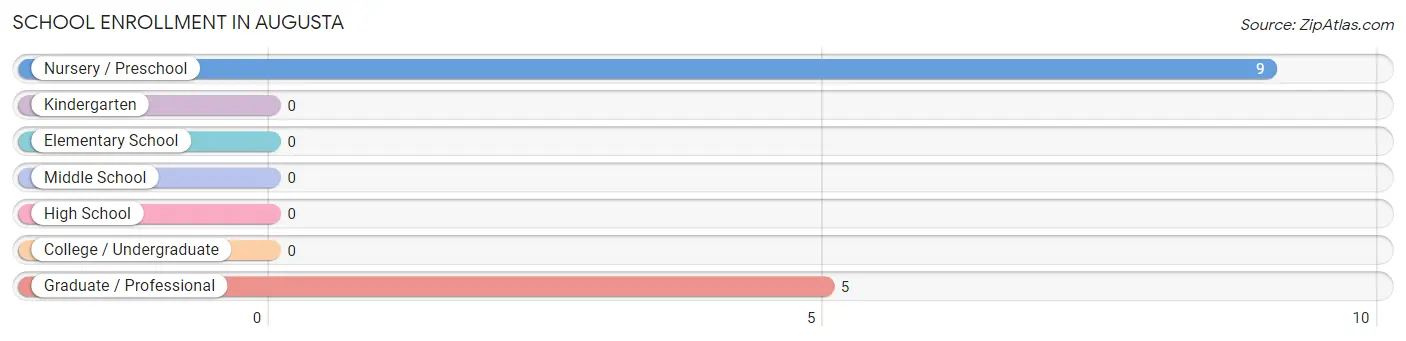
School Enrollment in Augusta
The most common levels of schooling among the 14 students in Augusta are nursery / preschool (9 | 64.3%), and graduate / professional (5 | 35.7%).
| School Level | # Students | % Students |
| Nursery / Preschool | 9 | 64.3% |
| Kindergarten | 0 | 0.0% |
| Elementary School | 0 | 0.0% |
| Middle School | 0 | 0.0% |
| High School | 0 | 0.0% |
| College / Undergraduate | 0 | 0.0% |
| Graduate / Professional | 5 | 35.7% |
| Total | 14 | 100.0% |
School Enrollment by Age by Funding Source in Augusta
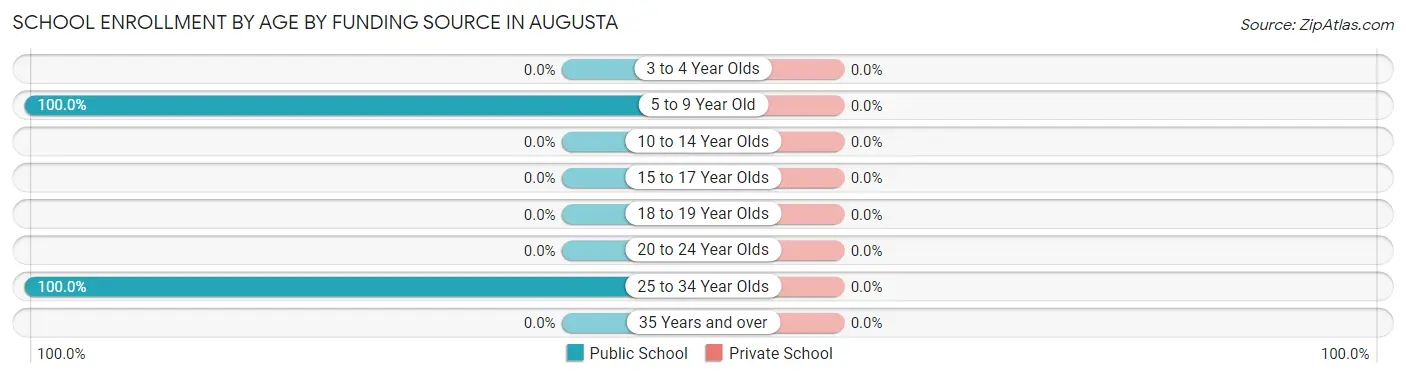
| Age Bracket | Public School | Private School |
| 3 to 4 Year Olds | 0 (0.0%) | 0 (0.0%) |
| 5 to 9 Year Old | 9 (100.0%) | 0 (0.0%) |
| 10 to 14 Year Olds | 0 (0.0%) | 0 (0.0%) |
| 15 to 17 Year Olds | 0 (0.0%) | 0 (0.0%) |
| 18 to 19 Year Olds | 0 (0.0%) | 0 (0.0%) |
| 20 to 24 Year Olds | 0 (0.0%) | 0 (0.0%) |
| 25 to 34 Year Olds | 5 (100.0%) | 0 (0.0%) |
| 35 Years and over | 0 (0.0%) | 0 (0.0%) |
| Total | 14 (100.0%) | 0 (0.0%) |
Educational Attainment by Field of Study in Augusta
Education (30 | 65.2%), psychology (6 | 13.0%), business (6 | 13.0%), bio, nature & agricultural (2 | 4.3%), and liberal arts & history (2 | 4.3%) are the most common fields of study among 46 individuals in Augusta who have obtained a bachelor's degree or higher.
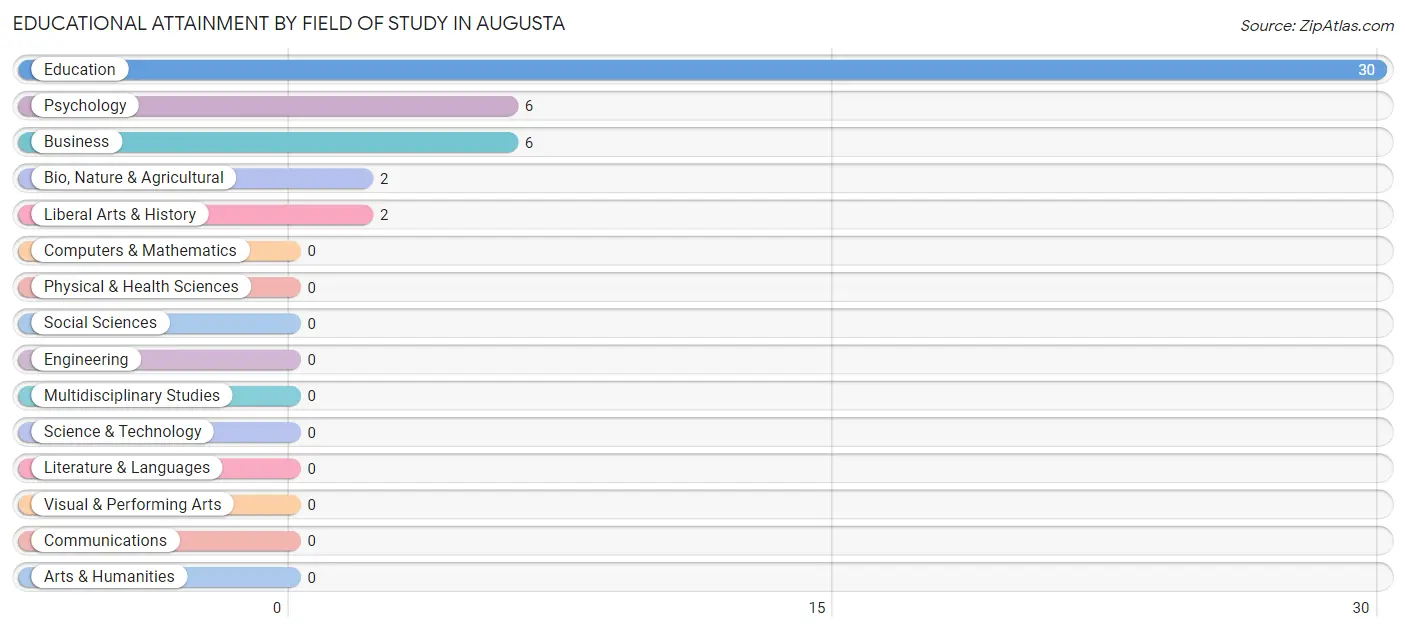
| Field of Study | # Graduates | % Graduates |
| Computers & Mathematics | 0 | 0.0% |
| Bio, Nature & Agricultural | 2 | 4.3% |
| Physical & Health Sciences | 0 | 0.0% |
| Psychology | 6 | 13.0% |
| Social Sciences | 0 | 0.0% |
| Engineering | 0 | 0.0% |
| Multidisciplinary Studies | 0 | 0.0% |
| Science & Technology | 0 | 0.0% |
| Business | 6 | 13.0% |
| Education | 30 | 65.2% |
| Literature & Languages | 0 | 0.0% |
| Liberal Arts & History | 2 | 4.3% |
| Visual & Performing Arts | 0 | 0.0% |
| Communications | 0 | 0.0% |
| Arts & Humanities | 0 | 0.0% |
| Total | 46 | 100.0% |
Transportation & Commute in Augusta
Vehicle Availability by Sex in Augusta
The most prevalent vehicle ownership categories in Augusta are males with 2 vehicles (23, accounting for 46.9%) and females with 2 vehicles (17, making up 71.9%).
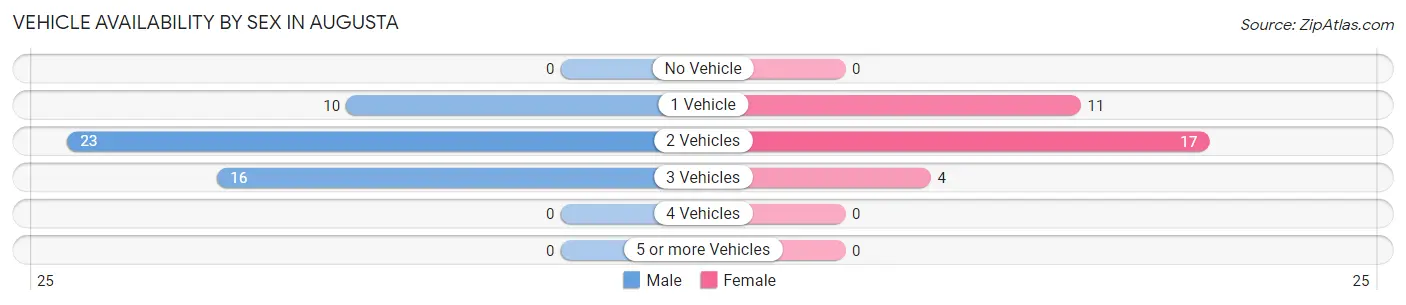
| Vehicles Available | Male | Female |
| No Vehicle | 0 (0.0%) | 0 (0.0%) |
| 1 Vehicle | 10 (20.4%) | 11 (34.4%) |
| 2 Vehicles | 23 (46.9%) | 17 (53.1%) |
| 3 Vehicles | 16 (32.7%) | 4 (12.5%) |
| 4 Vehicles | 0 (0.0%) | 0 (0.0%) |
| 5 or more Vehicles | 0 (0.0%) | 0 (0.0%) |
| Total | 49 (100.0%) | 32 (100.0%) |
Commute Time in Augusta
The most frequently occuring commute durations in Augusta are 5 to 9 minutes (32 commuters, 42.7%), less than 5 minutes (29 commuters, 38.7%), and 30 to 34 minutes (6 commuters, 8.0%).
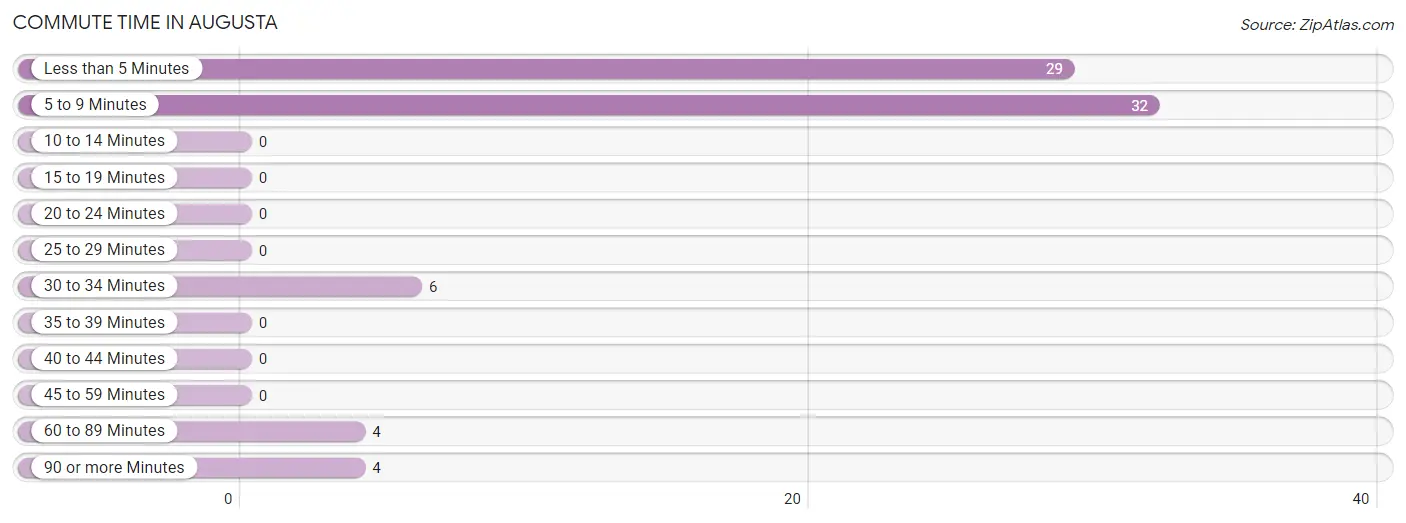
| Commute Time | # Commuters | % Commuters |
| Less than 5 Minutes | 29 | 38.7% |
| 5 to 9 Minutes | 32 | 42.7% |
| 10 to 14 Minutes | 0 | 0.0% |
| 15 to 19 Minutes | 0 | 0.0% |
| 20 to 24 Minutes | 0 | 0.0% |
| 25 to 29 Minutes | 0 | 0.0% |
| 30 to 34 Minutes | 6 | 8.0% |
| 35 to 39 Minutes | 0 | 0.0% |
| 40 to 44 Minutes | 0 | 0.0% |
| 45 to 59 Minutes | 0 | 0.0% |
| 60 to 89 Minutes | 4 | 5.3% |
| 90 or more Minutes | 4 | 5.3% |
Commute Time by Sex in Augusta
The most common commute times in Augusta are 5 to 9 minutes (24 commuters, 55.8%) for males and less than 5 minutes (18 commuters, 56.2%) for females.
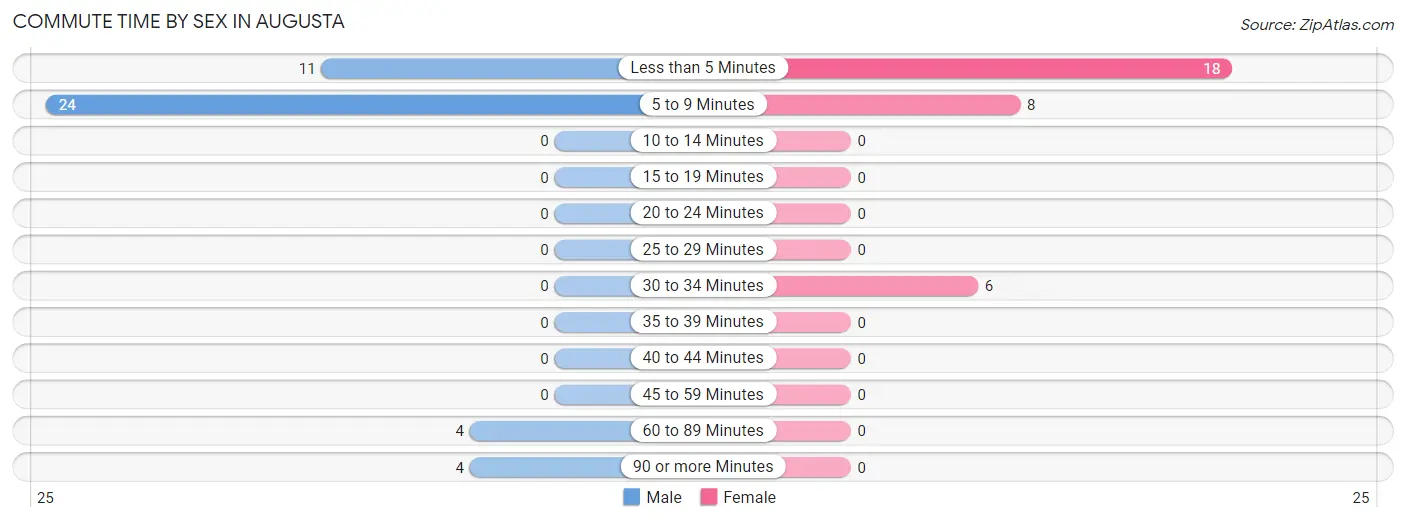
| Commute Time | Male | Female |
| Less than 5 Minutes | 11 (25.6%) | 18 (56.2%) |
| 5 to 9 Minutes | 24 (55.8%) | 8 (25.0%) |
| 10 to 14 Minutes | 0 (0.0%) | 0 (0.0%) |
| 15 to 19 Minutes | 0 (0.0%) | 0 (0.0%) |
| 20 to 24 Minutes | 0 (0.0%) | 0 (0.0%) |
| 25 to 29 Minutes | 0 (0.0%) | 0 (0.0%) |
| 30 to 34 Minutes | 0 (0.0%) | 6 (18.8%) |
| 35 to 39 Minutes | 0 (0.0%) | 0 (0.0%) |
| 40 to 44 Minutes | 0 (0.0%) | 0 (0.0%) |
| 45 to 59 Minutes | 0 (0.0%) | 0 (0.0%) |
| 60 to 89 Minutes | 4 (9.3%) | 0 (0.0%) |
| 90 or more Minutes | 4 (9.3%) | 0 (0.0%) |
Time of Departure to Work by Sex in Augusta
The most frequent times of departure to work in Augusta are 10:00 AM to 10:59 AM (13, 30.2%) for males and 8:00 AM to 8:29 AM (16, 50.0%) for females.
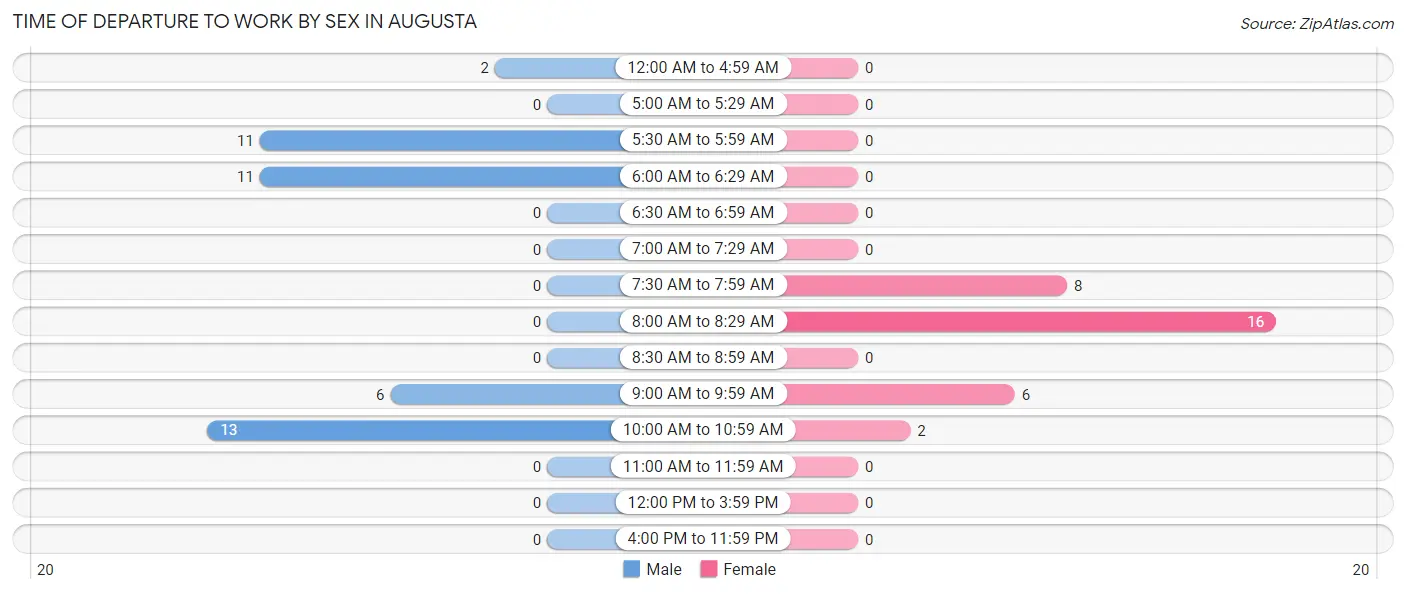
| Time of Departure | Male | Female |
| 12:00 AM to 4:59 AM | 2 (4.6%) | 0 (0.0%) |
| 5:00 AM to 5:29 AM | 0 (0.0%) | 0 (0.0%) |
| 5:30 AM to 5:59 AM | 11 (25.6%) | 0 (0.0%) |
| 6:00 AM to 6:29 AM | 11 (25.6%) | 0 (0.0%) |
| 6:30 AM to 6:59 AM | 0 (0.0%) | 0 (0.0%) |
| 7:00 AM to 7:29 AM | 0 (0.0%) | 0 (0.0%) |
| 7:30 AM to 7:59 AM | 0 (0.0%) | 8 (25.0%) |
| 8:00 AM to 8:29 AM | 0 (0.0%) | 16 (50.0%) |
| 8:30 AM to 8:59 AM | 0 (0.0%) | 0 (0.0%) |
| 9:00 AM to 9:59 AM | 6 (14.0%) | 6 (18.8%) |
| 10:00 AM to 10:59 AM | 13 (30.2%) | 2 (6.2%) |
| 11:00 AM to 11:59 AM | 0 (0.0%) | 0 (0.0%) |
| 12:00 PM to 3:59 PM | 0 (0.0%) | 0 (0.0%) |
| 4:00 PM to 11:59 PM | 0 (0.0%) | 0 (0.0%) |
| Total | 43 (100.0%) | 32 (100.0%) |
Housing Occupancy in Augusta
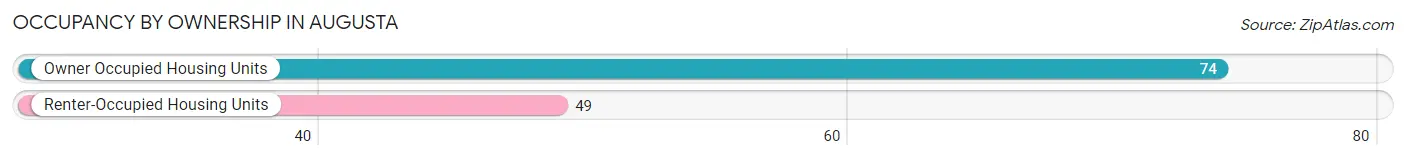
Occupancy by Ownership in Augusta
Of the total 123 dwellings in Augusta, owner-occupied units account for 74 (60.2%), while renter-occupied units make up 49 (39.8%).
| Occupancy | # Housing Units | % Housing Units |
| Owner Occupied Housing Units | 74 | 60.2% |
| Renter-Occupied Housing Units | 49 | 39.8% |
| Total Occupied Housing Units | 123 | 100.0% |
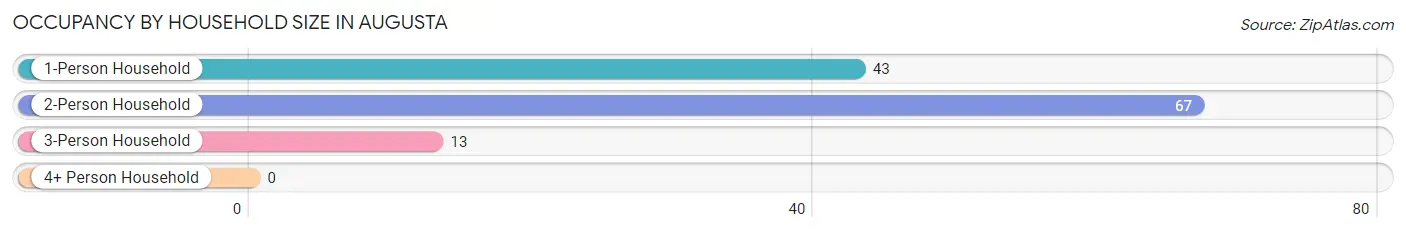
Occupancy by Household Size in Augusta
| Household Size | # Housing Units | % Housing Units |
| 1-Person Household | 43 | 35.0% |
| 2-Person Household | 67 | 54.5% |
| 3-Person Household | 13 | 10.6% |
| 4+ Person Household | 0 | 0.0% |
| Total Housing Units | 123 | 100.0% |
Occupancy by Ownership by Household Size in Augusta
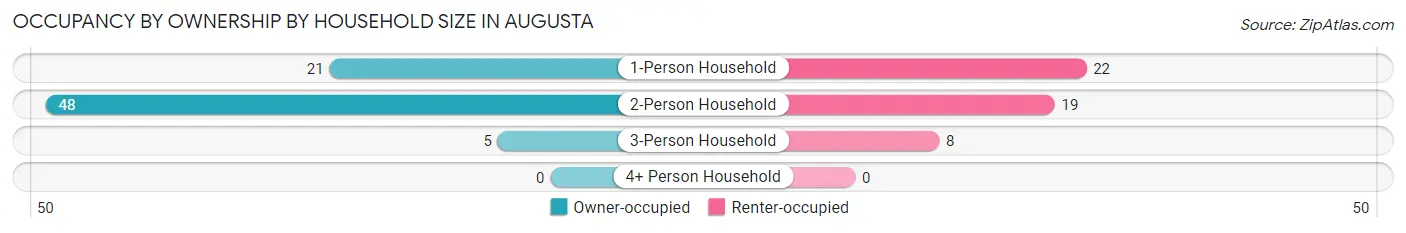
| Household Size | Owner-occupied | Renter-occupied |
| 1-Person Household | 21 (48.8%) | 22 (51.2%) |
| 2-Person Household | 48 (71.6%) | 19 (28.4%) |
| 3-Person Household | 5 (38.5%) | 8 (61.5%) |
| 4+ Person Household | 0 (0.0%) | 0 (0.0%) |
| Total Housing Units | 74 (60.2%) | 49 (39.8%) |
Occupancy by Educational Attainment in Augusta
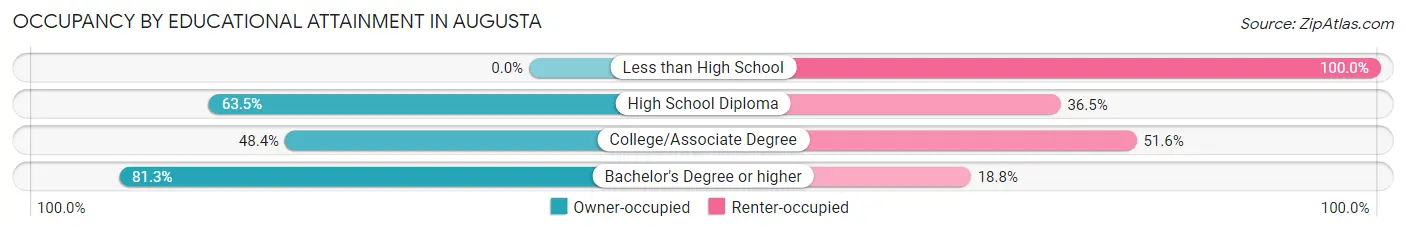
| Household Size | Owner-occupied | Renter-occupied |
| Less than High School | 0 (0.0%) | 8 (100.0%) |
| High School Diploma | 33 (63.5%) | 19 (36.5%) |
| College/Associate Degree | 15 (48.4%) | 16 (51.6%) |
| Bachelor's Degree or higher | 26 (81.2%) | 6 (18.8%) |
Occupancy by Age of Householder in Augusta
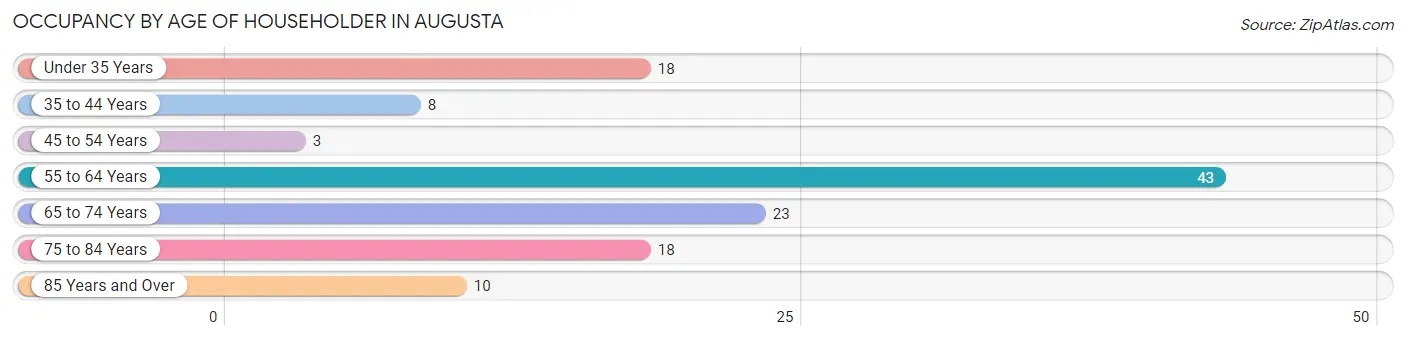
| Age Bracket | # Households | % Households |
| Under 35 Years | 18 | 14.6% |
| 35 to 44 Years | 8 | 6.5% |
| 45 to 54 Years | 3 | 2.4% |
| 55 to 64 Years | 43 | 35.0% |
| 65 to 74 Years | 23 | 18.7% |
| 75 to 84 Years | 18 | 14.6% |
| 85 Years and Over | 10 | 8.1% |
| Total | 123 | 100.0% |
Housing Finances in Augusta
Median Income by Occupancy in Augusta
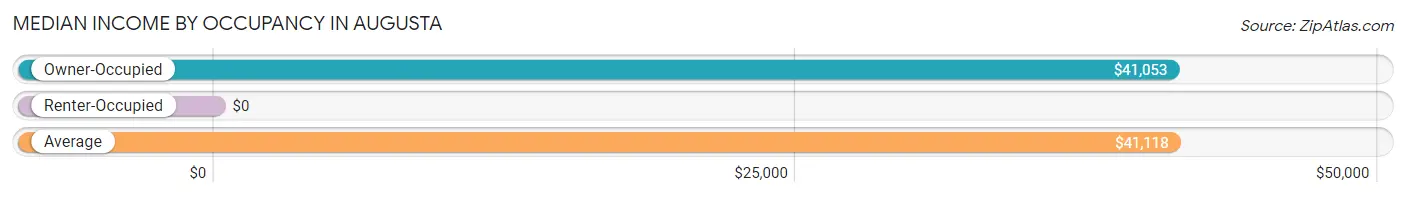
| Occupancy Type | # Households | Median Income |
| Owner-Occupied | 74 (60.2%) | $41,053 |
| Renter-Occupied | 49 (39.8%) | $0 |
| Average | 123 (100.0%) | $41,118 |
Occupancy by Householder Income Bracket in Augusta
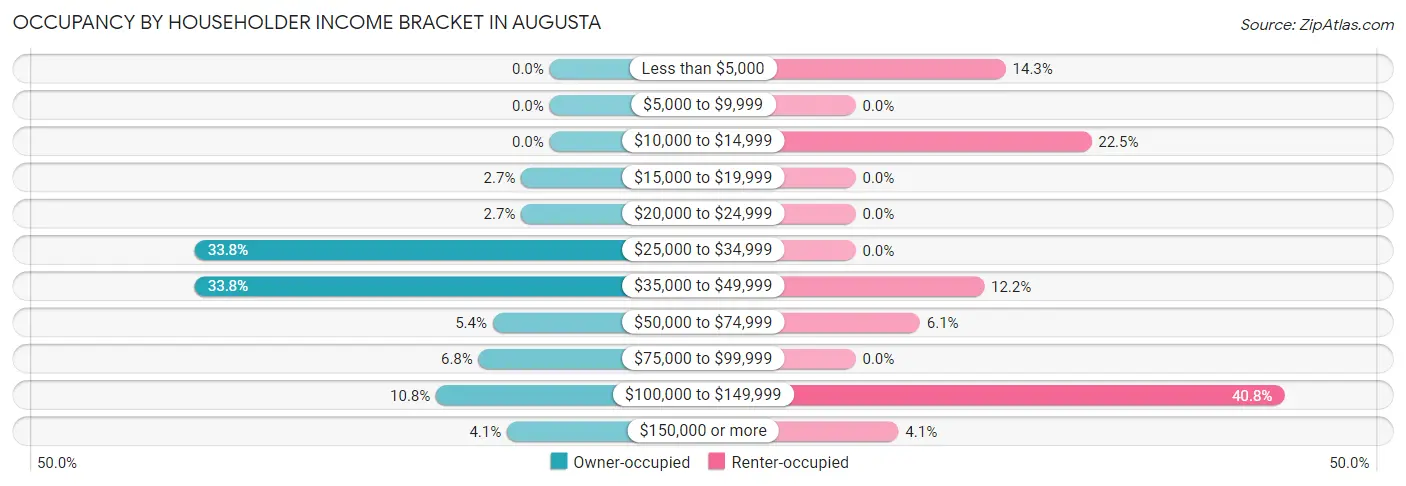
| Income Bracket | Owner-occupied | Renter-occupied |
| Less than $5,000 | 0 (0.0%) | 7 (14.3%) |
| $5,000 to $9,999 | 0 (0.0%) | 0 (0.0%) |
| $10,000 to $14,999 | 0 (0.0%) | 11 (22.5%) |
| $15,000 to $19,999 | 2 (2.7%) | 0 (0.0%) |
| $20,000 to $24,999 | 2 (2.7%) | 0 (0.0%) |
| $25,000 to $34,999 | 25 (33.8%) | 0 (0.0%) |
| $35,000 to $49,999 | 25 (33.8%) | 6 (12.2%) |
| $50,000 to $74,999 | 4 (5.4%) | 3 (6.1%) |
| $75,000 to $99,999 | 5 (6.8%) | 0 (0.0%) |
| $100,000 to $149,999 | 8 (10.8%) | 20 (40.8%) |
| $150,000 or more | 3 (4.1%) | 2 (4.1%) |
| Total | 74 (100.0%) | 49 (100.0%) |
Monthly Housing Cost Tiers in Augusta
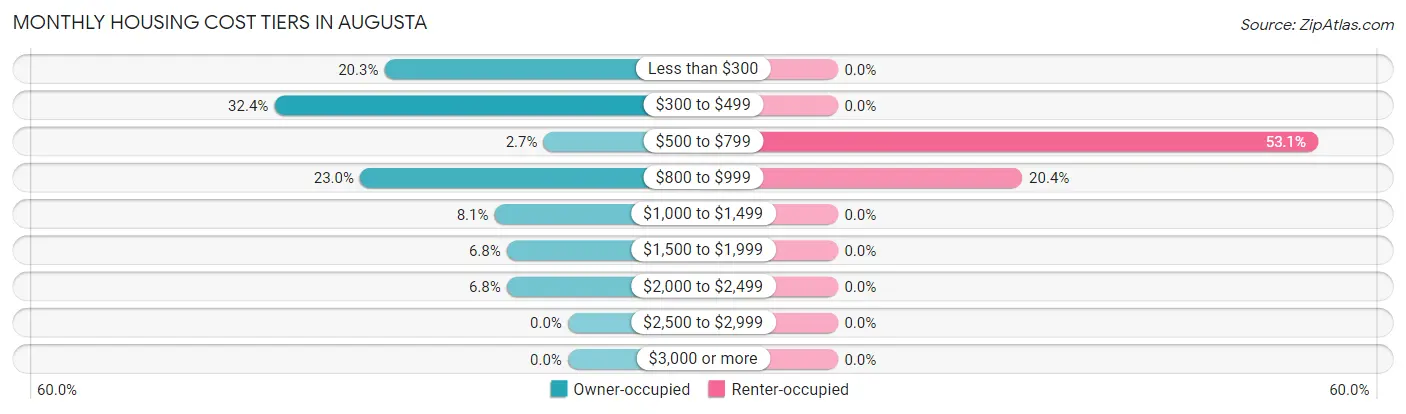
| Monthly Cost | Owner-occupied | Renter-occupied |
| Less than $300 | 15 (20.3%) | 0 (0.0%) |
| $300 to $499 | 24 (32.4%) | 0 (0.0%) |
| $500 to $799 | 2 (2.7%) | 26 (53.1%) |
| $800 to $999 | 17 (23.0%) | 10 (20.4%) |
| $1,000 to $1,499 | 6 (8.1%) | 0 (0.0%) |
| $1,500 to $1,999 | 5 (6.8%) | 0 (0.0%) |
| $2,000 to $2,499 | 5 (6.8%) | 0 (0.0%) |
| $2,500 to $2,999 | 0 (0.0%) | 0 (0.0%) |
| $3,000 or more | 0 (0.0%) | 0 (0.0%) |
| Total | 74 (100.0%) | 49 (100.0%) |
Physical Housing Characteristics in Augusta
Housing Structures in Augusta
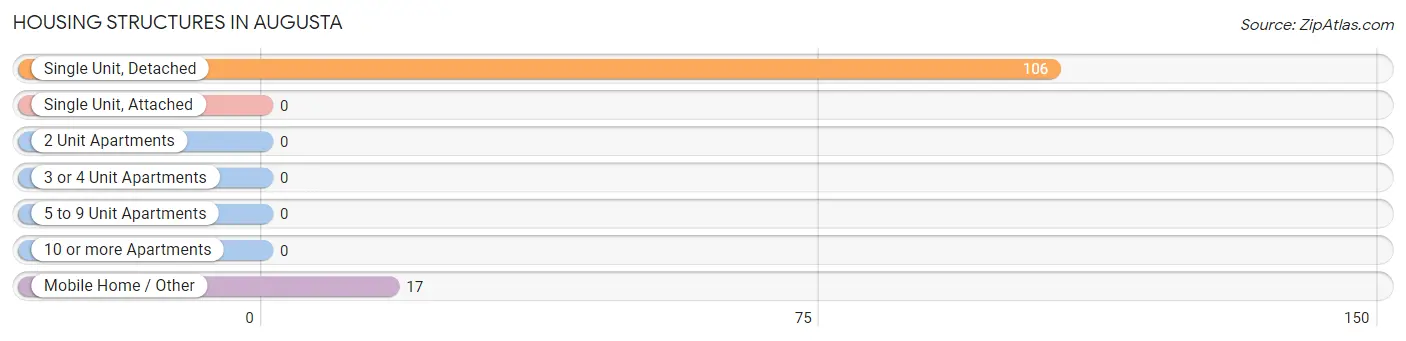
| Structure Type | # Housing Units | % Housing Units |
| Single Unit, Detached | 106 | 86.2% |
| Single Unit, Attached | 0 | 0.0% |
| 2 Unit Apartments | 0 | 0.0% |
| 3 or 4 Unit Apartments | 0 | 0.0% |
| 5 to 9 Unit Apartments | 0 | 0.0% |
| 10 or more Apartments | 0 | 0.0% |
| Mobile Home / Other | 17 | 13.8% |
| Total | 123 | 100.0% |
Housing Structures by Occupancy in Augusta
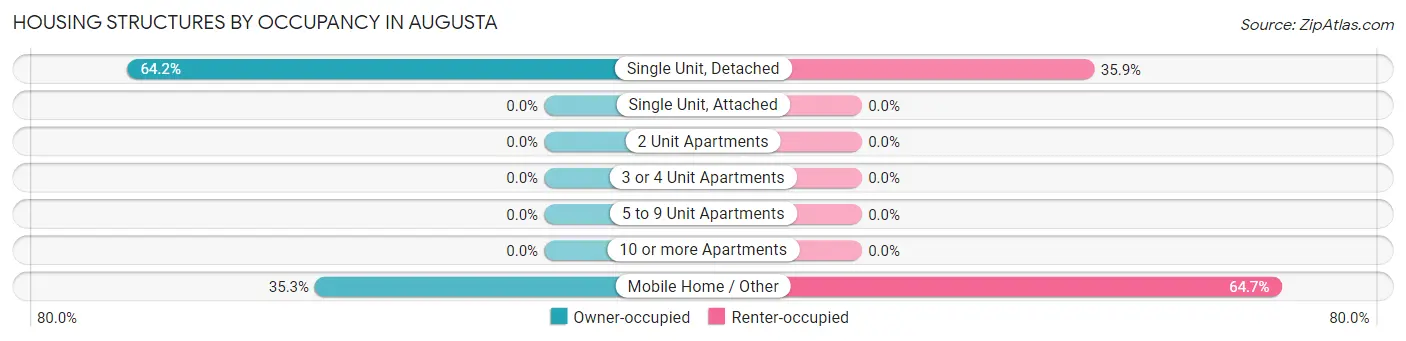
| Structure Type | Owner-occupied | Renter-occupied |
| Single Unit, Detached | 68 (64.1%) | 38 (35.8%) |
| Single Unit, Attached | 0 (0.0%) | 0 (0.0%) |
| 2 Unit Apartments | 0 (0.0%) | 0 (0.0%) |
| 3 or 4 Unit Apartments | 0 (0.0%) | 0 (0.0%) |
| 5 to 9 Unit Apartments | 0 (0.0%) | 0 (0.0%) |
| 10 or more Apartments | 0 (0.0%) | 0 (0.0%) |
| Mobile Home / Other | 6 (35.3%) | 11 (64.7%) |
| Total | 74 (60.2%) | 49 (39.8%) |
Housing Structures by Number of Rooms in Augusta
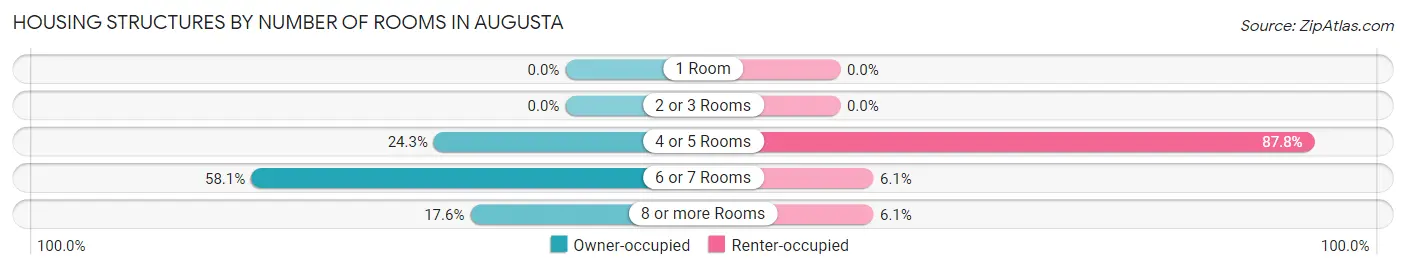
| Number of Rooms | Owner-occupied | Renter-occupied |
| 1 Room | 0 (0.0%) | 0 (0.0%) |
| 2 or 3 Rooms | 0 (0.0%) | 0 (0.0%) |
| 4 or 5 Rooms | 18 (24.3%) | 43 (87.8%) |
| 6 or 7 Rooms | 43 (58.1%) | 3 (6.1%) |
| 8 or more Rooms | 13 (17.6%) | 3 (6.1%) |
| Total | 74 (100.0%) | 49 (100.0%) |
Housing Structure by Heating Type in Augusta
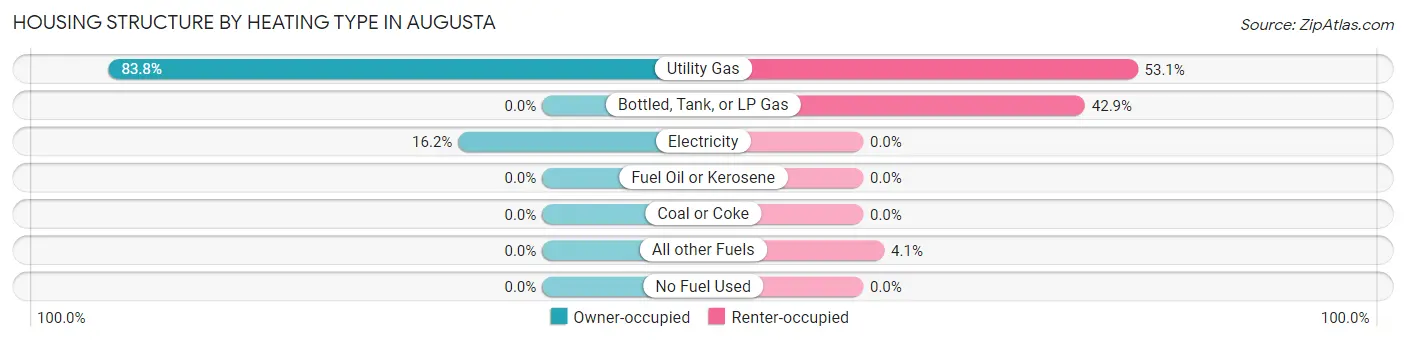
| Heating Type | Owner-occupied | Renter-occupied |
| Utility Gas | 62 (83.8%) | 26 (53.1%) |
| Bottled, Tank, or LP Gas | 0 (0.0%) | 21 (42.9%) |
| Electricity | 12 (16.2%) | 0 (0.0%) |
| Fuel Oil or Kerosene | 0 (0.0%) | 0 (0.0%) |
| Coal or Coke | 0 (0.0%) | 0 (0.0%) |
| All other Fuels | 0 (0.0%) | 2 (4.1%) |
| No Fuel Used | 0 (0.0%) | 0 (0.0%) |
| Total | 74 (100.0%) | 49 (100.0%) |
Household Vehicle Usage in Augusta
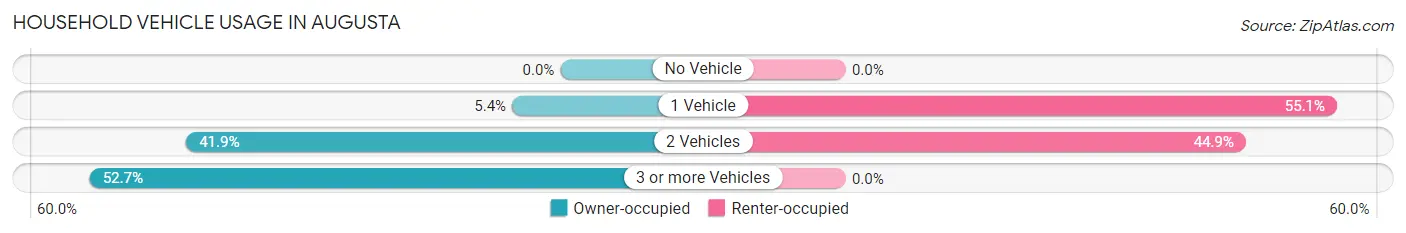
| Vehicles per Household | Owner-occupied | Renter-occupied |
| No Vehicle | 0 (0.0%) | 0 (0.0%) |
| 1 Vehicle | 4 (5.4%) | 27 (55.1%) |
| 2 Vehicles | 31 (41.9%) | 22 (44.9%) |
| 3 or more Vehicles | 39 (52.7%) | 0 (0.0%) |
| Total | 74 (100.0%) | 49 (100.0%) |
Real Estate & Mortgages in Augusta
Real Estate and Mortgage Overview in Augusta
| Characteristic | Without Mortgage | With Mortgage |
| Housing Units | 41 | 33 |
| Median Property Value | $171,900 | $258,300 |
| Median Household Income | $31,250 | $3 |
| Monthly Housing Costs | $331 | $0 |
| Real Estate Taxes | $1,138 | $0 |
Property Value by Mortgage Status in Augusta
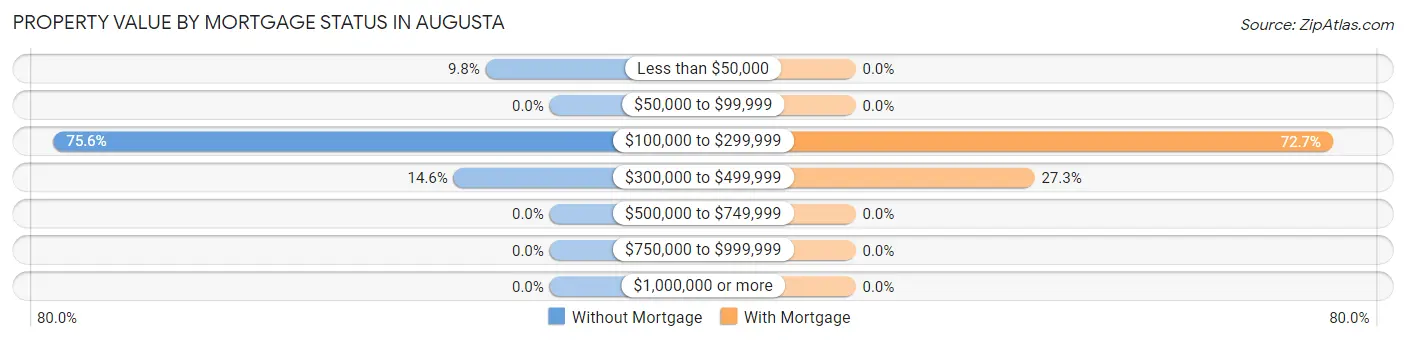
| Property Value | Without Mortgage | With Mortgage |
| Less than $50,000 | 4 (9.8%) | 0 (0.0%) |
| $50,000 to $99,999 | 0 (0.0%) | 0 (0.0%) |
| $100,000 to $299,999 | 31 (75.6%) | 24 (72.7%) |
| $300,000 to $499,999 | 6 (14.6%) | 9 (27.3%) |
| $500,000 to $749,999 | 0 (0.0%) | 0 (0.0%) |
| $750,000 to $999,999 | 0 (0.0%) | 0 (0.0%) |
| $1,000,000 or more | 0 (0.0%) | 0 (0.0%) |
| Total | 41 (100.0%) | 33 (100.0%) |
Household Income by Mortgage Status in Augusta
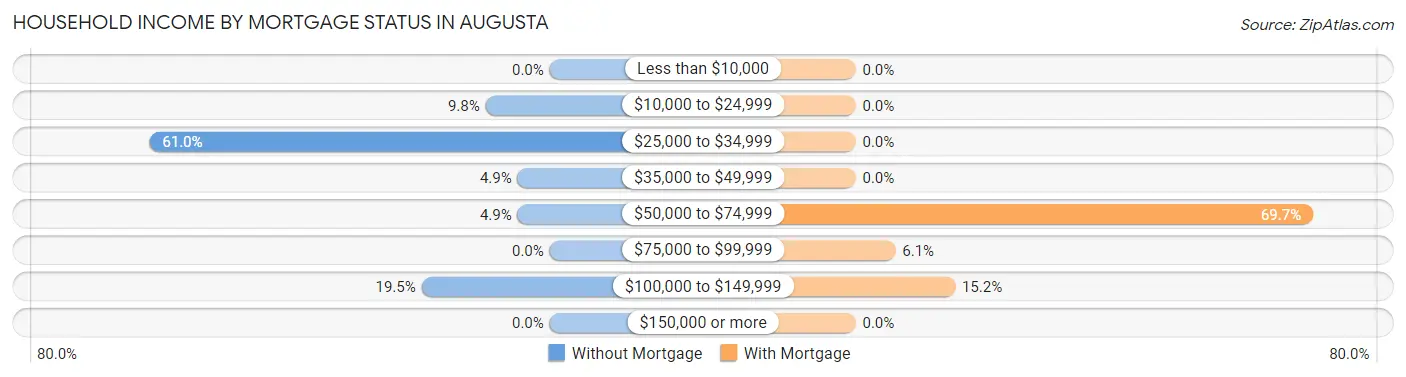
| Household Income | Without Mortgage | With Mortgage |
| Less than $10,000 | 0 (0.0%) | 0 (0.0%) |
| $10,000 to $24,999 | 4 (9.8%) | 0 (0.0%) |
| $25,000 to $34,999 | 25 (61.0%) | 0 (0.0%) |
| $35,000 to $49,999 | 2 (4.9%) | 0 (0.0%) |
| $50,000 to $74,999 | 2 (4.9%) | 23 (69.7%) |
| $75,000 to $99,999 | 0 (0.0%) | 2 (6.1%) |
| $100,000 to $149,999 | 8 (19.5%) | 5 (15.1%) |
| $150,000 or more | 0 (0.0%) | 0 (0.0%) |
| Total | 41 (100.0%) | 33 (100.0%) |
Property Value to Household Income Ratio in Augusta
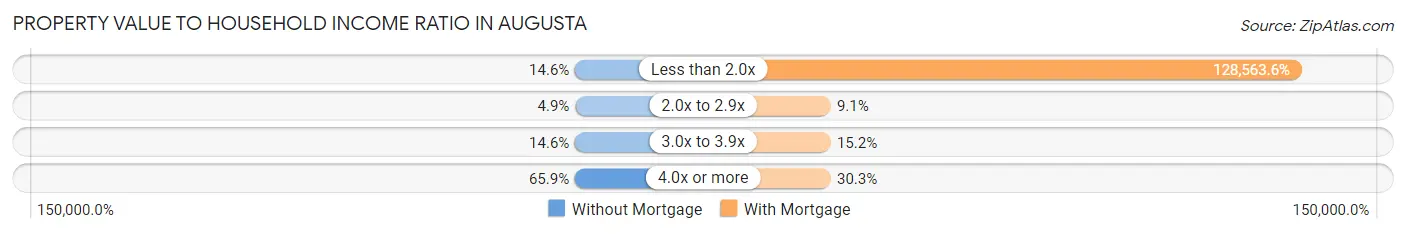
| Value-to-Income Ratio | Without Mortgage | With Mortgage |
| Less than 2.0x | 6 (14.6%) | 42,426 (128,563.6%) |
| 2.0x to 2.9x | 2 (4.9%) | 3 (9.1%) |
| 3.0x to 3.9x | 6 (14.6%) | 5 (15.1%) |
| 4.0x or more | 27 (65.8%) | 10 (30.3%) |
| Total | 41 (100.0%) | 33 (100.0%) |
Real Estate Taxes by Mortgage Status in Augusta
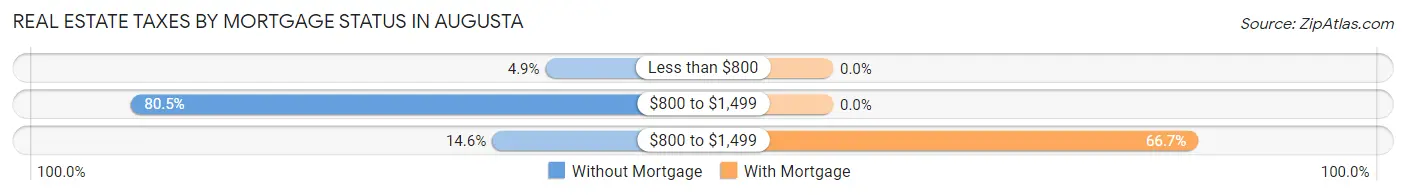
| Property Taxes | Without Mortgage | With Mortgage |
| Less than $800 | 2 (4.9%) | 0 (0.0%) |
| $800 to $1,499 | 33 (80.5%) | 0 (0.0%) |
| $800 to $1,499 | 6 (14.6%) | 22 (66.7%) |
| Total | 41 (100.0%) | 33 (100.0%) |
Health & Disability in Augusta
Health Insurance Coverage by Age in Augusta
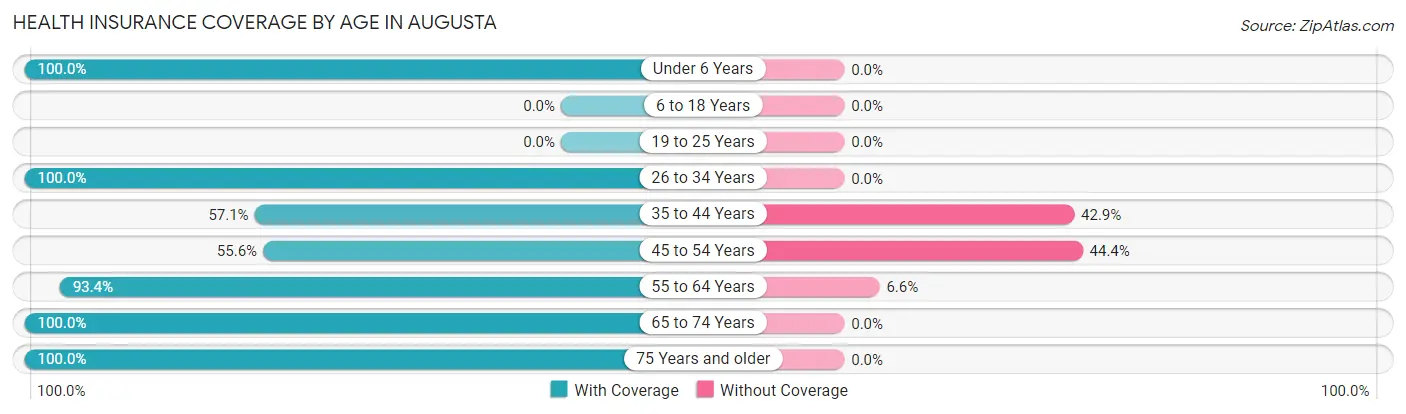
| Age Bracket | With Coverage | Without Coverage |
| Under 6 Years | 22 (100.0%) | 0 (0.0%) |
| 6 to 18 Years | 0 (0.0%) | 0 (0.0%) |
| 19 to 25 Years | 0 (0.0%) | 0 (0.0%) |
| 26 to 34 Years | 22 (100.0%) | 0 (0.0%) |
| 35 to 44 Years | 8 (57.1%) | 6 (42.9%) |
| 45 to 54 Years | 5 (55.6%) | 4 (44.4%) |
| 55 to 64 Years | 57 (93.4%) | 4 (6.6%) |
| 65 to 74 Years | 43 (100.0%) | 0 (0.0%) |
| 75 Years and older | 44 (100.0%) | 0 (0.0%) |
| Total | 201 (93.5%) | 14 (6.5%) |
Health Insurance Coverage by Citizenship Status in Augusta
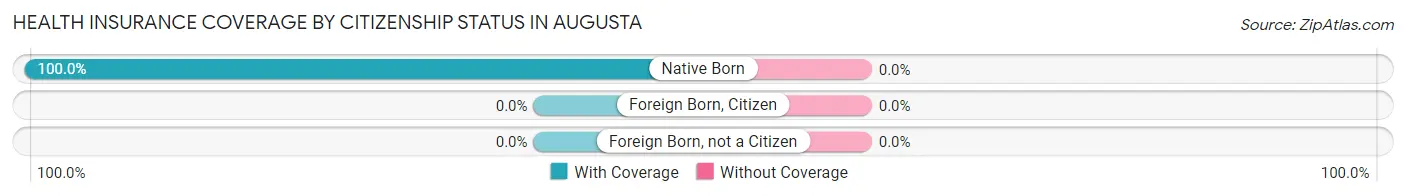
| Citizenship Status | With Coverage | Without Coverage |
| Native Born | 22 (100.0%) | 0 (0.0%) |
| Foreign Born, Citizen | 0 (0.0%) | 0 (0.0%) |
| Foreign Born, not a Citizen | 0 (0.0%) | 0 (0.0%) |
Health Insurance Coverage by Household Income in Augusta
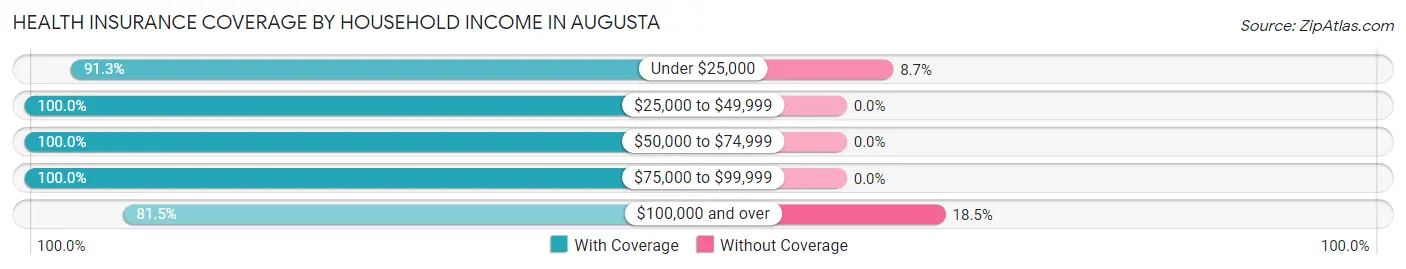
| Household Income | With Coverage | Without Coverage |
| Under $25,000 | 42 (91.3%) | 4 (8.7%) |
| $25,000 to $49,999 | 89 (100.0%) | 0 (0.0%) |
| $50,000 to $74,999 | 12 (100.0%) | 0 (0.0%) |
| $75,000 to $99,999 | 14 (100.0%) | 0 (0.0%) |
| $100,000 and over | 44 (81.5%) | 10 (18.5%) |
Public vs Private Health Insurance Coverage by Age in Augusta
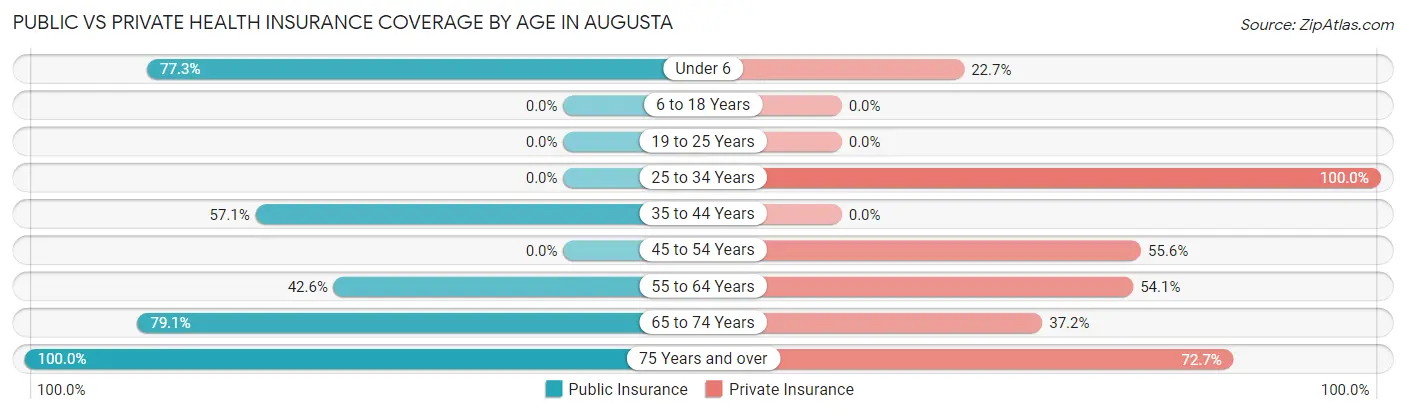
| Age Bracket | Public Insurance | Private Insurance |
| Under 6 | 17 (77.3%) | 5 (22.7%) |
| 6 to 18 Years | 0 (0.0%) | 0 (0.0%) |
| 19 to 25 Years | 0 (0.0%) | 0 (0.0%) |
| 25 to 34 Years | 0 (0.0%) | 22 (100.0%) |
| 35 to 44 Years | 8 (57.1%) | 0 (0.0%) |
| 45 to 54 Years | 0 (0.0%) | 5 (55.6%) |
| 55 to 64 Years | 26 (42.6%) | 33 (54.1%) |
| 65 to 74 Years | 34 (79.1%) | 16 (37.2%) |
| 75 Years and over | 44 (100.0%) | 32 (72.7%) |
| Total | 129 (60.0%) | 113 (52.6%) |
Disability Status by Sex by Age in Augusta
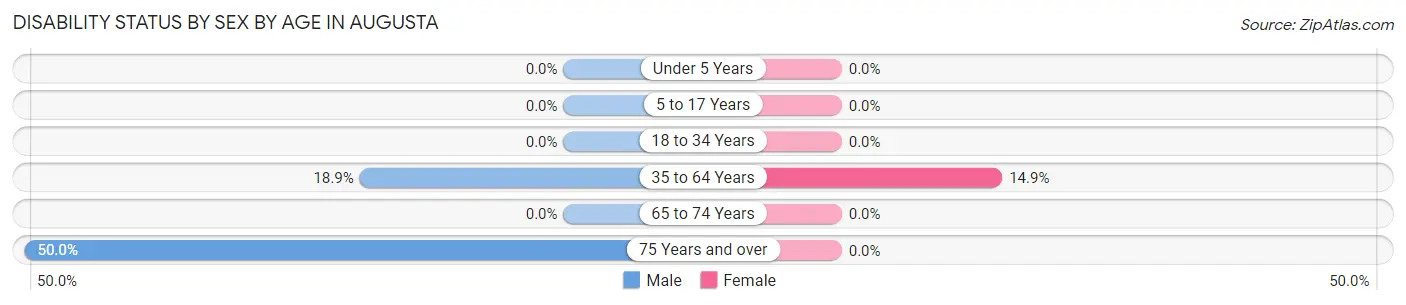
| Age Bracket | Male | Female |
| Under 5 Years | 0 (0.0%) | 0 (0.0%) |
| 5 to 17 Years | 0 (0.0%) | 0 (0.0%) |
| 18 to 34 Years | 0 (0.0%) | 0 (0.0%) |
| 35 to 64 Years | 7 (18.9%) | 7 (14.9%) |
| 65 to 74 Years | 0 (0.0%) | 0 (0.0%) |
| 75 Years and over | 12 (50.0%) | 0 (0.0%) |
Disability Class by Sex by Age in Augusta
Disability Class: Hearing Difficulty
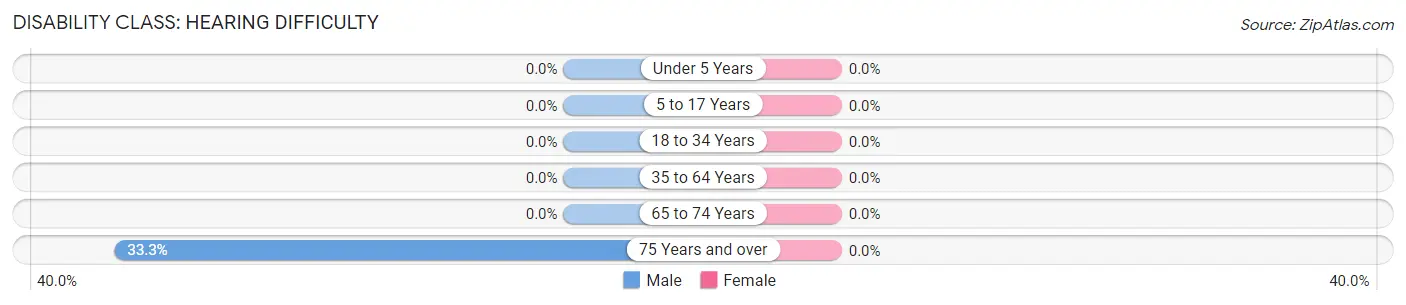
| Age Bracket | Male | Female |
| Under 5 Years | 0 (0.0%) | 0 (0.0%) |
| 5 to 17 Years | 0 (0.0%) | 0 (0.0%) |
| 18 to 34 Years | 0 (0.0%) | 0 (0.0%) |
| 35 to 64 Years | 0 (0.0%) | 0 (0.0%) |
| 65 to 74 Years | 0 (0.0%) | 0 (0.0%) |
| 75 Years and over | 8 (33.3%) | 0 (0.0%) |
Disability Class: Vision Difficulty

| Age Bracket | Male | Female |
| Under 5 Years | 0 (0.0%) | 0 (0.0%) |
| 5 to 17 Years | 0 (0.0%) | 0 (0.0%) |
| 18 to 34 Years | 0 (0.0%) | 0 (0.0%) |
| 35 to 64 Years | 0 (0.0%) | 0 (0.0%) |
| 65 to 74 Years | 0 (0.0%) | 0 (0.0%) |
| 75 Years and over | 4 (16.7%) | 0 (0.0%) |
Disability Class: Cognitive Difficulty
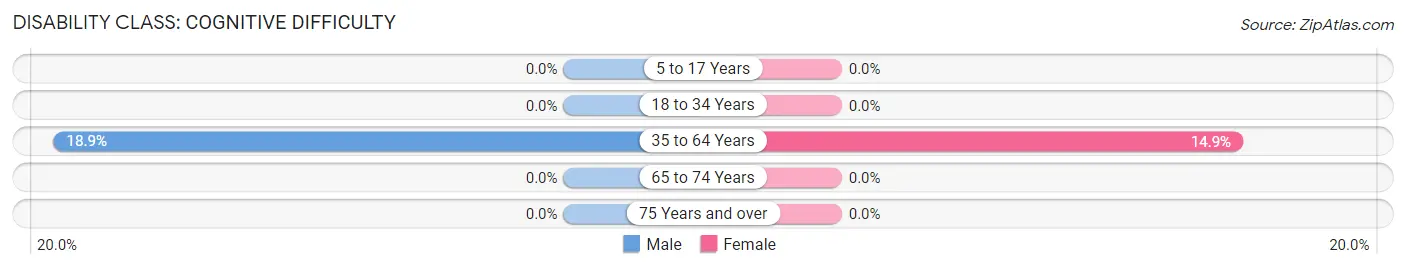
| Age Bracket | Male | Female |
| 5 to 17 Years | 0 (0.0%) | 0 (0.0%) |
| 18 to 34 Years | 0 (0.0%) | 0 (0.0%) |
| 35 to 64 Years | 7 (18.9%) | 7 (14.9%) |
| 65 to 74 Years | 0 (0.0%) | 0 (0.0%) |
| 75 Years and over | 0 (0.0%) | 0 (0.0%) |
Disability Class: Ambulatory Difficulty
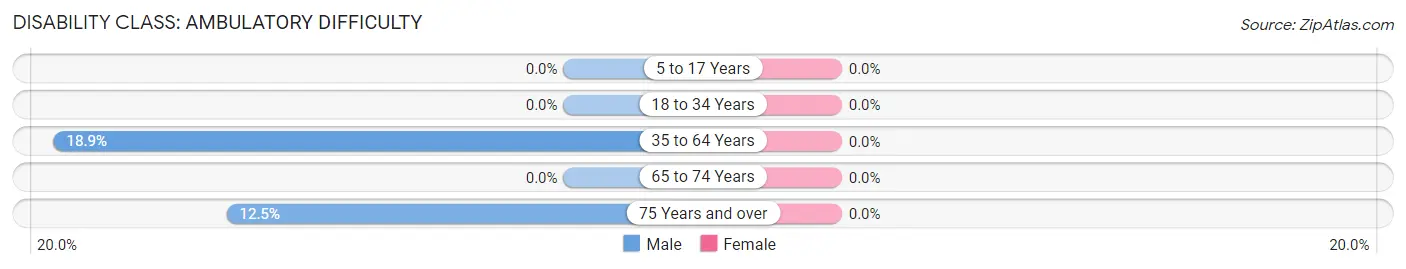
| Age Bracket | Male | Female |
| 5 to 17 Years | 0 (0.0%) | 0 (0.0%) |
| 18 to 34 Years | 0 (0.0%) | 0 (0.0%) |
| 35 to 64 Years | 7 (18.9%) | 0 (0.0%) |
| 65 to 74 Years | 0 (0.0%) | 0 (0.0%) |
| 75 Years and over | 3 (12.5%) | 0 (0.0%) |
Disability Class: Self-Care Difficulty
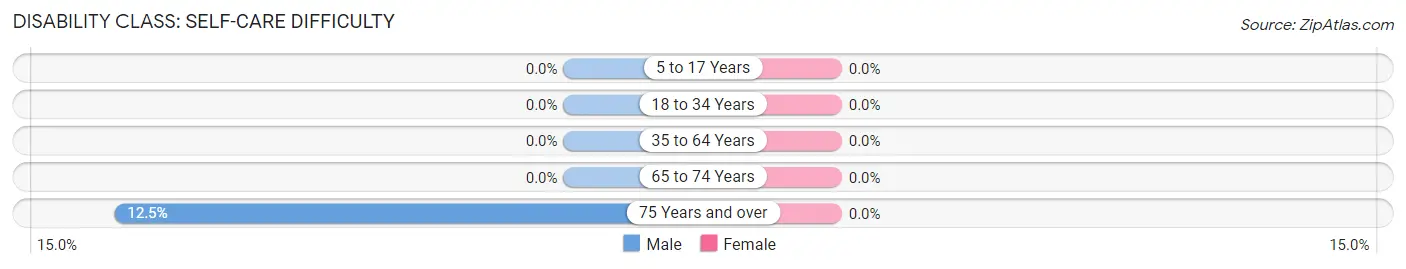
| Age Bracket | Male | Female |
| 5 to 17 Years | 0 (0.0%) | 0 (0.0%) |
| 18 to 34 Years | 0 (0.0%) | 0 (0.0%) |
| 35 to 64 Years | 0 (0.0%) | 0 (0.0%) |
| 65 to 74 Years | 0 (0.0%) | 0 (0.0%) |
| 75 Years and over | 3 (12.5%) | 0 (0.0%) |
Technology Access in Augusta
Computing Device Access in Augusta
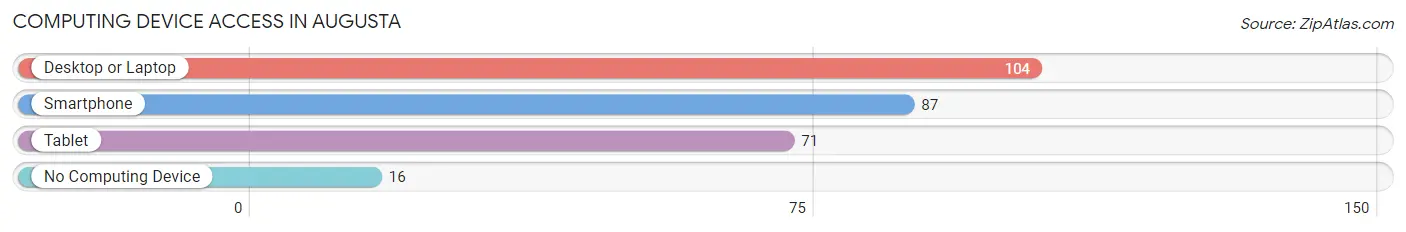
| Device Type | # Households | % Households |
| Desktop or Laptop | 104 | 84.6% |
| Smartphone | 87 | 70.7% |
| Tablet | 71 | 57.7% |
| No Computing Device | 16 | 13.0% |
| Total | 123 | 100.0% |
Internet Access in Augusta
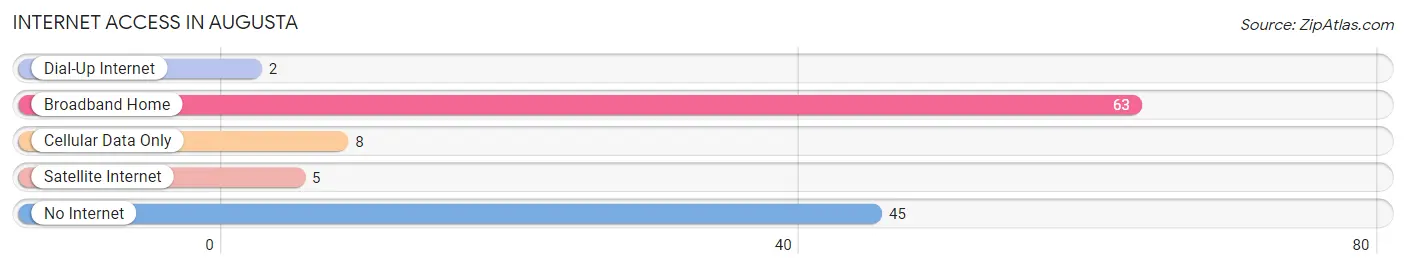
| Internet Type | # Households | % Households |
| Dial-Up Internet | 2 | 1.6% |
| Broadband Home | 63 | 51.2% |
| Cellular Data Only | 8 | 6.5% |
| Satellite Internet | 5 | 4.1% |
| No Internet | 45 | 36.6% |
| Total | 123 | 100.0% |
Augusta Summary
Augusta, Montana is a small town located in Lewis and Clark County, Montana. It is situated in the Rocky Mountains, approximately 30 miles northwest of Helena, the state capital. The town has a population of approximately 500 people and is a popular tourist destination due to its proximity to the Bob Marshall Wilderness and the Missouri River.
History
Augusta was founded in 1864 by a group of miners who were searching for gold in the area. The town was named after Augusta, Maine, the hometown of one of the miners. The town quickly grew and by 1867, it had a population of over 500 people. The town was home to several businesses, including a hotel, a saloon, a general store, and a blacksmith shop.
In 1876, the Northern Pacific Railroad was built through Augusta, connecting the town to the rest of the country. This allowed for the town to become a major shipping hub for the region. The railroad also brought in new settlers and businesses, and the population of Augusta grew to over 1,000 people by the early 1900s.
In the early 1900s, the town began to decline as the gold rush ended and the railroad moved its operations elsewhere. By the 1950s, the population had dropped to just over 500 people.
Geography
Augusta is located in the Rocky Mountains of Montana, approximately 30 miles northwest of Helena. The town is situated at an elevation of 4,400 feet and is surrounded by mountains and forests. The town is located on the banks of the Missouri River, which provides a variety of recreational activities, such as fishing, boating, and rafting.
The climate in Augusta is generally mild, with hot summers and cold winters. The average temperature in the summer is around 70 degrees Fahrenheit, while the average temperature in the winter is around 20 degrees Fahrenheit.
Economy
The economy of Augusta is largely based on tourism. The town is a popular destination for outdoor enthusiasts, as it is close to the Bob Marshall Wilderness and the Missouri River. The town also has several restaurants, hotels, and other businesses that cater to tourists.
In addition to tourism, the town is also home to several small businesses, such as a general store, a hardware store, and a gas station. The town also has a small manufacturing sector, which produces a variety of products, such as furniture and clothing.
Demographics
As of the 2010 census, the population of Augusta was 514 people. The racial makeup of the town was 97.3% White, 0.6% Native American, 0.2% Asian, 0.2% from other races, and 1.7% from two or more races. The median household income in Augusta was $37,500, and the median family income was $45,000.
Conclusion
Augusta, Montana is a small town located in the Rocky Mountains of Montana. It is a popular tourist destination due to its proximity to the Bob Marshall Wilderness and the Missouri River. The town has a population of approximately 500 people and is home to several small businesses. The economy of Augusta is largely based on tourism, and the town has a median household income of $37,500.
Common Questions
What is Per Capita Income in Augusta?
Per Capita income in Augusta is $33,258.
What is the Median Family Income in Augusta?
Median Family Income in Augusta is $47,708.
What is the Median Household income in Augusta?
Median Household Income in Augusta is $41,118.
What is Income or Wage Gap in Augusta?
Income or Wage Gap in Augusta is 19.8%.
Women in Augusta earn 80.2 cents for every dollar earned by a man.
What is Inequality or Gini Index in Augusta?
Inequality or Gini Index in Augusta is 0.43.
What is the Total Population of Augusta?
Total Population of Augusta is 215.
What is the Total Male Population of Augusta?
Total Male Population of Augusta is 111.
What is the Total Female Population of Augusta?
Total Female Population of Augusta is 104.
What is the Ratio of Males per 100 Females in Augusta?
There are 106.73 Males per 100 Females in Augusta.
What is the Ratio of Females per 100 Males in Augusta?
There are 93.69 Females per 100 Males in Augusta.
What is the Median Population Age in Augusta?
Median Population Age in Augusta is 63.2 Years.
What is the Average Family Size in Augusta
Average Family Size in Augusta is 2.2 People.
What is the Average Household Size in Augusta
Average Household Size in Augusta is 1.8 People.
How Large is the Labor Force in Augusta?
There are 81 People in the Labor Forcein in Augusta.
What is the Percentage of People in the Labor Force in Augusta?
42.0% of People are in the Labor Force in Augusta.