Trego, MT Map & Demographics
Trego Map
Trego Overview
$31,473
PER CAPITA INCOME
$101,750
AVG FAMILY INCOME
$59,375
AVG HOUSEHOLD INCOME
24.4%
WAGE / INCOME GAP [ % ]
75.6¢/ $1
WAGE / INCOME GAP [ $ ]
0.39
INEQUALITY / GINI INDEX
766
TOTAL POPULATION
426
MALE POPULATION
340
FEMALE POPULATION
125.29
MALES / 100 FEMALES
79.81
FEMALES / 100 MALES
38.1
MEDIAN AGE
3.2
AVG FAMILY SIZE
2.7
AVG HOUSEHOLD SIZE
349
LABOR FORCE [ PEOPLE ]
60.4%
PERCENT IN LABOR FORCE
0.6%
UNEMPLOYMENT RATE
Trego Zip Codes
Trego Area Codes
Income in Trego
Income Overview in Trego
Per Capita Income in Trego is $31,473, while median incomes of families and households are $101,750 and $59,375 respectively.
| Characteristic | Number | Measure |
| Per Capita Income | 766 | $31,473 |
| Median Family Income | 210 | $101,750 |
| Mean Family Income | 210 | $93,224 |
| Median Household Income | 281 | $59,375 |
| Mean Household Income | 281 | $81,240 |
| Income Deficit | 210 | $0 |
| Wage / Income Gap (%) | 766 | 24.38% |
| Wage / Income Gap ($) | 766 | 75.62¢ per $1 |
| Gini / Inequality Index | 766 | 0.39 |
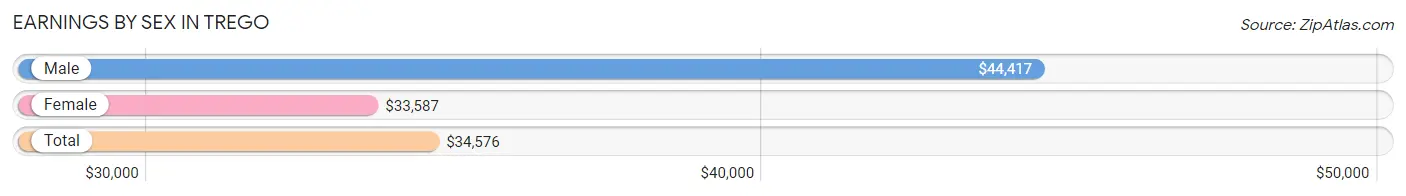
Earnings by Sex in Trego
Average Earnings in Trego are $34,576, $44,417 for men and $33,587 for women, a difference of 24.4%.
| Sex | Number | Average Earnings |
| Male | 197 (52.2%) | $44,417 |
| Female | 180 (47.7%) | $33,587 |
| Total | 377 (100.0%) | $34,576 |
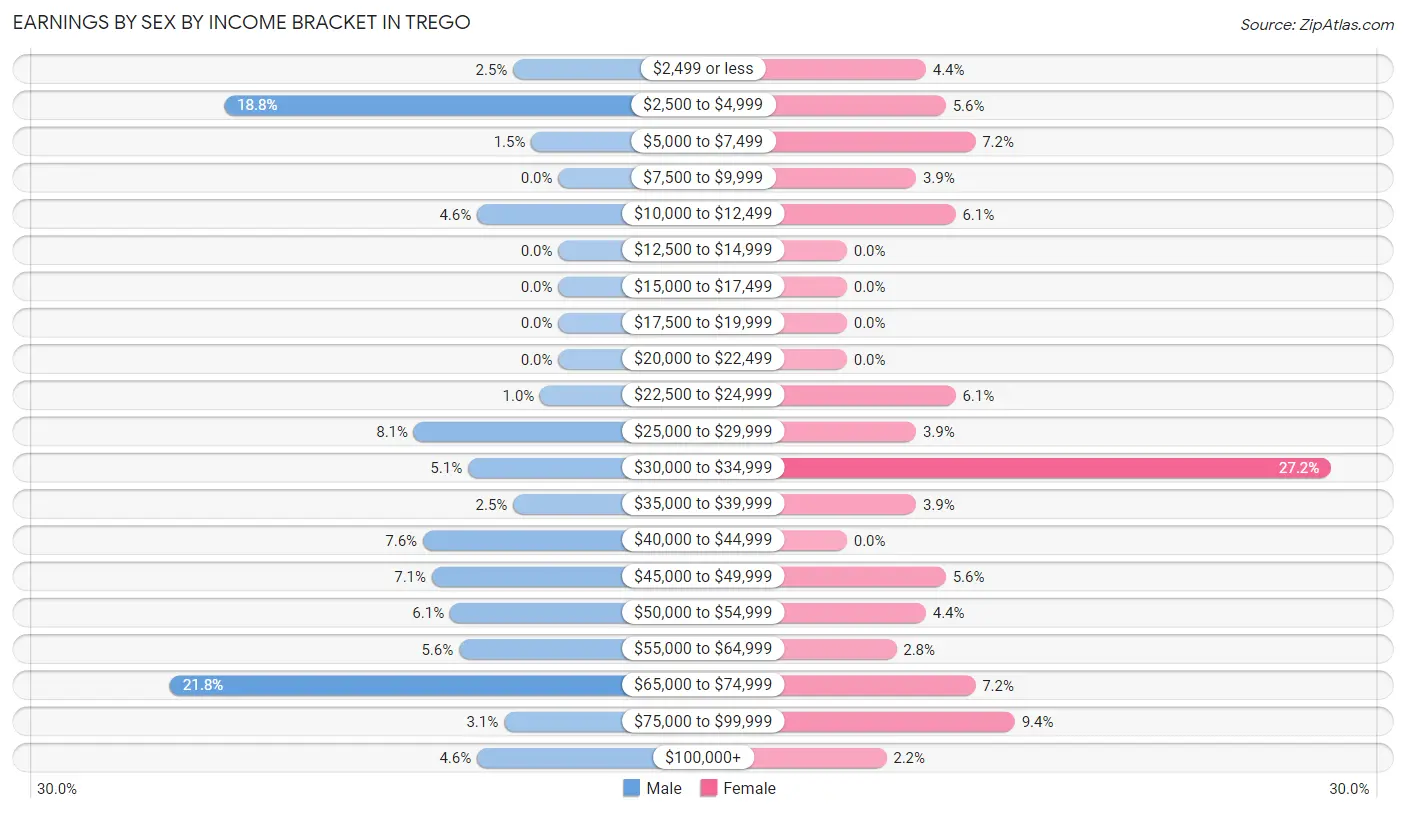
Earnings by Sex by Income Bracket in Trego
The most common earnings brackets in Trego are $65,000 to $74,999 for men (43 | 21.8%) and $30,000 to $34,999 for women (49 | 27.2%).
| Income | Male | Female |
| $2,499 or less | 5 (2.5%) | 8 (4.4%) |
| $2,500 to $4,999 | 37 (18.8%) | 10 (5.6%) |
| $5,000 to $7,499 | 3 (1.5%) | 13 (7.2%) |
| $7,500 to $9,999 | 0 (0.0%) | 7 (3.9%) |
| $10,000 to $12,499 | 9 (4.6%) | 11 (6.1%) |
| $12,500 to $14,999 | 0 (0.0%) | 0 (0.0%) |
| $15,000 to $17,499 | 0 (0.0%) | 0 (0.0%) |
| $17,500 to $19,999 | 0 (0.0%) | 0 (0.0%) |
| $20,000 to $22,499 | 0 (0.0%) | 0 (0.0%) |
| $22,500 to $24,999 | 2 (1.0%) | 11 (6.1%) |
| $25,000 to $29,999 | 16 (8.1%) | 7 (3.9%) |
| $30,000 to $34,999 | 10 (5.1%) | 49 (27.2%) |
| $35,000 to $39,999 | 5 (2.5%) | 7 (3.9%) |
| $40,000 to $44,999 | 15 (7.6%) | 0 (0.0%) |
| $45,000 to $49,999 | 14 (7.1%) | 10 (5.6%) |
| $50,000 to $54,999 | 12 (6.1%) | 8 (4.4%) |
| $55,000 to $64,999 | 11 (5.6%) | 5 (2.8%) |
| $65,000 to $74,999 | 43 (21.8%) | 13 (7.2%) |
| $75,000 to $99,999 | 6 (3.0%) | 17 (9.4%) |
| $100,000+ | 9 (4.6%) | 4 (2.2%) |
| Total | 197 (100.0%) | 180 (100.0%) |
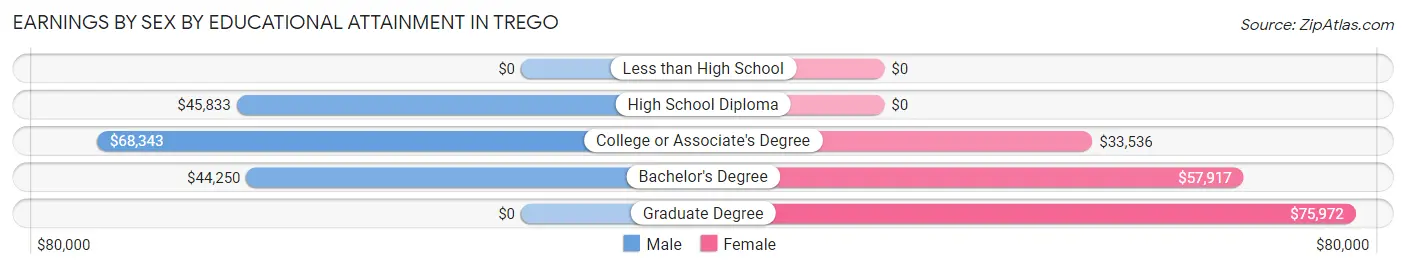
Earnings by Sex by Educational Attainment in Trego
Average earnings in Trego are $50,341 for men and $33,940 for women, a difference of 32.6%. Men with an educational attainment of college or associate's degree enjoy the highest average annual earnings of $68,343, while those with bachelor's degree education earn the least with $44,250. Women with an educational attainment of graduate degree earn the most with the average annual earnings of $75,972, while those with college or associate's degree education have the smallest earnings of $33,536.
| Educational Attainment | Male Income | Female Income |
| Less than High School | - | - |
| High School Diploma | $45,833 | $0 |
| College or Associate's Degree | $68,343 | $33,536 |
| Bachelor's Degree | $44,250 | $57,917 |
| Graduate Degree | - | - |
| Total | $50,341 | $33,940 |
Family Income in Trego
Family Income Brackets in Trego
According to the Trego family income data, there are 88 families falling into the $100,000 to $149,999 income range, which is the most common income bracket and makes up 41.9% of all families. Conversely, the $75,000 to $99,999 income bracket is the least frequent group with only 2 families (0.9%) belonging to this category.
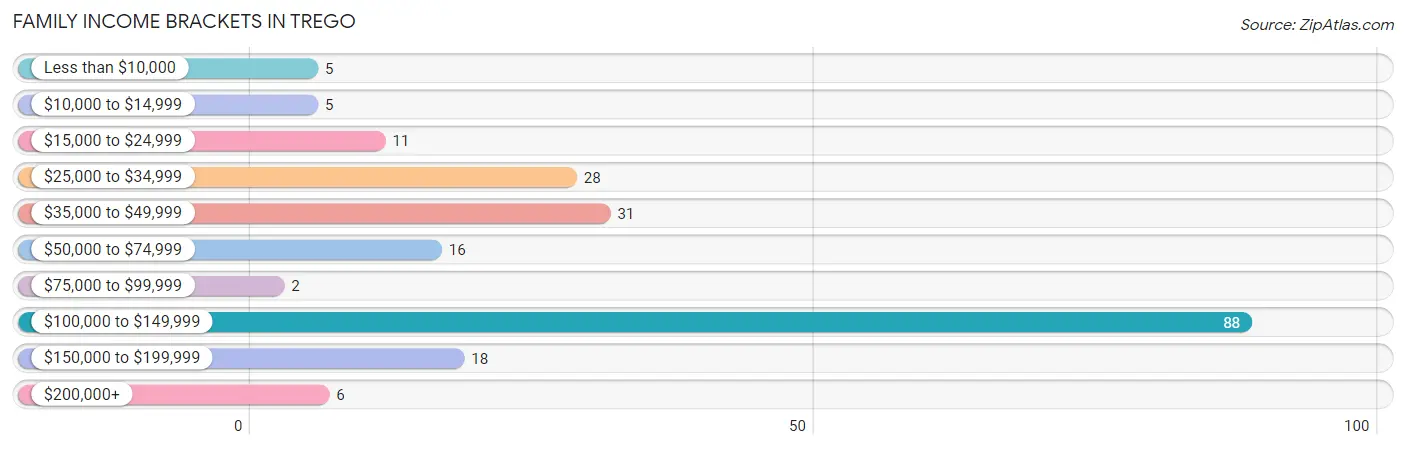
| Income Bracket | # Families | % Families |
| Less than $10,000 | 5 | 2.4% |
| $10,000 to $14,999 | 5 | 2.4% |
| $15,000 to $24,999 | 11 | 5.2% |
| $25,000 to $34,999 | 28 | 13.3% |
| $35,000 to $49,999 | 31 | 14.8% |
| $50,000 to $74,999 | 16 | 7.6% |
| $75,000 to $99,999 | 2 | 1.0% |
| $100,000 to $149,999 | 88 | 41.9% |
| $150,000 to $199,999 | 18 | 8.6% |
| $200,000+ | 6 | 2.9% |
Family Income by Famaliy Size in Trego
3-person families (26 | 12.4%) account for the highest median family income in Trego with $114,500 per family, while 3-person families (26 | 12.4%) have the highest median income of $38,167 per family member.
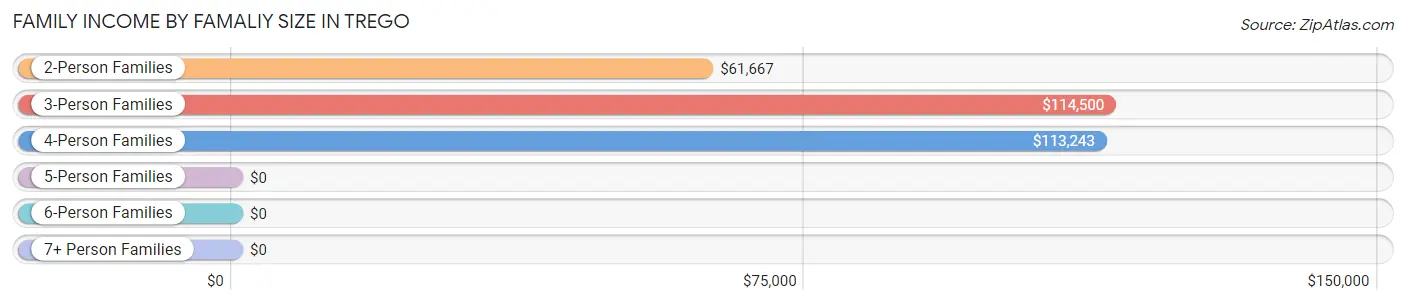
| Income Bracket | # Families | Median Income |
| 2-Person Families | 122 (58.1%) | $61,667 |
| 3-Person Families | 26 (12.4%) | $114,500 |
| 4-Person Families | 52 (24.8%) | $113,243 |
| 5-Person Families | 0 (0.0%) | $0 |
| 6-Person Families | 10 (4.8%) | $0 |
| 7+ Person Families | 0 (0.0%) | $0 |
| Total | 210 (100.0%) | $101,750 |
Family Income by Number of Earners in Trego
The median family income in Trego is $101,750, with families comprising 2 earners (77) having the highest median family income of $113,209, while families with no earners (49) have the lowest median family income of $35,417, accounting for 36.7% and 23.3% of families, respectively.
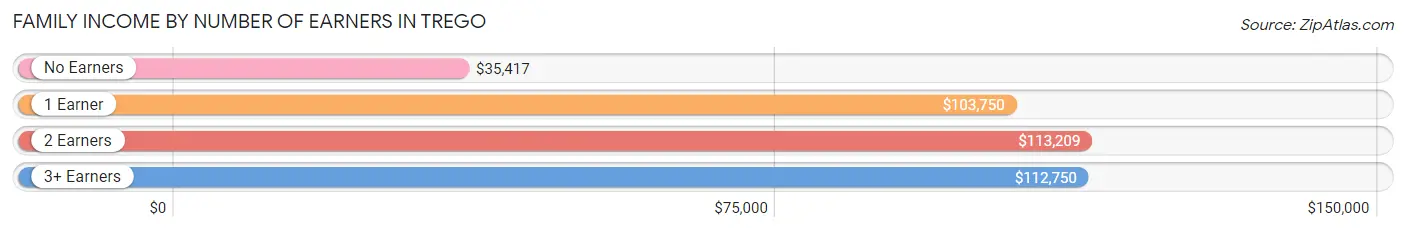
| Number of Earners | # Families | Median Income |
| No Earners | 49 (23.3%) | $35,417 |
| 1 Earner | 51 (24.3%) | $103,750 |
| 2 Earners | 77 (36.7%) | $113,209 |
| 3+ Earners | 33 (15.7%) | $112,750 |
| Total | 210 (100.0%) | $101,750 |
Household Income in Trego
Household Income Brackets in Trego
With 92 households falling in the category, the $100,000 to $149,999 income range is the most frequent in Trego, accounting for 32.7% of all households. In contrast, only 2 households (0.7%) fall into the $75,000 to $99,999 income bracket, making it the least populous group.
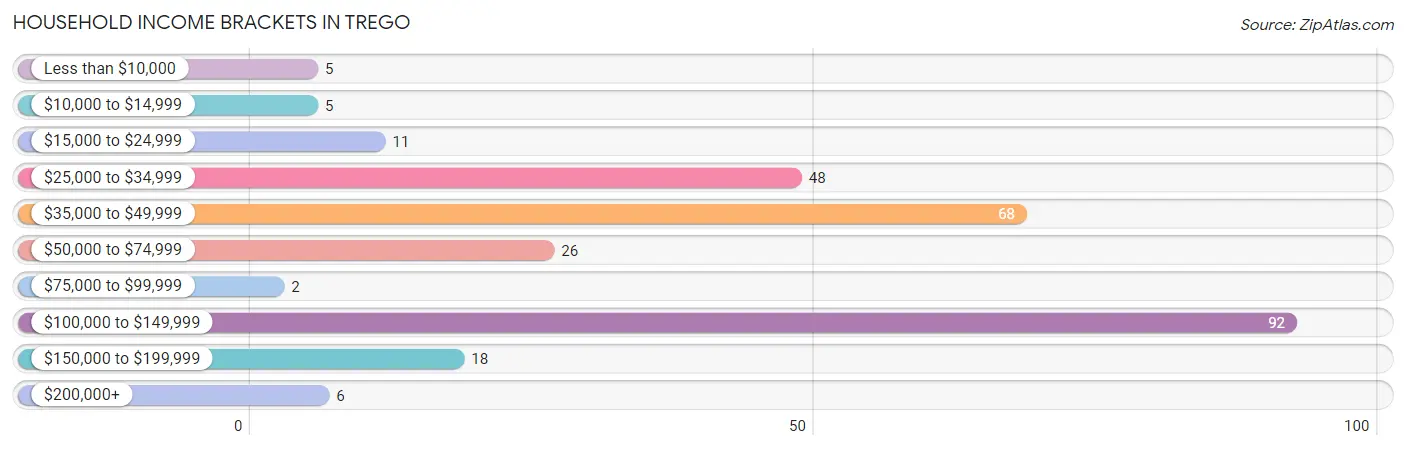
| Income Bracket | # Households | % Households |
| Less than $10,000 | 5 | 1.8% |
| $10,000 to $14,999 | 5 | 1.8% |
| $15,000 to $24,999 | 11 | 3.9% |
| $25,000 to $34,999 | 48 | 17.1% |
| $35,000 to $49,999 | 68 | 24.2% |
| $50,000 to $74,999 | 26 | 9.3% |
| $75,000 to $99,999 | 2 | 0.7% |
| $100,000 to $149,999 | 92 | 32.7% |
| $150,000 to $199,999 | 18 | 6.4% |
| $200,000+ | 6 | 2.1% |
Household Income by Householder Age in Trego
The median household income in Trego is $59,375, with the highest median household income of $100,750 found in the 25 to 44 years age bracket for the primary householder. A total of 88 households (31.3%) fall into this category. Meanwhile, the 15 to 24 years age bracket for the primary householder has the lowest median household income of $0, with 6 households (2.1%) in this group.
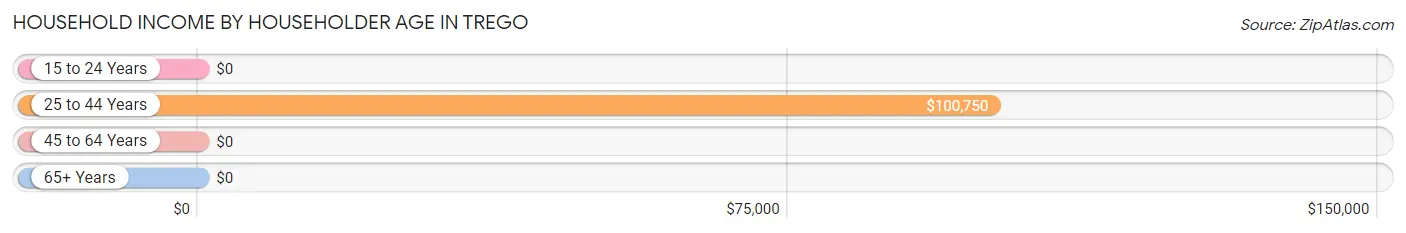
| Income Bracket | # Households | Median Income |
| 15 to 24 Years | 6 (2.1%) | $0 |
| 25 to 44 Years | 88 (31.3%) | $100,750 |
| 45 to 64 Years | 97 (34.5%) | $0 |
| 65+ Years | 90 (32.0%) | $0 |
| Total | 281 (100.0%) | $59,375 |
Poverty in Trego
Income Below Poverty by Sex and Age in Trego
With 2.8% poverty level for males and 7.1% for females among the residents of Trego, under 5 year old males and 18 to 24 year old females are the most vulnerable to poverty, with 2 males (28.6%) and 9 females (69.2%) in their respective age groups living below the poverty level.
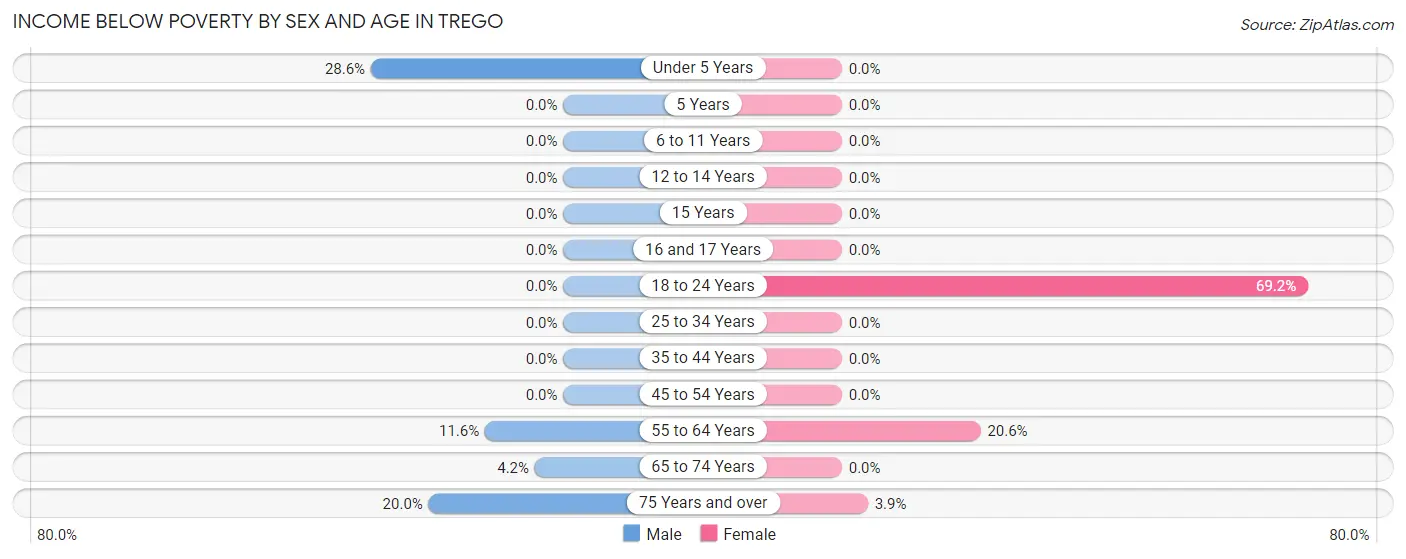
| Age Bracket | Male | Female |
| Under 5 Years | 2 (28.6%) | 0 (0.0%) |
| 5 Years | 0 (0.0%) | 0 (0.0%) |
| 6 to 11 Years | 0 (0.0%) | 0 (0.0%) |
| 12 to 14 Years | 0 (0.0%) | 0 (0.0%) |
| 15 Years | 0 (0.0%) | 0 (0.0%) |
| 16 and 17 Years | 0 (0.0%) | 0 (0.0%) |
| 18 to 24 Years | 0 (0.0%) | 9 (69.2%) |
| 25 to 34 Years | 0 (0.0%) | 0 (0.0%) |
| 35 to 44 Years | 0 (0.0%) | 0 (0.0%) |
| 45 to 54 Years | 0 (0.0%) | 0 (0.0%) |
| 55 to 64 Years | 5 (11.6%) | 14 (20.6%) |
| 65 to 74 Years | 3 (4.2%) | 0 (0.0%) |
| 75 Years and over | 2 (20.0%) | 1 (3.8%) |
| Total | 12 (2.8%) | 24 (7.1%) |
Income Above Poverty by Sex and Age in Trego
According to the poverty statistics in Trego, males aged 6 to 11 years and females aged under 5 years are the age groups that are most secure financially, with 100.0% of males and 100.0% of females in these age groups living above the poverty line.
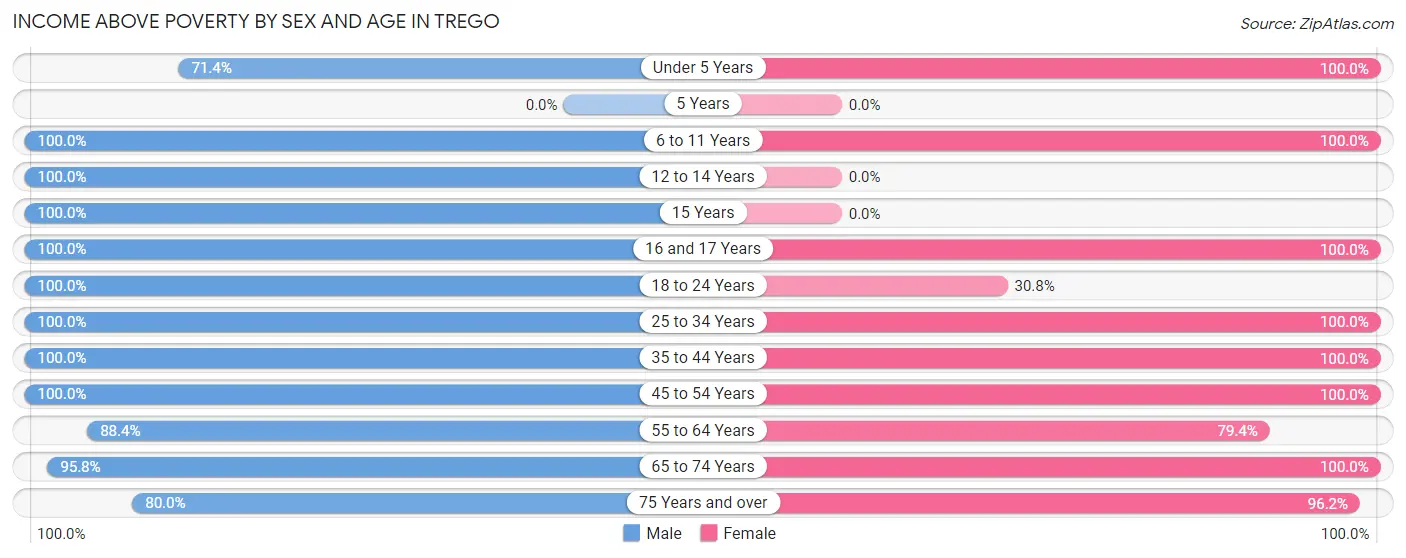
| Age Bracket | Male | Female |
| Under 5 Years | 5 (71.4%) | 11 (100.0%) |
| 5 Years | 0 (0.0%) | 0 (0.0%) |
| 6 to 11 Years | 69 (100.0%) | 56 (100.0%) |
| 12 to 14 Years | 32 (100.0%) | 0 (0.0%) |
| 15 Years | 13 (100.0%) | 0 (0.0%) |
| 16 and 17 Years | 3 (100.0%) | 8 (100.0%) |
| 18 to 24 Years | 35 (100.0%) | 4 (30.8%) |
| 25 to 34 Years | 28 (100.0%) | 16 (100.0%) |
| 35 to 44 Years | 92 (100.0%) | 57 (100.0%) |
| 45 to 54 Years | 23 (100.0%) | 38 (100.0%) |
| 55 to 64 Years | 38 (88.4%) | 54 (79.4%) |
| 65 to 74 Years | 68 (95.8%) | 47 (100.0%) |
| 75 Years and over | 8 (80.0%) | 25 (96.2%) |
| Total | 414 (97.2%) | 316 (92.9%) |
Income Below Poverty Among Married-Couple Families in Trego
The poverty statistics for married-couple families in Trego show that 4.2% or 8 of the total 191 families live below the poverty line. Families with no children have the highest poverty rate of 6.4%, comprising of 8 families. On the other hand, families with 1 or 2 children have the lowest poverty rate of 0.0%, which includes 0 families.
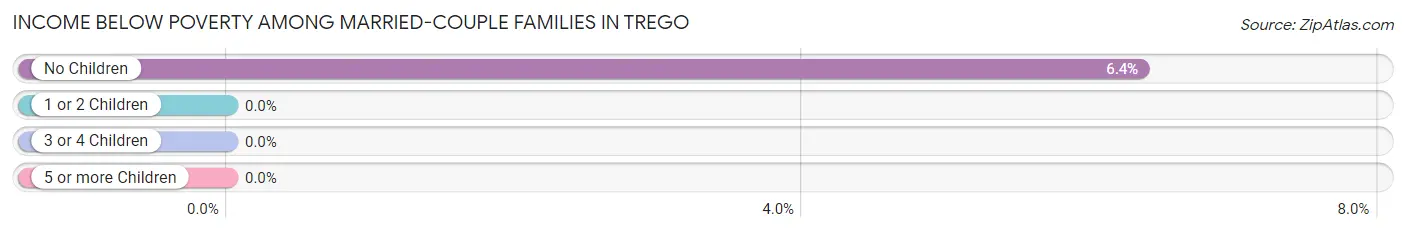
| Children | Above Poverty | Below Poverty |
| No Children | 118 (93.6%) | 8 (6.4%) |
| 1 or 2 Children | 55 (100.0%) | 0 (0.0%) |
| 3 or 4 Children | 10 (100.0%) | 0 (0.0%) |
| 5 or more Children | 0 (0.0%) | 0 (0.0%) |
| Total | 183 (95.8%) | 8 (4.2%) |
Income Below Poverty Among Single-Parent Households in Trego
According to the poverty data in Trego, 5.9% or 1 single-father households and 100.0% or 2 single-mother households are living below the poverty line. Among single-father households, those with no children have the highest poverty rate, with 1 households (8.3%) experiencing poverty. Likewise, among single-mother households, those with 1 or 2 children have the highest poverty rate, with 2 households (100.0%) falling below the poverty line.
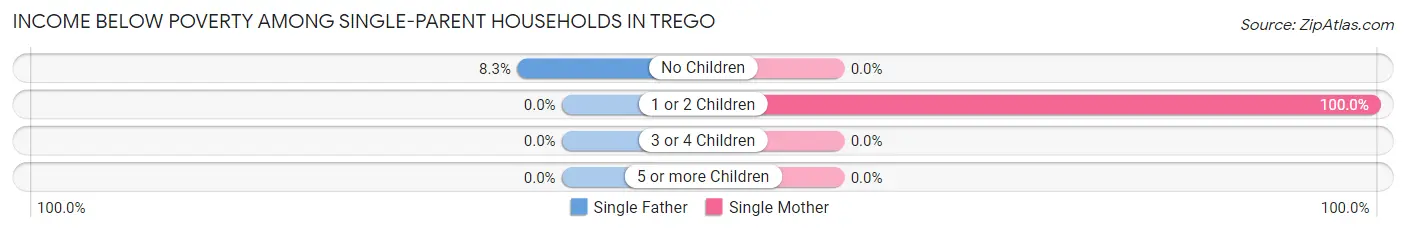
| Children | Single Father | Single Mother |
| No Children | 1 (8.3%) | 0 (0.0%) |
| 1 or 2 Children | 0 (0.0%) | 2 (100.0%) |
| 3 or 4 Children | 0 (0.0%) | 0 (0.0%) |
| 5 or more Children | 0 (0.0%) | 0 (0.0%) |
| Total | 1 (5.9%) | 2 (100.0%) |
Income Below Poverty Among Married-Couple vs Single-Parent Households in Trego
The poverty data for Trego shows that 8 of the married-couple family households (4.2%) and 3 of the single-parent households (15.8%) are living below the poverty level. Within the married-couple family households, those with no children have the highest poverty rate, with 8 households (6.4%) falling below the poverty line. Among the single-parent households, those with 1 or 2 children have the highest poverty rate, with 2 household (28.6%) living below poverty.
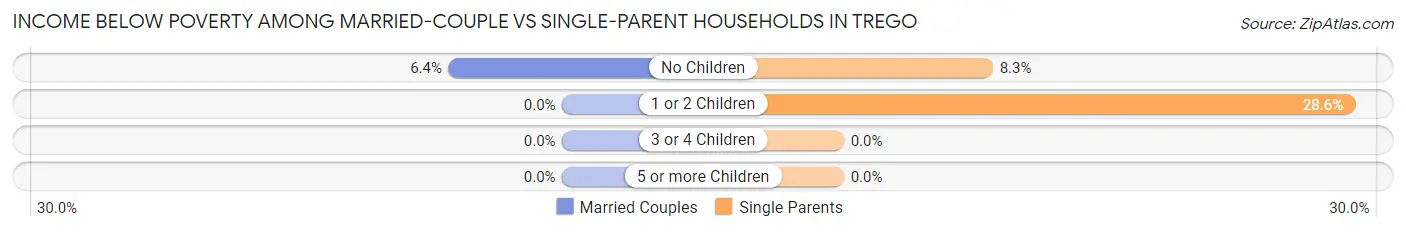
| Children | Married-Couple Families | Single-Parent Households |
| No Children | 8 (6.4%) | 1 (8.3%) |
| 1 or 2 Children | 0 (0.0%) | 2 (28.6%) |
| 3 or 4 Children | 0 (0.0%) | 0 (0.0%) |
| 5 or more Children | 0 (0.0%) | 0 (0.0%) |
| Total | 8 (4.2%) | 3 (15.8%) |
Race in Trego
The most populous races in Trego are White / Caucasian (734 | 95.8%), Two or more Races (21 | 2.7%), and Hispanic or Latino (16 | 2.1%).
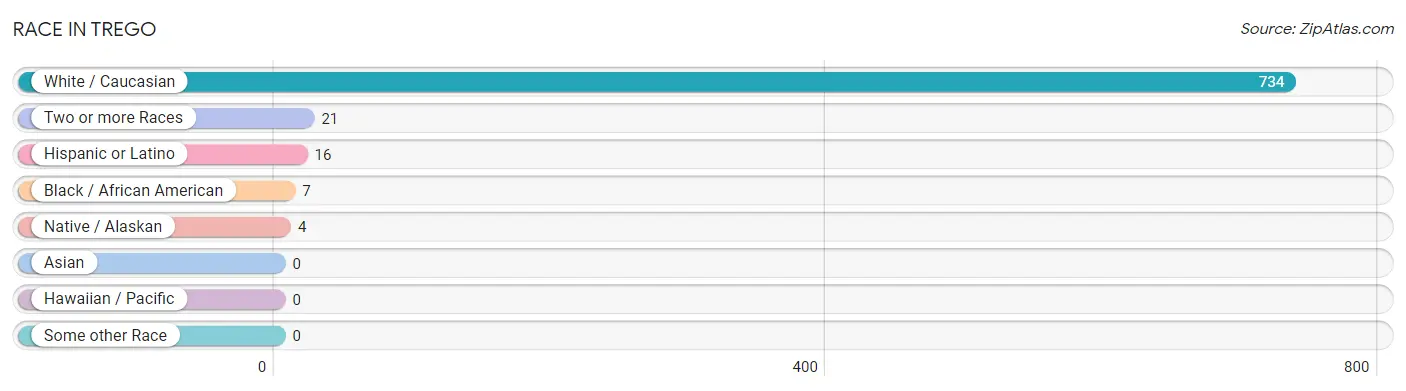
| Race | # Population | % Population |
| Asian | 0 | 0.0% |
| Black / African American | 7 | 0.9% |
| Hawaiian / Pacific | 0 | 0.0% |
| Hispanic or Latino | 16 | 2.1% |
| Native / Alaskan | 4 | 0.5% |
| White / Caucasian | 734 | 95.8% |
| Two or more Races | 21 | 2.7% |
| Some other Race | 0 | 0.0% |
| Total | 766 | 100.0% |
Ancestry in Trego
The most populous ancestries reported in Trego are German (118 | 15.4%), Irish (107 | 14.0%), English (52 | 6.8%), Scottish (52 | 6.8%), and Norwegian (36 | 4.7%), together accounting for 47.6% of all Trego residents.
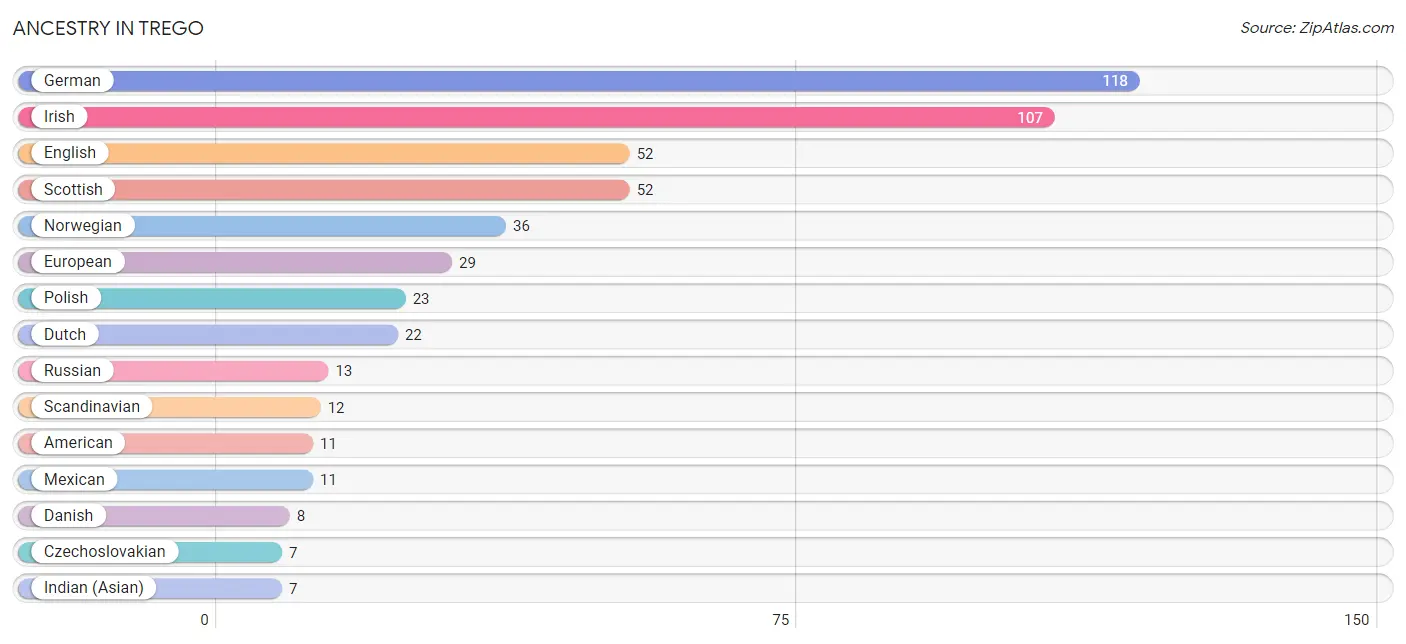
| Ancestry | # Population | % Population |
| American | 11 | 1.4% |
| Bhutanese | 5 | 0.6% |
| Chickasaw | 4 | 0.5% |
| Czechoslovakian | 7 | 0.9% |
| Danish | 8 | 1.0% |
| Dutch | 22 | 2.9% |
| English | 52 | 6.8% |
| European | 29 | 3.8% |
| German | 118 | 15.4% |
| Indian (Asian) | 7 | 0.9% |
| Irish | 107 | 14.0% |
| Italian | 5 | 0.6% |
| Lithuanian | 5 | 0.6% |
| Mexican | 11 | 1.4% |
| Norwegian | 36 | 4.7% |
| Polish | 23 | 3.0% |
| Russian | 13 | 1.7% |
| Scandinavian | 12 | 1.6% |
| Scotch-Irish | 6 | 0.8% |
| Scottish | 52 | 6.8% |
| South American | 5 | 0.6% |
| Swedish | 3 | 0.4% |
| Swiss | 3 | 0.4% |
| Ukrainian | 5 | 0.6% |
| Venezuelan | 5 | 0.6% |
| Welsh | 4 | 0.5% | View All 26 Rows |
Immigrants in Trego
The most numerous immigrant groups reported in Trego came from , and Canada (20 | 2.6%), together accounting for 2.6% of all Trego residents.

| Immigration Origin | # Population | % Population |
| Canada | 20 | 2.6% | View All 1 Rows |
Sex and Age in Trego
Sex and Age in Trego
The most populous age groups in Trego are 35 to 39 Years (66 | 15.5%) for men and 10 to 14 Years (56 | 16.5%) for women.
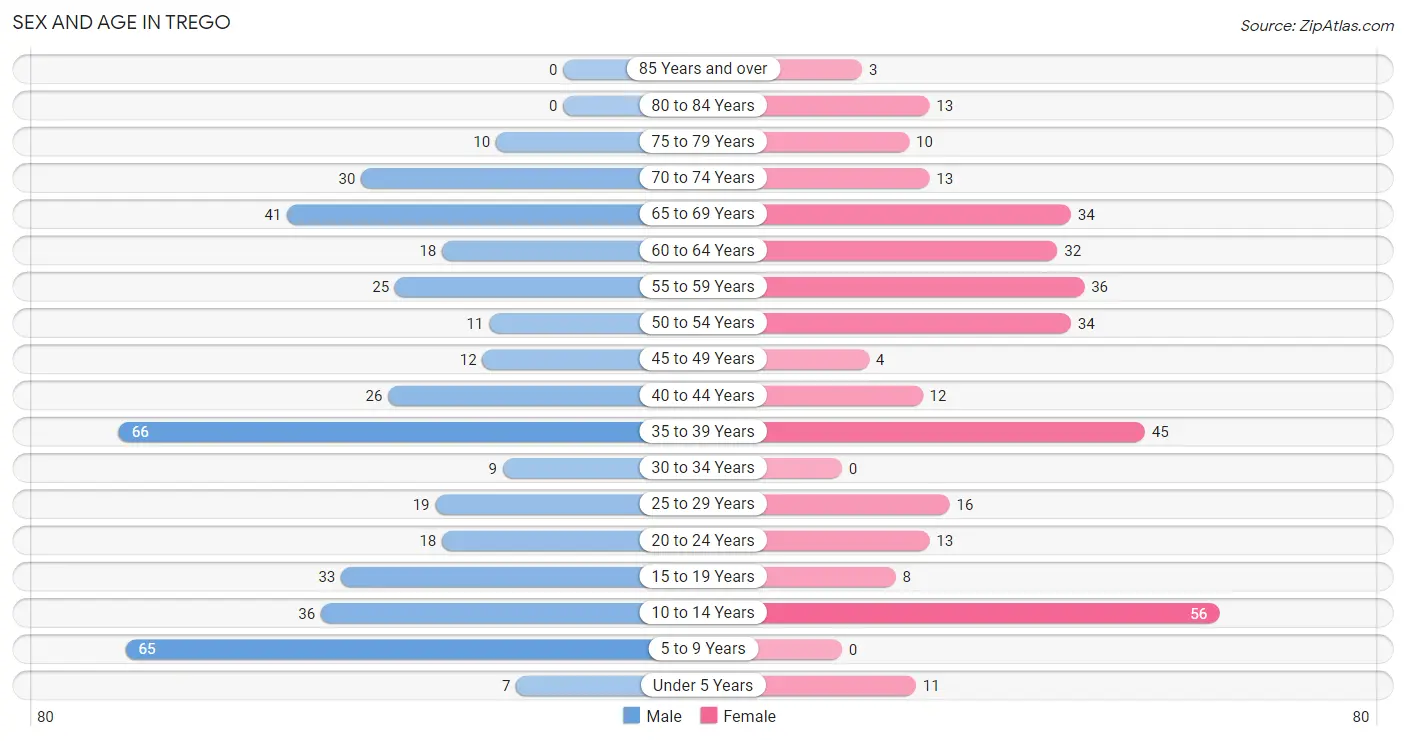
| Age Bracket | Male | Female |
| Under 5 Years | 7 (1.6%) | 11 (3.2%) |
| 5 to 9 Years | 65 (15.3%) | 0 (0.0%) |
| 10 to 14 Years | 36 (8.5%) | 56 (16.5%) |
| 15 to 19 Years | 33 (7.7%) | 8 (2.4%) |
| 20 to 24 Years | 18 (4.2%) | 13 (3.8%) |
| 25 to 29 Years | 19 (4.5%) | 16 (4.7%) |
| 30 to 34 Years | 9 (2.1%) | 0 (0.0%) |
| 35 to 39 Years | 66 (15.5%) | 45 (13.2%) |
| 40 to 44 Years | 26 (6.1%) | 12 (3.5%) |
| 45 to 49 Years | 12 (2.8%) | 4 (1.2%) |
| 50 to 54 Years | 11 (2.6%) | 34 (10.0%) |
| 55 to 59 Years | 25 (5.9%) | 36 (10.6%) |
| 60 to 64 Years | 18 (4.2%) | 32 (9.4%) |
| 65 to 69 Years | 41 (9.6%) | 34 (10.0%) |
| 70 to 74 Years | 30 (7.0%) | 13 (3.8%) |
| 75 to 79 Years | 10 (2.4%) | 10 (2.9%) |
| 80 to 84 Years | 0 (0.0%) | 13 (3.8%) |
| 85 Years and over | 0 (0.0%) | 3 (0.9%) |
| Total | 426 (100.0%) | 340 (100.0%) |
Families and Households in Trego
Median Family Size in Trego
The median family size in Trego is 3.22 persons per family, with married-couple families (191 | 90.9%) accounting for the largest median family size of 3.3 persons per family. On the other hand, single female/mother families (2 | 0.9%) represent the smallest median family size with 2.00 persons per family.
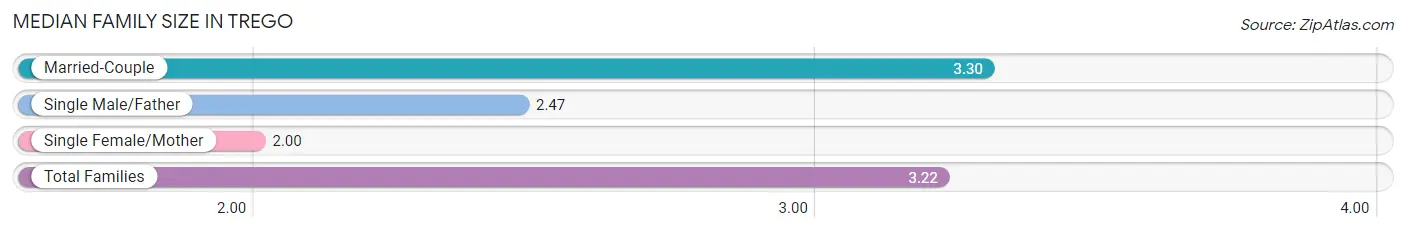
| Family Type | # Families | Family Size |
| Married-Couple | 191 (90.9%) | 3.30 |
| Single Male/Father | 17 (8.1%) | 2.47 |
| Single Female/Mother | 2 (0.9%) | 2.00 |
| Total Families | 210 (100.0%) | 3.22 |
Median Household Size in Trego
The median household size in Trego is 2.68 persons per household, with married-couple households (191 | 68.0%) accounting for the largest median household size of 3.3 persons per household. non-family households (71 | 25.3%) represent the smallest median household size with 1.07 persons per household.
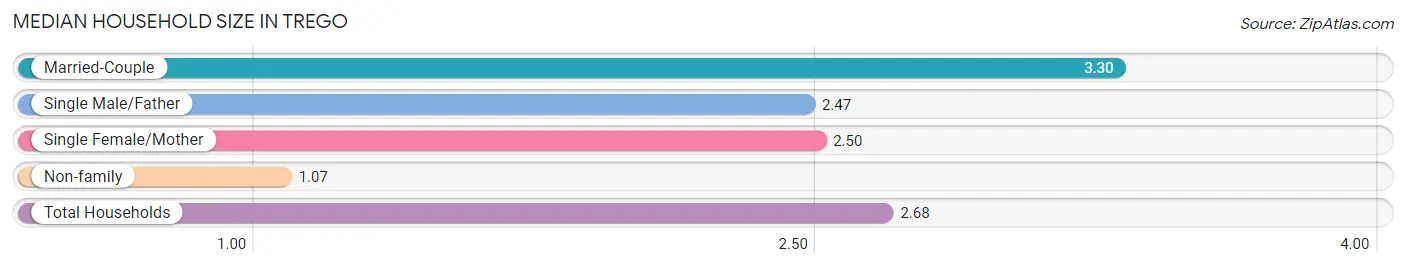
| Household Type | # Households | Household Size |
| Married-Couple | 191 (68.0%) | 3.30 |
| Single Male/Father | 17 (6.0%) | 2.47 |
| Single Female/Mother | 2 (0.7%) | 2.50 |
| Non-family | 71 (25.3%) | 1.07 |
| Total Households | 281 (100.0%) | 2.68 |
Household Size by Marriage Status in Trego
Out of a total of 281 households in Trego, 210 (74.7%) are family households, while 71 (25.3%) are nonfamily households. The most numerous type of family households are 2-person households, comprising 120, and the most common type of nonfamily households are 1-person households, comprising 67.
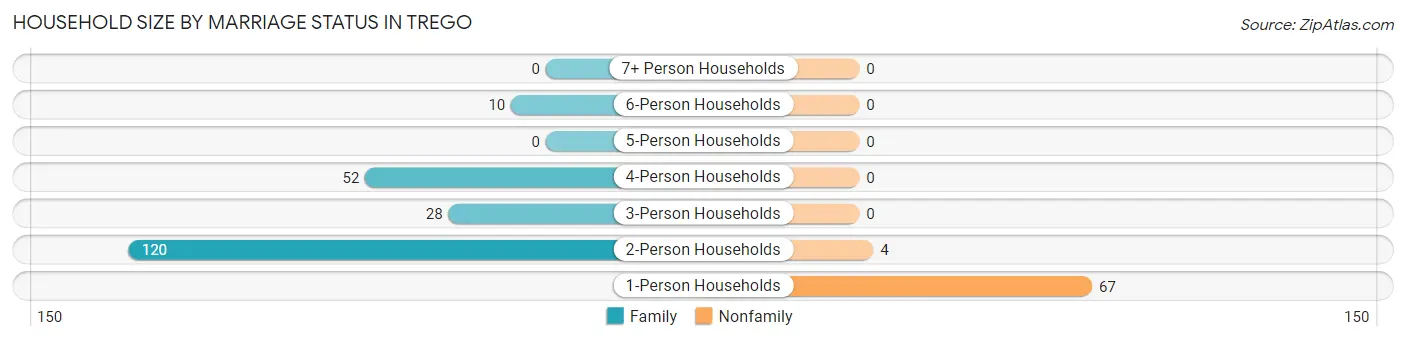
| Household Size | Family Households | Nonfamily Households |
| 1-Person Households | - | 67 (23.8%) |
| 2-Person Households | 120 (42.7%) | 4 (1.4%) |
| 3-Person Households | 28 (10.0%) | 0 (0.0%) |
| 4-Person Households | 52 (18.5%) | 0 (0.0%) |
| 5-Person Households | 0 (0.0%) | 0 (0.0%) |
| 6-Person Households | 10 (3.6%) | 0 (0.0%) |
| 7+ Person Households | 0 (0.0%) | 0 (0.0%) |
| Total | 210 (74.7%) | 71 (25.3%) |
Female Fertility in Trego
Fertility by Age in Trego
| Age Bracket | Women with Births | Births / 1,000 Women |
| 15 to 19 years | 0 (0.0%) | 0.0 |
| 20 to 34 years | 0 (0.0%) | 0.0 |
| 35 to 50 years | 0 (0.0%) | 0.0 |
| Total | 0 (0.0%) | 0.0 |
Fertility by Age by Marriage Status in Trego
| Age Bracket | Married | Unmarried |
| 15 to 19 years | 0 (0.0%) | 0 (0.0%) |
| 20 to 34 years | 0 (0.0%) | 0 (0.0%) |
| 35 to 50 years | 0 (0.0%) | 0 (0.0%) |
| Total | 0 (0.0%) | 0 (0.0%) |
Fertility by Education in Trego
| Educational Attainment | Women with Births | Births / 1,000 Women |
| Less than High School | 0 (0.0%) | 0.0 |
| High School Diploma | 0 (0.0%) | 0.0 |
| College or Associate's Degree | 0 (0.0%) | 0.0 |
| Bachelor's Degree | 0 (0.0%) | 0.0 |
| Graduate Degree | 0 (0.0%) | 0.0 |
| Total | 0 (0.0%) | 0.0 |
Fertility by Education by Marriage Status in Trego
| Educational Attainment | Married | Unmarried |
| Less than High School | 0 (0.0%) | 0 (0.0%) |
| High School Diploma | 0 (0.0%) | 0 (0.0%) |
| College or Associate's Degree | 0 (0.0%) | 0 (0.0%) |
| Bachelor's Degree | 0 (0.0%) | 0 (0.0%) |
| Graduate Degree | 0 (0.0%) | 0 (0.0%) |
| Total | 0 (0.0%) | 0 (0.0%) |
Employment Characteristics in Trego
Employment by Class of Employer in Trego
Among the 331 employed individuals in Trego, private company employees (184 | 55.6%), self-employed (not incorporated) (47 | 14.2%), and state government employees (30 | 9.1%) make up the most common classes of employment.
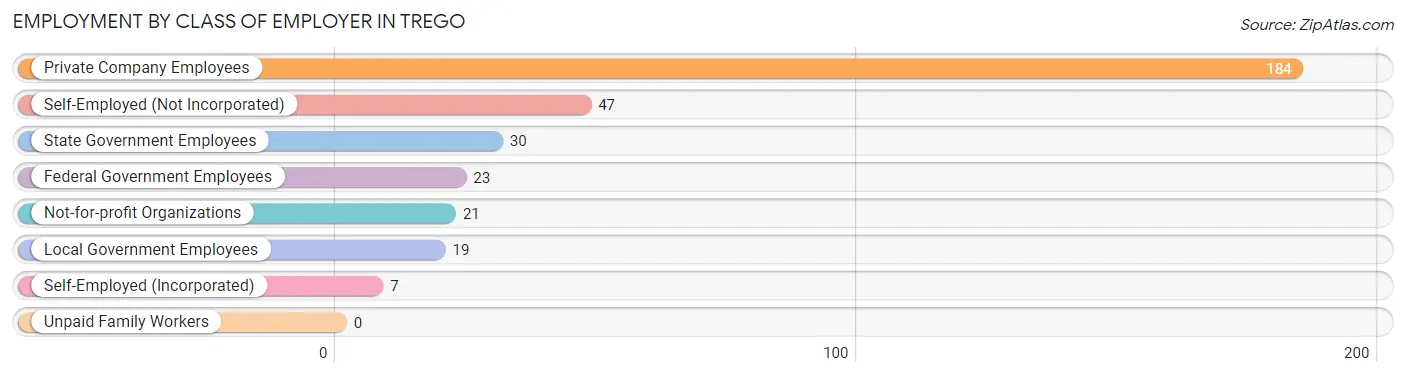
| Employer Class | # Employees | % Employees |
| Private Company Employees | 184 | 55.6% |
| Self-Employed (Incorporated) | 7 | 2.1% |
| Self-Employed (Not Incorporated) | 47 | 14.2% |
| Not-for-profit Organizations | 21 | 6.3% |
| Local Government Employees | 19 | 5.7% |
| State Government Employees | 30 | 9.1% |
| Federal Government Employees | 23 | 7.0% |
| Unpaid Family Workers | 0 | 0.0% |
| Total | 331 | 100.0% |
Employment Status by Age in Trego
According to the labor force statistics for Trego, out of the total population over 16 years of age (578), 60.4% or 349 individuals are in the labor force, with 0.6% or 2 of them unemployed. The age group with the highest labor force participation rate is 20 to 24 years, with 100.0% or 31 individuals in the labor force. Within the labor force, the 55 to 59 years age range has the highest percentage of unemployed individuals, with 4.3% or 2 of them being unemployed.
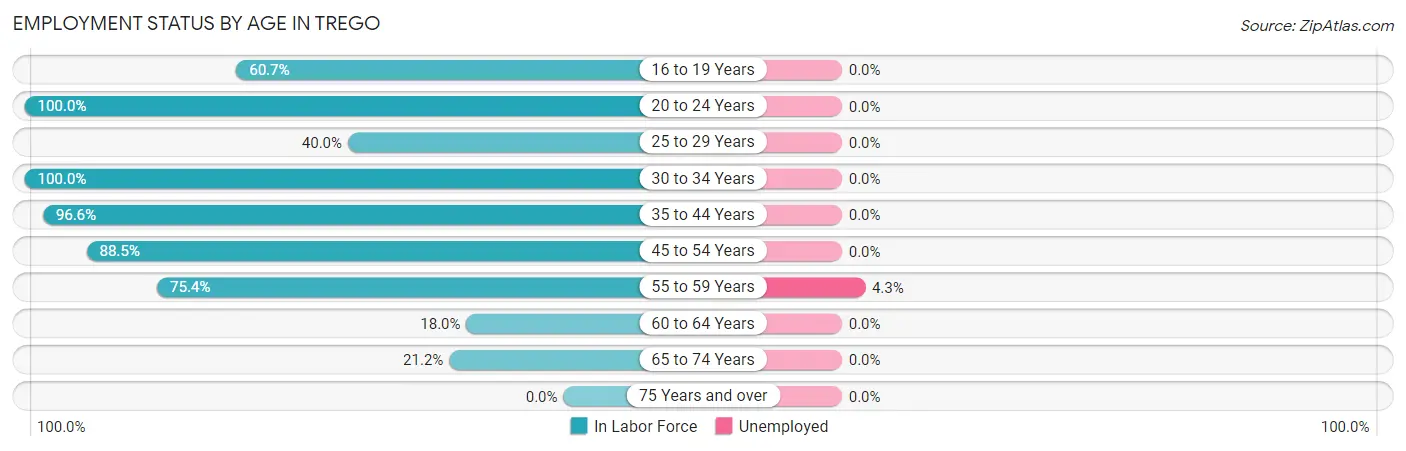
| Age Bracket | In Labor Force | Unemployed |
| 16 to 19 Years | 17 (60.7%) | 0 (0.0%) |
| 20 to 24 Years | 31 (100.0%) | 0 (0.0%) |
| 25 to 29 Years | 14 (40.0%) | 0 (0.0%) |
| 30 to 34 Years | 9 (100.0%) | 0 (0.0%) |
| 35 to 44 Years | 144 (96.6%) | 0 (0.0%) |
| 45 to 54 Years | 54 (88.5%) | 0 (0.0%) |
| 55 to 59 Years | 46 (75.4%) | 2 (4.3%) |
| 60 to 64 Years | 9 (18.0%) | 0 (0.0%) |
| 65 to 74 Years | 25 (21.2%) | 0 (0.0%) |
| 75 Years and over | 0 (0.0%) | 0 (0.0%) |
| Total | 349 (60.4%) | 2 (0.6%) |
Employment Status by Educational Attainment in Trego
According to labor force statistics for Trego, 75.6% of individuals (276) out of the total population between 25 and 64 years of age (365) are in the labor force, with 0.7% or 2 of them being unemployed. The group with the highest labor force participation rate are those with the educational attainment of bachelor's degree or higher, with 90.4% or 75 individuals in the labor force. Within the labor force, individuals with less than high school education have the highest percentage of unemployment, with 15.4% or 2 of them being unemployed.
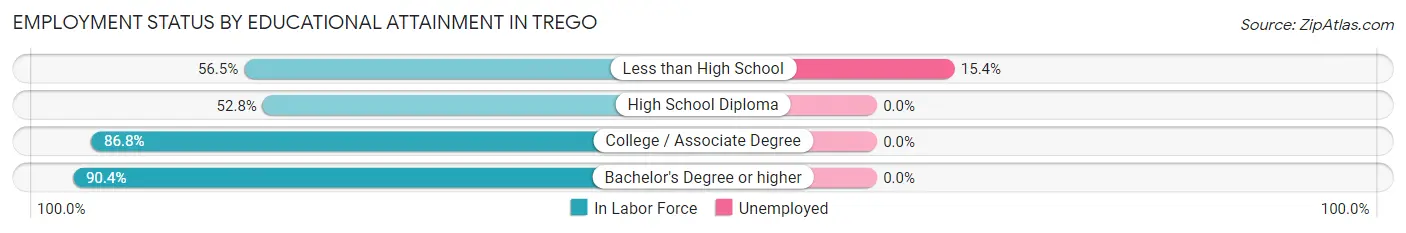
| Educational Attainment | In Labor Force | Unemployed |
| Less than High School | 13 (56.5%) | 4 (15.4%) |
| High School Diploma | 57 (52.8%) | 0 (0.0%) |
| College / Associate Degree | 131 (86.8%) | 0 (0.0%) |
| Bachelor's Degree or higher | 75 (90.4%) | 0 (0.0%) |
| Total | 276 (75.6%) | 3 (0.7%) |
Employment Occupations by Sex in Trego
Management, Business, Science and Arts Occupations
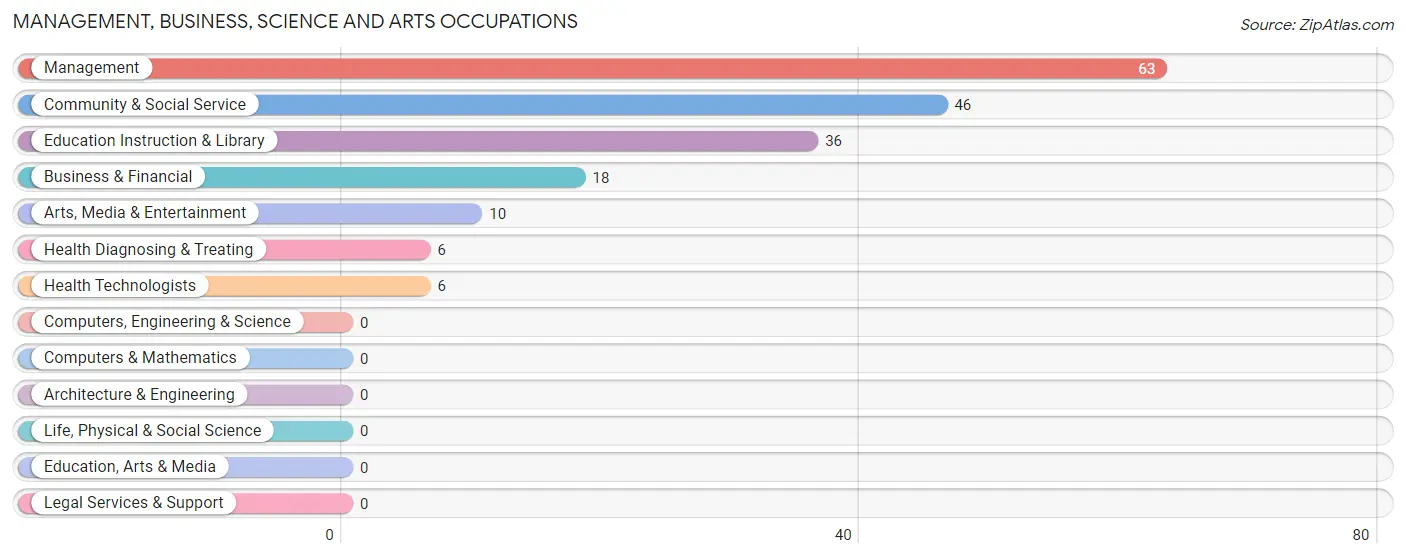
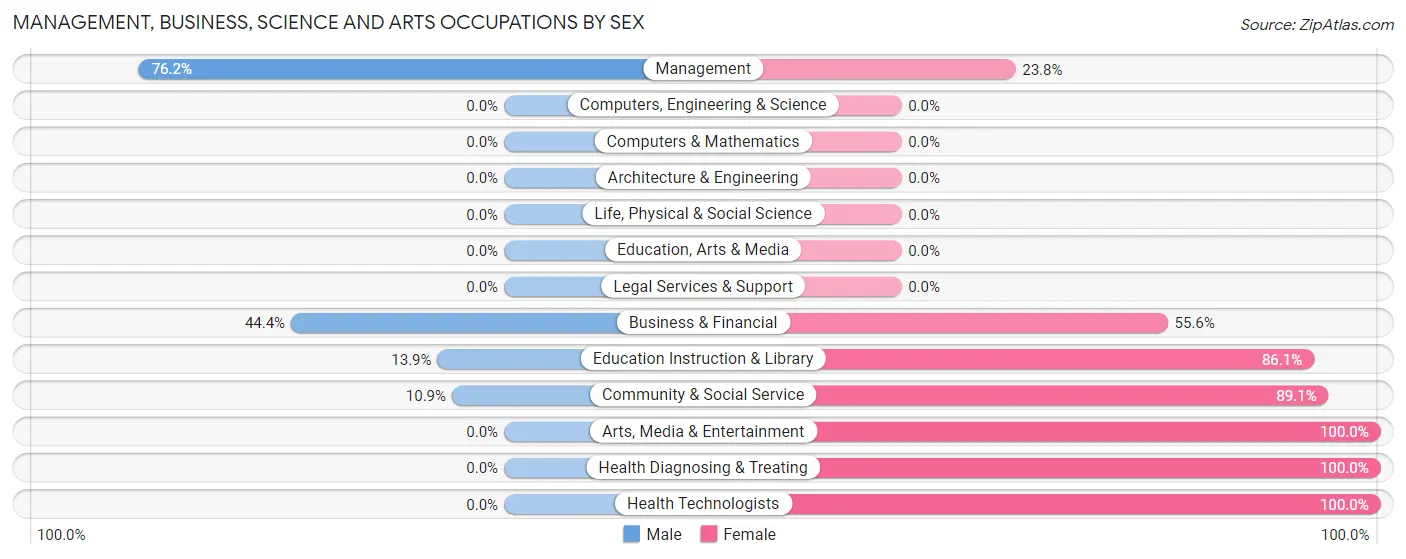
The most common Management, Business, Science and Arts occupations in Trego are Management (63 | 18.2%), Community & Social Service (46 | 13.3%), Education Instruction & Library (36 | 10.4%), Business & Financial (18 | 5.2%), and Arts, Media & Entertainment (10 | 2.9%).
Management, Business, Science and Arts Occupations by Sex
Within the Management, Business, Science and Arts occupations in Trego, the most male-oriented occupations are Management (76.2%), Business & Financial (44.4%), and Education Instruction & Library (13.9%), while the most female-oriented occupations are Arts, Media & Entertainment (100.0%), Health Diagnosing & Treating (100.0%), and Health Technologists (100.0%).
| Occupation | Male | Female |
| Management | 48 (76.2%) | 15 (23.8%) |
| Business & Financial | 8 (44.4%) | 10 (55.6%) |
| Computers, Engineering & Science | 0 (0.0%) | 0 (0.0%) |
| Computers & Mathematics | 0 (0.0%) | 0 (0.0%) |
| Architecture & Engineering | 0 (0.0%) | 0 (0.0%) |
| Life, Physical & Social Science | 0 (0.0%) | 0 (0.0%) |
| Community & Social Service | 5 (10.9%) | 41 (89.1%) |
| Education, Arts & Media | 0 (0.0%) | 0 (0.0%) |
| Legal Services & Support | 0 (0.0%) | 0 (0.0%) |
| Education Instruction & Library | 5 (13.9%) | 31 (86.1%) |
| Arts, Media & Entertainment | 0 (0.0%) | 10 (100.0%) |
| Health Diagnosing & Treating | 0 (0.0%) | 6 (100.0%) |
| Health Technologists | 0 (0.0%) | 6 (100.0%) |
| Total (Category) | 61 (45.9%) | 72 (54.1%) |
| Total (Overall) | 179 (51.6%) | 168 (48.4%) |
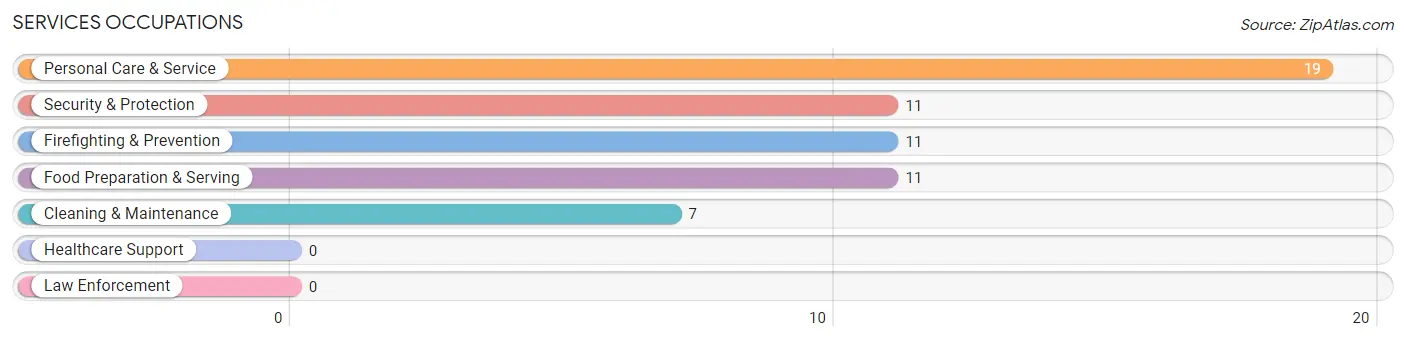
Services Occupations
The most common Services occupations in Trego are Personal Care & Service (19 | 5.5%), Security & Protection (11 | 3.2%), Firefighting & Prevention (11 | 3.2%), Food Preparation & Serving (11 | 3.2%), and Cleaning & Maintenance (7 | 2.0%).
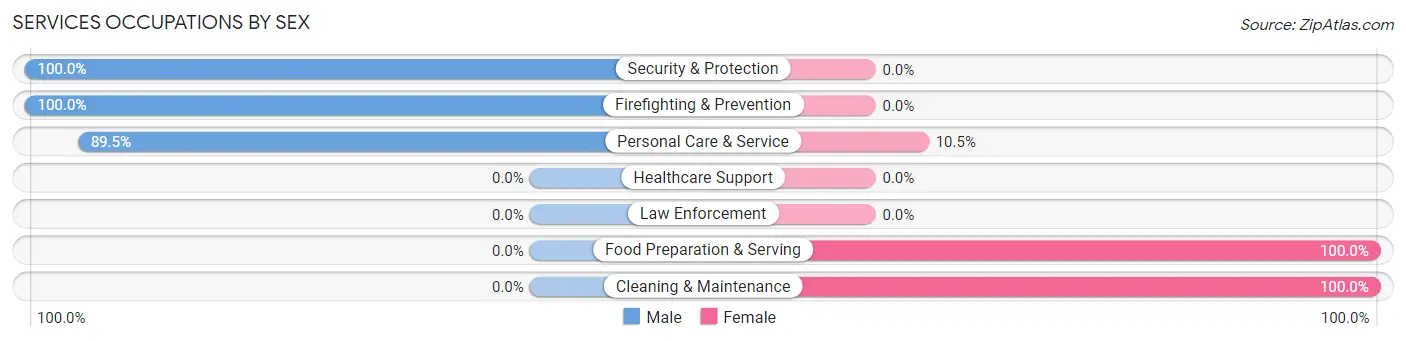
Services Occupations by Sex
Within the Services occupations in Trego, the most male-oriented occupations are Security & Protection (100.0%), Firefighting & Prevention (100.0%), and Personal Care & Service (89.5%), while the most female-oriented occupations are Food Preparation & Serving (100.0%), Cleaning & Maintenance (100.0%), and Personal Care & Service (10.5%).
| Occupation | Male | Female |
| Healthcare Support | 0 (0.0%) | 0 (0.0%) |
| Security & Protection | 11 (100.0%) | 0 (0.0%) |
| Firefighting & Prevention | 11 (100.0%) | 0 (0.0%) |
| Law Enforcement | 0 (0.0%) | 0 (0.0%) |
| Food Preparation & Serving | 0 (0.0%) | 11 (100.0%) |
| Cleaning & Maintenance | 0 (0.0%) | 7 (100.0%) |
| Personal Care & Service | 17 (89.5%) | 2 (10.5%) |
| Total (Category) | 28 (58.3%) | 20 (41.7%) |
| Total (Overall) | 179 (51.6%) | 168 (48.4%) |
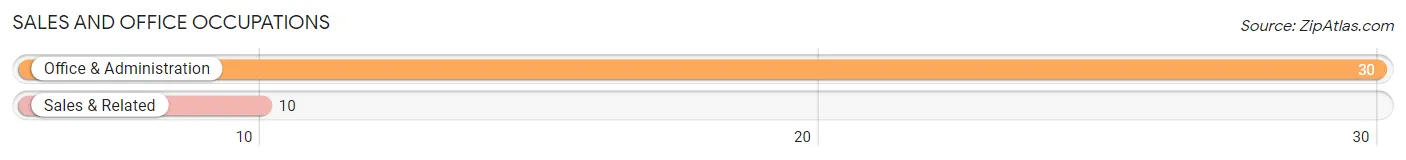
Sales and Office Occupations
The most common Sales and Office occupations in Trego are Office & Administration (30 | 8.6%), and Sales & Related (10 | 2.9%).
Sales and Office Occupations by Sex
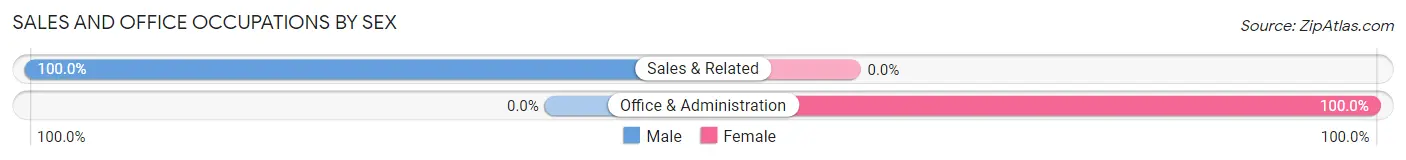
| Occupation | Male | Female |
| Sales & Related | 10 (100.0%) | 0 (0.0%) |
| Office & Administration | 0 (0.0%) | 30 (100.0%) |
| Total (Category) | 10 (25.0%) | 30 (75.0%) |
| Total (Overall) | 179 (51.6%) | 168 (48.4%) |
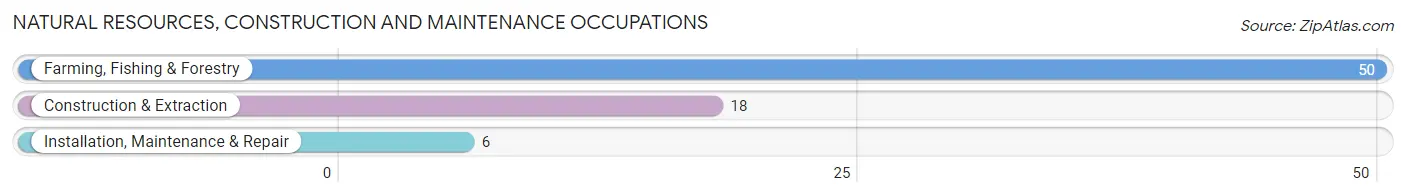
Natural Resources, Construction and Maintenance Occupations
The most common Natural Resources, Construction and Maintenance occupations in Trego are Farming, Fishing & Forestry (50 | 14.4%), Construction & Extraction (18 | 5.2%), and Installation, Maintenance & Repair (6 | 1.7%).
Natural Resources, Construction and Maintenance Occupations by Sex
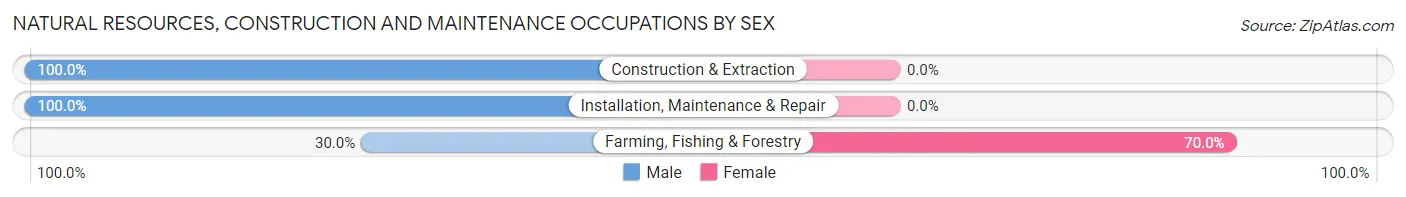
| Occupation | Male | Female |
| Farming, Fishing & Forestry | 15 (30.0%) | 35 (70.0%) |
| Construction & Extraction | 18 (100.0%) | 0 (0.0%) |
| Installation, Maintenance & Repair | 6 (100.0%) | 0 (0.0%) |
| Total (Category) | 39 (52.7%) | 35 (47.3%) |
| Total (Overall) | 179 (51.6%) | 168 (48.4%) |
Production, Transportation and Moving Occupations
The most common Production, Transportation and Moving occupations in Trego are Production (31 | 8.9%), Material Moving (16 | 4.6%), and Transportation (5 | 1.4%).
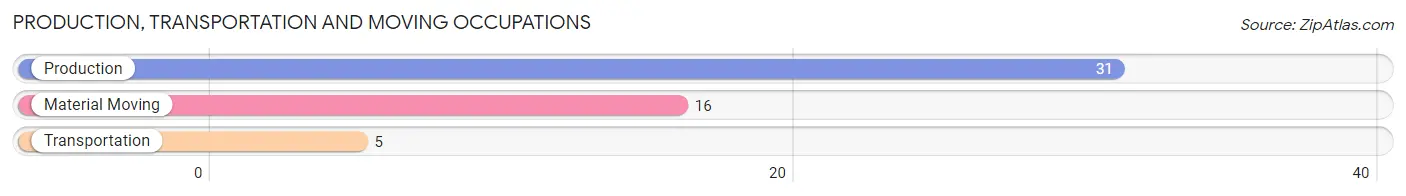
Production, Transportation and Moving Occupations by Sex
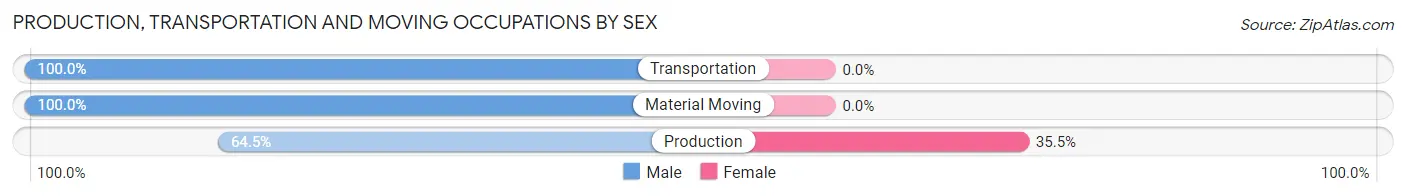
| Occupation | Male | Female |
| Production | 20 (64.5%) | 11 (35.5%) |
| Transportation | 5 (100.0%) | 0 (0.0%) |
| Material Moving | 16 (100.0%) | 0 (0.0%) |
| Total (Category) | 41 (78.8%) | 11 (21.1%) |
| Total (Overall) | 179 (51.6%) | 168 (48.4%) |
Employment Industries by Sex in Trego
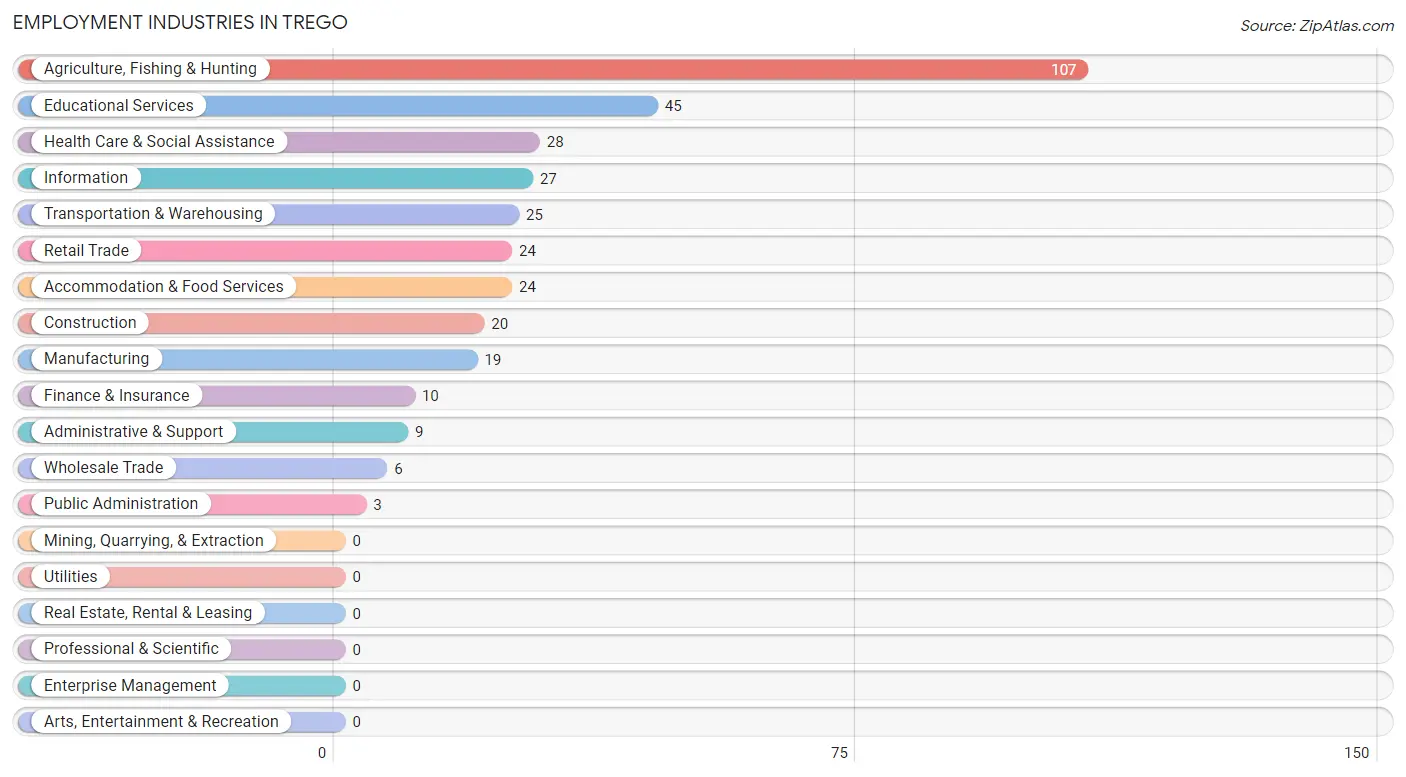
Employment Industries in Trego
The major employment industries in Trego include Agriculture, Fishing & Hunting (107 | 30.8%), Educational Services (45 | 13.0%), Health Care & Social Assistance (28 | 8.1%), Information (27 | 7.8%), and Transportation & Warehousing (25 | 7.2%).
Employment Industries by Sex in Trego
The Trego industries that see more men than women are Manufacturing (100.0%), Wholesale Trade (100.0%), and Transportation & Warehousing (88.0%), whereas the industries that tend to have a higher number of women are Finance & Insurance (100.0%), Administrative & Support (100.0%), and Public Administration (100.0%).
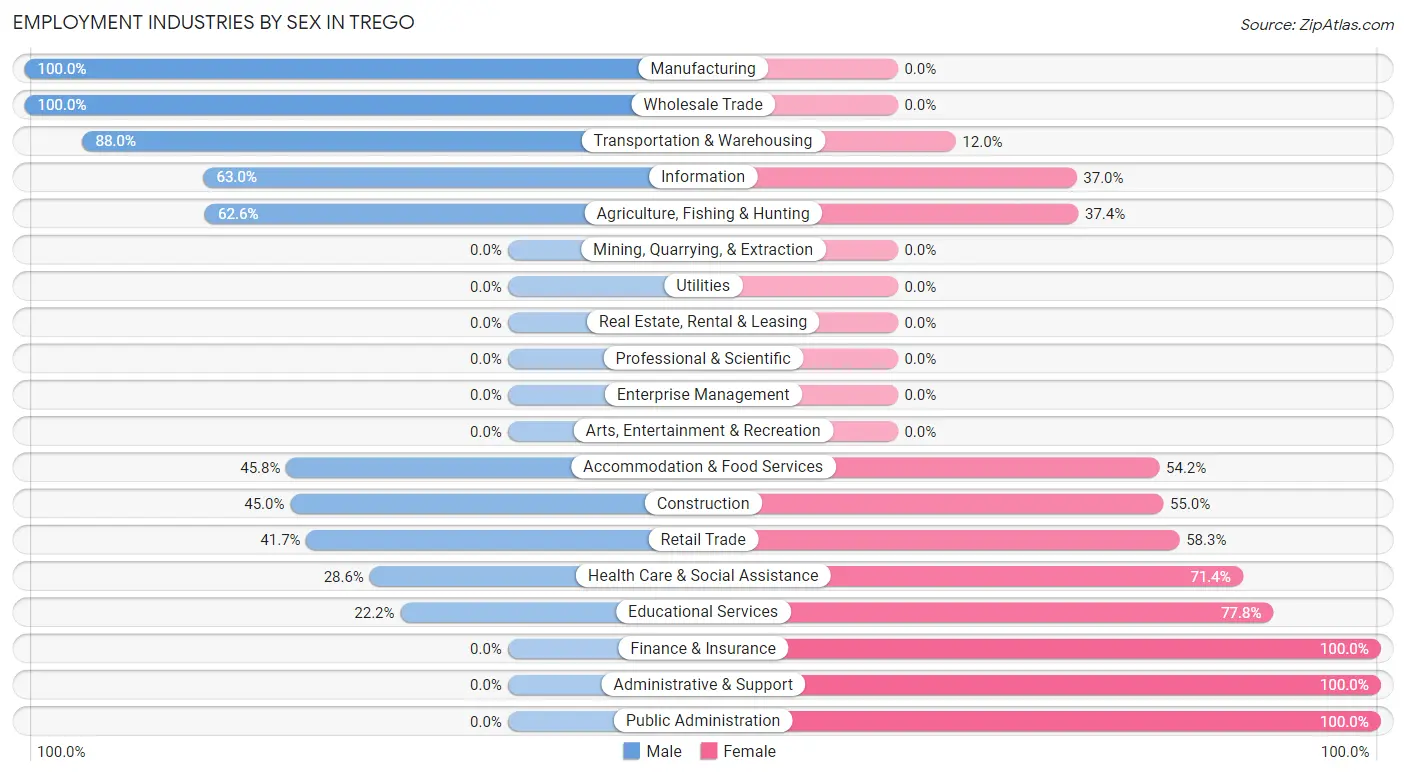
| Industry | Male | Female |
| Agriculture, Fishing & Hunting | 67 (62.6%) | 40 (37.4%) |
| Mining, Quarrying, & Extraction | 0 (0.0%) | 0 (0.0%) |
| Construction | 9 (45.0%) | 11 (55.0%) |
| Manufacturing | 19 (100.0%) | 0 (0.0%) |
| Wholesale Trade | 6 (100.0%) | 0 (0.0%) |
| Retail Trade | 10 (41.7%) | 14 (58.3%) |
| Transportation & Warehousing | 22 (88.0%) | 3 (12.0%) |
| Utilities | 0 (0.0%) | 0 (0.0%) |
| Information | 17 (63.0%) | 10 (37.0%) |
| Finance & Insurance | 0 (0.0%) | 10 (100.0%) |
| Real Estate, Rental & Leasing | 0 (0.0%) | 0 (0.0%) |
| Professional & Scientific | 0 (0.0%) | 0 (0.0%) |
| Enterprise Management | 0 (0.0%) | 0 (0.0%) |
| Administrative & Support | 0 (0.0%) | 9 (100.0%) |
| Educational Services | 10 (22.2%) | 35 (77.8%) |
| Health Care & Social Assistance | 8 (28.6%) | 20 (71.4%) |
| Arts, Entertainment & Recreation | 0 (0.0%) | 0 (0.0%) |
| Accommodation & Food Services | 11 (45.8%) | 13 (54.2%) |
| Public Administration | 0 (0.0%) | 3 (100.0%) |
| Total | 179 (51.6%) | 168 (48.4%) |
Education in Trego
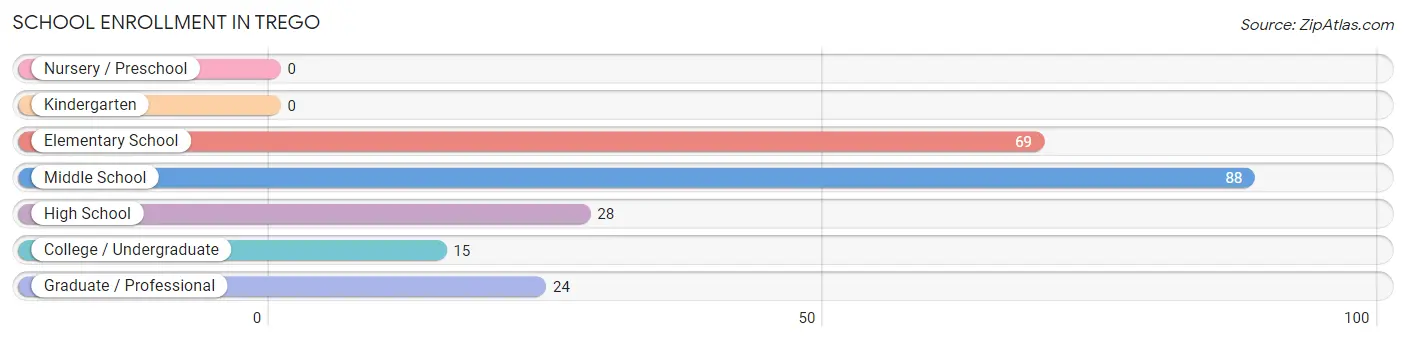
School Enrollment in Trego
The most common levels of schooling among the 224 students in Trego are middle school (88 | 39.3%), elementary school (69 | 30.8%), and high school (28 | 12.5%).
| School Level | # Students | % Students |
| Nursery / Preschool | 0 | 0.0% |
| Kindergarten | 0 | 0.0% |
| Elementary School | 69 | 30.8% |
| Middle School | 88 | 39.3% |
| High School | 28 | 12.5% |
| College / Undergraduate | 15 | 6.7% |
| Graduate / Professional | 24 | 10.7% |
| Total | 224 | 100.0% |
School Enrollment by Age by Funding Source in Trego
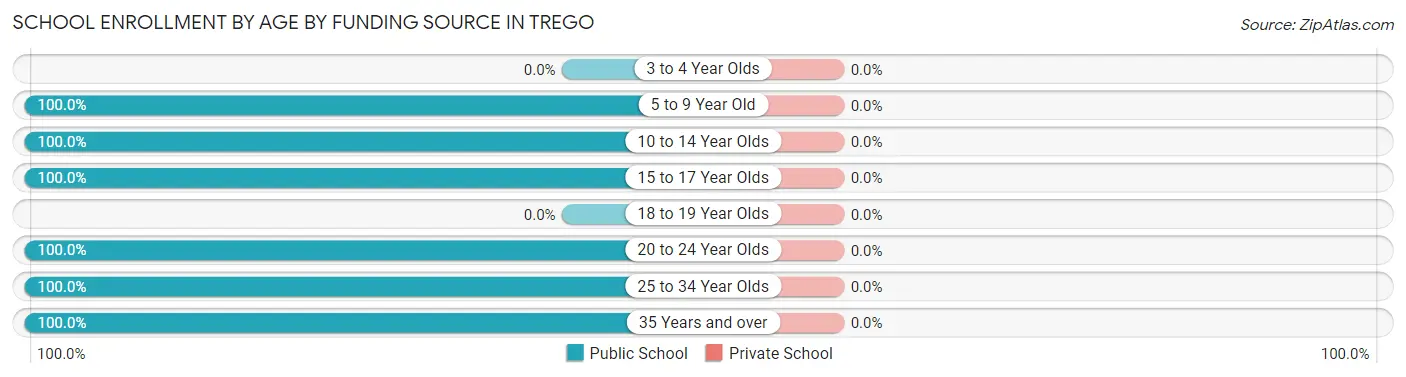
| Age Bracket | Public School | Private School |
| 3 to 4 Year Olds | 0 (0.0%) | 0 (0.0%) |
| 5 to 9 Year Old | 65 (100.0%) | 0 (0.0%) |
| 10 to 14 Year Olds | 92 (100.0%) | 0 (0.0%) |
| 15 to 17 Year Olds | 24 (100.0%) | 0 (0.0%) |
| 18 to 19 Year Olds | 0 (0.0%) | 0 (0.0%) |
| 20 to 24 Year Olds | 2 (100.0%) | 0 (0.0%) |
| 25 to 34 Year Olds | 14 (100.0%) | 0 (0.0%) |
| 35 Years and over | 27 (100.0%) | 0 (0.0%) |
| Total | 224 (100.0%) | 0 (0.0%) |
Educational Attainment by Field of Study in Trego
Education (43 | 28.5%), bio, nature & agricultural (22 | 14.6%), engineering (18 | 11.9%), science & technology (18 | 11.9%), and business (13 | 8.6%) are the most common fields of study among 151 individuals in Trego who have obtained a bachelor's degree or higher.
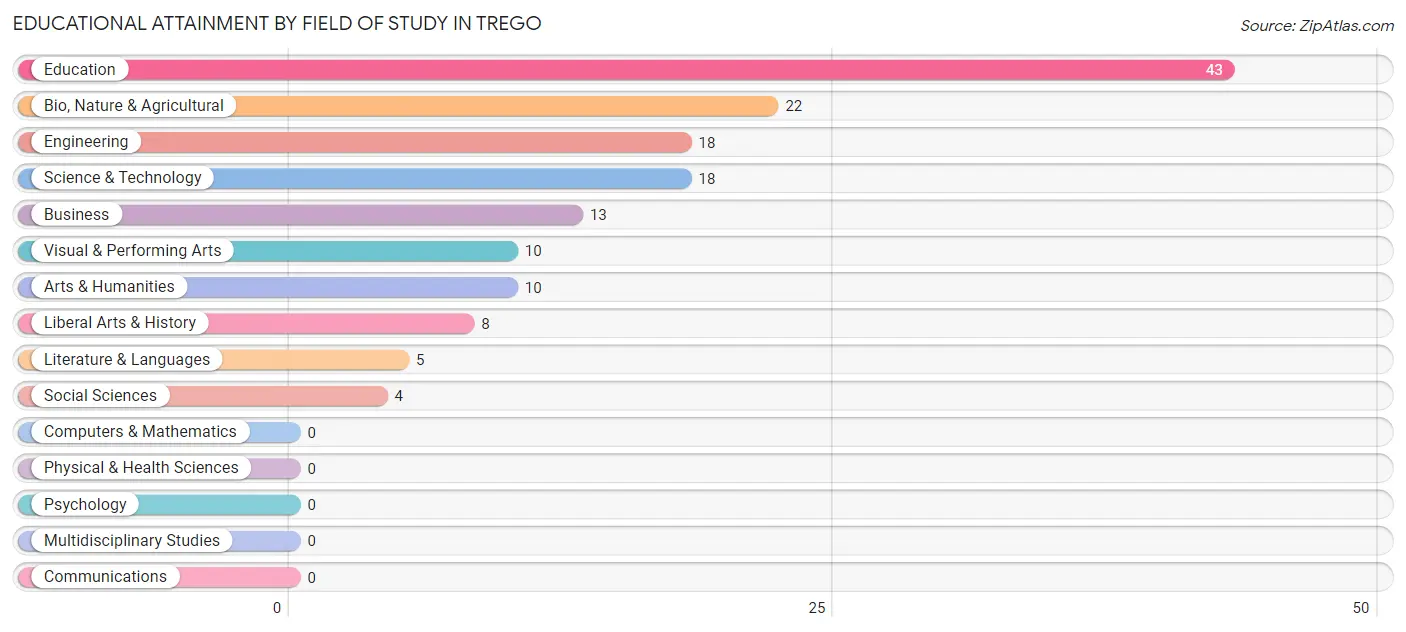
| Field of Study | # Graduates | % Graduates |
| Computers & Mathematics | 0 | 0.0% |
| Bio, Nature & Agricultural | 22 | 14.6% |
| Physical & Health Sciences | 0 | 0.0% |
| Psychology | 0 | 0.0% |
| Social Sciences | 4 | 2.6% |
| Engineering | 18 | 11.9% |
| Multidisciplinary Studies | 0 | 0.0% |
| Science & Technology | 18 | 11.9% |
| Business | 13 | 8.6% |
| Education | 43 | 28.5% |
| Literature & Languages | 5 | 3.3% |
| Liberal Arts & History | 8 | 5.3% |
| Visual & Performing Arts | 10 | 6.6% |
| Communications | 0 | 0.0% |
| Arts & Humanities | 10 | 6.6% |
| Total | 151 | 100.0% |
Transportation & Commute in Trego
Vehicle Availability by Sex in Trego
The most prevalent vehicle ownership categories in Trego are males with 2 vehicles (71, accounting for 40.1%) and females with 2 vehicles (50, making up 48.3%).
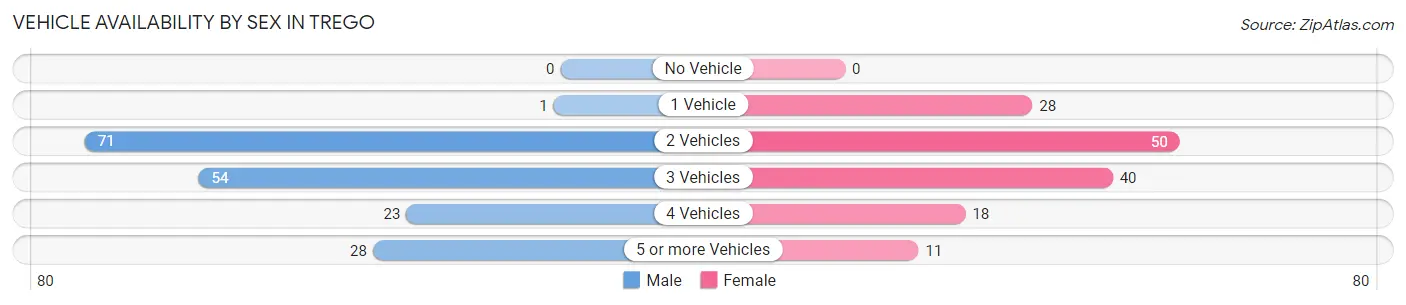
| Vehicles Available | Male | Female |
| No Vehicle | 0 (0.0%) | 0 (0.0%) |
| 1 Vehicle | 1 (0.6%) | 28 (19.1%) |
| 2 Vehicles | 71 (40.1%) | 50 (34.0%) |
| 3 Vehicles | 54 (30.5%) | 40 (27.2%) |
| 4 Vehicles | 23 (13.0%) | 18 (12.2%) |
| 5 or more Vehicles | 28 (15.8%) | 11 (7.5%) |
| Total | 177 (100.0%) | 147 (100.0%) |
Commute Time in Trego
The most frequently occuring commute durations in Trego are less than 5 minutes (72 commuters, 24.1%), 30 to 34 minutes (68 commuters, 22.7%), and 15 to 19 minutes (42 commuters, 14.1%).
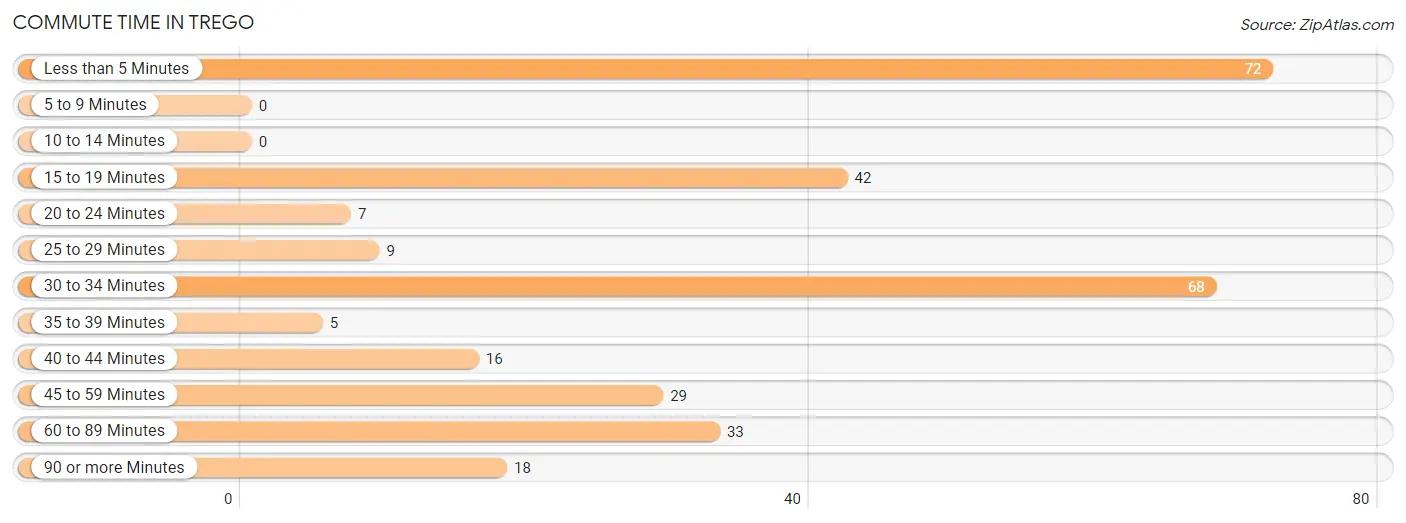
| Commute Time | # Commuters | % Commuters |
| Less than 5 Minutes | 72 | 24.1% |
| 5 to 9 Minutes | 0 | 0.0% |
| 10 to 14 Minutes | 0 | 0.0% |
| 15 to 19 Minutes | 42 | 14.1% |
| 20 to 24 Minutes | 7 | 2.3% |
| 25 to 29 Minutes | 9 | 3.0% |
| 30 to 34 Minutes | 68 | 22.7% |
| 35 to 39 Minutes | 5 | 1.7% |
| 40 to 44 Minutes | 16 | 5.3% |
| 45 to 59 Minutes | 29 | 9.7% |
| 60 to 89 Minutes | 33 | 11.0% |
| 90 or more Minutes | 18 | 6.0% |
Commute Time by Sex in Trego
The most common commute times in Trego are 30 to 34 minutes (49 commuters, 28.6%) for males and 15 to 19 minutes (37 commuters, 28.9%) for females.
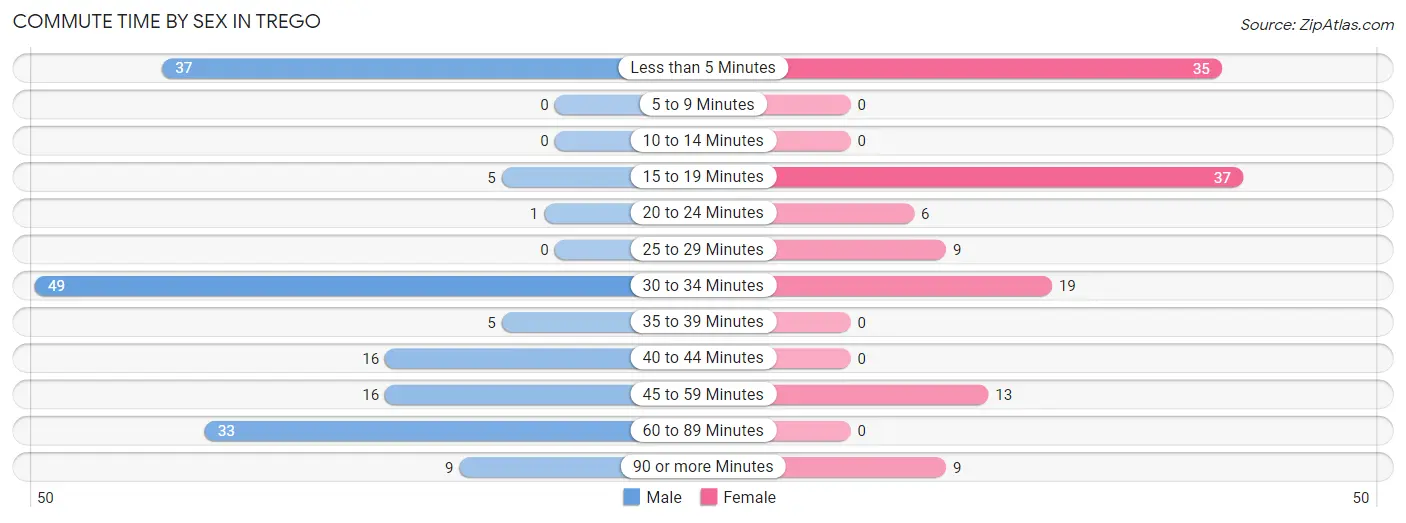
| Commute Time | Male | Female |
| Less than 5 Minutes | 37 (21.6%) | 35 (27.3%) |
| 5 to 9 Minutes | 0 (0.0%) | 0 (0.0%) |
| 10 to 14 Minutes | 0 (0.0%) | 0 (0.0%) |
| 15 to 19 Minutes | 5 (2.9%) | 37 (28.9%) |
| 20 to 24 Minutes | 1 (0.6%) | 6 (4.7%) |
| 25 to 29 Minutes | 0 (0.0%) | 9 (7.0%) |
| 30 to 34 Minutes | 49 (28.6%) | 19 (14.8%) |
| 35 to 39 Minutes | 5 (2.9%) | 0 (0.0%) |
| 40 to 44 Minutes | 16 (9.4%) | 0 (0.0%) |
| 45 to 59 Minutes | 16 (9.4%) | 13 (10.2%) |
| 60 to 89 Minutes | 33 (19.3%) | 0 (0.0%) |
| 90 or more Minutes | 9 (5.3%) | 9 (7.0%) |
Time of Departure to Work by Sex in Trego
The most frequent times of departure to work in Trego are 6:00 AM to 6:29 AM (43, 25.2%) for males and 7:30 AM to 7:59 AM (58, 45.3%) for females.
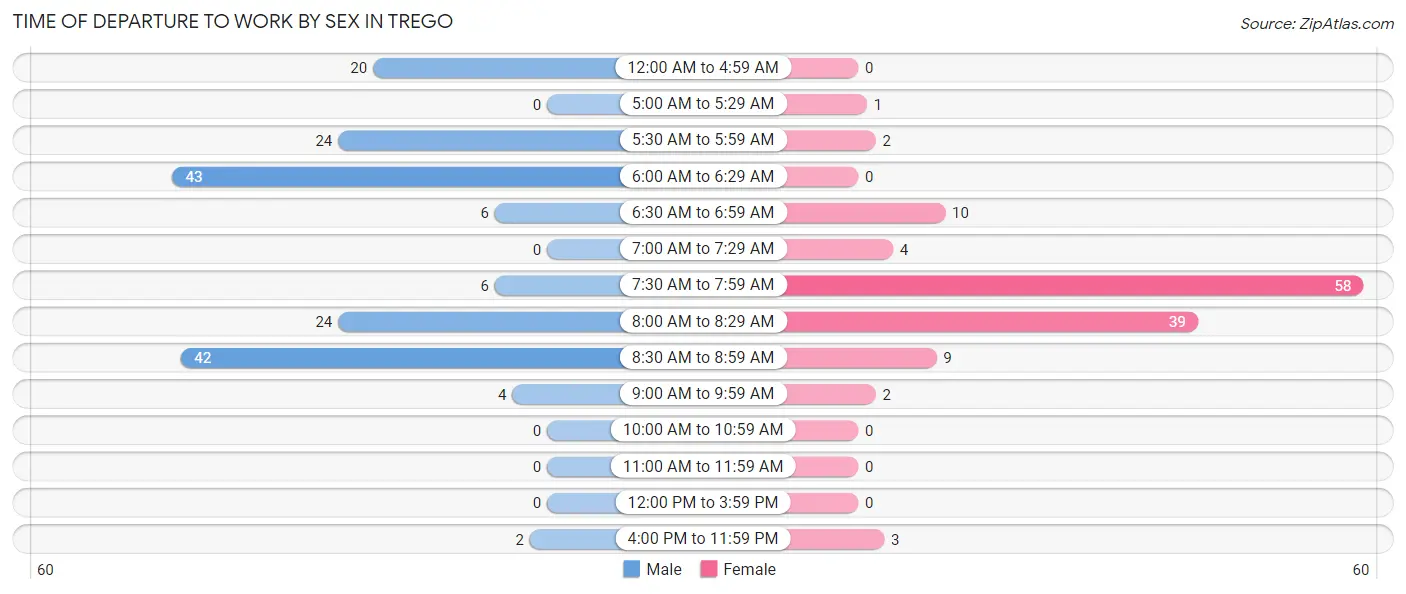
| Time of Departure | Male | Female |
| 12:00 AM to 4:59 AM | 20 (11.7%) | 0 (0.0%) |
| 5:00 AM to 5:29 AM | 0 (0.0%) | 1 (0.8%) |
| 5:30 AM to 5:59 AM | 24 (14.0%) | 2 (1.6%) |
| 6:00 AM to 6:29 AM | 43 (25.2%) | 0 (0.0%) |
| 6:30 AM to 6:59 AM | 6 (3.5%) | 10 (7.8%) |
| 7:00 AM to 7:29 AM | 0 (0.0%) | 4 (3.1%) |
| 7:30 AM to 7:59 AM | 6 (3.5%) | 58 (45.3%) |
| 8:00 AM to 8:29 AM | 24 (14.0%) | 39 (30.5%) |
| 8:30 AM to 8:59 AM | 42 (24.6%) | 9 (7.0%) |
| 9:00 AM to 9:59 AM | 4 (2.3%) | 2 (1.6%) |
| 10:00 AM to 10:59 AM | 0 (0.0%) | 0 (0.0%) |
| 11:00 AM to 11:59 AM | 0 (0.0%) | 0 (0.0%) |
| 12:00 PM to 3:59 PM | 0 (0.0%) | 0 (0.0%) |
| 4:00 PM to 11:59 PM | 2 (1.2%) | 3 (2.3%) |
| Total | 171 (100.0%) | 128 (100.0%) |
Housing Occupancy in Trego
Occupancy by Ownership in Trego
Of the total 281 dwellings in Trego, owner-occupied units account for 207 (73.7%), while renter-occupied units make up 74 (26.3%).
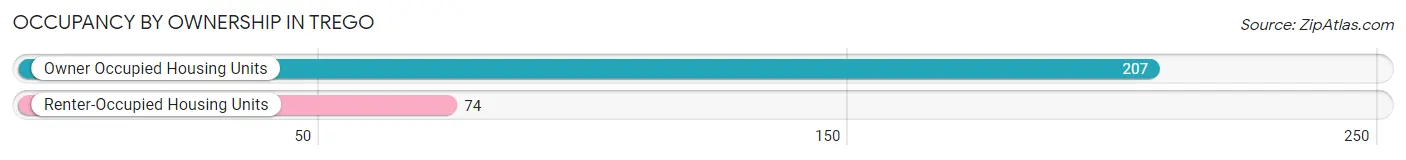
| Occupancy | # Housing Units | % Housing Units |
| Owner Occupied Housing Units | 207 | 73.7% |
| Renter-Occupied Housing Units | 74 | 26.3% |
| Total Occupied Housing Units | 281 | 100.0% |
Occupancy by Household Size in Trego
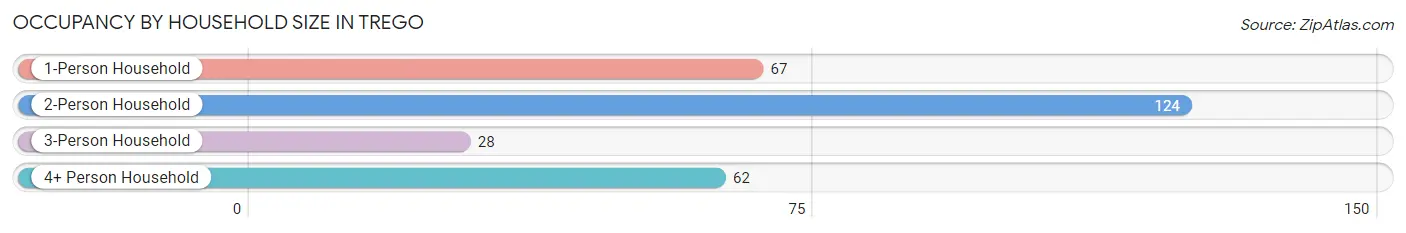
| Household Size | # Housing Units | % Housing Units |
| 1-Person Household | 67 | 23.8% |
| 2-Person Household | 124 | 44.1% |
| 3-Person Household | 28 | 10.0% |
| 4+ Person Household | 62 | 22.1% |
| Total Housing Units | 281 | 100.0% |
Occupancy by Ownership by Household Size in Trego
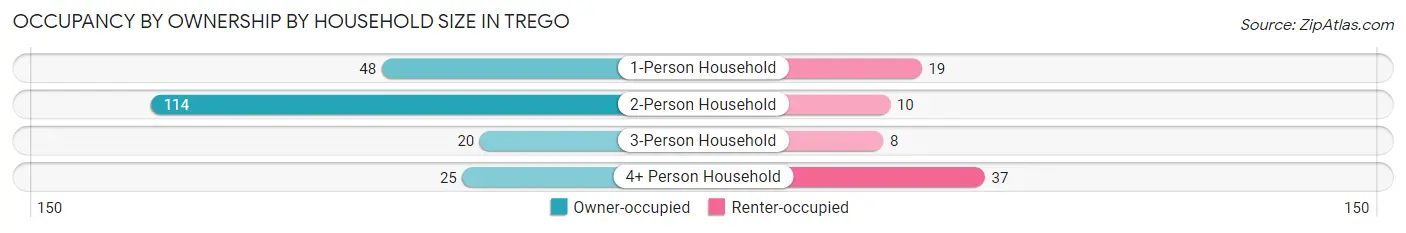
| Household Size | Owner-occupied | Renter-occupied |
| 1-Person Household | 48 (71.6%) | 19 (28.4%) |
| 2-Person Household | 114 (91.9%) | 10 (8.1%) |
| 3-Person Household | 20 (71.4%) | 8 (28.6%) |
| 4+ Person Household | 25 (40.3%) | 37 (59.7%) |
| Total Housing Units | 207 (73.7%) | 74 (26.3%) |
Occupancy by Educational Attainment in Trego
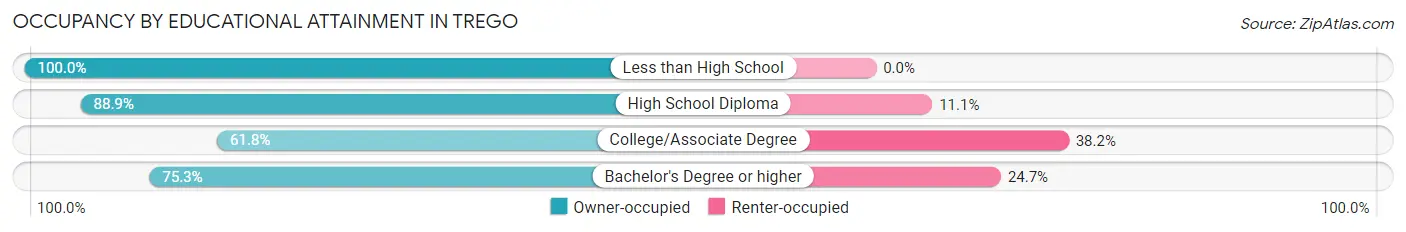
| Household Size | Owner-occupied | Renter-occupied |
| Less than High School | 2 (100.0%) | 0 (0.0%) |
| High School Diploma | 64 (88.9%) | 8 (11.1%) |
| College/Associate Degree | 68 (61.8%) | 42 (38.2%) |
| Bachelor's Degree or higher | 73 (75.3%) | 24 (24.7%) |
Occupancy by Age of Householder in Trego
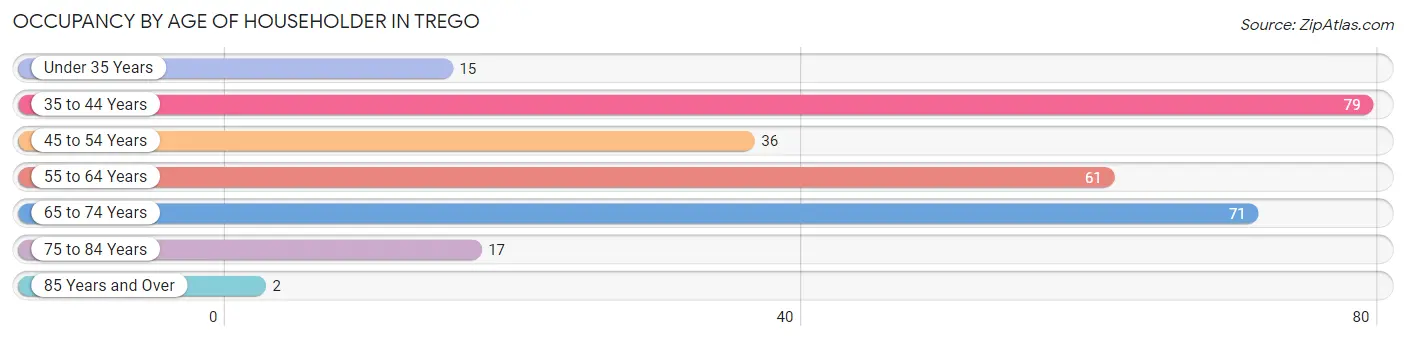
| Age Bracket | # Households | % Households |
| Under 35 Years | 15 | 5.3% |
| 35 to 44 Years | 79 | 28.1% |
| 45 to 54 Years | 36 | 12.8% |
| 55 to 64 Years | 61 | 21.7% |
| 65 to 74 Years | 71 | 25.3% |
| 75 to 84 Years | 17 | 6.0% |
| 85 Years and Over | 2 | 0.7% |
| Total | 281 | 100.0% |
Housing Finances in Trego
Median Income by Occupancy in Trego
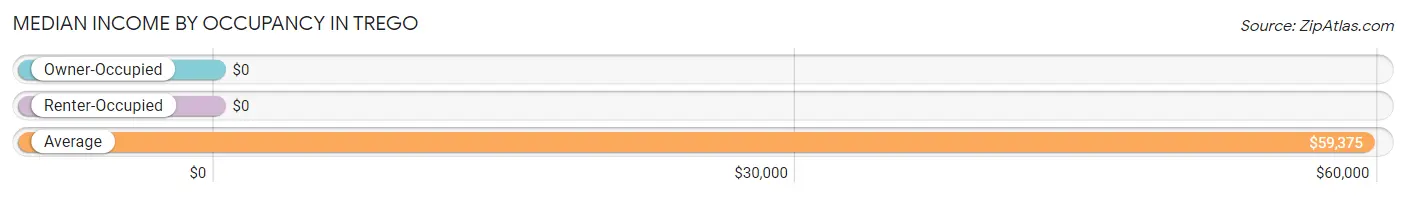
| Occupancy Type | # Households | Median Income |
| Owner-Occupied | 207 (73.7%) | $0 |
| Renter-Occupied | 74 (26.3%) | $0 |
| Average | 281 (100.0%) | $59,375 |
Occupancy by Householder Income Bracket in Trego
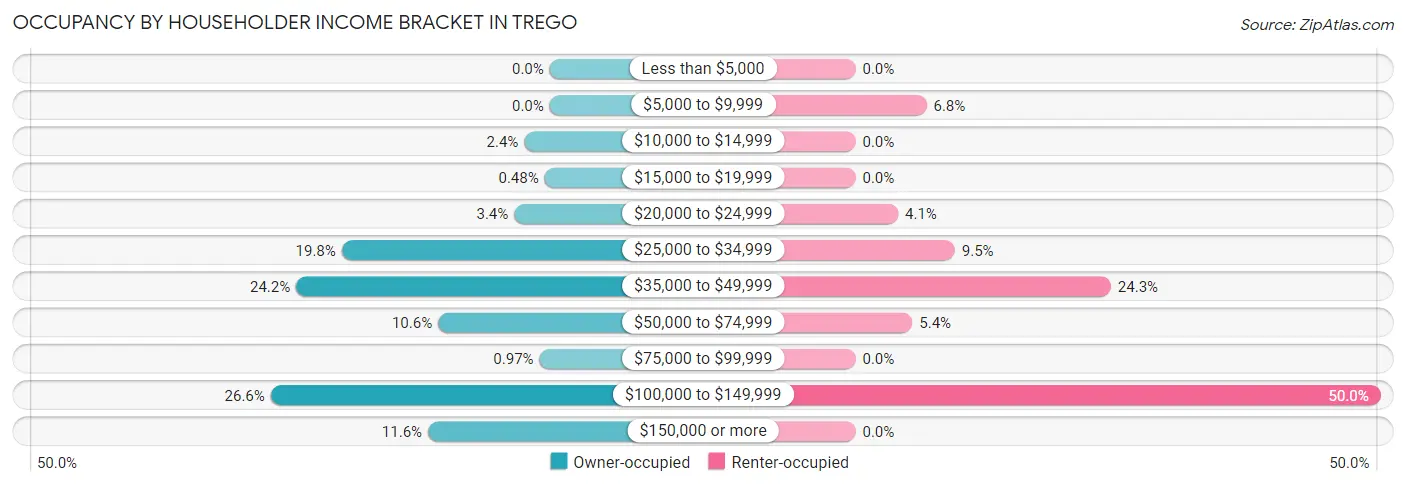
| Income Bracket | Owner-occupied | Renter-occupied |
| Less than $5,000 | 0 (0.0%) | 0 (0.0%) |
| $5,000 to $9,999 | 0 (0.0%) | 5 (6.8%) |
| $10,000 to $14,999 | 5 (2.4%) | 0 (0.0%) |
| $15,000 to $19,999 | 1 (0.5%) | 0 (0.0%) |
| $20,000 to $24,999 | 7 (3.4%) | 3 (4.1%) |
| $25,000 to $34,999 | 41 (19.8%) | 7 (9.5%) |
| $35,000 to $49,999 | 50 (24.1%) | 18 (24.3%) |
| $50,000 to $74,999 | 22 (10.6%) | 4 (5.4%) |
| $75,000 to $99,999 | 2 (1.0%) | 0 (0.0%) |
| $100,000 to $149,999 | 55 (26.6%) | 37 (50.0%) |
| $150,000 or more | 24 (11.6%) | 0 (0.0%) |
| Total | 207 (100.0%) | 74 (100.0%) |
Monthly Housing Cost Tiers in Trego
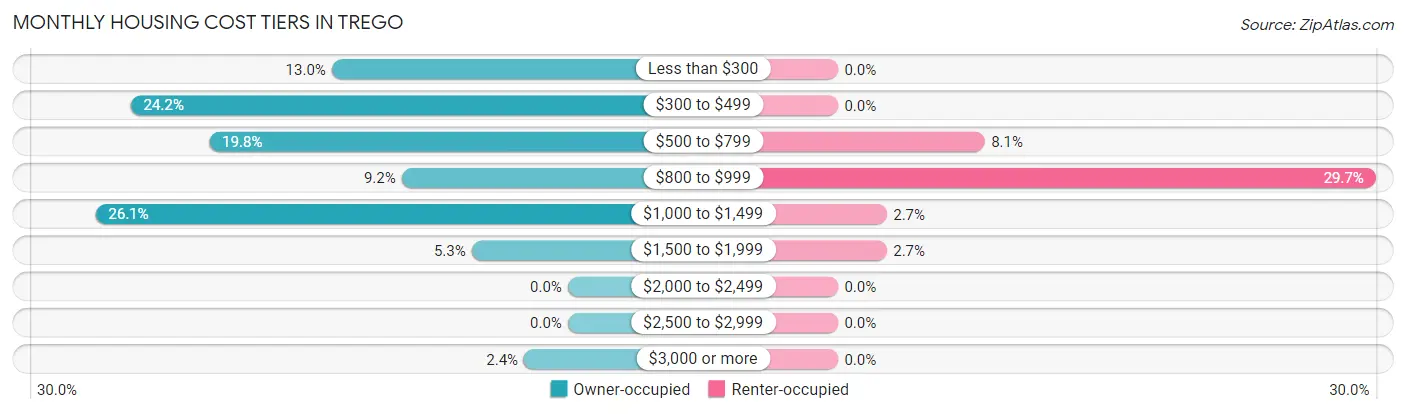
| Monthly Cost | Owner-occupied | Renter-occupied |
| Less than $300 | 27 (13.0%) | 0 (0.0%) |
| $300 to $499 | 50 (24.1%) | 0 (0.0%) |
| $500 to $799 | 41 (19.8%) | 6 (8.1%) |
| $800 to $999 | 19 (9.2%) | 22 (29.7%) |
| $1,000 to $1,499 | 54 (26.1%) | 2 (2.7%) |
| $1,500 to $1,999 | 11 (5.3%) | 2 (2.7%) |
| $2,000 to $2,499 | 0 (0.0%) | 0 (0.0%) |
| $2,500 to $2,999 | 0 (0.0%) | 0 (0.0%) |
| $3,000 or more | 5 (2.4%) | 0 (0.0%) |
| Total | 207 (100.0%) | 74 (100.0%) |
Physical Housing Characteristics in Trego
Housing Structures in Trego
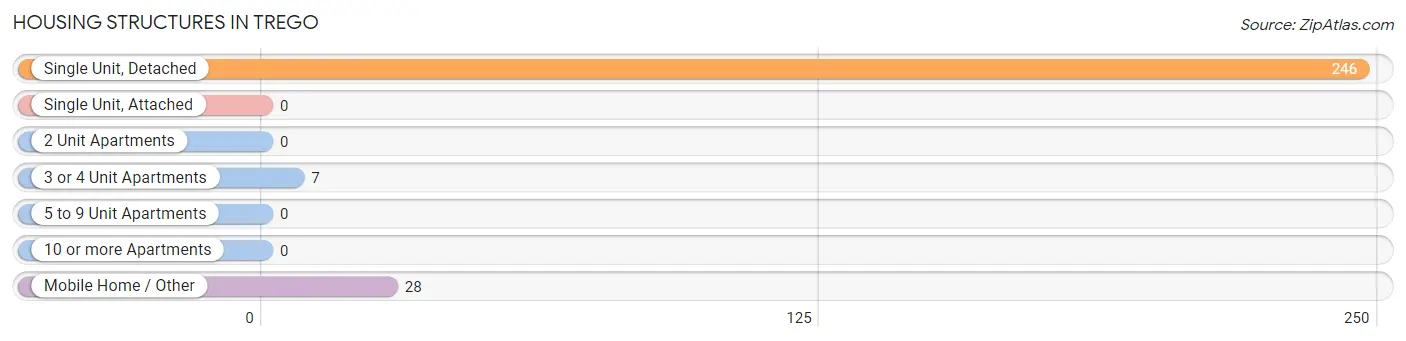
| Structure Type | # Housing Units | % Housing Units |
| Single Unit, Detached | 246 | 87.5% |
| Single Unit, Attached | 0 | 0.0% |
| 2 Unit Apartments | 0 | 0.0% |
| 3 or 4 Unit Apartments | 7 | 2.5% |
| 5 to 9 Unit Apartments | 0 | 0.0% |
| 10 or more Apartments | 0 | 0.0% |
| Mobile Home / Other | 28 | 10.0% |
| Total | 281 | 100.0% |
Housing Structures by Occupancy in Trego
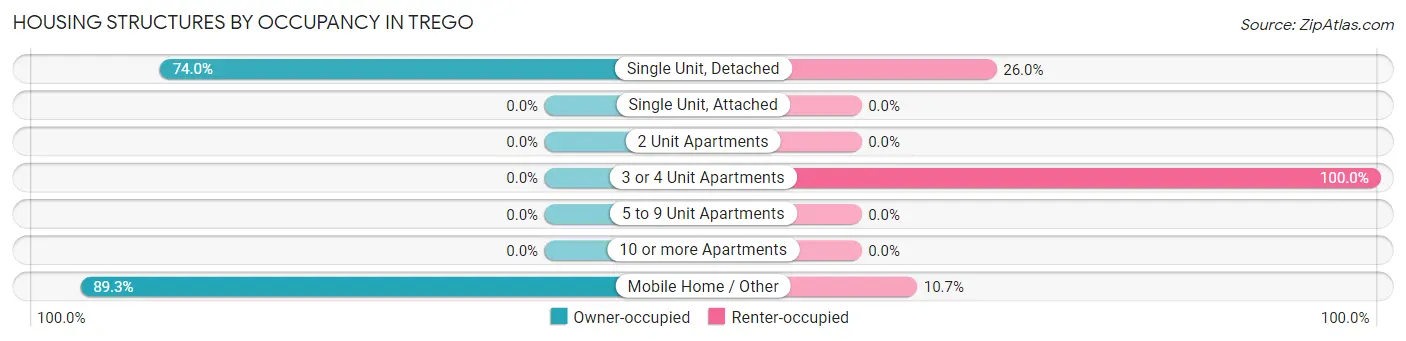
| Structure Type | Owner-occupied | Renter-occupied |
| Single Unit, Detached | 182 (74.0%) | 64 (26.0%) |
| Single Unit, Attached | 0 (0.0%) | 0 (0.0%) |
| 2 Unit Apartments | 0 (0.0%) | 0 (0.0%) |
| 3 or 4 Unit Apartments | 0 (0.0%) | 7 (100.0%) |
| 5 to 9 Unit Apartments | 0 (0.0%) | 0 (0.0%) |
| 10 or more Apartments | 0 (0.0%) | 0 (0.0%) |
| Mobile Home / Other | 25 (89.3%) | 3 (10.7%) |
| Total | 207 (73.7%) | 74 (26.3%) |
Housing Structures by Number of Rooms in Trego
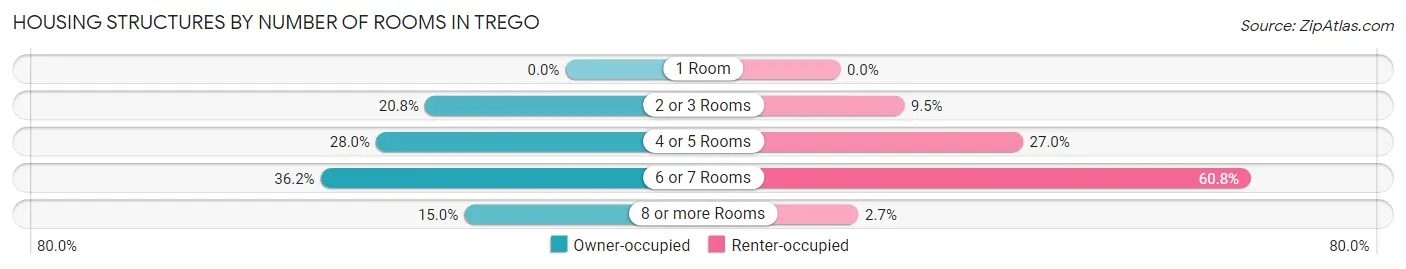
| Number of Rooms | Owner-occupied | Renter-occupied |
| 1 Room | 0 (0.0%) | 0 (0.0%) |
| 2 or 3 Rooms | 43 (20.8%) | 7 (9.5%) |
| 4 or 5 Rooms | 58 (28.0%) | 20 (27.0%) |
| 6 or 7 Rooms | 75 (36.2%) | 45 (60.8%) |
| 8 or more Rooms | 31 (15.0%) | 2 (2.7%) |
| Total | 207 (100.0%) | 74 (100.0%) |
Housing Structure by Heating Type in Trego
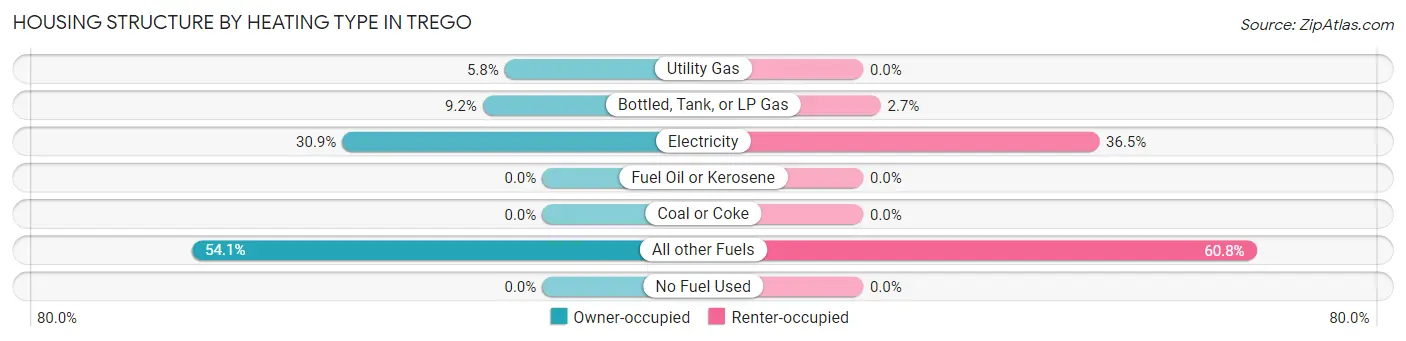
| Heating Type | Owner-occupied | Renter-occupied |
| Utility Gas | 12 (5.8%) | 0 (0.0%) |
| Bottled, Tank, or LP Gas | 19 (9.2%) | 2 (2.7%) |
| Electricity | 64 (30.9%) | 27 (36.5%) |
| Fuel Oil or Kerosene | 0 (0.0%) | 0 (0.0%) |
| Coal or Coke | 0 (0.0%) | 0 (0.0%) |
| All other Fuels | 112 (54.1%) | 45 (60.8%) |
| No Fuel Used | 0 (0.0%) | 0 (0.0%) |
| Total | 207 (100.0%) | 74 (100.0%) |
Household Vehicle Usage in Trego
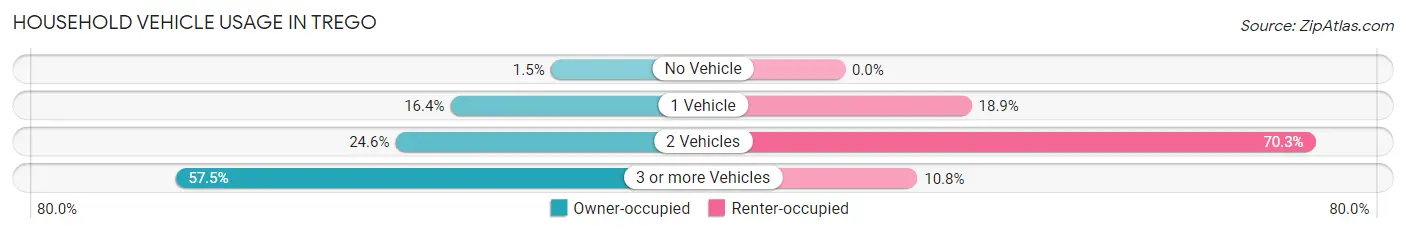
| Vehicles per Household | Owner-occupied | Renter-occupied |
| No Vehicle | 3 (1.5%) | 0 (0.0%) |
| 1 Vehicle | 34 (16.4%) | 14 (18.9%) |
| 2 Vehicles | 51 (24.6%) | 52 (70.3%) |
| 3 or more Vehicles | 119 (57.5%) | 8 (10.8%) |
| Total | 207 (100.0%) | 74 (100.0%) |
Real Estate & Mortgages in Trego
Real Estate and Mortgage Overview in Trego
| Characteristic | Without Mortgage | With Mortgage |
| Housing Units | 113 | 94 |
| Median Property Value | $293,800 | $280,000 |
| Median Household Income | - | - |
| Monthly Housing Costs | $381 | $5 |
| Real Estate Taxes | $1,244 | $2 |
Property Value by Mortgage Status in Trego
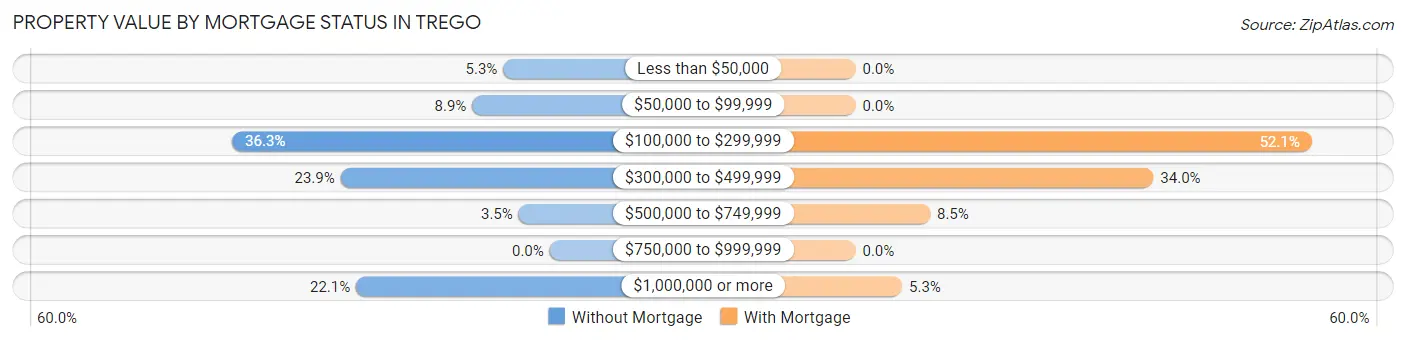
| Property Value | Without Mortgage | With Mortgage |
| Less than $50,000 | 6 (5.3%) | 0 (0.0%) |
| $50,000 to $99,999 | 10 (8.8%) | 0 (0.0%) |
| $100,000 to $299,999 | 41 (36.3%) | 49 (52.1%) |
| $300,000 to $499,999 | 27 (23.9%) | 32 (34.0%) |
| $500,000 to $749,999 | 4 (3.5%) | 8 (8.5%) |
| $750,000 to $999,999 | 0 (0.0%) | 0 (0.0%) |
| $1,000,000 or more | 25 (22.1%) | 5 (5.3%) |
| Total | 113 (100.0%) | 94 (100.0%) |
Household Income by Mortgage Status in Trego
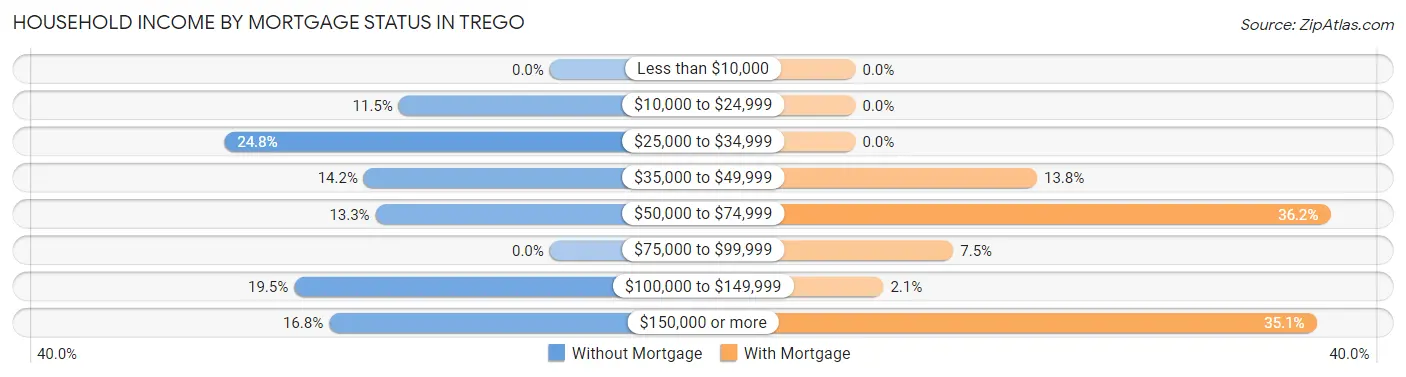
| Household Income | Without Mortgage | With Mortgage |
| Less than $10,000 | 0 (0.0%) | 0 (0.0%) |
| $10,000 to $24,999 | 13 (11.5%) | 0 (0.0%) |
| $25,000 to $34,999 | 28 (24.8%) | 0 (0.0%) |
| $35,000 to $49,999 | 16 (14.2%) | 13 (13.8%) |
| $50,000 to $74,999 | 15 (13.3%) | 34 (36.2%) |
| $75,000 to $99,999 | 0 (0.0%) | 7 (7.4%) |
| $100,000 to $149,999 | 22 (19.5%) | 2 (2.1%) |
| $150,000 or more | 19 (16.8%) | 33 (35.1%) |
| Total | 113 (100.0%) | 94 (100.0%) |
Property Value to Household Income Ratio in Trego
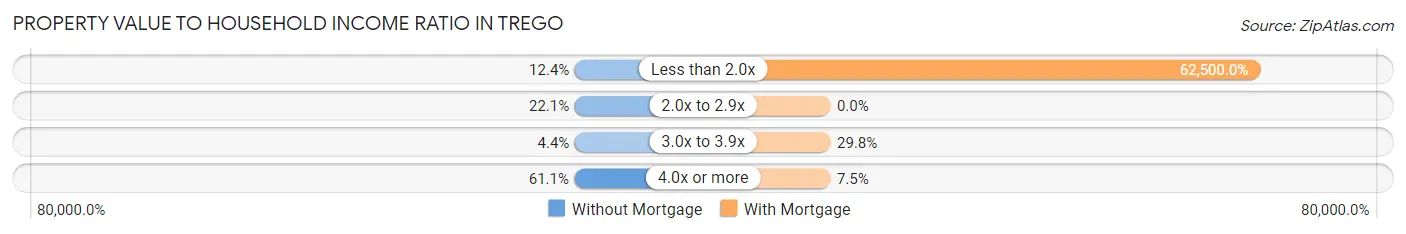
| Value-to-Income Ratio | Without Mortgage | With Mortgage |
| Less than 2.0x | 14 (12.4%) | 58,750 (62,500.0%) |
| 2.0x to 2.9x | 25 (22.1%) | 0 (0.0%) |
| 3.0x to 3.9x | 5 (4.4%) | 28 (29.8%) |
| 4.0x or more | 69 (61.1%) | 7 (7.4%) |
| Total | 113 (100.0%) | 94 (100.0%) |
Real Estate Taxes by Mortgage Status in Trego
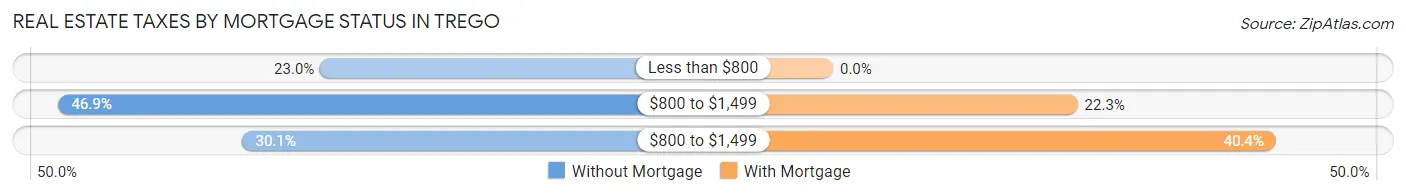
| Property Taxes | Without Mortgage | With Mortgage |
| Less than $800 | 26 (23.0%) | 0 (0.0%) |
| $800 to $1,499 | 53 (46.9%) | 21 (22.3%) |
| $800 to $1,499 | 34 (30.1%) | 38 (40.4%) |
| Total | 113 (100.0%) | 94 (100.0%) |
Health & Disability in Trego
Health Insurance Coverage by Age in Trego
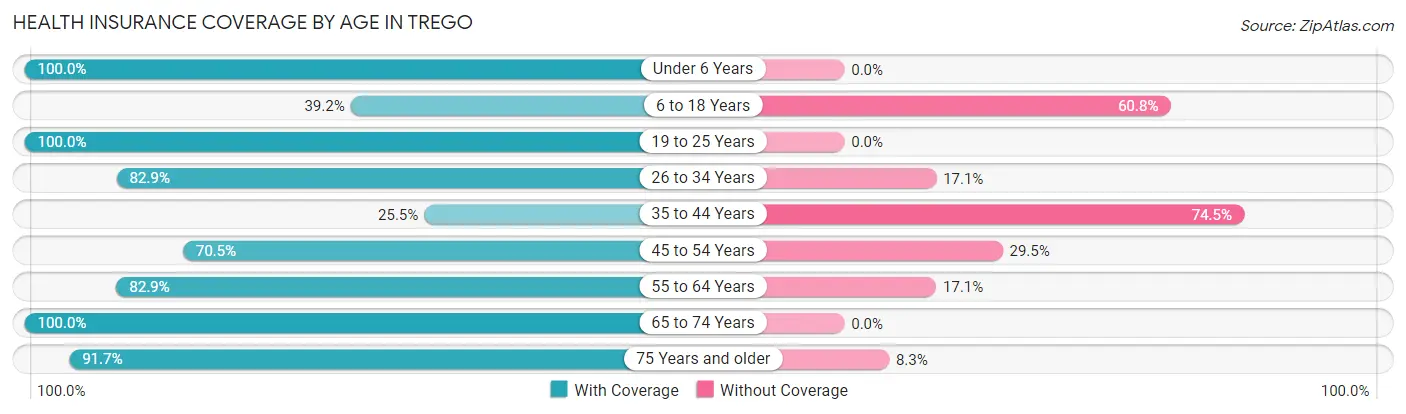
| Age Bracket | With Coverage | Without Coverage |
| Under 6 Years | 18 (100.0%) | 0 (0.0%) |
| 6 to 18 Years | 71 (39.2%) | 110 (60.8%) |
| 19 to 25 Years | 57 (100.0%) | 0 (0.0%) |
| 26 to 34 Years | 29 (82.9%) | 6 (17.1%) |
| 35 to 44 Years | 38 (25.5%) | 111 (74.5%) |
| 45 to 54 Years | 43 (70.5%) | 18 (29.5%) |
| 55 to 64 Years | 92 (82.9%) | 19 (17.1%) |
| 65 to 74 Years | 118 (100.0%) | 0 (0.0%) |
| 75 Years and older | 33 (91.7%) | 3 (8.3%) |
| Total | 499 (65.1%) | 267 (34.9%) |
Health Insurance Coverage by Citizenship Status in Trego
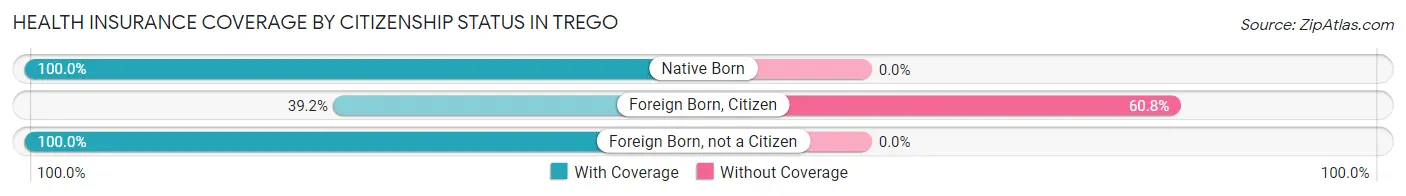
| Citizenship Status | With Coverage | Without Coverage |
| Native Born | 18 (100.0%) | 0 (0.0%) |
| Foreign Born, Citizen | 71 (39.2%) | 110 (60.8%) |
| Foreign Born, not a Citizen | 57 (100.0%) | 0 (0.0%) |
Health Insurance Coverage by Household Income in Trego
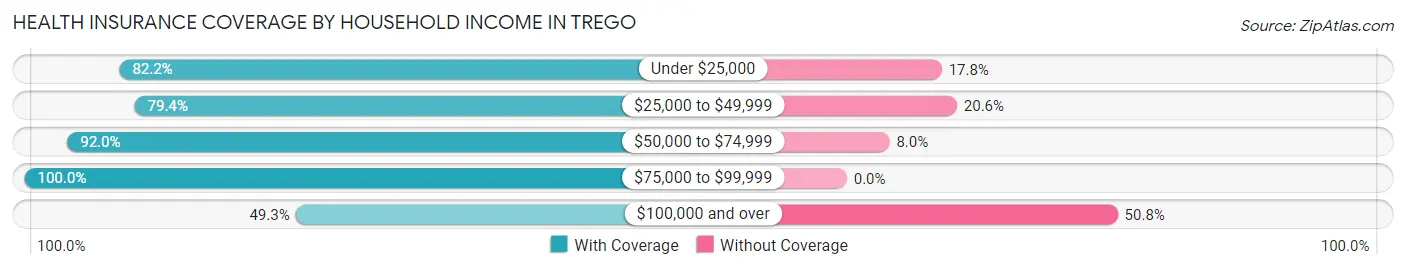
| Household Income | With Coverage | Without Coverage |
| Under $25,000 | 37 (82.2%) | 8 (17.8%) |
| $25,000 to $49,999 | 204 (79.4%) | 53 (20.6%) |
| $50,000 to $74,999 | 46 (92.0%) | 4 (8.0%) |
| $75,000 to $99,999 | 3 (100.0%) | 0 (0.0%) |
| $100,000 and over | 196 (49.2%) | 202 (50.7%) |
Public vs Private Health Insurance Coverage by Age in Trego
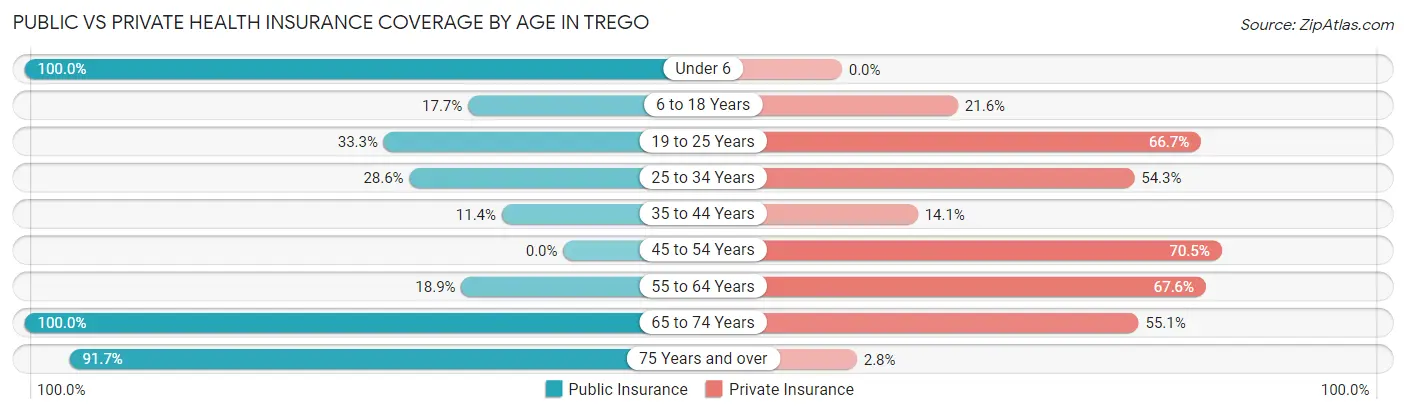
| Age Bracket | Public Insurance | Private Insurance |
| Under 6 | 18 (100.0%) | 0 (0.0%) |
| 6 to 18 Years | 32 (17.7%) | 39 (21.5%) |
| 19 to 25 Years | 19 (33.3%) | 38 (66.7%) |
| 25 to 34 Years | 10 (28.6%) | 19 (54.3%) |
| 35 to 44 Years | 17 (11.4%) | 21 (14.1%) |
| 45 to 54 Years | 0 (0.0%) | 43 (70.5%) |
| 55 to 64 Years | 21 (18.9%) | 75 (67.6%) |
| 65 to 74 Years | 118 (100.0%) | 65 (55.1%) |
| 75 Years and over | 33 (91.7%) | 1 (2.8%) |
| Total | 268 (35.0%) | 301 (39.3%) |
Disability Status by Sex by Age in Trego
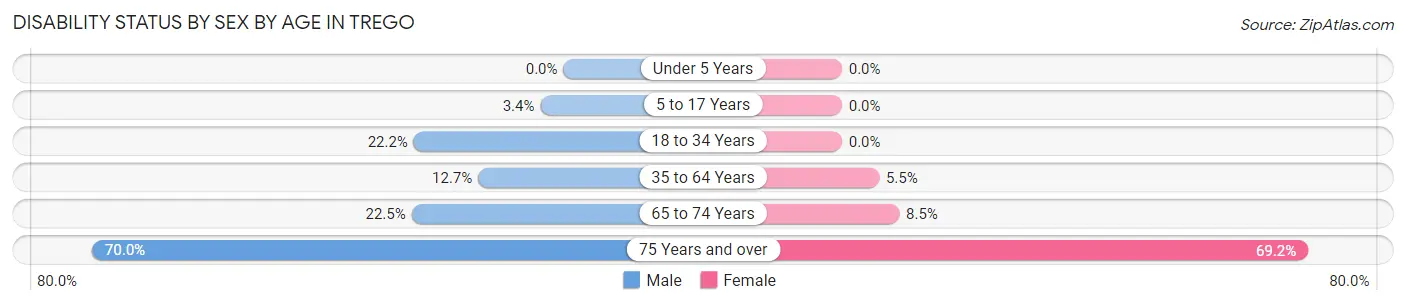
| Age Bracket | Male | Female |
| Under 5 Years | 0 (0.0%) | 0 (0.0%) |
| 5 to 17 Years | 4 (3.4%) | 0 (0.0%) |
| 18 to 34 Years | 14 (22.2%) | 0 (0.0%) |
| 35 to 64 Years | 20 (12.7%) | 9 (5.5%) |
| 65 to 74 Years | 16 (22.5%) | 4 (8.5%) |
| 75 Years and over | 7 (70.0%) | 18 (69.2%) |
Disability Class by Sex by Age in Trego
Disability Class: Hearing Difficulty
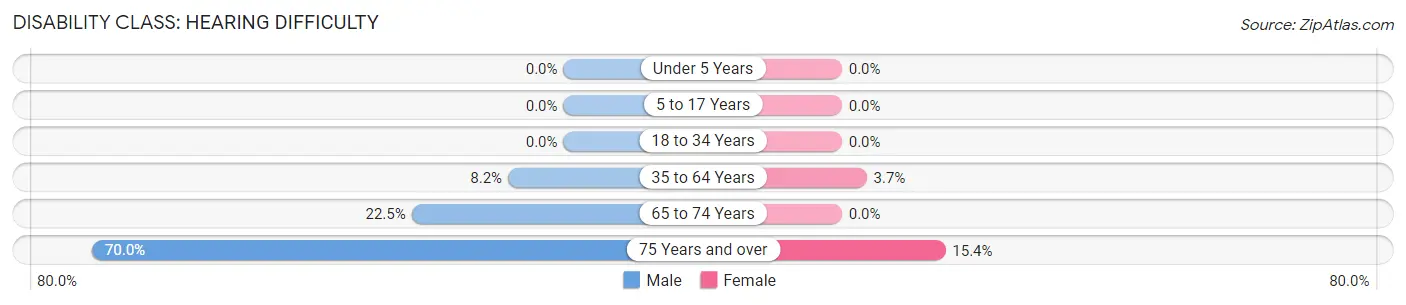
| Age Bracket | Male | Female |
| Under 5 Years | 0 (0.0%) | 0 (0.0%) |
| 5 to 17 Years | 0 (0.0%) | 0 (0.0%) |
| 18 to 34 Years | 0 (0.0%) | 0 (0.0%) |
| 35 to 64 Years | 13 (8.2%) | 6 (3.7%) |
| 65 to 74 Years | 16 (22.5%) | 0 (0.0%) |
| 75 Years and over | 7 (70.0%) | 4 (15.4%) |
Disability Class: Vision Difficulty
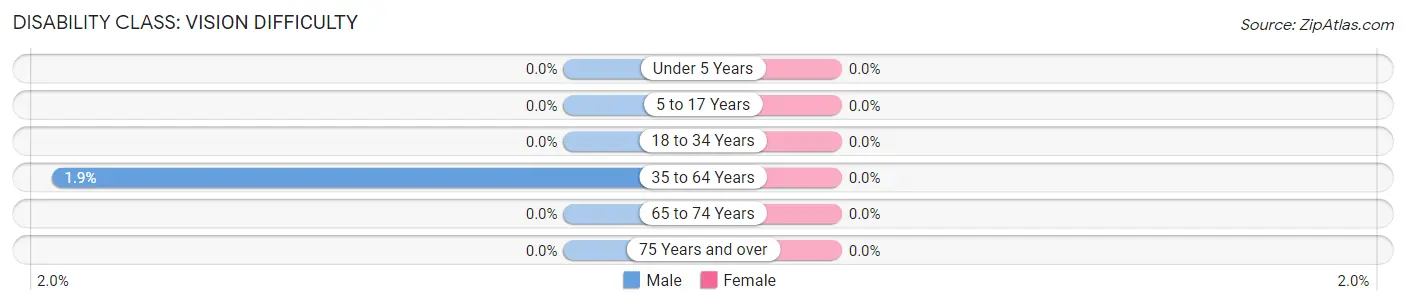
| Age Bracket | Male | Female |
| Under 5 Years | 0 (0.0%) | 0 (0.0%) |
| 5 to 17 Years | 0 (0.0%) | 0 (0.0%) |
| 18 to 34 Years | 0 (0.0%) | 0 (0.0%) |
| 35 to 64 Years | 3 (1.9%) | 0 (0.0%) |
| 65 to 74 Years | 0 (0.0%) | 0 (0.0%) |
| 75 Years and over | 0 (0.0%) | 0 (0.0%) |
Disability Class: Cognitive Difficulty
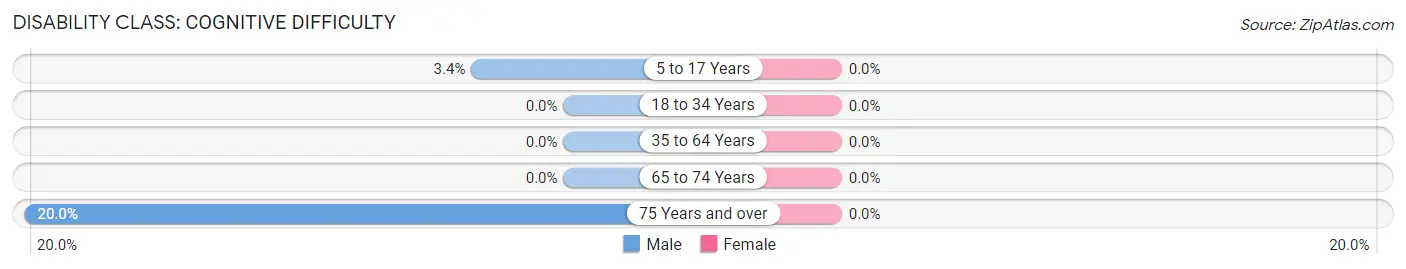
| Age Bracket | Male | Female |
| 5 to 17 Years | 4 (3.4%) | 0 (0.0%) |
| 18 to 34 Years | 0 (0.0%) | 0 (0.0%) |
| 35 to 64 Years | 0 (0.0%) | 0 (0.0%) |
| 65 to 74 Years | 0 (0.0%) | 0 (0.0%) |
| 75 Years and over | 2 (20.0%) | 0 (0.0%) |
Disability Class: Ambulatory Difficulty
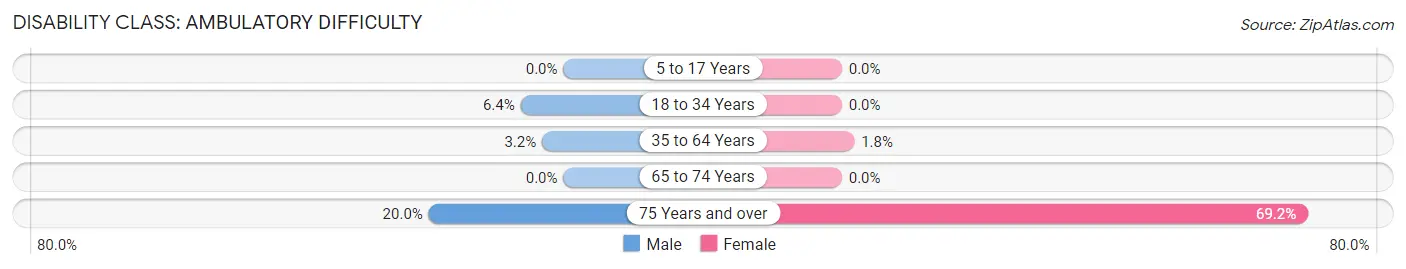
| Age Bracket | Male | Female |
| 5 to 17 Years | 0 (0.0%) | 0 (0.0%) |
| 18 to 34 Years | 4 (6.4%) | 0 (0.0%) |
| 35 to 64 Years | 5 (3.2%) | 3 (1.8%) |
| 65 to 74 Years | 0 (0.0%) | 0 (0.0%) |
| 75 Years and over | 2 (20.0%) | 18 (69.2%) |
Disability Class: Self-Care Difficulty
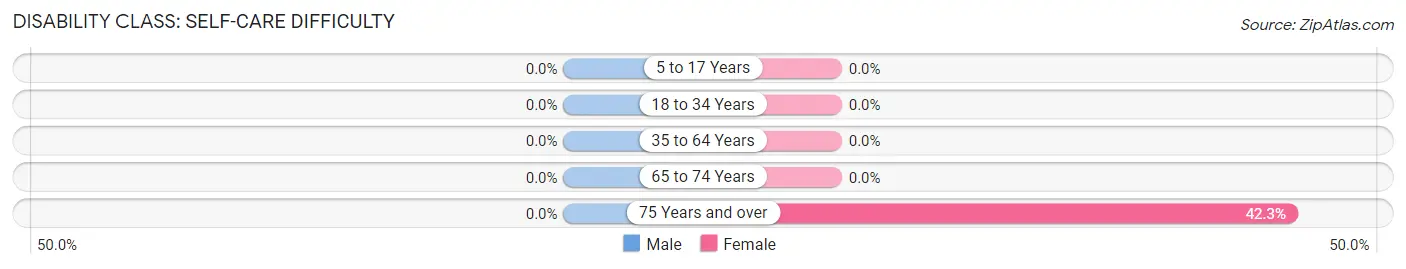
| Age Bracket | Male | Female |
| 5 to 17 Years | 0 (0.0%) | 0 (0.0%) |
| 18 to 34 Years | 0 (0.0%) | 0 (0.0%) |
| 35 to 64 Years | 0 (0.0%) | 0 (0.0%) |
| 65 to 74 Years | 0 (0.0%) | 0 (0.0%) |
| 75 Years and over | 0 (0.0%) | 11 (42.3%) |
Technology Access in Trego
Computing Device Access in Trego
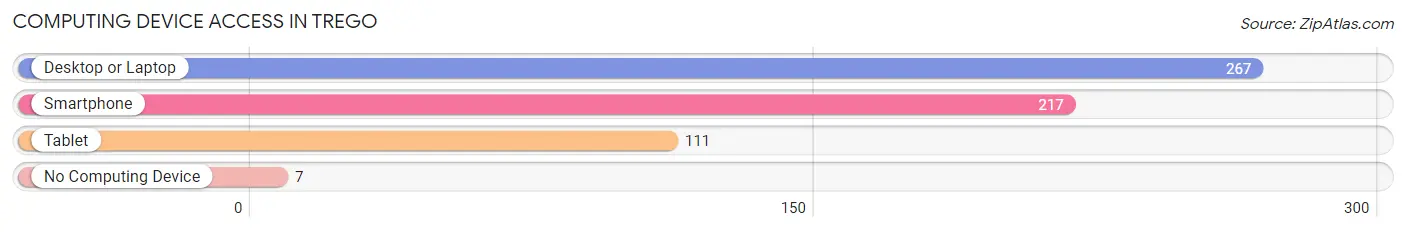
| Device Type | # Households | % Households |
| Desktop or Laptop | 267 | 95.0% |
| Smartphone | 217 | 77.2% |
| Tablet | 111 | 39.5% |
| No Computing Device | 7 | 2.5% |
| Total | 281 | 100.0% |
Internet Access in Trego
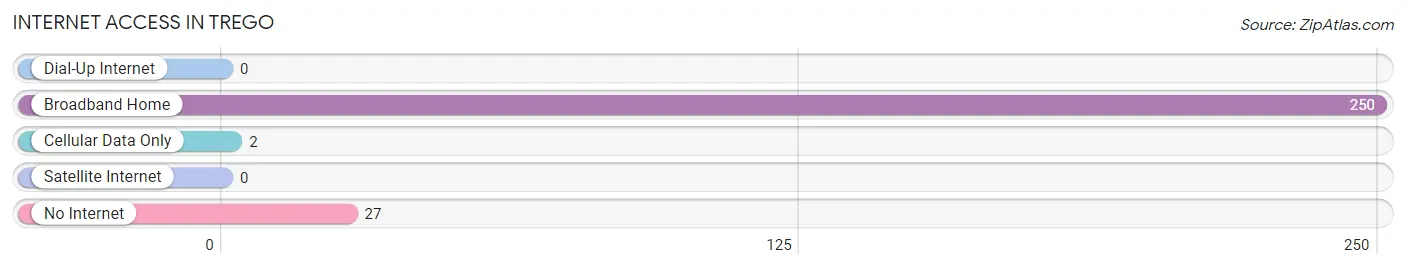
| Internet Type | # Households | % Households |
| Dial-Up Internet | 0 | 0.0% |
| Broadband Home | 250 | 89.0% |
| Cellular Data Only | 2 | 0.7% |
| Satellite Internet | 0 | 0.0% |
| No Internet | 27 | 9.6% |
| Total | 281 | 100.0% |
Trego Summary
Trego, Montana is a small town located in the northwest corner of the state, near the Canadian border. It is situated in the Kootenai National Forest and is surrounded by mountains, rivers, and lakes. The town has a population of just over 500 people and is the county seat of Lincoln County.
Trego was founded in 1883 by a group of homesteaders who were looking for a place to settle and start a new life. The town was named after the nearby Trego Creek, which was named after a Native American chief. The town quickly grew and by the early 1900s, it had become a bustling community with a variety of businesses, including a hotel, a general store, a post office, and a school.
The economy of Trego is largely based on agriculture and forestry. The town is home to several farms and ranches, as well as a sawmill and a lumber yard. The town also has a small manufacturing sector, which produces a variety of products, including furniture, clothing, and tools.
The geography of Trego is dominated by the Kootenai National Forest, which covers much of the area. The forest is home to a variety of wildlife, including elk, deer, moose, and bear. The town is also located near several lakes, including Lake Koocanusa, which is a popular destination for fishing and boating.
The demographics of Trego are largely white, with a small percentage of Native Americans and African Americans. The median household income is around $30,000, and the median age is around 40 years old. The town has a low unemployment rate and a high rate of home ownership.
Trego is a small town with a rich history and a strong sense of community. It is a great place to live and work, and it offers a variety of activities for residents and visitors alike. From fishing and boating to hiking and camping, Trego has something for everyone.
Common Questions
What is Per Capita Income in Trego?
Per Capita income in Trego is $31,473.
What is the Median Family Income in Trego?
Median Family Income in Trego is $101,750.
What is the Median Household income in Trego?
Median Household Income in Trego is $59,375.
What is Income or Wage Gap in Trego?
Income or Wage Gap in Trego is 24.4%.
Women in Trego earn 75.6 cents for every dollar earned by a man.
What is Inequality or Gini Index in Trego?
Inequality or Gini Index in Trego is 0.39.
What is the Total Population of Trego?
Total Population of Trego is 766.
What is the Total Male Population of Trego?
Total Male Population of Trego is 426.
What is the Total Female Population of Trego?
Total Female Population of Trego is 340.
What is the Ratio of Males per 100 Females in Trego?
There are 125.29 Males per 100 Females in Trego.
What is the Ratio of Females per 100 Males in Trego?
There are 79.81 Females per 100 Males in Trego.
What is the Median Population Age in Trego?
Median Population Age in Trego is 38.1 Years.
What is the Average Family Size in Trego
Average Family Size in Trego is 3.2 People.
What is the Average Household Size in Trego
Average Household Size in Trego is 2.7 People.
How Large is the Labor Force in Trego?
There are 349 People in the Labor Forcein in Trego.
What is the Percentage of People in the Labor Force in Trego?
60.4% of People are in the Labor Force in Trego.
What is the Unemployment Rate in Trego?
Unemployment Rate in Trego is 0.6%.