Thompson Falls, MT Map & Demographics
Thompson Falls Map
Thompson Falls Overview
$24,278
PER CAPITA INCOME
$65,833
AVG FAMILY INCOME
$43,125
AVG HOUSEHOLD INCOME
34.3%
WAGE / INCOME GAP [ % ]
65.7¢/ $1
WAGE / INCOME GAP [ $ ]
0.33
INEQUALITY / GINI INDEX
1,658
TOTAL POPULATION
940
MALE POPULATION
718
FEMALE POPULATION
130.92
MALES / 100 FEMALES
76.38
FEMALES / 100 MALES
46.6
MEDIAN AGE
3.2
AVG FAMILY SIZE
2.3
AVG HOUSEHOLD SIZE
703
LABOR FORCE [ PEOPLE ]
55.8%
PERCENT IN LABOR FORCE
0.6%
UNEMPLOYMENT RATE
Thompson Falls Zip Codes
Thompson Falls Area Codes
Income in Thompson Falls
Income Overview in Thompson Falls
Per Capita Income in Thompson Falls is $24,278, while median incomes of families and households are $65,833 and $43,125 respectively.
| Characteristic | Number | Measure |
| Per Capita Income | 1,658 | $24,278 |
| Median Family Income | 400 | $65,833 |
| Mean Family Income | 400 | $60,989 |
| Median Household Income | 711 | $43,125 |
| Mean Household Income | 711 | $53,988 |
| Income Deficit | 400 | $0 |
| Wage / Income Gap (%) | 1,658 | 34.27% |
| Wage / Income Gap ($) | 1,658 | 65.73¢ per $1 |
| Gini / Inequality Index | 1,658 | 0.33 |
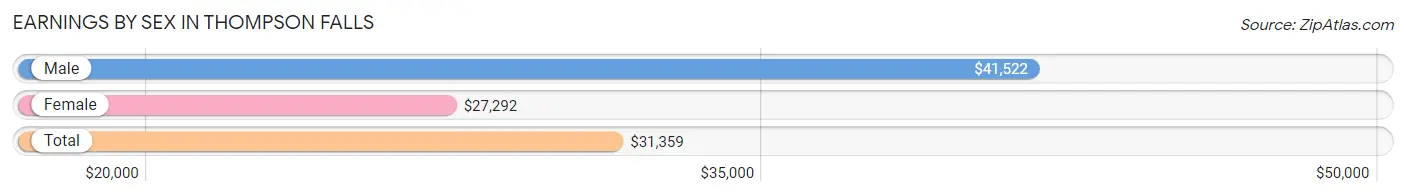
Earnings by Sex in Thompson Falls
Average Earnings in Thompson Falls are $31,359, $41,522 for men and $27,292 for women, a difference of 34.3%.
| Sex | Number | Average Earnings |
| Male | 474 (61.6%) | $41,522 |
| Female | 296 (38.4%) | $27,292 |
| Total | 770 (100.0%) | $31,359 |
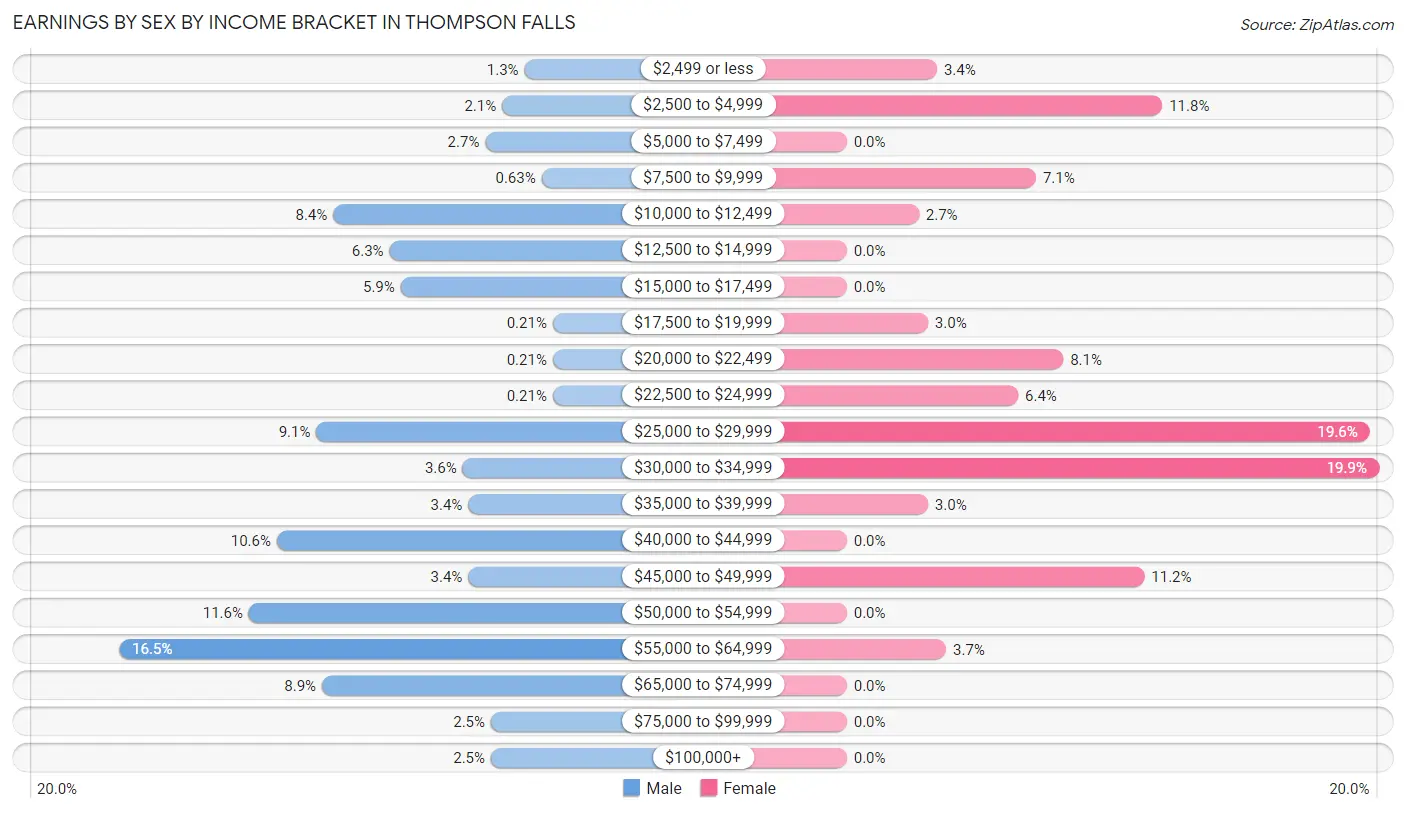
Earnings by Sex by Income Bracket in Thompson Falls
The most common earnings brackets in Thompson Falls are $55,000 to $64,999 for men (78 | 16.5%) and $30,000 to $34,999 for women (59 | 19.9%).
| Income | Male | Female |
| $2,499 or less | 6 (1.3%) | 10 (3.4%) |
| $2,500 to $4,999 | 10 (2.1%) | 35 (11.8%) |
| $5,000 to $7,499 | 13 (2.7%) | 0 (0.0%) |
| $7,500 to $9,999 | 3 (0.6%) | 21 (7.1%) |
| $10,000 to $12,499 | 40 (8.4%) | 8 (2.7%) |
| $12,500 to $14,999 | 30 (6.3%) | 0 (0.0%) |
| $15,000 to $17,499 | 28 (5.9%) | 0 (0.0%) |
| $17,500 to $19,999 | 1 (0.2%) | 9 (3.0%) |
| $20,000 to $22,499 | 1 (0.2%) | 24 (8.1%) |
| $22,500 to $24,999 | 1 (0.2%) | 19 (6.4%) |
| $25,000 to $29,999 | 43 (9.1%) | 58 (19.6%) |
| $30,000 to $34,999 | 17 (3.6%) | 59 (19.9%) |
| $35,000 to $39,999 | 16 (3.4%) | 9 (3.0%) |
| $40,000 to $44,999 | 50 (10.5%) | 0 (0.0%) |
| $45,000 to $49,999 | 16 (3.4%) | 33 (11.2%) |
| $50,000 to $54,999 | 55 (11.6%) | 0 (0.0%) |
| $55,000 to $64,999 | 78 (16.5%) | 11 (3.7%) |
| $65,000 to $74,999 | 42 (8.9%) | 0 (0.0%) |
| $75,000 to $99,999 | 12 (2.5%) | 0 (0.0%) |
| $100,000+ | 12 (2.5%) | 0 (0.0%) |
| Total | 474 (100.0%) | 296 (100.0%) |
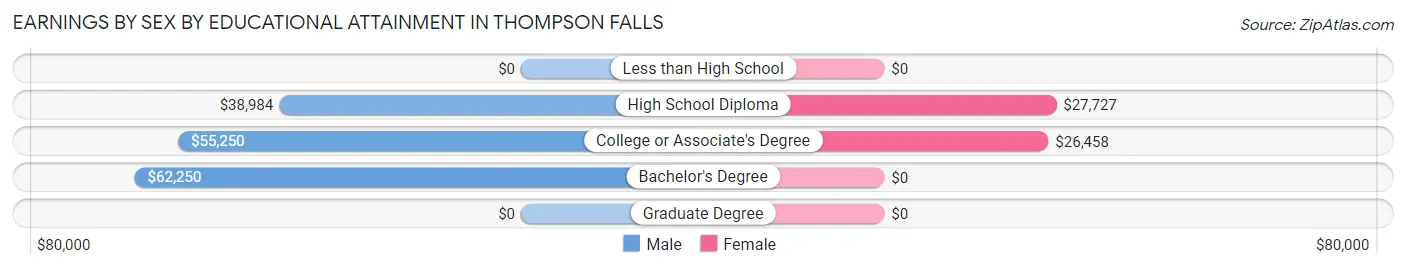
Earnings by Sex by Educational Attainment in Thompson Falls
Average earnings in Thompson Falls are $42,500 for men and $28,125 for women, a difference of 33.8%. Men with an educational attainment of bachelor's degree enjoy the highest average annual earnings of $62,250, while those with high school diploma education earn the least with $38,984. Women with an educational attainment of high school diploma earn the most with the average annual earnings of $27,727, while those with college or associate's degree education have the smallest earnings of $26,458.
| Educational Attainment | Male Income | Female Income |
| Less than High School | - | - |
| High School Diploma | $38,984 | $27,727 |
| College or Associate's Degree | $55,250 | $26,458 |
| Bachelor's Degree | $62,250 | $0 |
| Graduate Degree | - | - |
| Total | $42,500 | $28,125 |
Family Income in Thompson Falls
Family Income Brackets in Thompson Falls
According to the Thompson Falls family income data, there are 100 families falling into the $50,000 to $74,999 income range, which is the most common income bracket and makes up 25.0% of all families.
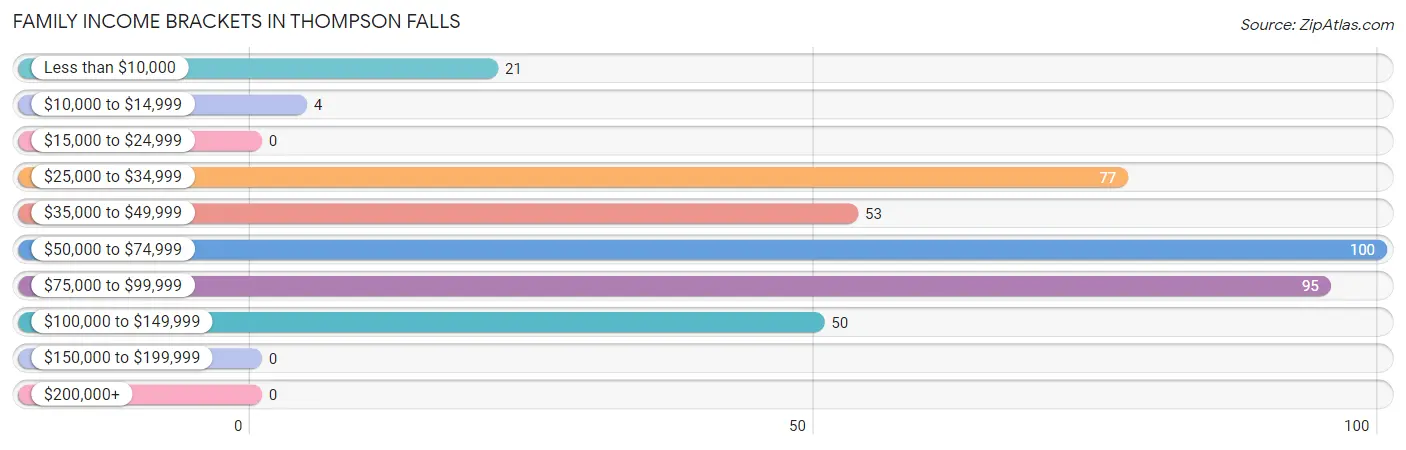
| Income Bracket | # Families | % Families |
| Less than $10,000 | 21 | 5.3% |
| $10,000 to $14,999 | 4 | 1.0% |
| $15,000 to $24,999 | 0 | 0.0% |
| $25,000 to $34,999 | 77 | 19.3% |
| $35,000 to $49,999 | 53 | 13.3% |
| $50,000 to $74,999 | 100 | 25.0% |
| $75,000 to $99,999 | 95 | 23.8% |
| $100,000 to $149,999 | 50 | 12.5% |
| $150,000 to $199,999 | 0 | 0.0% |
| $200,000+ | 0 | 0.0% |
Family Income by Famaliy Size in Thompson Falls
4-person families (101 | 25.3%) account for the highest median family income in Thompson Falls with $76,220 per family, while 2-person families (189 | 47.2%) have the highest median income of $32,548 per family member.
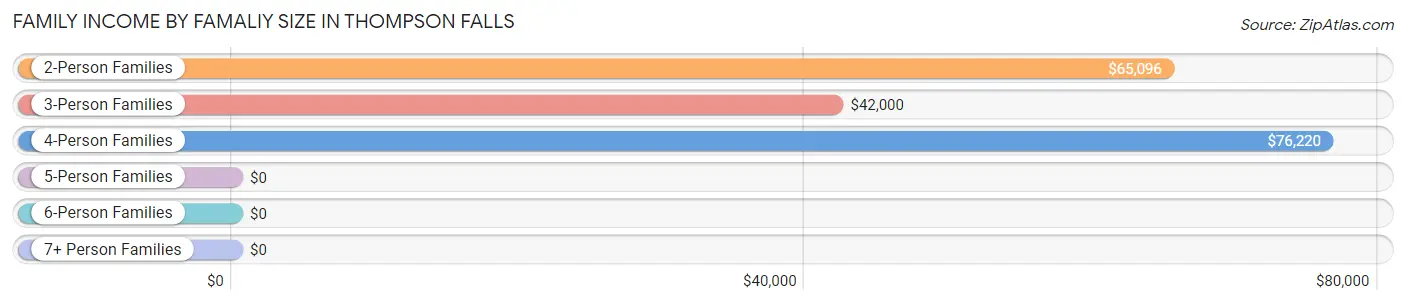
| Income Bracket | # Families | Median Income |
| 2-Person Families | 189 (47.2%) | $65,096 |
| 3-Person Families | 98 (24.5%) | $42,000 |
| 4-Person Families | 101 (25.3%) | $76,220 |
| 5-Person Families | 12 (3.0%) | $0 |
| 6-Person Families | 0 (0.0%) | $0 |
| 7+ Person Families | 0 (0.0%) | $0 |
| Total | 400 (100.0%) | $65,833 |
Family Income by Number of Earners in Thompson Falls
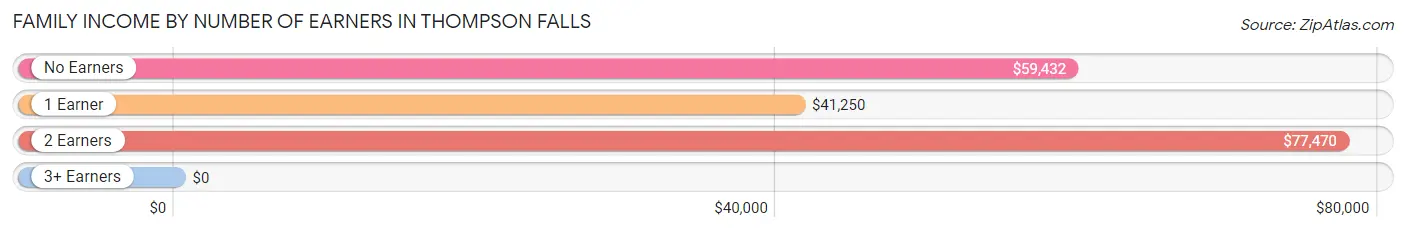
| Number of Earners | # Families | Median Income |
| No Earners | 49 (12.2%) | $59,432 |
| 1 Earner | 189 (47.2%) | $41,250 |
| 2 Earners | 137 (34.3%) | $77,470 |
| 3+ Earners | 25 (6.2%) | $0 |
| Total | 400 (100.0%) | $65,833 |
Household Income in Thompson Falls
Household Income Brackets in Thompson Falls
With 145 households falling in the category, the $35,000 to $49,999 income range is the most frequent in Thompson Falls, accounting for 20.4% of all households.
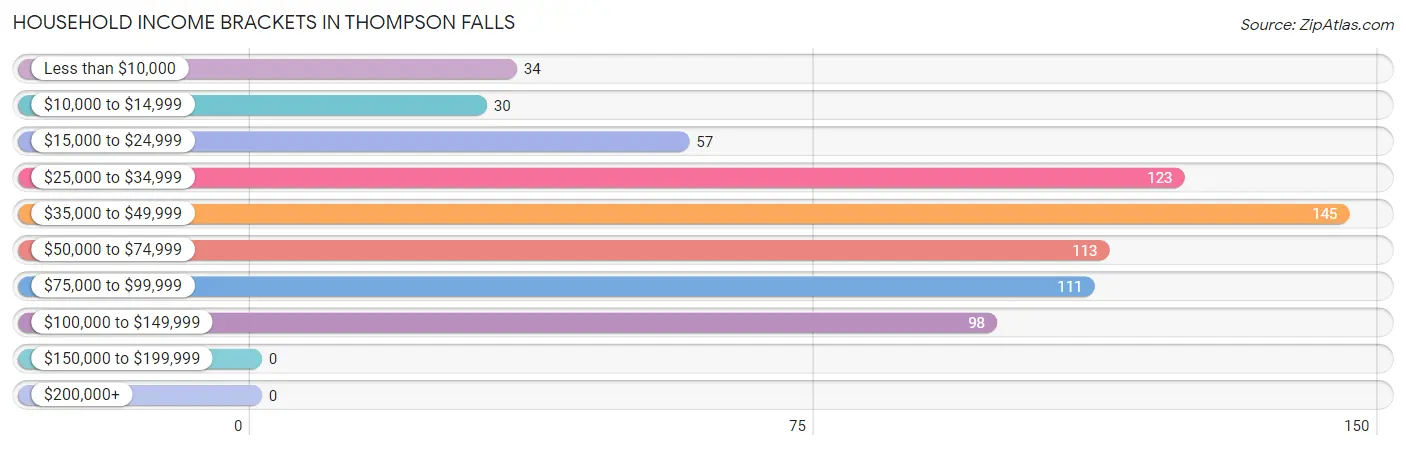
| Income Bracket | # Households | % Households |
| Less than $10,000 | 34 | 4.8% |
| $10,000 to $14,999 | 30 | 4.2% |
| $15,000 to $24,999 | 57 | 8.0% |
| $25,000 to $34,999 | 123 | 17.3% |
| $35,000 to $49,999 | 145 | 20.4% |
| $50,000 to $74,999 | 113 | 15.9% |
| $75,000 to $99,999 | 111 | 15.6% |
| $100,000 to $149,999 | 98 | 13.8% |
| $150,000 to $199,999 | 0 | 0.0% |
| $200,000+ | 0 | 0.0% |
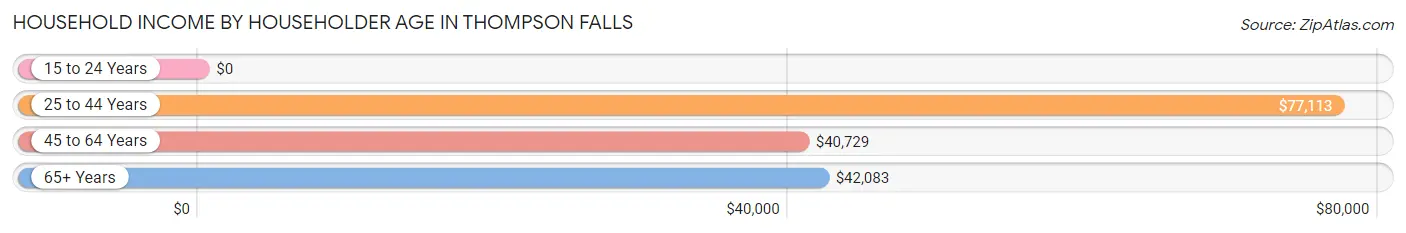
Household Income by Householder Age in Thompson Falls
The median household income in Thompson Falls is $43,125, with the highest median household income of $77,113 found in the 25 to 44 years age bracket for the primary householder. A total of 161 households (22.6%) fall into this category. Meanwhile, the 15 to 24 years age bracket for the primary householder has the lowest median household income of $0, with 44 households (6.2%) in this group.
| Income Bracket | # Households | Median Income |
| 15 to 24 Years | 44 (6.2%) | $0 |
| 25 to 44 Years | 161 (22.6%) | $77,113 |
| 45 to 64 Years | 251 (35.3%) | $40,729 |
| 65+ Years | 255 (35.9%) | $42,083 |
| Total | 711 (100.0%) | $43,125 |
Poverty in Thompson Falls
Income Below Poverty by Sex and Age in Thompson Falls
With 5.2% poverty level for males and 9.6% for females among the residents of Thompson Falls, 55 to 64 year old males and 18 to 24 year old females are the most vulnerable to poverty, with 31 males (22.0%) and 21 females (100.0%) in their respective age groups living below the poverty level.
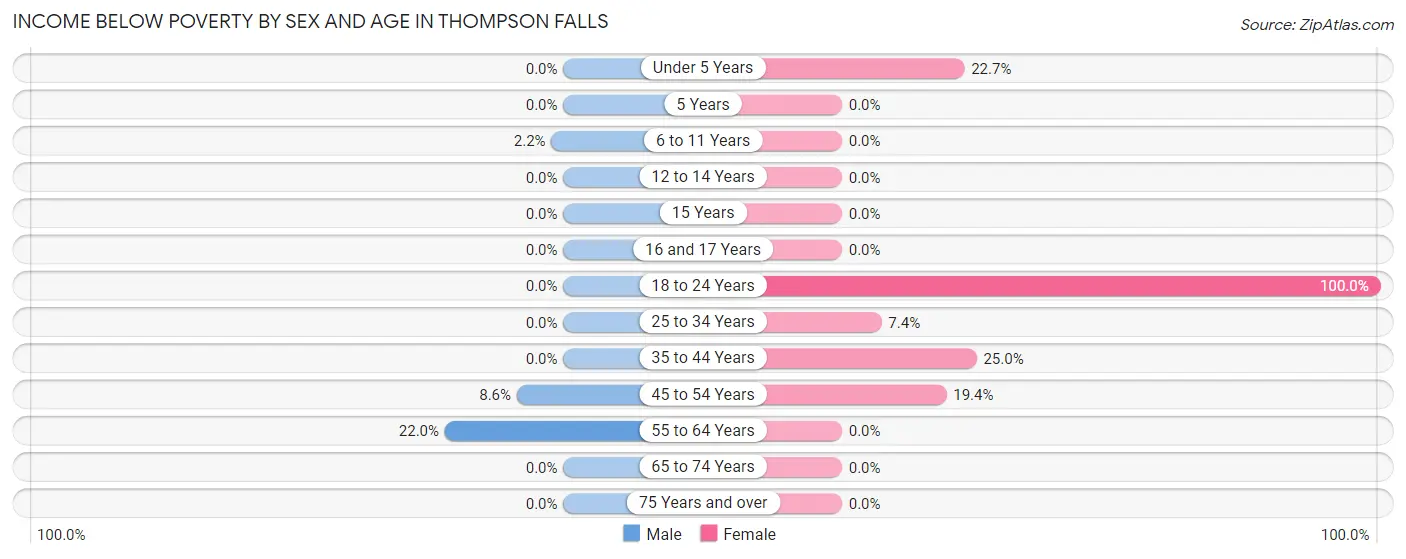
| Age Bracket | Male | Female |
| Under 5 Years | 0 (0.0%) | 15 (22.7%) |
| 5 Years | 0 (0.0%) | 0 (0.0%) |
| 6 to 11 Years | 4 (2.2%) | 0 (0.0%) |
| 12 to 14 Years | 0 (0.0%) | 0 (0.0%) |
| 15 Years | 0 (0.0%) | 0 (0.0%) |
| 16 and 17 Years | 0 (0.0%) | 0 (0.0%) |
| 18 to 24 Years | 0 (0.0%) | 21 (100.0%) |
| 25 to 34 Years | 0 (0.0%) | 10 (7.3%) |
| 35 to 44 Years | 0 (0.0%) | 4 (25.0%) |
| 45 to 54 Years | 12 (8.6%) | 19 (19.4%) |
| 55 to 64 Years | 31 (22.0%) | 0 (0.0%) |
| 65 to 74 Years | 0 (0.0%) | 0 (0.0%) |
| 75 Years and over | 0 (0.0%) | 0 (0.0%) |
| Total | 47 (5.2%) | 69 (9.6%) |
Income Above Poverty by Sex and Age in Thompson Falls
According to the poverty statistics in Thompson Falls, males aged under 5 years and females aged 6 to 11 years are the age groups that are most secure financially, with 100.0% of males and 100.0% of females in these age groups living above the poverty line.
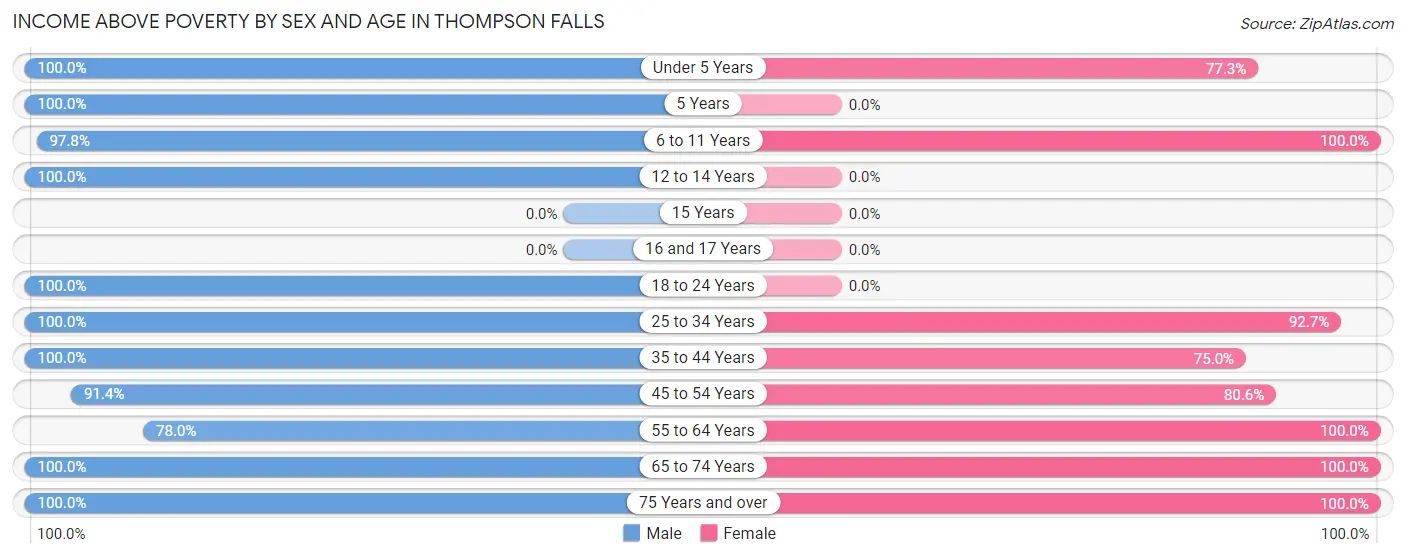
| Age Bracket | Male | Female |
| Under 5 Years | 42 (100.0%) | 51 (77.3%) |
| 5 Years | 13 (100.0%) | 0 (0.0%) |
| 6 to 11 Years | 177 (97.8%) | 82 (100.0%) |
| 12 to 14 Years | 15 (100.0%) | 0 (0.0%) |
| 15 Years | 0 (0.0%) | 0 (0.0%) |
| 16 and 17 Years | 0 (0.0%) | 0 (0.0%) |
| 18 to 24 Years | 34 (100.0%) | 0 (0.0%) |
| 25 to 34 Years | 78 (100.0%) | 126 (92.6%) |
| 35 to 44 Years | 113 (100.0%) | 12 (75.0%) |
| 45 to 54 Years | 127 (91.4%) | 79 (80.6%) |
| 55 to 64 Years | 110 (78.0%) | 122 (100.0%) |
| 65 to 74 Years | 74 (100.0%) | 91 (100.0%) |
| 75 Years and over | 78 (100.0%) | 84 (100.0%) |
| Total | 861 (94.8%) | 647 (90.4%) |
Income Below Poverty Among Married-Couple Families in Thompson Falls
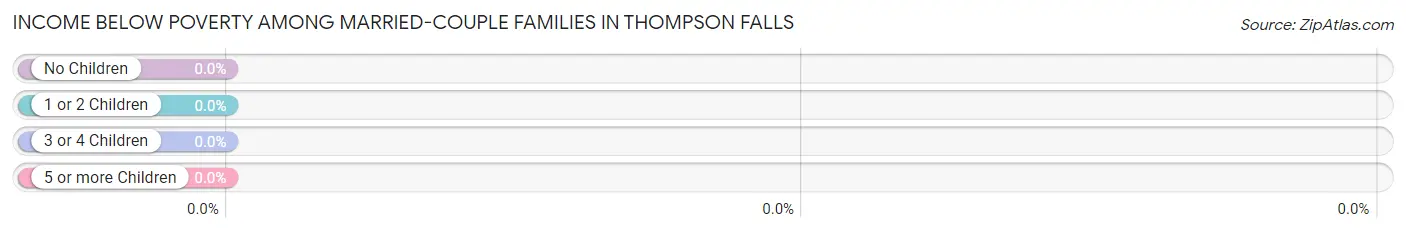
| Children | Above Poverty | Below Poverty |
| No Children | 154 (100.0%) | 0 (0.0%) |
| 1 or 2 Children | 134 (100.0%) | 0 (0.0%) |
| 3 or 4 Children | 0 (0.0%) | 0 (0.0%) |
| 5 or more Children | 0 (0.0%) | 0 (0.0%) |
| Total | 288 (100.0%) | 0 (0.0%) |
Income Below Poverty Among Single-Parent Households in Thompson Falls
According to the poverty data in Thompson Falls, 13.3% or 4 single-father households and 25.6% or 21 single-mother households are living below the poverty line. Among single-father households, those with 1 or 2 children have the highest poverty rate, with 4 households (15.4%) experiencing poverty. Likewise, among single-mother households, those with 1 or 2 children have the highest poverty rate, with 21 households (52.5%) falling below the poverty line.
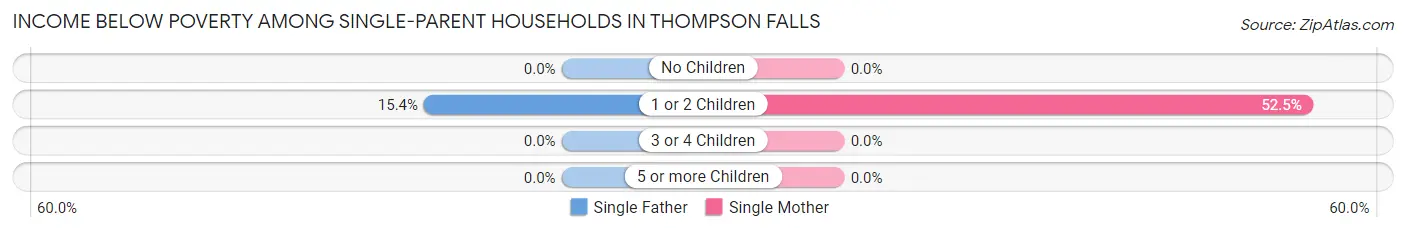
| Children | Single Father | Single Mother |
| No Children | 0 (0.0%) | 0 (0.0%) |
| 1 or 2 Children | 4 (15.4%) | 21 (52.5%) |
| 3 or 4 Children | 0 (0.0%) | 0 (0.0%) |
| 5 or more Children | 0 (0.0%) | 0 (0.0%) |
| Total | 4 (13.3%) | 21 (25.6%) |
Income Below Poverty Among Married-Couple vs Single-Parent Households in Thompson Falls
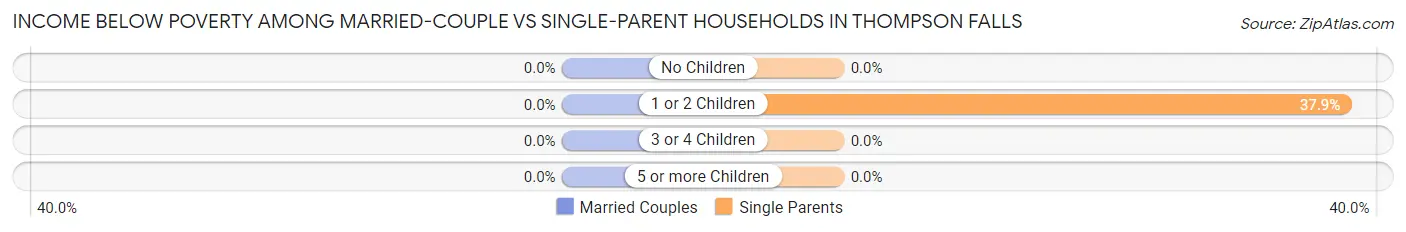
| Children | Married-Couple Families | Single-Parent Households |
| No Children | 0 (0.0%) | 0 (0.0%) |
| 1 or 2 Children | 0 (0.0%) | 25 (37.9%) |
| 3 or 4 Children | 0 (0.0%) | 0 (0.0%) |
| 5 or more Children | 0 (0.0%) | 0 (0.0%) |
| Total | 0 (0.0%) | 25 (22.3%) |
Race in Thompson Falls
The most populous races in Thompson Falls are White / Caucasian (1,526 | 92.0%), Hispanic or Latino (107 | 6.5%), and Two or more Races (103 | 6.2%).
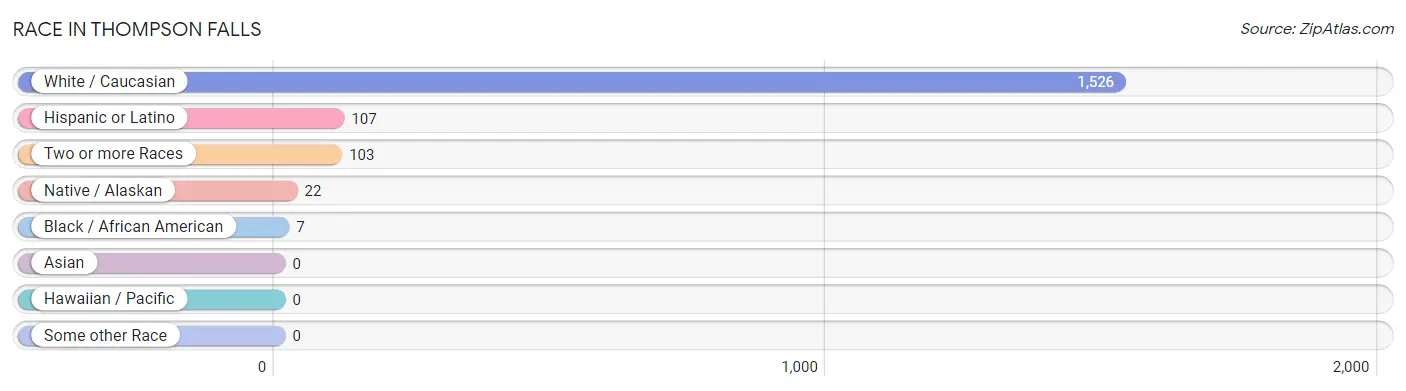
| Race | # Population | % Population |
| Asian | 0 | 0.0% |
| Black / African American | 7 | 0.4% |
| Hawaiian / Pacific | 0 | 0.0% |
| Hispanic or Latino | 107 | 6.5% |
| Native / Alaskan | 22 | 1.3% |
| White / Caucasian | 1,526 | 92.0% |
| Two or more Races | 103 | 6.2% |
| Some other Race | 0 | 0.0% |
| Total | 1,658 | 100.0% |
Ancestry in Thompson Falls
The most populous ancestries reported in Thompson Falls are German (460 | 27.7%), Norwegian (314 | 18.9%), Dutch (162 | 9.8%), Irish (147 | 8.9%), and American (142 | 8.6%), together accounting for 73.9% of all Thompson Falls residents.
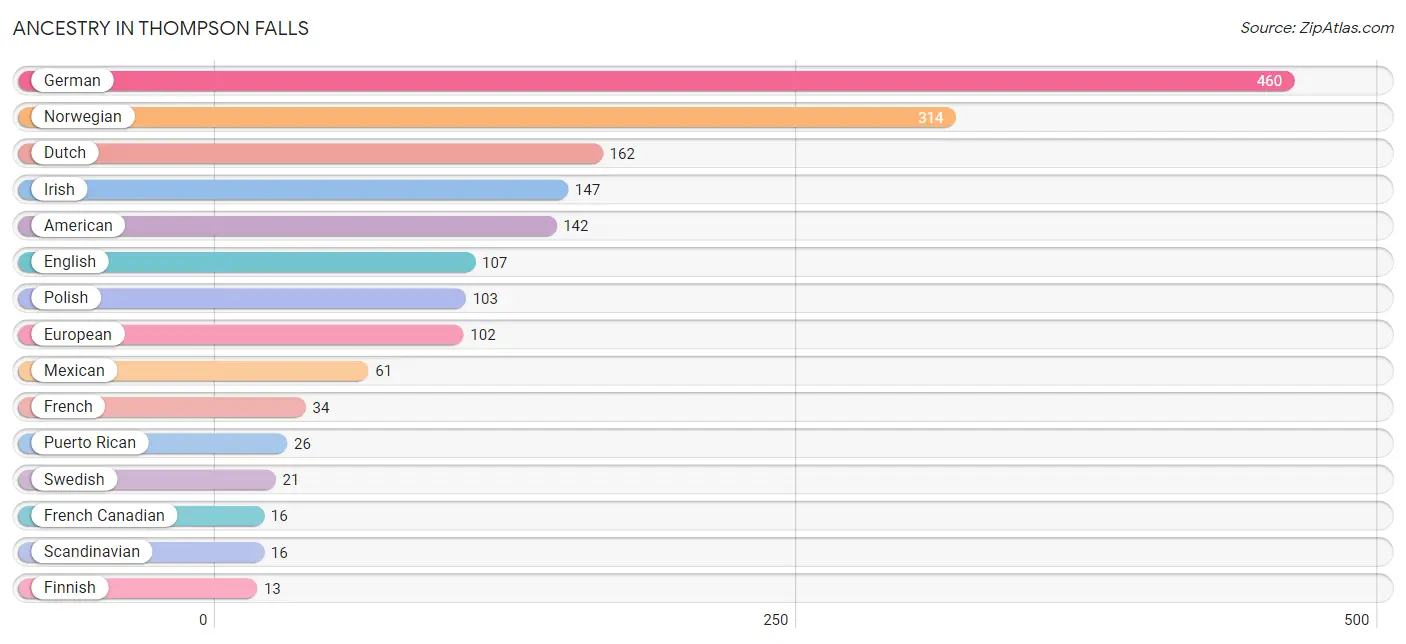
| Ancestry | # Population | % Population |
| American | 142 | 8.6% |
| Austrian | 10 | 0.6% |
| Czech | 3 | 0.2% |
| Danish | 4 | 0.2% |
| Dutch | 162 | 9.8% |
| English | 107 | 6.5% |
| European | 102 | 6.1% |
| Finnish | 13 | 0.8% |
| French | 34 | 2.1% |
| French Canadian | 16 | 1.0% |
| German | 460 | 27.7% |
| Greek | 4 | 0.2% |
| Irish | 147 | 8.9% |
| Italian | 13 | 0.8% |
| Lithuanian | 3 | 0.2% |
| Mexican | 61 | 3.7% |
| Norwegian | 314 | 18.9% |
| Pennsylvania German | 10 | 0.6% |
| Polish | 103 | 6.2% |
| Puerto Rican | 26 | 1.6% |
| Scandinavian | 16 | 1.0% |
| Scotch-Irish | 11 | 0.7% |
| Spaniard | 10 | 0.6% |
| Spanish | 10 | 0.6% |
| Swedish | 21 | 1.3% |
| Welsh | 13 | 0.8% | View All 26 Rows |
Immigrants in Thompson Falls

| Immigration Origin | # Population | % Population | View All 0 Rows |
Sex and Age in Thompson Falls
Sex and Age in Thompson Falls
The most populous age groups in Thompson Falls are 5 to 9 Years (105 | 11.2%) for men and 30 to 34 Years (94 | 13.1%) for women.
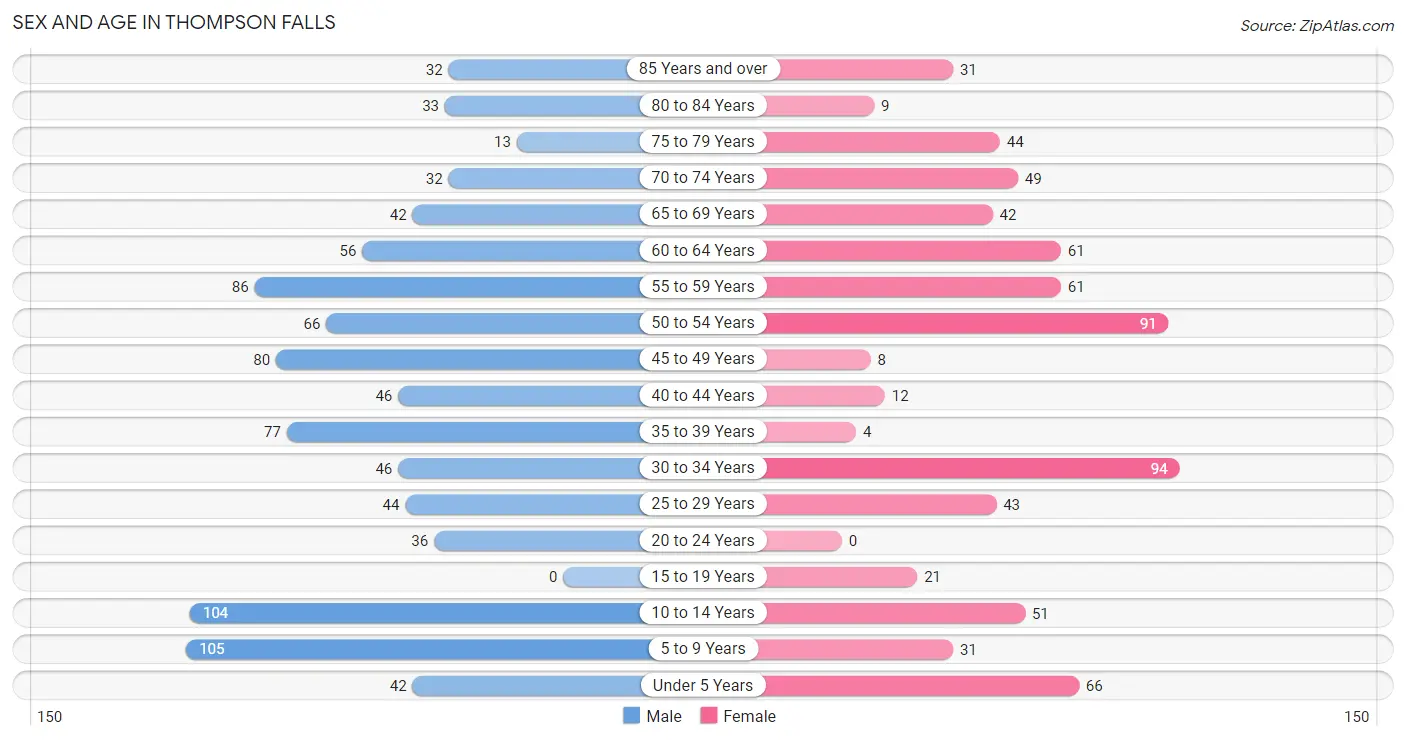
| Age Bracket | Male | Female |
| Under 5 Years | 42 (4.5%) | 66 (9.2%) |
| 5 to 9 Years | 105 (11.2%) | 31 (4.3%) |
| 10 to 14 Years | 104 (11.1%) | 51 (7.1%) |
| 15 to 19 Years | 0 (0.0%) | 21 (2.9%) |
| 20 to 24 Years | 36 (3.8%) | 0 (0.0%) |
| 25 to 29 Years | 44 (4.7%) | 43 (6.0%) |
| 30 to 34 Years | 46 (4.9%) | 94 (13.1%) |
| 35 to 39 Years | 77 (8.2%) | 4 (0.6%) |
| 40 to 44 Years | 46 (4.9%) | 12 (1.7%) |
| 45 to 49 Years | 80 (8.5%) | 8 (1.1%) |
| 50 to 54 Years | 66 (7.0%) | 91 (12.7%) |
| 55 to 59 Years | 86 (9.1%) | 61 (8.5%) |
| 60 to 64 Years | 56 (6.0%) | 61 (8.5%) |
| 65 to 69 Years | 42 (4.5%) | 42 (5.9%) |
| 70 to 74 Years | 32 (3.4%) | 49 (6.8%) |
| 75 to 79 Years | 13 (1.4%) | 44 (6.1%) |
| 80 to 84 Years | 33 (3.5%) | 9 (1.3%) |
| 85 Years and over | 32 (3.4%) | 31 (4.3%) |
| Total | 940 (100.0%) | 718 (100.0%) |
Families and Households in Thompson Falls
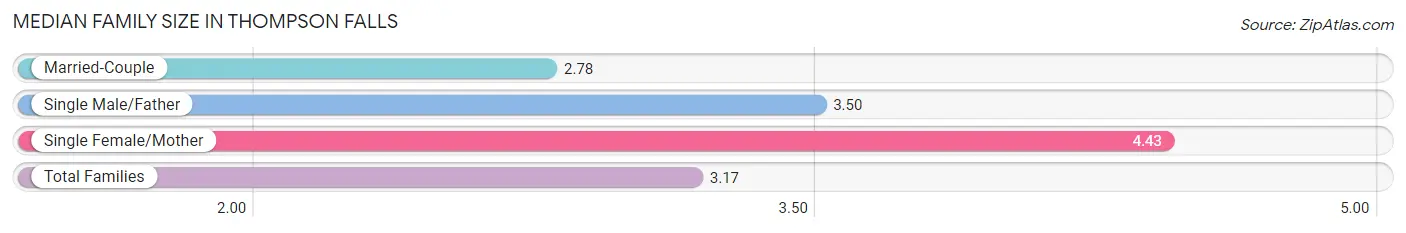
Median Family Size in Thompson Falls
The median family size in Thompson Falls is 3.17 persons per family, with single female/mother families (82 | 20.5%) accounting for the largest median family size of 4.43 persons per family. On the other hand, married-couple families (288 | 72.0%) represent the smallest median family size with 2.78 persons per family.
| Family Type | # Families | Family Size |
| Married-Couple | 288 (72.0%) | 2.78 |
| Single Male/Father | 30 (7.5%) | 3.50 |
| Single Female/Mother | 82 (20.5%) | 4.43 |
| Total Families | 400 (100.0%) | 3.17 |
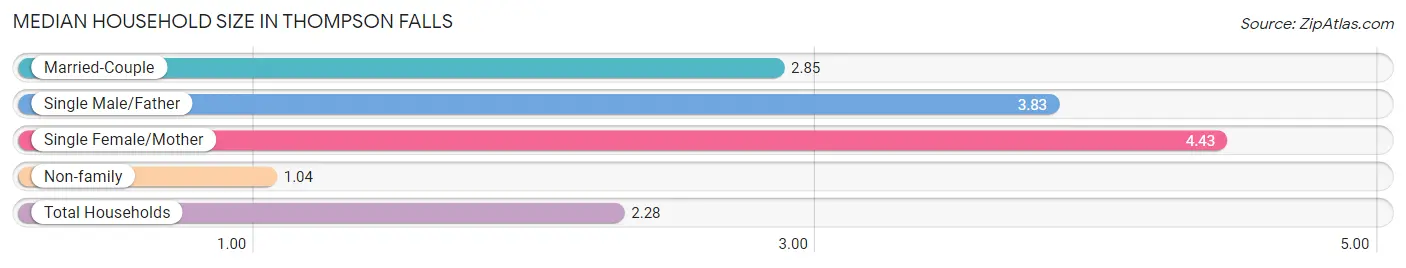
Median Household Size in Thompson Falls
The median household size in Thompson Falls is 2.28 persons per household, with single female/mother households (82 | 11.5%) accounting for the largest median household size of 4.43 persons per household. non-family households (311 | 43.7%) represent the smallest median household size with 1.04 persons per household.
| Household Type | # Households | Household Size |
| Married-Couple | 288 (40.5%) | 2.85 |
| Single Male/Father | 30 (4.2%) | 3.83 |
| Single Female/Mother | 82 (11.5%) | 4.43 |
| Non-family | 311 (43.7%) | 1.04 |
| Total Households | 711 (100.0%) | 2.28 |
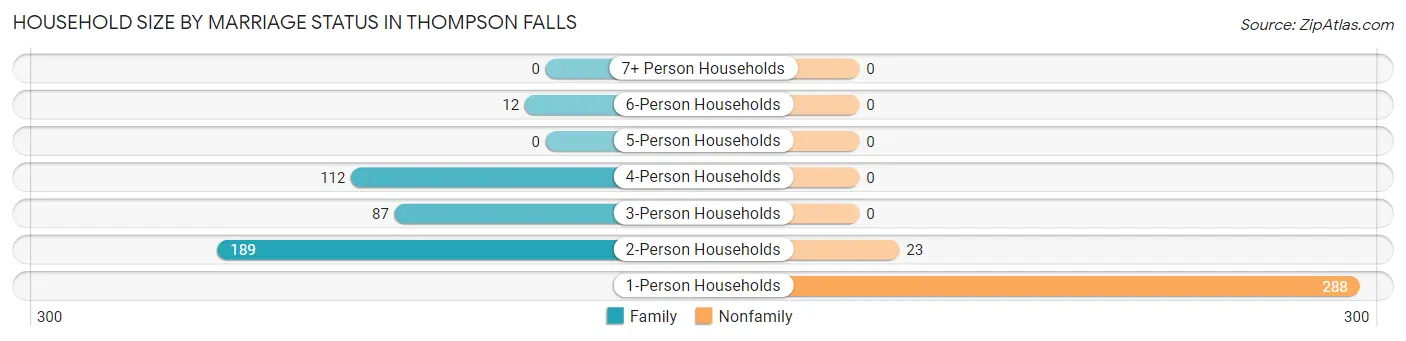
Household Size by Marriage Status in Thompson Falls
Out of a total of 711 households in Thompson Falls, 400 (56.3%) are family households, while 311 (43.7%) are nonfamily households. The most numerous type of family households are 2-person households, comprising 189, and the most common type of nonfamily households are 1-person households, comprising 288.
| Household Size | Family Households | Nonfamily Households |
| 1-Person Households | - | 288 (40.5%) |
| 2-Person Households | 189 (26.6%) | 23 (3.2%) |
| 3-Person Households | 87 (12.2%) | 0 (0.0%) |
| 4-Person Households | 112 (15.8%) | 0 (0.0%) |
| 5-Person Households | 0 (0.0%) | 0 (0.0%) |
| 6-Person Households | 12 (1.7%) | 0 (0.0%) |
| 7+ Person Households | 0 (0.0%) | 0 (0.0%) |
| Total | 400 (56.3%) | 311 (43.7%) |
Female Fertility in Thompson Falls
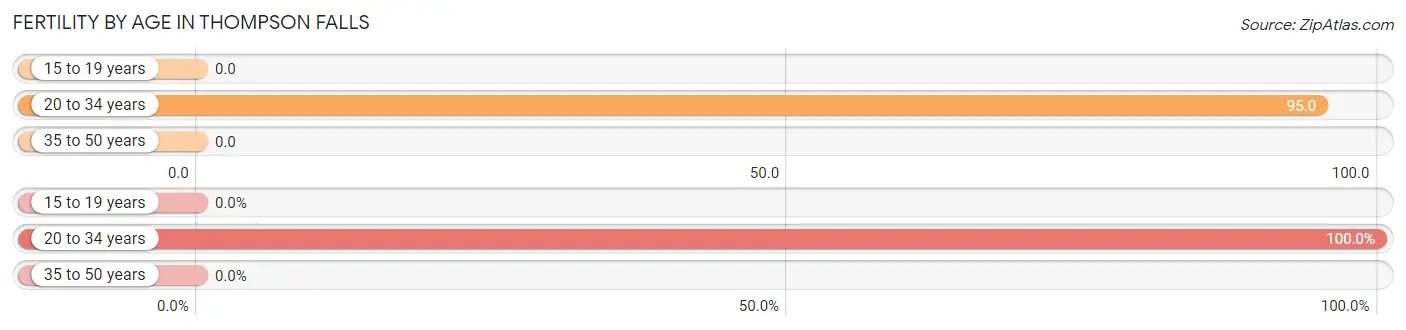
Fertility by Age in Thompson Falls
Average fertility rate in Thompson Falls is 57.0 births per 1,000 women. Women in the age bracket of 20 to 34 years have the highest fertility rate with 95.0 births per 1,000 women. Women in the age bracket of 20 to 34 years acount for 100.0% of all women with births.
| Age Bracket | Women with Births | Births / 1,000 Women |
| 15 to 19 years | 0 (0.0%) | 0.0 |
| 20 to 34 years | 13 (100.0%) | 95.0 |
| 35 to 50 years | 0 (0.0%) | 0.0 |
| Total | 13 (100.0%) | 57.0 |
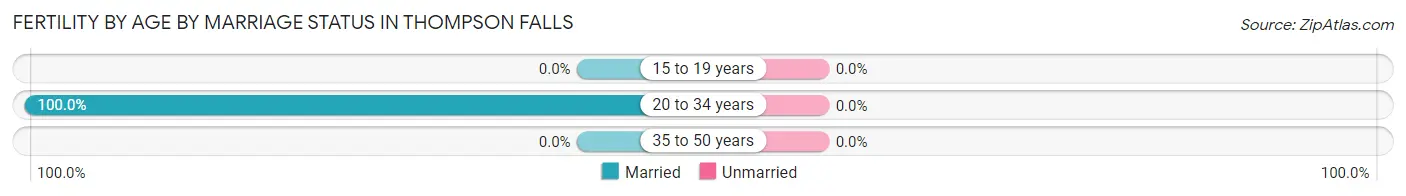
Fertility by Age by Marriage Status in Thompson Falls
| Age Bracket | Married | Unmarried |
| 15 to 19 years | 0 (0.0%) | 0 (0.0%) |
| 20 to 34 years | 13 (100.0%) | 0 (0.0%) |
| 35 to 50 years | 0 (0.0%) | 0 (0.0%) |
| Total | 13 (100.0%) | 0 (0.0%) |
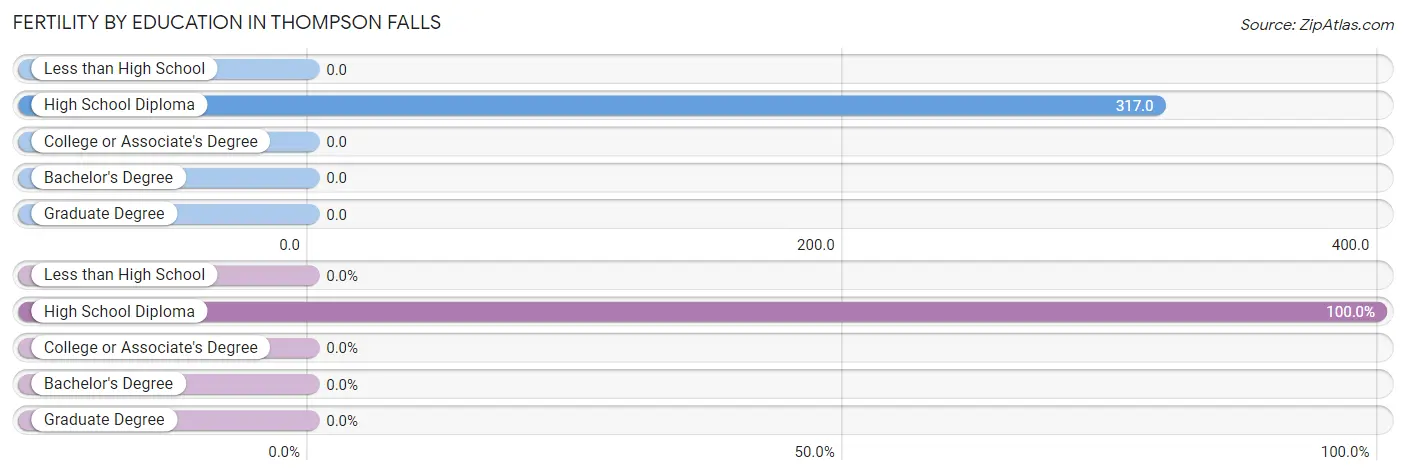
Fertility by Education in Thompson Falls
| Educational Attainment | Women with Births | Births / 1,000 Women |
| Less than High School | 0 (0.0%) | 0.0 |
| High School Diploma | 13 (100.0%) | 317.0 |
| College or Associate's Degree | 0 (0.0%) | 0.0 |
| Bachelor's Degree | 0 (0.0%) | 0.0 |
| Graduate Degree | 0 (0.0%) | 0.0 |
| Total | 13 (100.0%) | 57.0 |
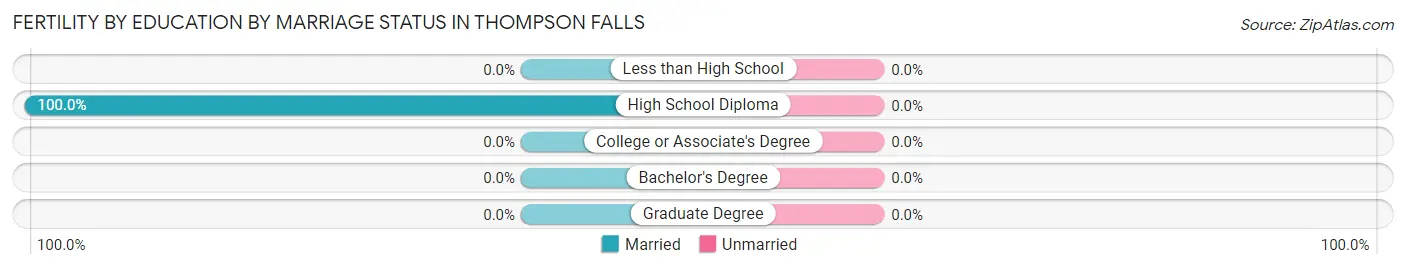
Fertility by Education by Marriage Status in Thompson Falls
| Educational Attainment | Married | Unmarried |
| Less than High School | 0 (0.0%) | 0 (0.0%) |
| High School Diploma | 13 (100.0%) | 0 (0.0%) |
| College or Associate's Degree | 0 (0.0%) | 0 (0.0%) |
| Bachelor's Degree | 0 (0.0%) | 0 (0.0%) |
| Graduate Degree | 0 (0.0%) | 0 (0.0%) |
| Total | 13 (100.0%) | 0 (0.0%) |
Employment Characteristics in Thompson Falls
Employment by Class of Employer in Thompson Falls
Among the 693 employed individuals in Thompson Falls, private company employees (382 | 55.1%), federal government employees (83 | 12.0%), and state government employees (57 | 8.2%) make up the most common classes of employment.
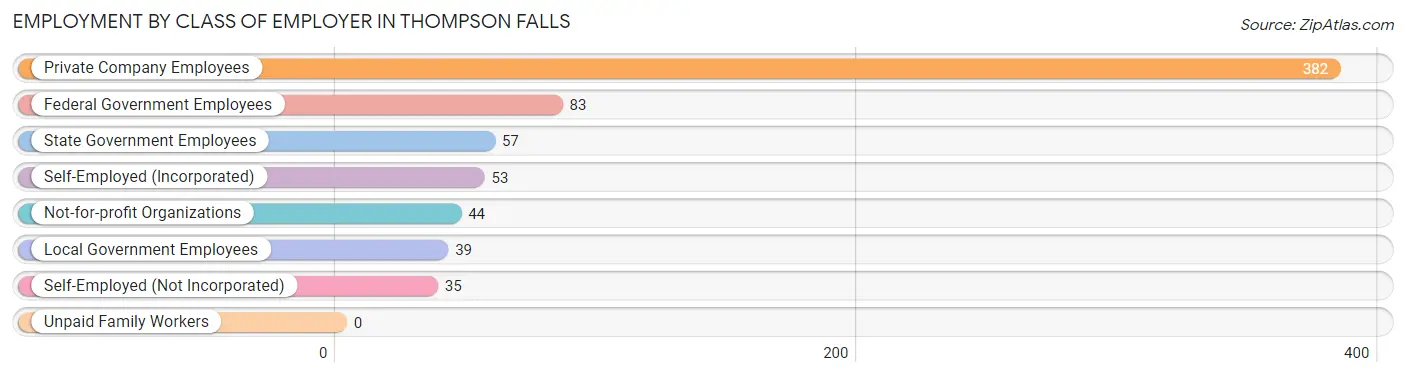
| Employer Class | # Employees | % Employees |
| Private Company Employees | 382 | 55.1% |
| Self-Employed (Incorporated) | 53 | 7.6% |
| Self-Employed (Not Incorporated) | 35 | 5.1% |
| Not-for-profit Organizations | 44 | 6.4% |
| Local Government Employees | 39 | 5.6% |
| State Government Employees | 57 | 8.2% |
| Federal Government Employees | 83 | 12.0% |
| Unpaid Family Workers | 0 | 0.0% |
| Total | 693 | 100.0% |
Employment Status by Age in Thompson Falls
According to the labor force statistics for Thompson Falls, out of the total population over 16 years of age (1,259), 55.8% or 703 individuals are in the labor force, with 0.6% or 4 of them unemployed. The age group with the highest labor force participation rate is 25 to 29 years, with 96.6% or 84 individuals in the labor force. Within the labor force, the 60 to 64 years age range has the highest percentage of unemployed individuals, with 12.1% or 4 of them being unemployed.
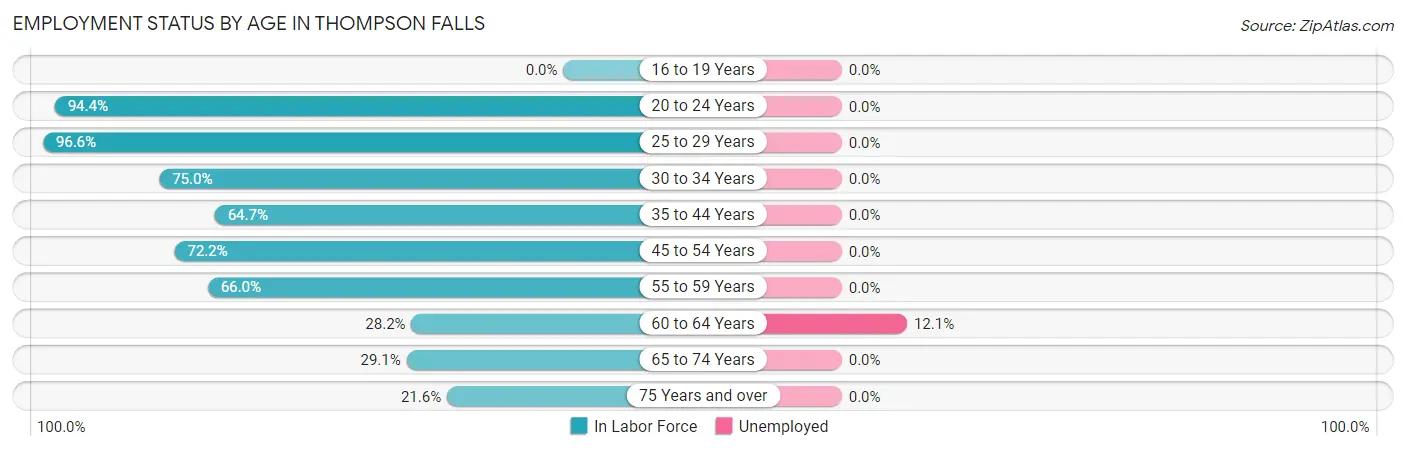
| Age Bracket | In Labor Force | Unemployed |
| 16 to 19 Years | 0 (0.0%) | 0 (0.0%) |
| 20 to 24 Years | 34 (94.4%) | 0 (0.0%) |
| 25 to 29 Years | 84 (96.6%) | 0 (0.0%) |
| 30 to 34 Years | 105 (75.0%) | 0 (0.0%) |
| 35 to 44 Years | 90 (64.7%) | 0 (0.0%) |
| 45 to 54 Years | 177 (72.2%) | 0 (0.0%) |
| 55 to 59 Years | 97 (66.0%) | 0 (0.0%) |
| 60 to 64 Years | 33 (28.2%) | 4 (12.1%) |
| 65 to 74 Years | 48 (29.1%) | 0 (0.0%) |
| 75 Years and over | 35 (21.6%) | 0 (0.0%) |
| Total | 703 (55.8%) | 4 (0.6%) |
Employment Status by Educational Attainment in Thompson Falls
According to labor force statistics for Thompson Falls, 67.0% of individuals (586) out of the total population between 25 and 64 years of age (875) are in the labor force, with 0.7% or 4 of them being unemployed. The group with the highest labor force participation rate are those with the educational attainment of bachelor's degree or higher, with 91.7% or 111 individuals in the labor force. Within the labor force, individuals with less than high school education have the highest percentage of unemployment, with 9.1% or 4 of them being unemployed.
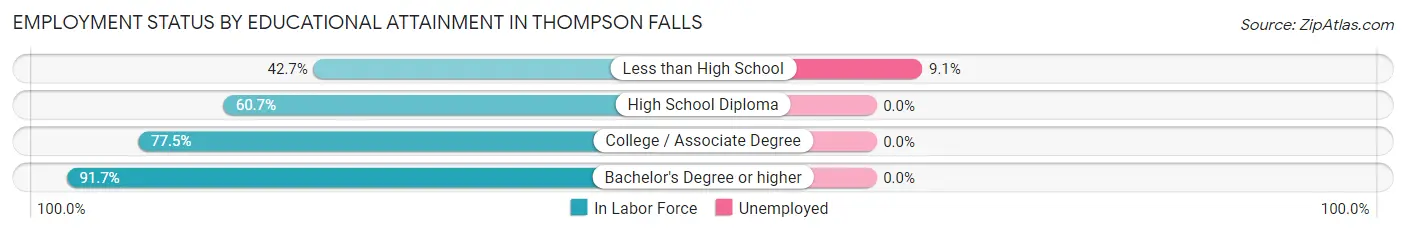
| Educational Attainment | In Labor Force | Unemployed |
| Less than High School | 44 (42.7%) | 9 (9.1%) |
| High School Diploma | 266 (60.7%) | 0 (0.0%) |
| College / Associate Degree | 165 (77.5%) | 0 (0.0%) |
| Bachelor's Degree or higher | 111 (91.7%) | 0 (0.0%) |
| Total | 586 (67.0%) | 6 (0.7%) |
Employment Occupations by Sex in Thompson Falls
Management, Business, Science and Arts Occupations
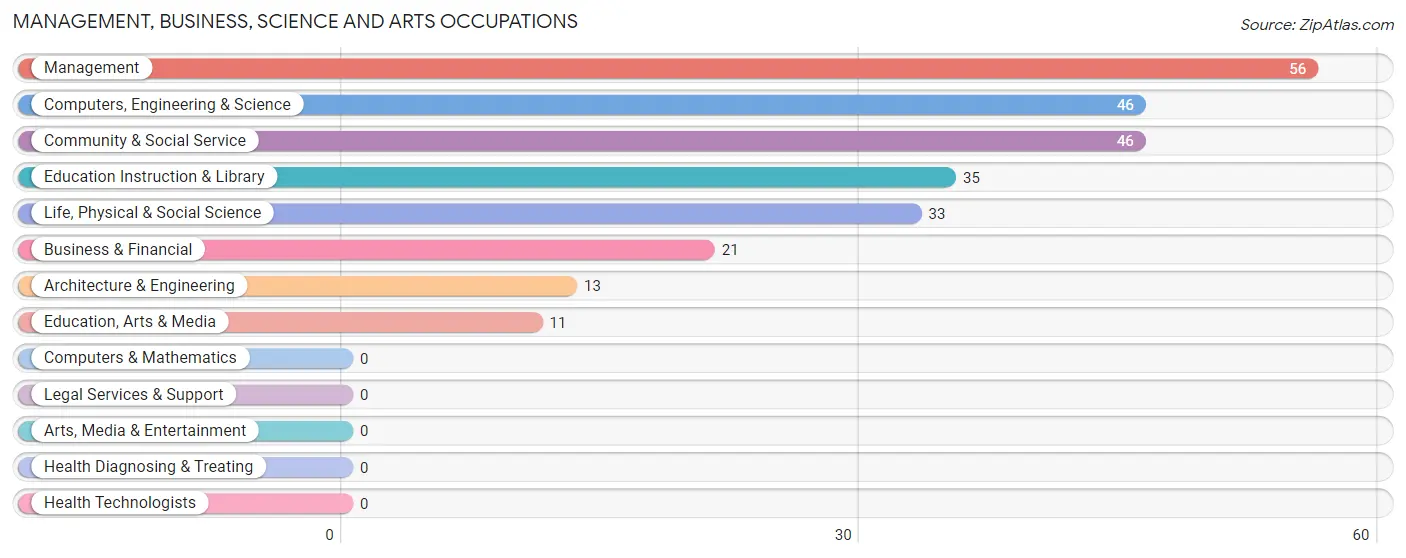
The most common Management, Business, Science and Arts occupations in Thompson Falls are Management (56 | 8.0%), Computers, Engineering & Science (46 | 6.6%), Community & Social Service (46 | 6.6%), Education Instruction & Library (35 | 5.0%), and Life, Physical & Social Science (33 | 4.7%).
Management, Business, Science and Arts Occupations by Sex
Within the Management, Business, Science and Arts occupations in Thompson Falls, the most male-oriented occupations are Computers, Engineering & Science (100.0%), Architecture & Engineering (100.0%), and Life, Physical & Social Science (100.0%), while the most female-oriented occupations are Education Instruction & Library (68.6%), Management (55.4%), and Community & Social Service (52.2%).
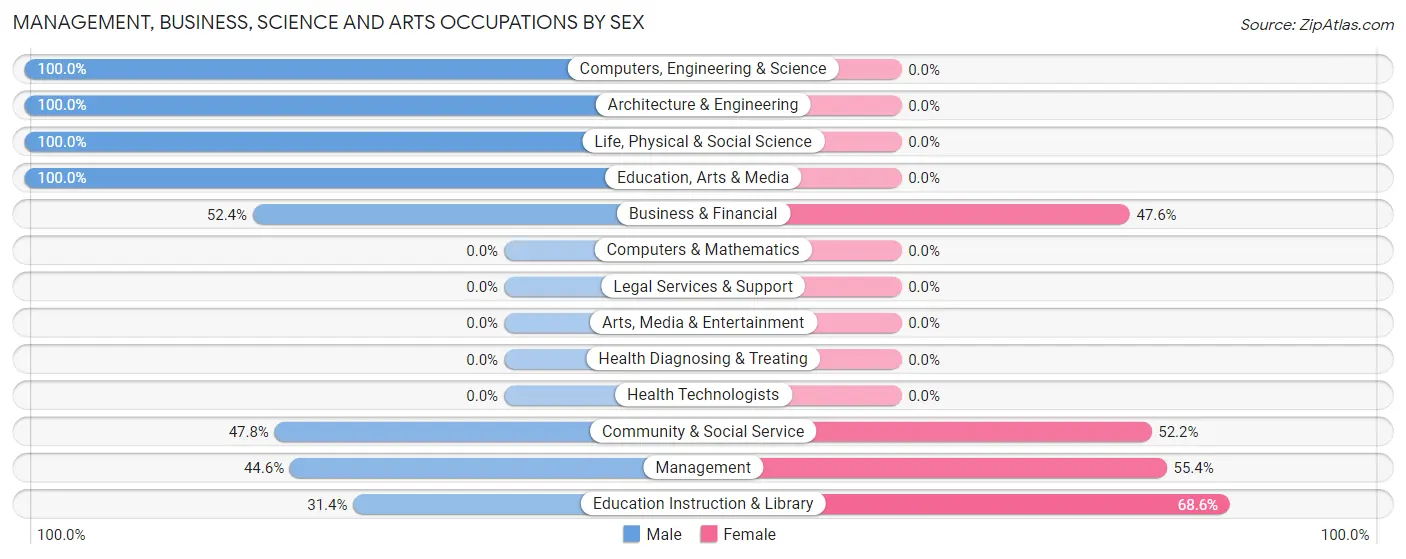
| Occupation | Male | Female |
| Management | 25 (44.6%) | 31 (55.4%) |
| Business & Financial | 11 (52.4%) | 10 (47.6%) |
| Computers, Engineering & Science | 46 (100.0%) | 0 (0.0%) |
| Computers & Mathematics | 0 (0.0%) | 0 (0.0%) |
| Architecture & Engineering | 13 (100.0%) | 0 (0.0%) |
| Life, Physical & Social Science | 33 (100.0%) | 0 (0.0%) |
| Community & Social Service | 22 (47.8%) | 24 (52.2%) |
| Education, Arts & Media | 11 (100.0%) | 0 (0.0%) |
| Legal Services & Support | 0 (0.0%) | 0 (0.0%) |
| Education Instruction & Library | 11 (31.4%) | 24 (68.6%) |
| Arts, Media & Entertainment | 0 (0.0%) | 0 (0.0%) |
| Health Diagnosing & Treating | 0 (0.0%) | 0 (0.0%) |
| Health Technologists | 0 (0.0%) | 0 (0.0%) |
| Total (Category) | 104 (61.5%) | 65 (38.5%) |
| Total (Overall) | 436 (62.4%) | 263 (37.6%) |
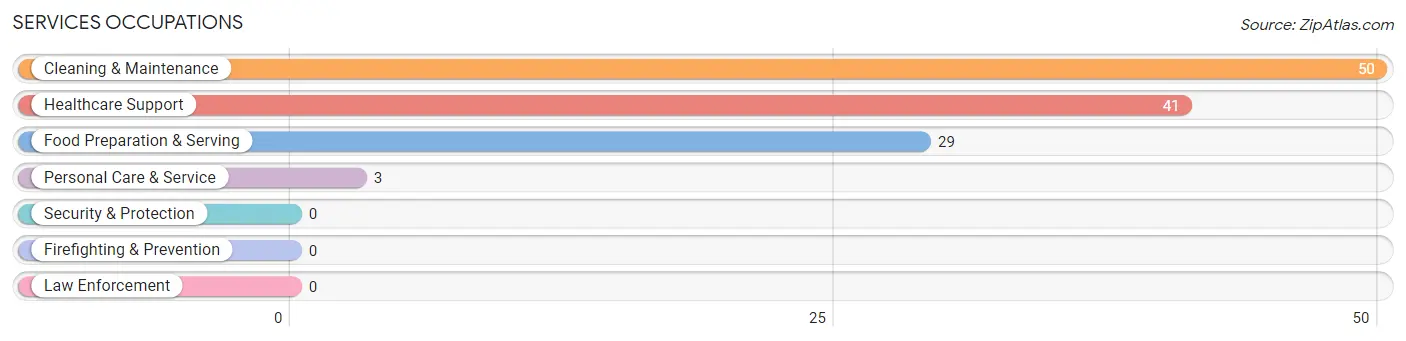
Services Occupations
The most common Services occupations in Thompson Falls are Cleaning & Maintenance (50 | 7.1%), Healthcare Support (41 | 5.9%), Food Preparation & Serving (29 | 4.2%), and Personal Care & Service (3 | 0.4%).
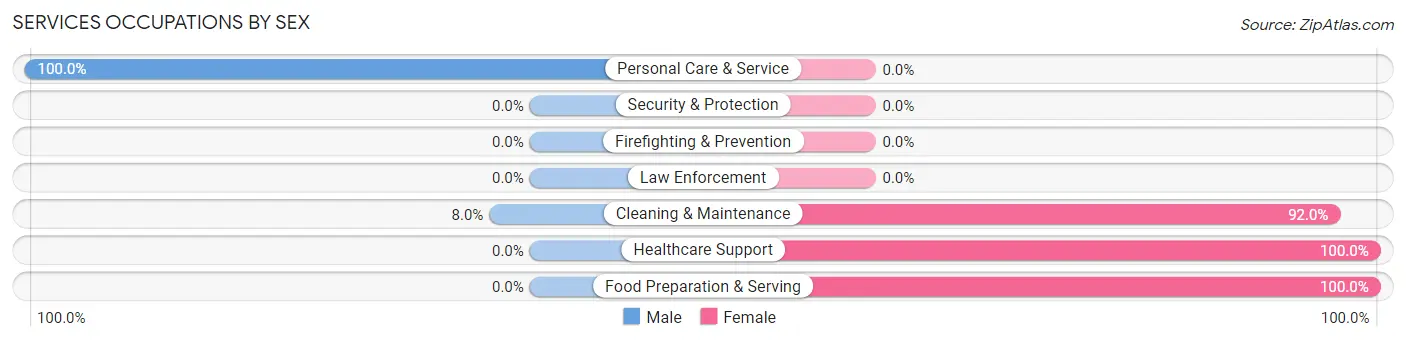
Services Occupations by Sex
Within the Services occupations in Thompson Falls, the most male-oriented occupations are Personal Care & Service (100.0%), and Cleaning & Maintenance (8.0%), while the most female-oriented occupations are Healthcare Support (100.0%), Food Preparation & Serving (100.0%), and Cleaning & Maintenance (92.0%).
| Occupation | Male | Female |
| Healthcare Support | 0 (0.0%) | 41 (100.0%) |
| Security & Protection | 0 (0.0%) | 0 (0.0%) |
| Firefighting & Prevention | 0 (0.0%) | 0 (0.0%) |
| Law Enforcement | 0 (0.0%) | 0 (0.0%) |
| Food Preparation & Serving | 0 (0.0%) | 29 (100.0%) |
| Cleaning & Maintenance | 4 (8.0%) | 46 (92.0%) |
| Personal Care & Service | 3 (100.0%) | 0 (0.0%) |
| Total (Category) | 7 (5.7%) | 116 (94.3%) |
| Total (Overall) | 436 (62.4%) | 263 (37.6%) |
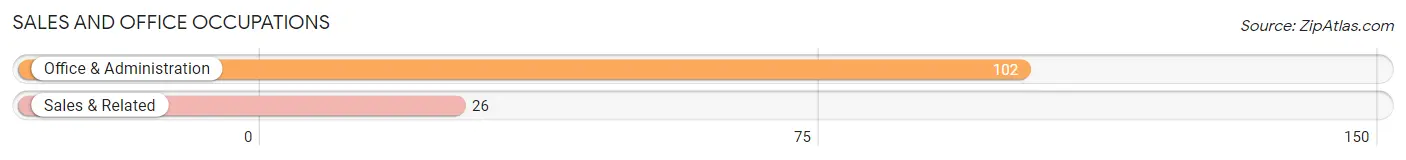
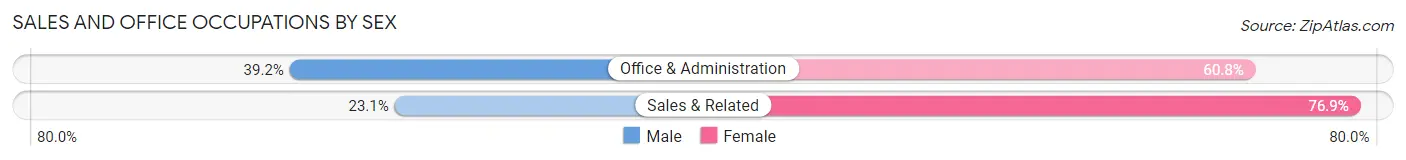
Sales and Office Occupations
The most common Sales and Office occupations in Thompson Falls are Office & Administration (102 | 14.6%), and Sales & Related (26 | 3.7%).
Sales and Office Occupations by Sex
| Occupation | Male | Female |
| Sales & Related | 6 (23.1%) | 20 (76.9%) |
| Office & Administration | 40 (39.2%) | 62 (60.8%) |
| Total (Category) | 46 (35.9%) | 82 (64.1%) |
| Total (Overall) | 436 (62.4%) | 263 (37.6%) |
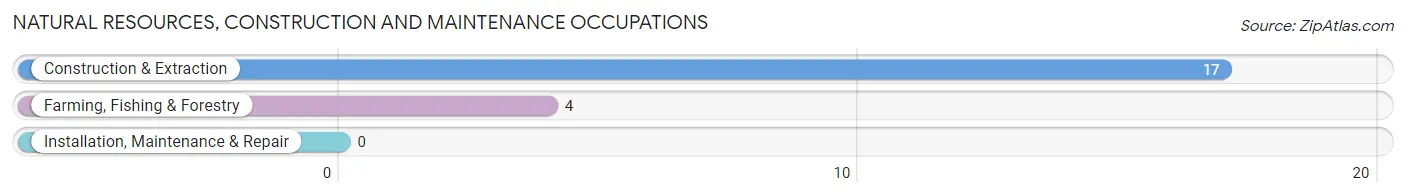
Natural Resources, Construction and Maintenance Occupations
The most common Natural Resources, Construction and Maintenance occupations in Thompson Falls are Construction & Extraction (17 | 2.4%), and Farming, Fishing & Forestry (4 | 0.6%).
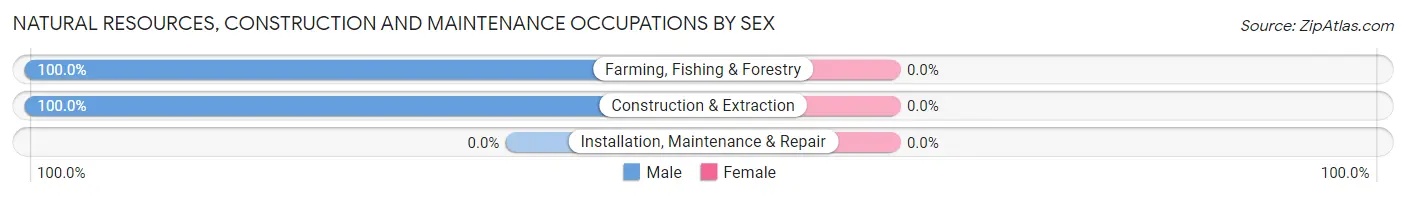
Natural Resources, Construction and Maintenance Occupations by Sex
| Occupation | Male | Female |
| Farming, Fishing & Forestry | 4 (100.0%) | 0 (0.0%) |
| Construction & Extraction | 17 (100.0%) | 0 (0.0%) |
| Installation, Maintenance & Repair | 0 (0.0%) | 0 (0.0%) |
| Total (Category) | 21 (100.0%) | 0 (0.0%) |
| Total (Overall) | 436 (62.4%) | 263 (37.6%) |
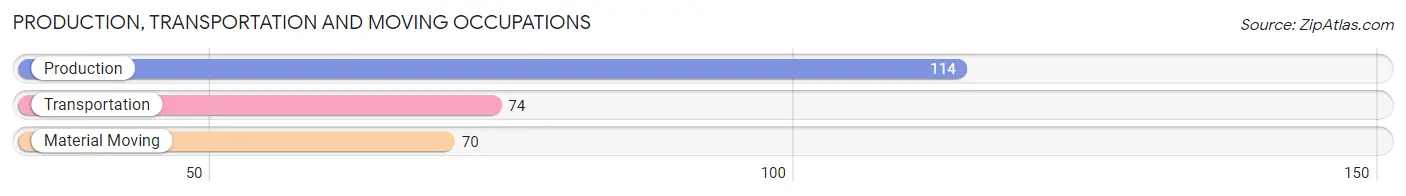
Production, Transportation and Moving Occupations
The most common Production, Transportation and Moving occupations in Thompson Falls are Production (114 | 16.3%), Transportation (74 | 10.6%), and Material Moving (70 | 10.0%).
Production, Transportation and Moving Occupations by Sex
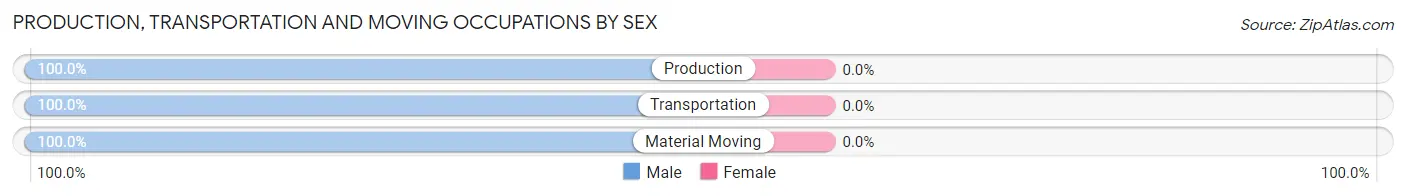
| Occupation | Male | Female |
| Production | 114 (100.0%) | 0 (0.0%) |
| Transportation | 74 (100.0%) | 0 (0.0%) |
| Material Moving | 70 (100.0%) | 0 (0.0%) |
| Total (Category) | 258 (100.0%) | 0 (0.0%) |
| Total (Overall) | 436 (62.4%) | 263 (37.6%) |
Employment Industries by Sex in Thompson Falls
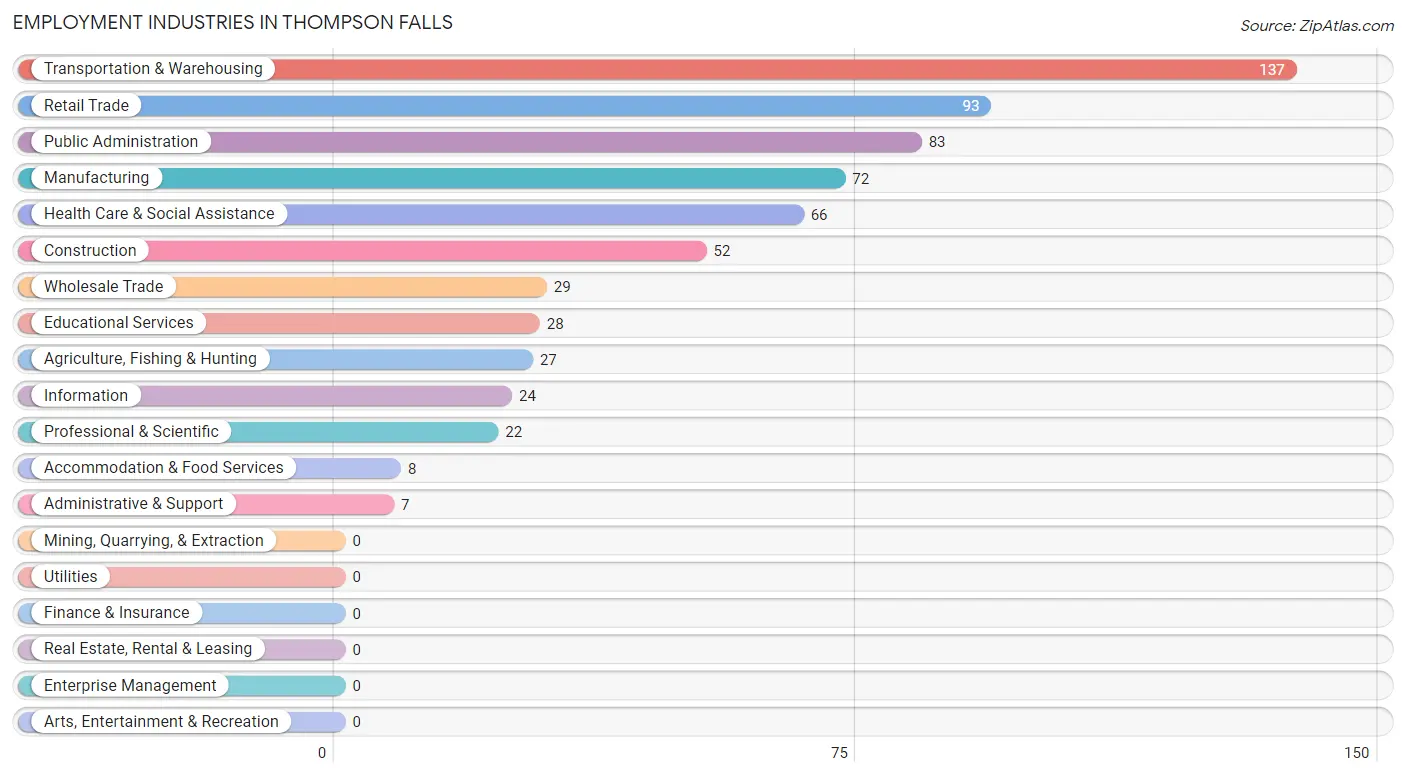
Employment Industries in Thompson Falls
The major employment industries in Thompson Falls include Transportation & Warehousing (137 | 19.6%), Retail Trade (93 | 13.3%), Public Administration (83 | 11.9%), Manufacturing (72 | 10.3%), and Health Care & Social Assistance (66 | 9.4%).
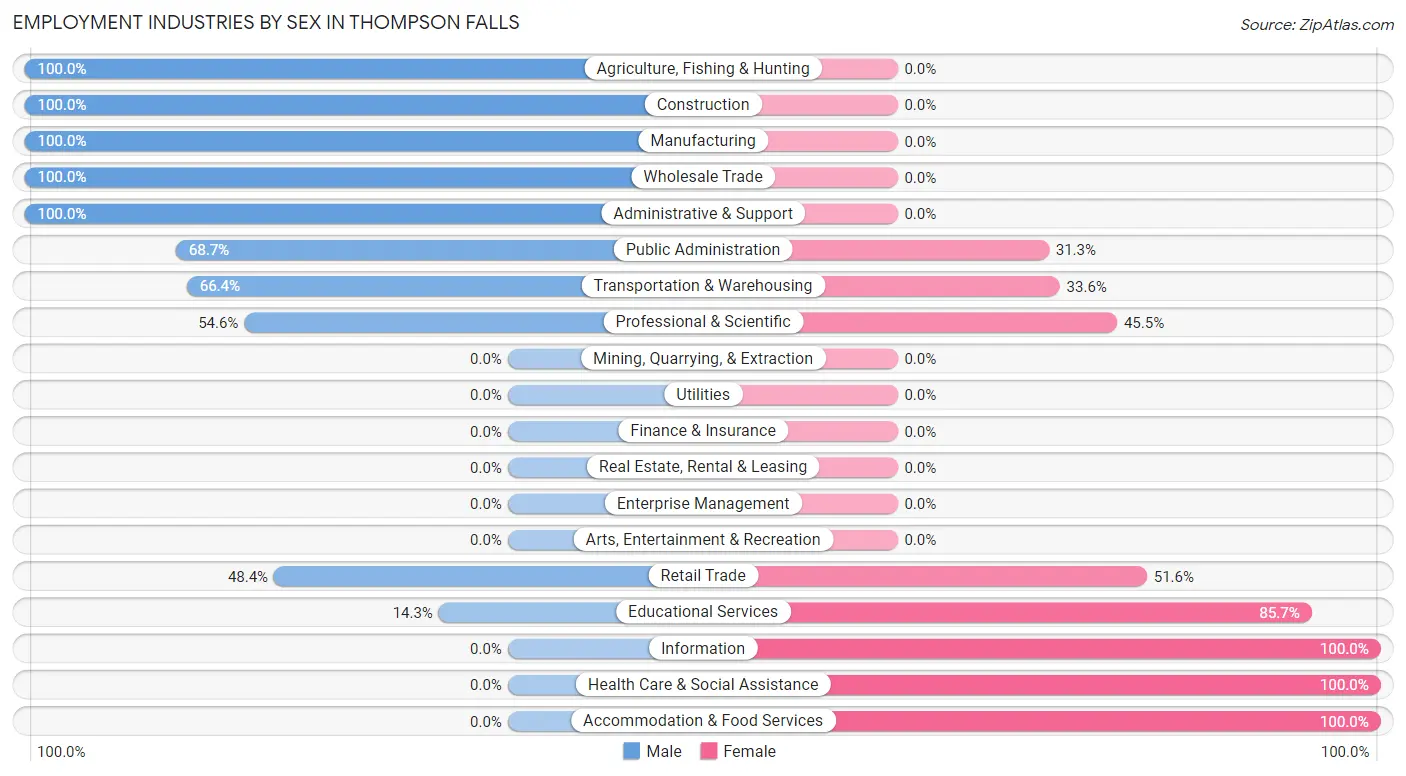
Employment Industries by Sex in Thompson Falls
The Thompson Falls industries that see more men than women are Agriculture, Fishing & Hunting (100.0%), Construction (100.0%), and Manufacturing (100.0%), whereas the industries that tend to have a higher number of women are Information (100.0%), Health Care & Social Assistance (100.0%), and Accommodation & Food Services (100.0%).
| Industry | Male | Female |
| Agriculture, Fishing & Hunting | 27 (100.0%) | 0 (0.0%) |
| Mining, Quarrying, & Extraction | 0 (0.0%) | 0 (0.0%) |
| Construction | 52 (100.0%) | 0 (0.0%) |
| Manufacturing | 72 (100.0%) | 0 (0.0%) |
| Wholesale Trade | 29 (100.0%) | 0 (0.0%) |
| Retail Trade | 45 (48.4%) | 48 (51.6%) |
| Transportation & Warehousing | 91 (66.4%) | 46 (33.6%) |
| Utilities | 0 (0.0%) | 0 (0.0%) |
| Information | 0 (0.0%) | 24 (100.0%) |
| Finance & Insurance | 0 (0.0%) | 0 (0.0%) |
| Real Estate, Rental & Leasing | 0 (0.0%) | 0 (0.0%) |
| Professional & Scientific | 12 (54.5%) | 10 (45.5%) |
| Enterprise Management | 0 (0.0%) | 0 (0.0%) |
| Administrative & Support | 7 (100.0%) | 0 (0.0%) |
| Educational Services | 4 (14.3%) | 24 (85.7%) |
| Health Care & Social Assistance | 0 (0.0%) | 66 (100.0%) |
| Arts, Entertainment & Recreation | 0 (0.0%) | 0 (0.0%) |
| Accommodation & Food Services | 0 (0.0%) | 8 (100.0%) |
| Public Administration | 57 (68.7%) | 26 (31.3%) |
| Total | 436 (62.4%) | 263 (37.6%) |
Education in Thompson Falls
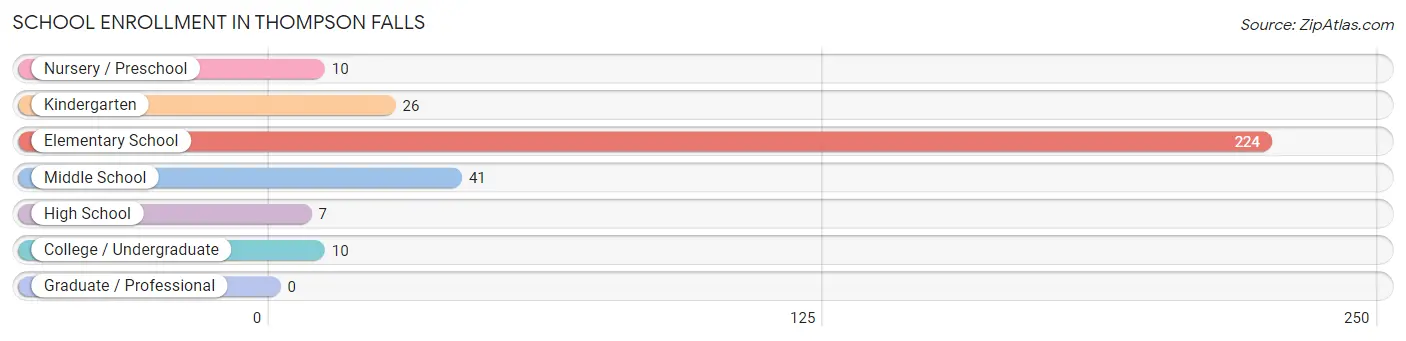
School Enrollment in Thompson Falls
The most common levels of schooling among the 318 students in Thompson Falls are elementary school (224 | 70.4%), middle school (41 | 12.9%), and kindergarten (26 | 8.2%).
| School Level | # Students | % Students |
| Nursery / Preschool | 10 | 3.1% |
| Kindergarten | 26 | 8.2% |
| Elementary School | 224 | 70.4% |
| Middle School | 41 | 12.9% |
| High School | 7 | 2.2% |
| College / Undergraduate | 10 | 3.1% |
| Graduate / Professional | 0 | 0.0% |
| Total | 318 | 100.0% |
School Enrollment by Age by Funding Source in Thompson Falls
Out of a total of 318 students who are enrolled in schools in Thompson Falls, 10 (3.1%) attend a private institution, while the remaining 308 (96.9%) are enrolled in public schools. The age group of 25 to 34 year olds has the highest likelihood of being enrolled in private schools, with 10 (58.8% in the age bracket) enrolled. Conversely, the age group of 3 to 4 year olds has the lowest likelihood of being enrolled in a private school, with 10 (100.0% in the age bracket) attending a public institution.
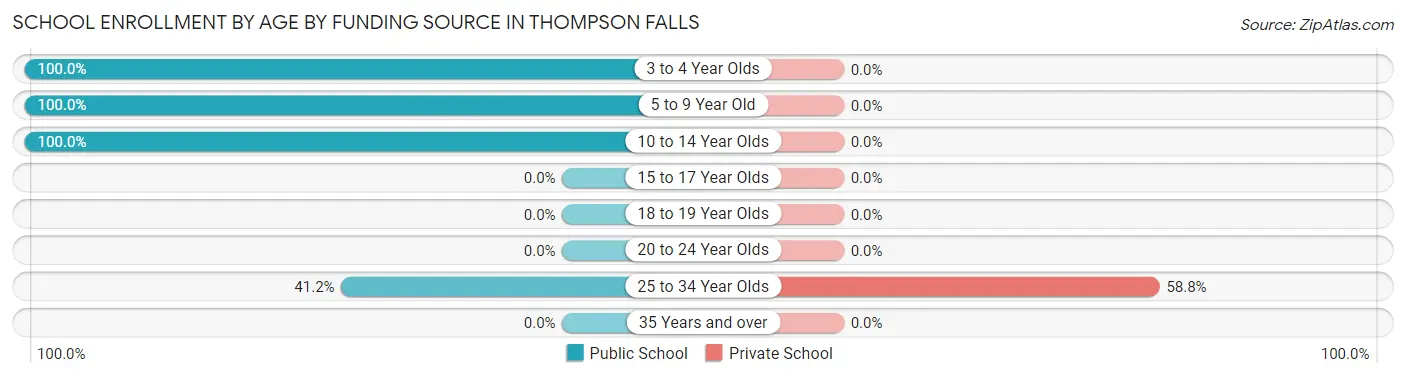
| Age Bracket | Public School | Private School |
| 3 to 4 Year Olds | 10 (100.0%) | 0 (0.0%) |
| 5 to 9 Year Old | 136 (100.0%) | 0 (0.0%) |
| 10 to 14 Year Olds | 155 (100.0%) | 0 (0.0%) |
| 15 to 17 Year Olds | 0 (0.0%) | 0 (0.0%) |
| 18 to 19 Year Olds | 0 (0.0%) | 0 (0.0%) |
| 20 to 24 Year Olds | 0 (0.0%) | 0 (0.0%) |
| 25 to 34 Year Olds | 7 (41.2%) | 10 (58.8%) |
| 35 Years and over | 0 (0.0%) | 0 (0.0%) |
| Total | 308 (96.9%) | 10 (3.1%) |
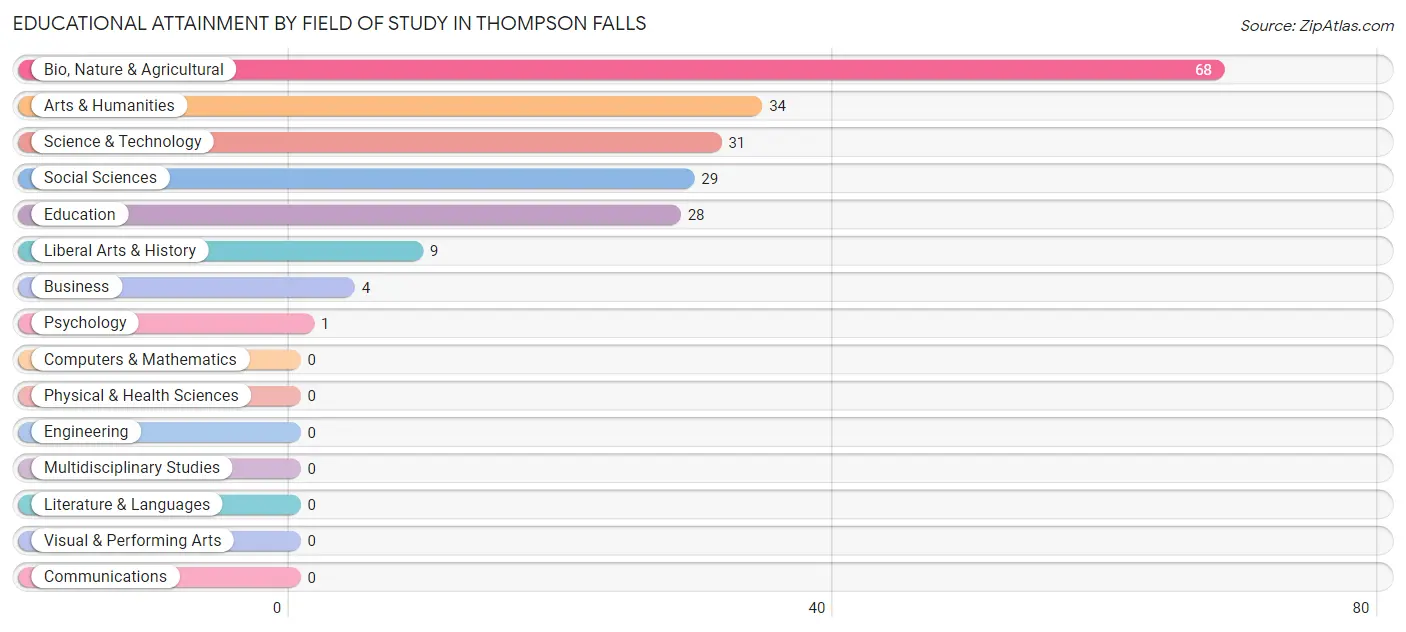
Educational Attainment by Field of Study in Thompson Falls
Bio, nature & agricultural (68 | 33.3%), arts & humanities (34 | 16.7%), science & technology (31 | 15.2%), social sciences (29 | 14.2%), and education (28 | 13.7%) are the most common fields of study among 204 individuals in Thompson Falls who have obtained a bachelor's degree or higher.
| Field of Study | # Graduates | % Graduates |
| Computers & Mathematics | 0 | 0.0% |
| Bio, Nature & Agricultural | 68 | 33.3% |
| Physical & Health Sciences | 0 | 0.0% |
| Psychology | 1 | 0.5% |
| Social Sciences | 29 | 14.2% |
| Engineering | 0 | 0.0% |
| Multidisciplinary Studies | 0 | 0.0% |
| Science & Technology | 31 | 15.2% |
| Business | 4 | 2.0% |
| Education | 28 | 13.7% |
| Literature & Languages | 0 | 0.0% |
| Liberal Arts & History | 9 | 4.4% |
| Visual & Performing Arts | 0 | 0.0% |
| Communications | 0 | 0.0% |
| Arts & Humanities | 34 | 16.7% |
| Total | 204 | 100.0% |
Transportation & Commute in Thompson Falls
Vehicle Availability by Sex in Thompson Falls
The most prevalent vehicle ownership categories in Thompson Falls are males with 3 vehicles (154, accounting for 35.8%) and females with 3 vehicles (103, making up 58.6%).
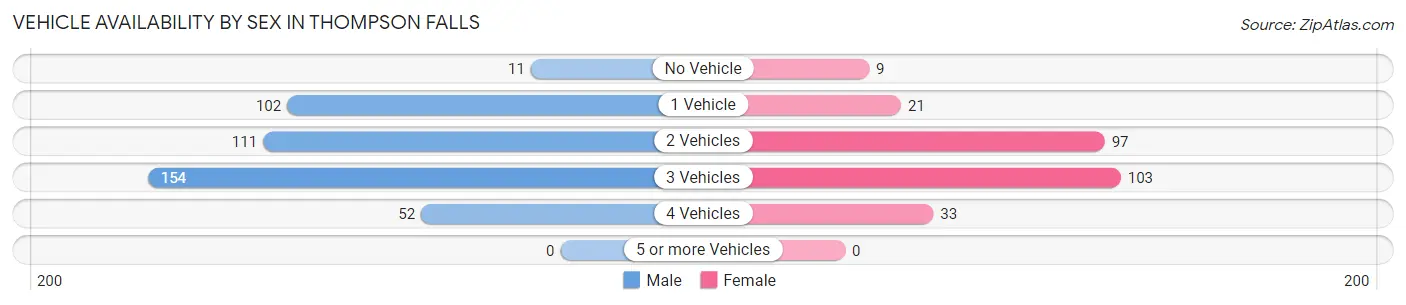
| Vehicles Available | Male | Female |
| No Vehicle | 11 (2.6%) | 9 (3.4%) |
| 1 Vehicle | 102 (23.7%) | 21 (8.0%) |
| 2 Vehicles | 111 (25.8%) | 97 (36.9%) |
| 3 Vehicles | 154 (35.8%) | 103 (39.2%) |
| 4 Vehicles | 52 (12.1%) | 33 (12.6%) |
| 5 or more Vehicles | 0 (0.0%) | 0 (0.0%) |
| Total | 430 (100.0%) | 263 (100.0%) |
Commute Time in Thompson Falls
The most frequently occuring commute durations in Thompson Falls are 5 to 9 minutes (244 commuters, 37.5%), 15 to 19 minutes (178 commuters, 27.4%), and 10 to 14 minutes (78 commuters, 12.0%).
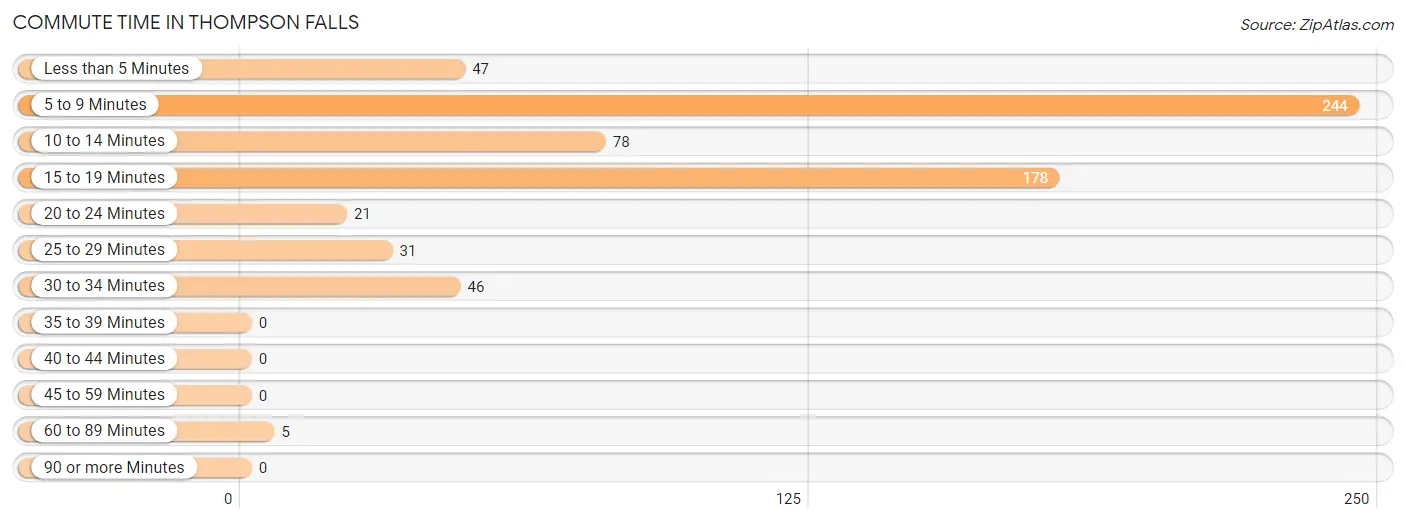
| Commute Time | # Commuters | % Commuters |
| Less than 5 Minutes | 47 | 7.2% |
| 5 to 9 Minutes | 244 | 37.5% |
| 10 to 14 Minutes | 78 | 12.0% |
| 15 to 19 Minutes | 178 | 27.4% |
| 20 to 24 Minutes | 21 | 3.2% |
| 25 to 29 Minutes | 31 | 4.8% |
| 30 to 34 Minutes | 46 | 7.1% |
| 35 to 39 Minutes | 0 | 0.0% |
| 40 to 44 Minutes | 0 | 0.0% |
| 45 to 59 Minutes | 0 | 0.0% |
| 60 to 89 Minutes | 5 | 0.8% |
| 90 or more Minutes | 0 | 0.0% |
Commute Time by Sex in Thompson Falls
The most common commute times in Thompson Falls are 15 to 19 minutes (167 commuters, 42.0%) for males and 5 to 9 minutes (120 commuters, 47.6%) for females.
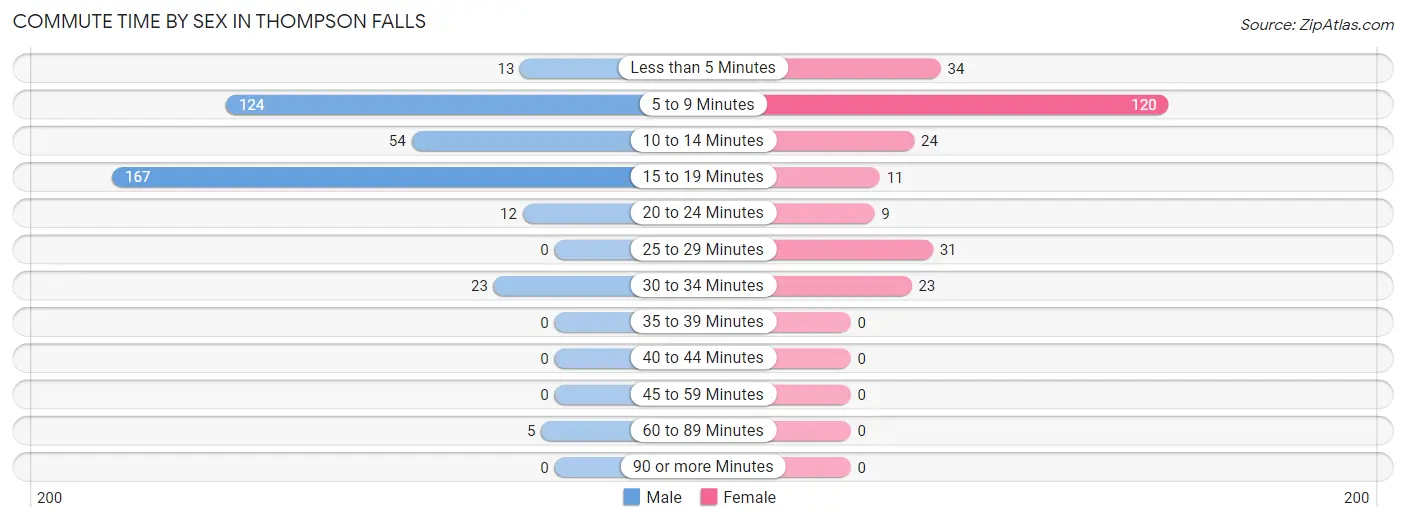
| Commute Time | Male | Female |
| Less than 5 Minutes | 13 (3.3%) | 34 (13.5%) |
| 5 to 9 Minutes | 124 (31.2%) | 120 (47.6%) |
| 10 to 14 Minutes | 54 (13.6%) | 24 (9.5%) |
| 15 to 19 Minutes | 167 (42.0%) | 11 (4.4%) |
| 20 to 24 Minutes | 12 (3.0%) | 9 (3.6%) |
| 25 to 29 Minutes | 0 (0.0%) | 31 (12.3%) |
| 30 to 34 Minutes | 23 (5.8%) | 23 (9.1%) |
| 35 to 39 Minutes | 0 (0.0%) | 0 (0.0%) |
| 40 to 44 Minutes | 0 (0.0%) | 0 (0.0%) |
| 45 to 59 Minutes | 0 (0.0%) | 0 (0.0%) |
| 60 to 89 Minutes | 5 (1.3%) | 0 (0.0%) |
| 90 or more Minutes | 0 (0.0%) | 0 (0.0%) |
Time of Departure to Work by Sex in Thompson Falls
The most frequent times of departure to work in Thompson Falls are 12:00 AM to 4:59 AM (67, 16.8%) for males and 8:00 AM to 8:29 AM (64, 25.4%) for females.
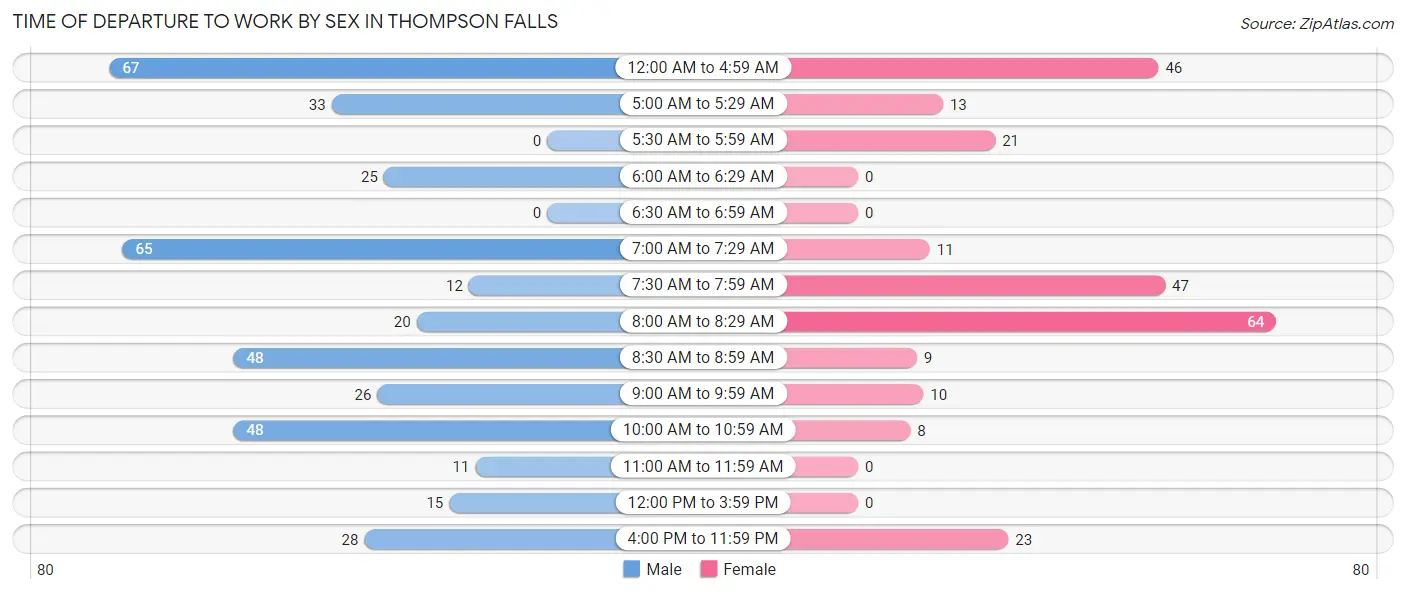
| Time of Departure | Male | Female |
| 12:00 AM to 4:59 AM | 67 (16.8%) | 46 (18.2%) |
| 5:00 AM to 5:29 AM | 33 (8.3%) | 13 (5.2%) |
| 5:30 AM to 5:59 AM | 0 (0.0%) | 21 (8.3%) |
| 6:00 AM to 6:29 AM | 25 (6.3%) | 0 (0.0%) |
| 6:30 AM to 6:59 AM | 0 (0.0%) | 0 (0.0%) |
| 7:00 AM to 7:29 AM | 65 (16.3%) | 11 (4.4%) |
| 7:30 AM to 7:59 AM | 12 (3.0%) | 47 (18.6%) |
| 8:00 AM to 8:29 AM | 20 (5.0%) | 64 (25.4%) |
| 8:30 AM to 8:59 AM | 48 (12.1%) | 9 (3.6%) |
| 9:00 AM to 9:59 AM | 26 (6.5%) | 10 (4.0%) |
| 10:00 AM to 10:59 AM | 48 (12.1%) | 8 (3.2%) |
| 11:00 AM to 11:59 AM | 11 (2.8%) | 0 (0.0%) |
| 12:00 PM to 3:59 PM | 15 (3.8%) | 0 (0.0%) |
| 4:00 PM to 11:59 PM | 28 (7.0%) | 23 (9.1%) |
| Total | 398 (100.0%) | 252 (100.0%) |
Housing Occupancy in Thompson Falls
Occupancy by Ownership in Thompson Falls
Of the total 711 dwellings in Thompson Falls, owner-occupied units account for 502 (70.6%), while renter-occupied units make up 209 (29.4%).
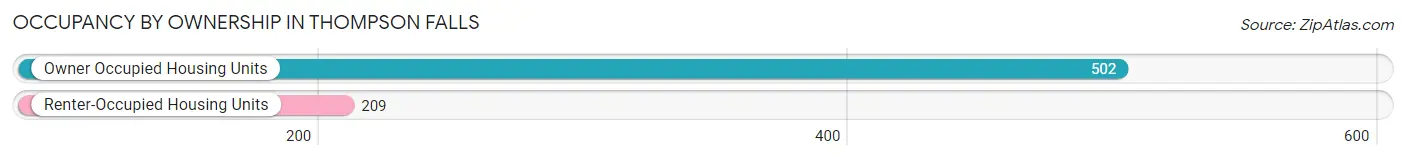
| Occupancy | # Housing Units | % Housing Units |
| Owner Occupied Housing Units | 502 | 70.6% |
| Renter-Occupied Housing Units | 209 | 29.4% |
| Total Occupied Housing Units | 711 | 100.0% |
Occupancy by Household Size in Thompson Falls
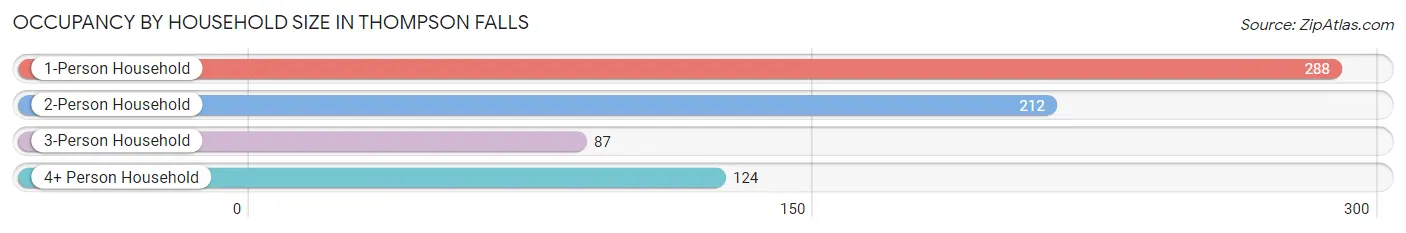
| Household Size | # Housing Units | % Housing Units |
| 1-Person Household | 288 | 40.5% |
| 2-Person Household | 212 | 29.8% |
| 3-Person Household | 87 | 12.2% |
| 4+ Person Household | 124 | 17.4% |
| Total Housing Units | 711 | 100.0% |
Occupancy by Ownership by Household Size in Thompson Falls
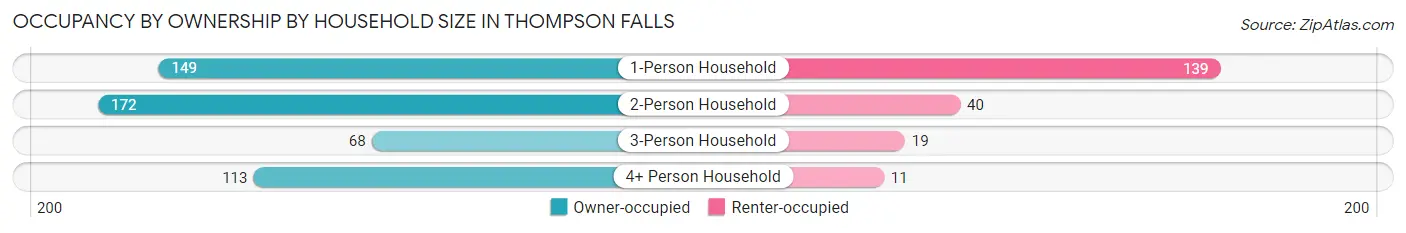
| Household Size | Owner-occupied | Renter-occupied |
| 1-Person Household | 149 (51.7%) | 139 (48.3%) |
| 2-Person Household | 172 (81.1%) | 40 (18.9%) |
| 3-Person Household | 68 (78.2%) | 19 (21.8%) |
| 4+ Person Household | 113 (91.1%) | 11 (8.9%) |
| Total Housing Units | 502 (70.6%) | 209 (29.4%) |
Occupancy by Educational Attainment in Thompson Falls
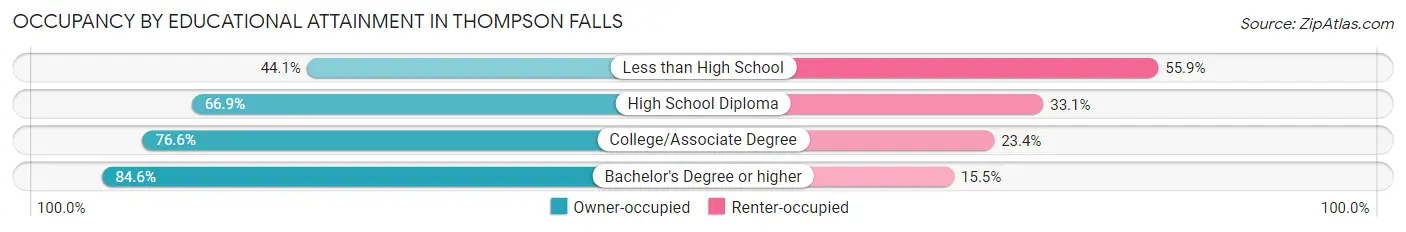
| Household Size | Owner-occupied | Renter-occupied |
| Less than High School | 26 (44.1%) | 33 (55.9%) |
| High School Diploma | 228 (66.9%) | 113 (33.1%) |
| College/Associate Degree | 144 (76.6%) | 44 (23.4%) |
| Bachelor's Degree or higher | 104 (84.6%) | 19 (15.4%) |
Occupancy by Age of Householder in Thompson Falls
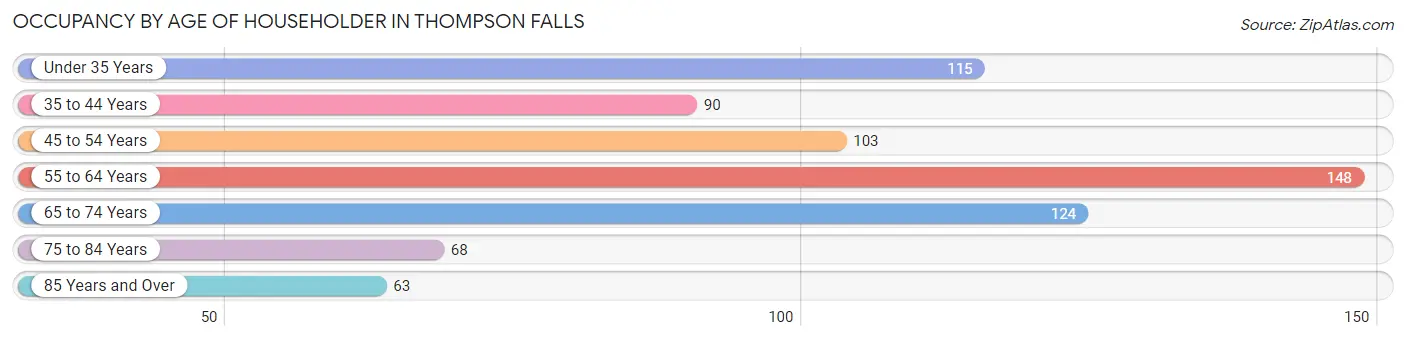
| Age Bracket | # Households | % Households |
| Under 35 Years | 115 | 16.2% |
| 35 to 44 Years | 90 | 12.7% |
| 45 to 54 Years | 103 | 14.5% |
| 55 to 64 Years | 148 | 20.8% |
| 65 to 74 Years | 124 | 17.4% |
| 75 to 84 Years | 68 | 9.6% |
| 85 Years and Over | 63 | 8.9% |
| Total | 711 | 100.0% |
Housing Finances in Thompson Falls
Median Income by Occupancy in Thompson Falls
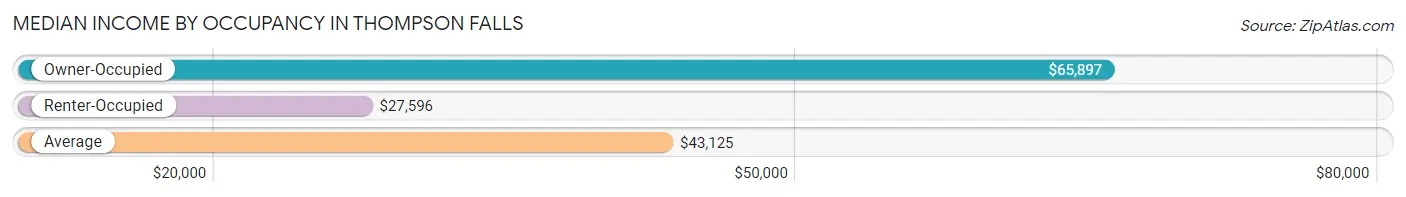
| Occupancy Type | # Households | Median Income |
| Owner-Occupied | 502 (70.6%) | $65,897 |
| Renter-Occupied | 209 (29.4%) | $27,596 |
| Average | 711 (100.0%) | $43,125 |
Occupancy by Householder Income Bracket in Thompson Falls
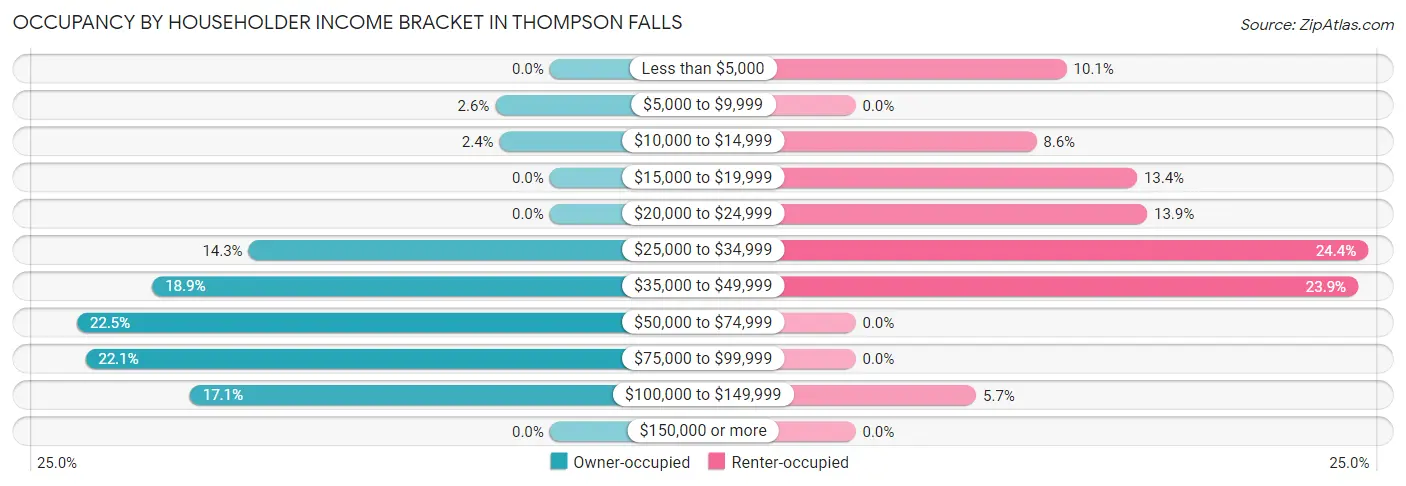
| Income Bracket | Owner-occupied | Renter-occupied |
| Less than $5,000 | 0 (0.0%) | 21 (10.1%) |
| $5,000 to $9,999 | 13 (2.6%) | 0 (0.0%) |
| $10,000 to $14,999 | 12 (2.4%) | 18 (8.6%) |
| $15,000 to $19,999 | 0 (0.0%) | 28 (13.4%) |
| $20,000 to $24,999 | 0 (0.0%) | 29 (13.9%) |
| $25,000 to $34,999 | 72 (14.3%) | 51 (24.4%) |
| $35,000 to $49,999 | 95 (18.9%) | 50 (23.9%) |
| $50,000 to $74,999 | 113 (22.5%) | 0 (0.0%) |
| $75,000 to $99,999 | 111 (22.1%) | 0 (0.0%) |
| $100,000 to $149,999 | 86 (17.1%) | 12 (5.7%) |
| $150,000 or more | 0 (0.0%) | 0 (0.0%) |
| Total | 502 (100.0%) | 209 (100.0%) |
Monthly Housing Cost Tiers in Thompson Falls
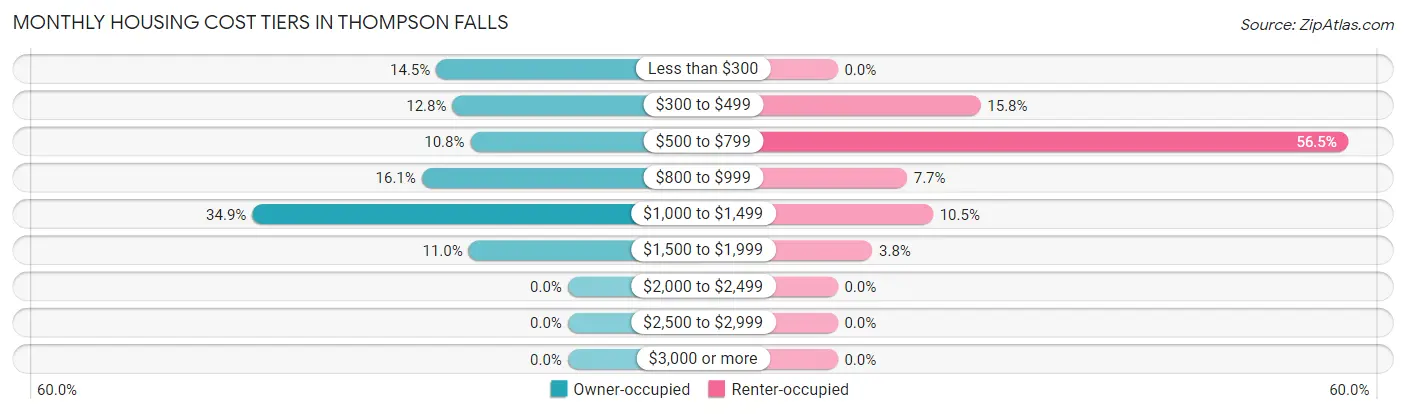
| Monthly Cost | Owner-occupied | Renter-occupied |
| Less than $300 | 73 (14.5%) | 0 (0.0%) |
| $300 to $499 | 64 (12.8%) | 33 (15.8%) |
| $500 to $799 | 54 (10.8%) | 118 (56.5%) |
| $800 to $999 | 81 (16.1%) | 16 (7.7%) |
| $1,000 to $1,499 | 175 (34.9%) | 22 (10.5%) |
| $1,500 to $1,999 | 55 (11.0%) | 8 (3.8%) |
| $2,000 to $2,499 | 0 (0.0%) | 0 (0.0%) |
| $2,500 to $2,999 | 0 (0.0%) | 0 (0.0%) |
| $3,000 or more | 0 (0.0%) | 0 (0.0%) |
| Total | 502 (100.0%) | 209 (100.0%) |
Physical Housing Characteristics in Thompson Falls
Housing Structures in Thompson Falls
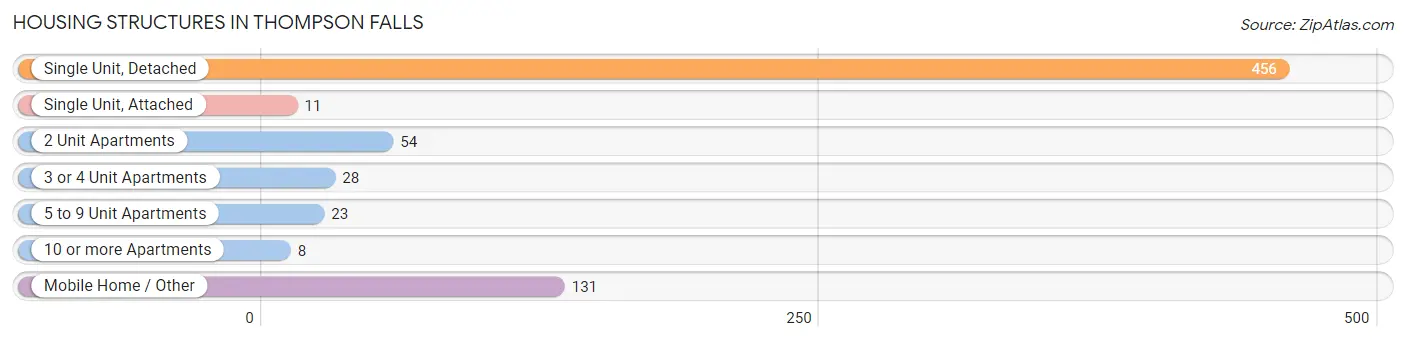
| Structure Type | # Housing Units | % Housing Units |
| Single Unit, Detached | 456 | 64.1% |
| Single Unit, Attached | 11 | 1.5% |
| 2 Unit Apartments | 54 | 7.6% |
| 3 or 4 Unit Apartments | 28 | 3.9% |
| 5 to 9 Unit Apartments | 23 | 3.2% |
| 10 or more Apartments | 8 | 1.1% |
| Mobile Home / Other | 131 | 18.4% |
| Total | 711 | 100.0% |
Housing Structures by Occupancy in Thompson Falls
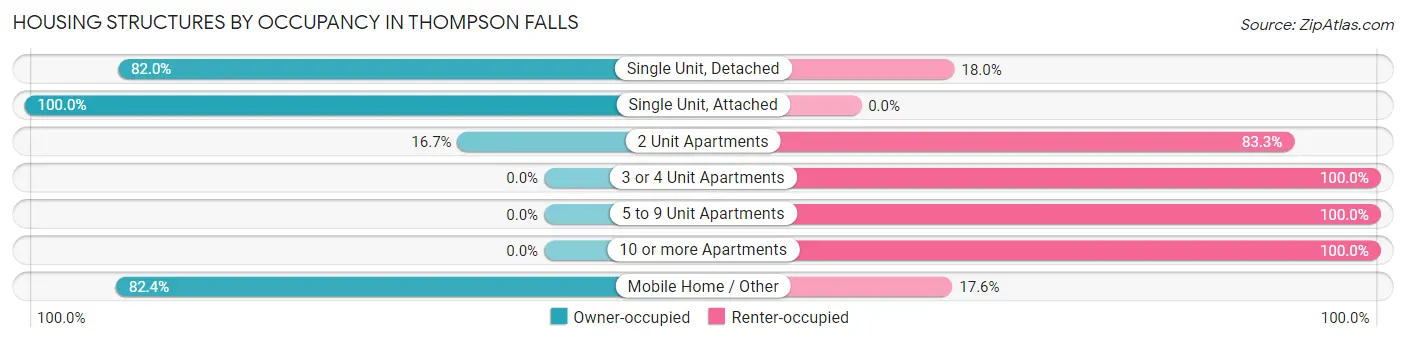
| Structure Type | Owner-occupied | Renter-occupied |
| Single Unit, Detached | 374 (82.0%) | 82 (18.0%) |
| Single Unit, Attached | 11 (100.0%) | 0 (0.0%) |
| 2 Unit Apartments | 9 (16.7%) | 45 (83.3%) |
| 3 or 4 Unit Apartments | 0 (0.0%) | 28 (100.0%) |
| 5 to 9 Unit Apartments | 0 (0.0%) | 23 (100.0%) |
| 10 or more Apartments | 0 (0.0%) | 8 (100.0%) |
| Mobile Home / Other | 108 (82.4%) | 23 (17.6%) |
| Total | 502 (70.6%) | 209 (29.4%) |
Housing Structures by Number of Rooms in Thompson Falls
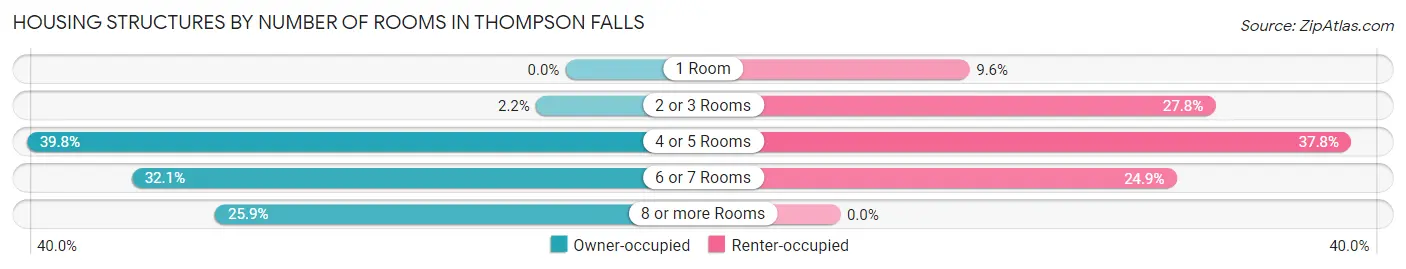
| Number of Rooms | Owner-occupied | Renter-occupied |
| 1 Room | 0 (0.0%) | 20 (9.6%) |
| 2 or 3 Rooms | 11 (2.2%) | 58 (27.8%) |
| 4 or 5 Rooms | 200 (39.8%) | 79 (37.8%) |
| 6 or 7 Rooms | 161 (32.1%) | 52 (24.9%) |
| 8 or more Rooms | 130 (25.9%) | 0 (0.0%) |
| Total | 502 (100.0%) | 209 (100.0%) |
Housing Structure by Heating Type in Thompson Falls
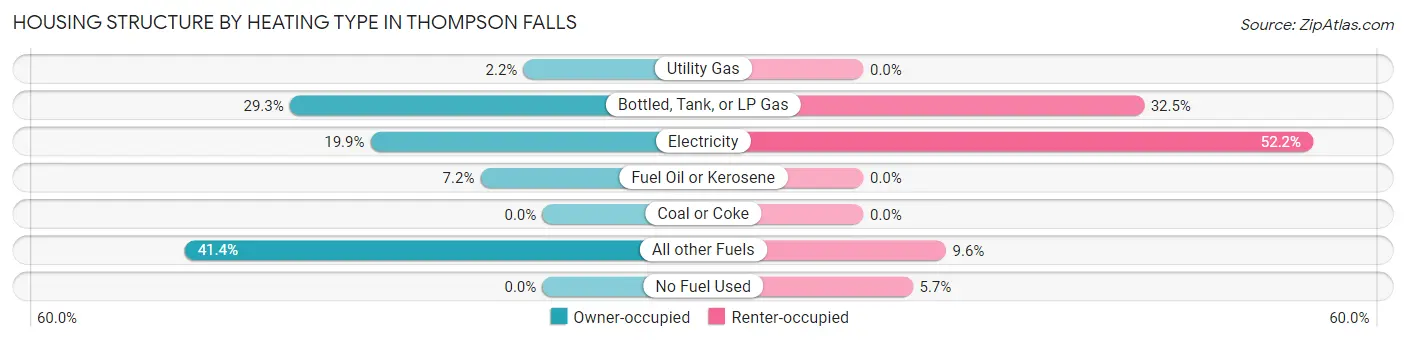
| Heating Type | Owner-occupied | Renter-occupied |
| Utility Gas | 11 (2.2%) | 0 (0.0%) |
| Bottled, Tank, or LP Gas | 147 (29.3%) | 68 (32.5%) |
| Electricity | 100 (19.9%) | 109 (52.1%) |
| Fuel Oil or Kerosene | 36 (7.2%) | 0 (0.0%) |
| Coal or Coke | 0 (0.0%) | 0 (0.0%) |
| All other Fuels | 208 (41.4%) | 20 (9.6%) |
| No Fuel Used | 0 (0.0%) | 12 (5.7%) |
| Total | 502 (100.0%) | 209 (100.0%) |
Household Vehicle Usage in Thompson Falls
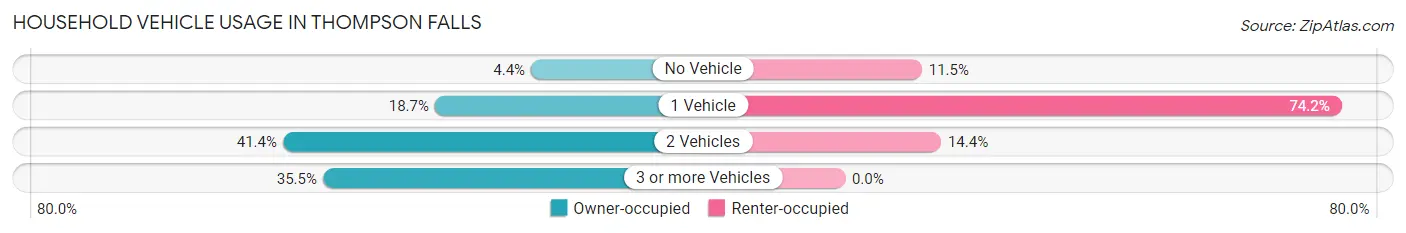
| Vehicles per Household | Owner-occupied | Renter-occupied |
| No Vehicle | 22 (4.4%) | 24 (11.5%) |
| 1 Vehicle | 94 (18.7%) | 155 (74.2%) |
| 2 Vehicles | 208 (41.4%) | 30 (14.3%) |
| 3 or more Vehicles | 178 (35.5%) | 0 (0.0%) |
| Total | 502 (100.0%) | 209 (100.0%) |
Real Estate & Mortgages in Thompson Falls
Real Estate and Mortgage Overview in Thompson Falls
| Characteristic | Without Mortgage | With Mortgage |
| Housing Units | 194 | 308 |
| Median Property Value | $122,800 | $192,900 |
| Median Household Income | $42,500 | $0 |
| Monthly Housing Costs | $344 | $0 |
| Real Estate Taxes | $1,421 | $0 |
Property Value by Mortgage Status in Thompson Falls
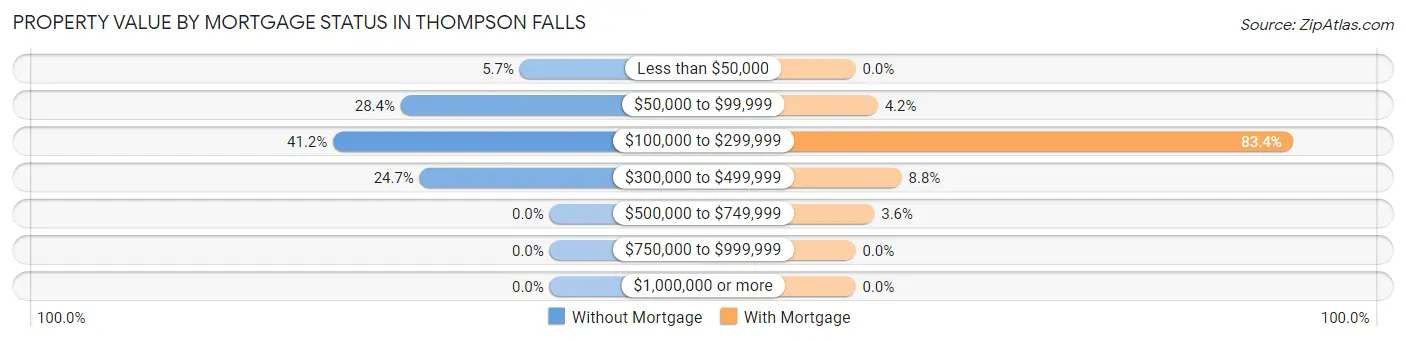
| Property Value | Without Mortgage | With Mortgage |
| Less than $50,000 | 11 (5.7%) | 0 (0.0%) |
| $50,000 to $99,999 | 55 (28.3%) | 13 (4.2%) |
| $100,000 to $299,999 | 80 (41.2%) | 257 (83.4%) |
| $300,000 to $499,999 | 48 (24.7%) | 27 (8.8%) |
| $500,000 to $749,999 | 0 (0.0%) | 11 (3.6%) |
| $750,000 to $999,999 | 0 (0.0%) | 0 (0.0%) |
| $1,000,000 or more | 0 (0.0%) | 0 (0.0%) |
| Total | 194 (100.0%) | 308 (100.0%) |
Household Income by Mortgage Status in Thompson Falls
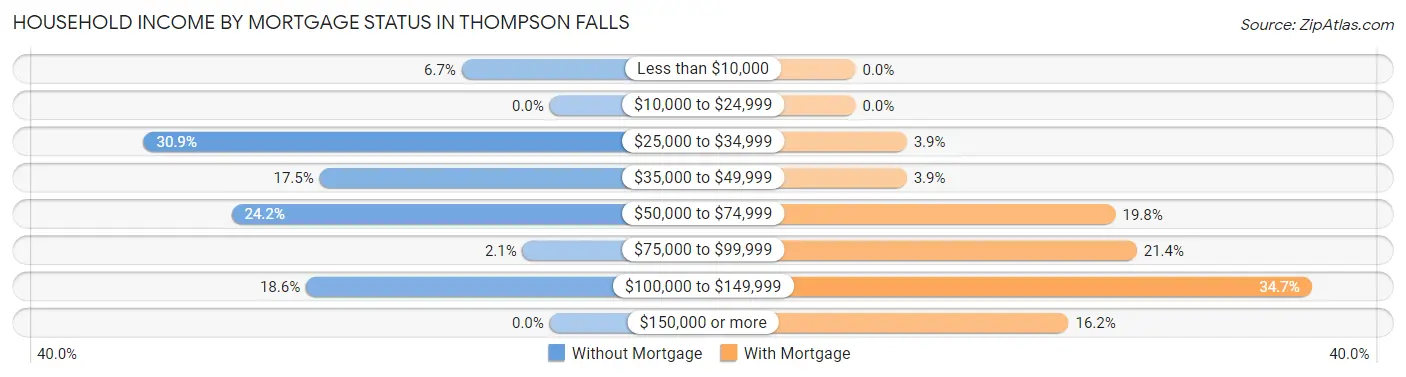
| Household Income | Without Mortgage | With Mortgage |
| Less than $10,000 | 13 (6.7%) | 0 (0.0%) |
| $10,000 to $24,999 | 0 (0.0%) | 0 (0.0%) |
| $25,000 to $34,999 | 60 (30.9%) | 12 (3.9%) |
| $35,000 to $49,999 | 34 (17.5%) | 12 (3.9%) |
| $50,000 to $74,999 | 47 (24.2%) | 61 (19.8%) |
| $75,000 to $99,999 | 4 (2.1%) | 66 (21.4%) |
| $100,000 to $149,999 | 36 (18.6%) | 107 (34.7%) |
| $150,000 or more | 0 (0.0%) | 50 (16.2%) |
| Total | 194 (100.0%) | 308 (100.0%) |
Property Value to Household Income Ratio in Thompson Falls
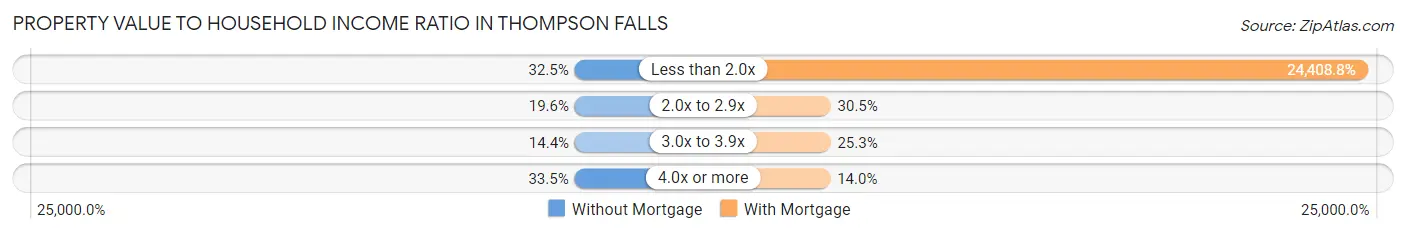
| Value-to-Income Ratio | Without Mortgage | With Mortgage |
| Less than 2.0x | 63 (32.5%) | 75,179 (24,408.8%) |
| 2.0x to 2.9x | 38 (19.6%) | 94 (30.5%) |
| 3.0x to 3.9x | 28 (14.4%) | 78 (25.3%) |
| 4.0x or more | 65 (33.5%) | 43 (14.0%) |
| Total | 194 (100.0%) | 308 (100.0%) |
Real Estate Taxes by Mortgage Status in Thompson Falls
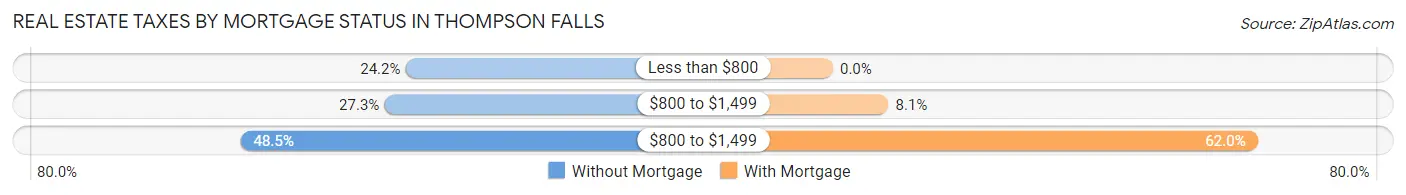
| Property Taxes | Without Mortgage | With Mortgage |
| Less than $800 | 47 (24.2%) | 0 (0.0%) |
| $800 to $1,499 | 53 (27.3%) | 25 (8.1%) |
| $800 to $1,499 | 94 (48.4%) | 191 (62.0%) |
| Total | 194 (100.0%) | 308 (100.0%) |
Health & Disability in Thompson Falls
Health Insurance Coverage by Age in Thompson Falls
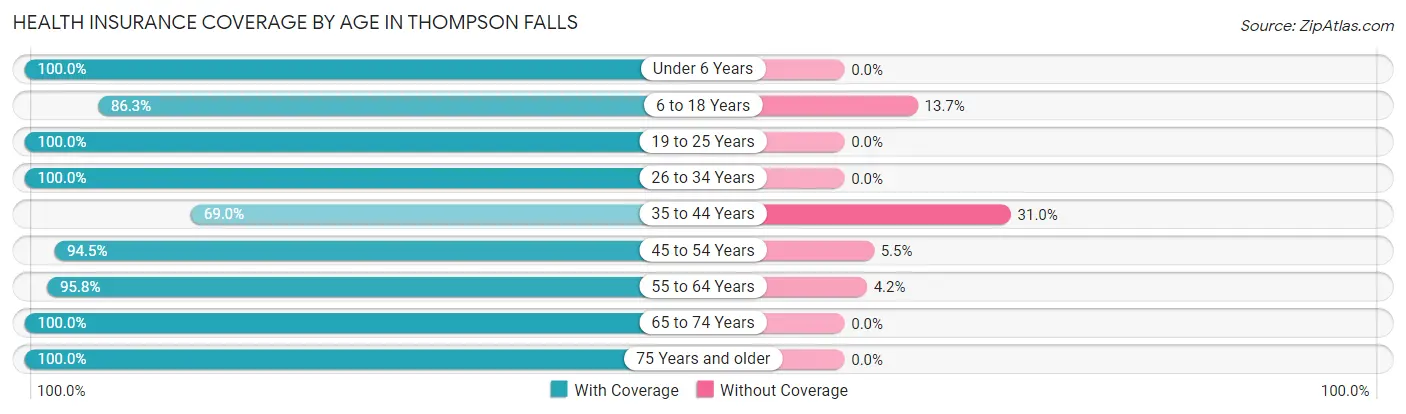
| Age Bracket | With Coverage | Without Coverage |
| Under 6 Years | 121 (100.0%) | 0 (0.0%) |
| 6 to 18 Years | 240 (86.3%) | 38 (13.7%) |
| 19 to 25 Years | 61 (100.0%) | 0 (0.0%) |
| 26 to 34 Years | 208 (100.0%) | 0 (0.0%) |
| 35 to 44 Years | 89 (69.0%) | 40 (31.0%) |
| 45 to 54 Years | 224 (94.5%) | 13 (5.5%) |
| 55 to 64 Years | 252 (95.8%) | 11 (4.2%) |
| 65 to 74 Years | 165 (100.0%) | 0 (0.0%) |
| 75 Years and older | 162 (100.0%) | 0 (0.0%) |
| Total | 1,522 (93.7%) | 102 (6.3%) |
Health Insurance Coverage by Citizenship Status in Thompson Falls
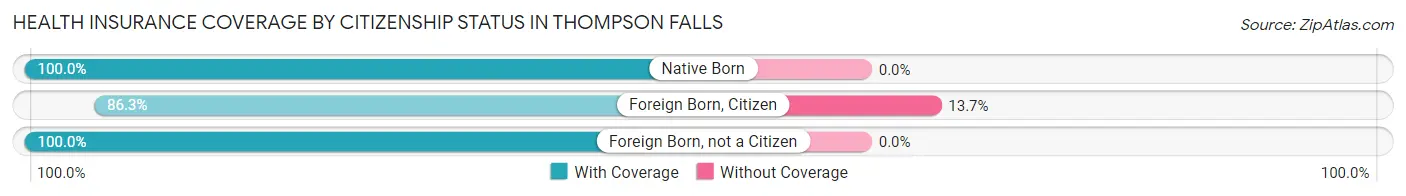
| Citizenship Status | With Coverage | Without Coverage |
| Native Born | 121 (100.0%) | 0 (0.0%) |
| Foreign Born, Citizen | 240 (86.3%) | 38 (13.7%) |
| Foreign Born, not a Citizen | 61 (100.0%) | 0 (0.0%) |
Health Insurance Coverage by Household Income in Thompson Falls
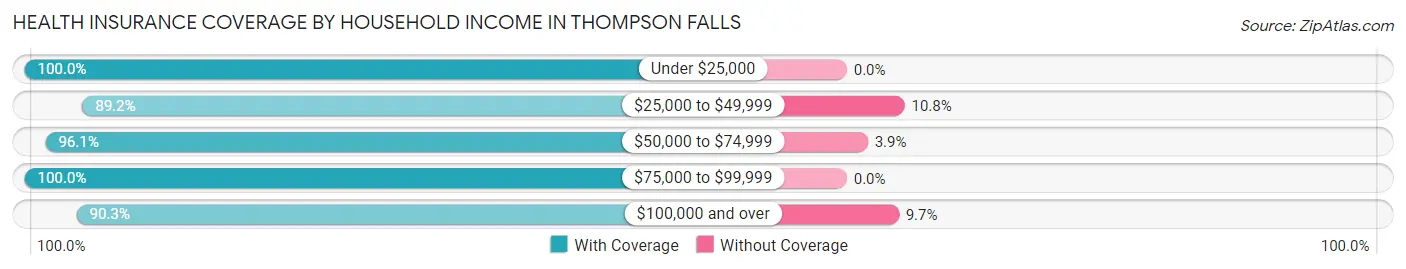
| Household Income | With Coverage | Without Coverage |
| Under $25,000 | 140 (100.0%) | 0 (0.0%) |
| $25,000 to $49,999 | 511 (89.2%) | 62 (10.8%) |
| $50,000 to $74,999 | 368 (96.1%) | 15 (3.9%) |
| $75,000 to $99,999 | 267 (100.0%) | 0 (0.0%) |
| $100,000 and over | 232 (90.3%) | 25 (9.7%) |
Public vs Private Health Insurance Coverage by Age in Thompson Falls
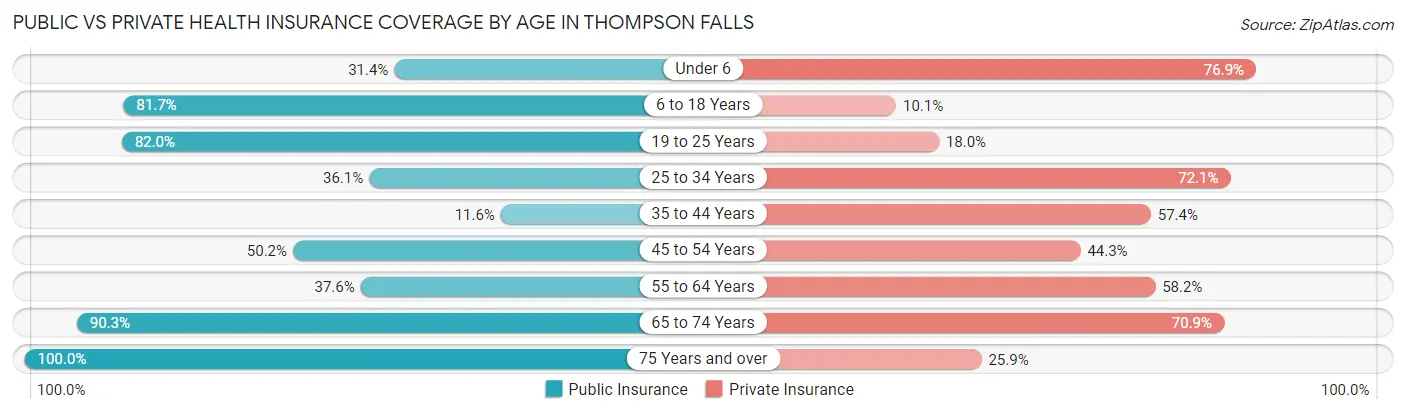
| Age Bracket | Public Insurance | Private Insurance |
| Under 6 | 38 (31.4%) | 93 (76.9%) |
| 6 to 18 Years | 227 (81.7%) | 28 (10.1%) |
| 19 to 25 Years | 50 (82.0%) | 11 (18.0%) |
| 25 to 34 Years | 75 (36.1%) | 150 (72.1%) |
| 35 to 44 Years | 15 (11.6%) | 74 (57.4%) |
| 45 to 54 Years | 119 (50.2%) | 105 (44.3%) |
| 55 to 64 Years | 99 (37.6%) | 153 (58.2%) |
| 65 to 74 Years | 149 (90.3%) | 117 (70.9%) |
| 75 Years and over | 162 (100.0%) | 42 (25.9%) |
| Total | 934 (57.5%) | 773 (47.6%) |
Disability Status by Sex by Age in Thompson Falls
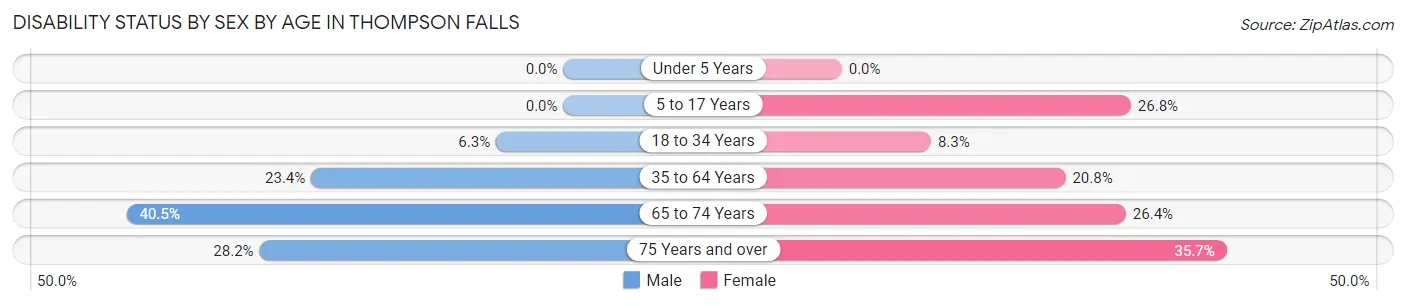
| Age Bracket | Male | Female |
| Under 5 Years | 0 (0.0%) | 0 (0.0%) |
| 5 to 17 Years | 0 (0.0%) | 22 (26.8%) |
| 18 to 34 Years | 7 (6.2%) | 13 (8.3%) |
| 35 to 64 Years | 92 (23.4%) | 49 (20.8%) |
| 65 to 74 Years | 30 (40.5%) | 24 (26.4%) |
| 75 Years and over | 22 (28.2%) | 30 (35.7%) |
Disability Class by Sex by Age in Thompson Falls
Disability Class: Hearing Difficulty
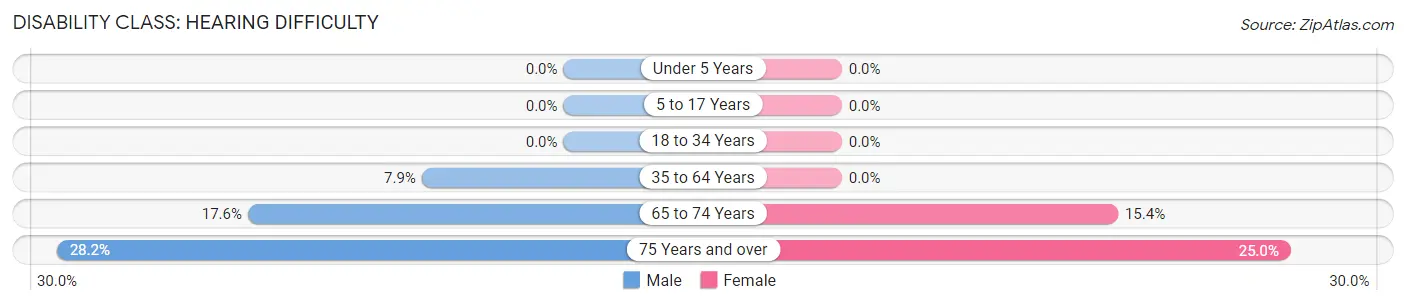
| Age Bracket | Male | Female |
| Under 5 Years | 0 (0.0%) | 0 (0.0%) |
| 5 to 17 Years | 0 (0.0%) | 0 (0.0%) |
| 18 to 34 Years | 0 (0.0%) | 0 (0.0%) |
| 35 to 64 Years | 31 (7.9%) | 0 (0.0%) |
| 65 to 74 Years | 13 (17.6%) | 14 (15.4%) |
| 75 Years and over | 22 (28.2%) | 21 (25.0%) |
Disability Class: Vision Difficulty
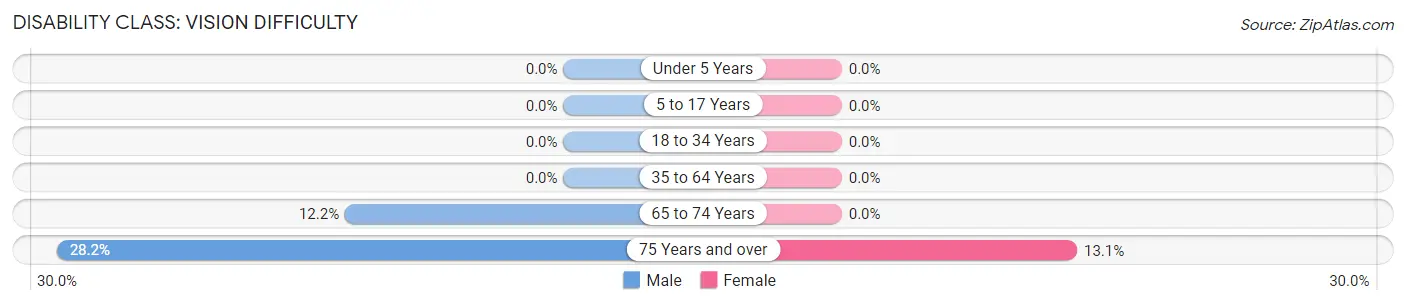
| Age Bracket | Male | Female |
| Under 5 Years | 0 (0.0%) | 0 (0.0%) |
| 5 to 17 Years | 0 (0.0%) | 0 (0.0%) |
| 18 to 34 Years | 0 (0.0%) | 0 (0.0%) |
| 35 to 64 Years | 0 (0.0%) | 0 (0.0%) |
| 65 to 74 Years | 9 (12.2%) | 0 (0.0%) |
| 75 Years and over | 22 (28.2%) | 11 (13.1%) |
Disability Class: Cognitive Difficulty
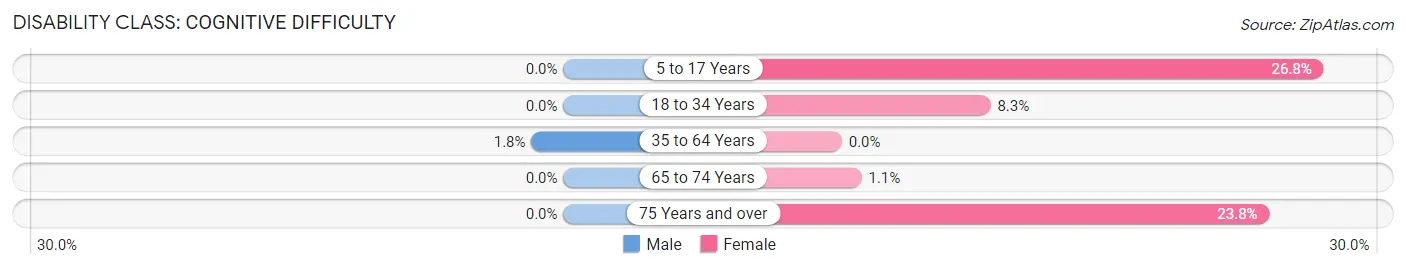
| Age Bracket | Male | Female |
| 5 to 17 Years | 0 (0.0%) | 22 (26.8%) |
| 18 to 34 Years | 0 (0.0%) | 13 (8.3%) |
| 35 to 64 Years | 7 (1.8%) | 0 (0.0%) |
| 65 to 74 Years | 0 (0.0%) | 1 (1.1%) |
| 75 Years and over | 0 (0.0%) | 20 (23.8%) |
Disability Class: Ambulatory Difficulty
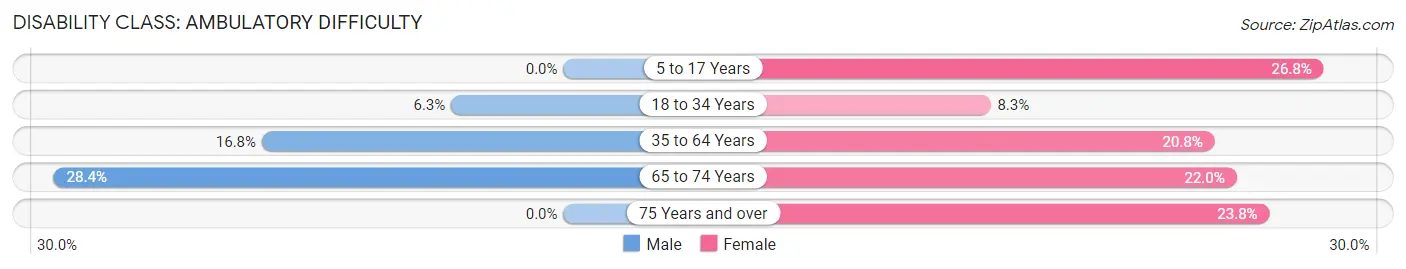
| Age Bracket | Male | Female |
| 5 to 17 Years | 0 (0.0%) | 22 (26.8%) |
| 18 to 34 Years | 7 (6.2%) | 13 (8.3%) |
| 35 to 64 Years | 66 (16.8%) | 49 (20.8%) |
| 65 to 74 Years | 21 (28.4%) | 20 (22.0%) |
| 75 Years and over | 0 (0.0%) | 20 (23.8%) |
Disability Class: Self-Care Difficulty
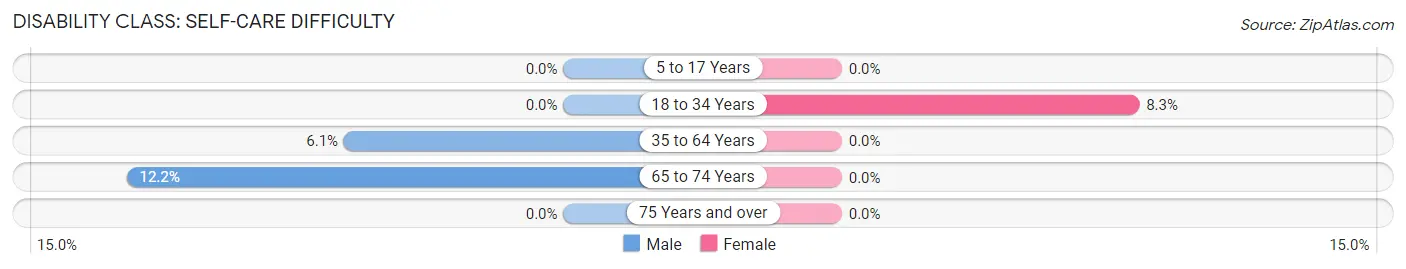
| Age Bracket | Male | Female |
| 5 to 17 Years | 0 (0.0%) | 0 (0.0%) |
| 18 to 34 Years | 0 (0.0%) | 13 (8.3%) |
| 35 to 64 Years | 24 (6.1%) | 0 (0.0%) |
| 65 to 74 Years | 9 (12.2%) | 0 (0.0%) |
| 75 Years and over | 0 (0.0%) | 0 (0.0%) |
Technology Access in Thompson Falls
Computing Device Access in Thompson Falls
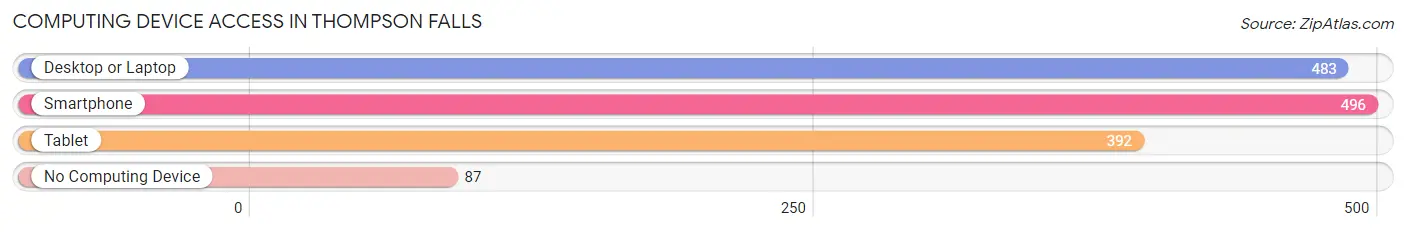
| Device Type | # Households | % Households |
| Desktop or Laptop | 483 | 67.9% |
| Smartphone | 496 | 69.8% |
| Tablet | 392 | 55.1% |
| No Computing Device | 87 | 12.2% |
| Total | 711 | 100.0% |
Internet Access in Thompson Falls
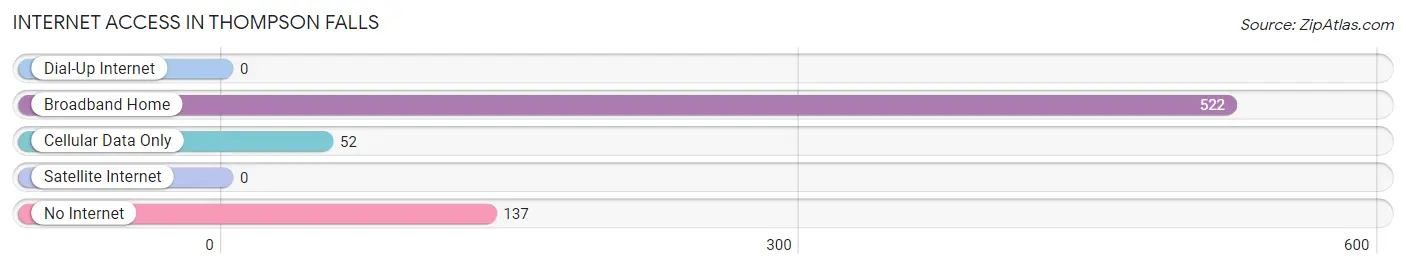
| Internet Type | # Households | % Households |
| Dial-Up Internet | 0 | 0.0% |
| Broadband Home | 522 | 73.4% |
| Cellular Data Only | 52 | 7.3% |
| Satellite Internet | 0 | 0.0% |
| No Internet | 137 | 19.3% |
| Total | 711 | 100.0% |
Thompson Falls Summary
History
Thompson Falls is a small town located in Sanders County, Montana. It was founded in 1881 by William Thompson, a prospector who discovered gold in the area. The town was originally called Thompson's Falls, but the name was later shortened to Thompson Falls. The town was incorporated in 1887 and has since grown to a population of 1,717 as of the 2010 census.
The town was originally a logging and mining town, with the main industry being timber. The town was also home to a sawmill, which was built in 1883. The sawmill was the largest in the area and provided employment for many of the town's residents.
The town was also home to a number of other businesses, including a hotel, a general store, a bank, and a post office. The town also had a school, which was built in 1891.
The town was also home to a number of churches, including the Methodist Episcopal Church, the Presbyterian Church, and the Catholic Church.
Geography
Thompson Falls is located in the northwest corner of Montana, near the Idaho border. The town is situated on the Clark Fork River, which is a tributary of the Columbia River. The town is surrounded by the Cabinet Mountains and the Kootenai National Forest.
The town has a total area of 1.3 square miles, all of which is land. The elevation of the town is 2,717 feet above sea level.
Economy
The economy of Thompson Falls is largely based on tourism and timber. The town is home to a number of tourist attractions, including the Thompson Falls Dam, the Thompson Falls State Park, and the Thompson Falls Fish Hatchery.
The town is also home to a number of timber-related businesses, including sawmills, logging companies, and wood-processing plants. The town is also home to a number of other businesses, including restaurants, retail stores, and service providers.
Demographics
As of the 2010 census, the population of Thompson Falls was 1,717. The racial makeup of the town was 95.2% White, 0.3% African American, 0.7% Native American, 0.3% Asian, 0.1% Pacific Islander, 1.2% from other races, and 2.3% from two or more races. Hispanic or Latino of any race were 3.2% of the population.
The median income for a household in the town was $31,250, and the median income for a family was $37,500. The per capita income for the town was $17,845. About 14.2% of families and 17.2% of the population were below the poverty line, including 22.2% of those under age 18 and 8.3% of those age 65 or over.
Common Questions
What is Per Capita Income in Thompson Falls?
Per Capita income in Thompson Falls is $24,278.
What is the Median Family Income in Thompson Falls?
Median Family Income in Thompson Falls is $65,833.
What is the Median Household income in Thompson Falls?
Median Household Income in Thompson Falls is $43,125.
What is Income or Wage Gap in Thompson Falls?
Income or Wage Gap in Thompson Falls is 34.3%.
Women in Thompson Falls earn 65.7 cents for every dollar earned by a man.
What is Inequality or Gini Index in Thompson Falls?
Inequality or Gini Index in Thompson Falls is 0.33.
What is the Total Population of Thompson Falls?
Total Population of Thompson Falls is 1,658.
What is the Total Male Population of Thompson Falls?
Total Male Population of Thompson Falls is 940.
What is the Total Female Population of Thompson Falls?
Total Female Population of Thompson Falls is 718.
What is the Ratio of Males per 100 Females in Thompson Falls?
There are 130.92 Males per 100 Females in Thompson Falls.
What is the Ratio of Females per 100 Males in Thompson Falls?
There are 76.38 Females per 100 Males in Thompson Falls.
What is the Median Population Age in Thompson Falls?
Median Population Age in Thompson Falls is 46.6 Years.
What is the Average Family Size in Thompson Falls
Average Family Size in Thompson Falls is 3.2 People.
What is the Average Household Size in Thompson Falls
Average Household Size in Thompson Falls is 2.3 People.
How Large is the Labor Force in Thompson Falls?
There are 703 People in the Labor Forcein in Thompson Falls.
What is the Percentage of People in the Labor Force in Thompson Falls?
55.8% of People are in the Labor Force in Thompson Falls.
What is the Unemployment Rate in Thompson Falls?
Unemployment Rate in Thompson Falls is 0.6%.