Lewistown, MT Map & Demographics
Lewistown Map
Lewistown Overview
$27,557
PER CAPITA INCOME
$64,801
AVG FAMILY INCOME
$40,705
AVG HOUSEHOLD INCOME
30.2%
WAGE / INCOME GAP [ % ]
69.8¢/ $1
WAGE / INCOME GAP [ $ ]
$20,838
FAMILY INCOME DEFICIT
0.42
INEQUALITY / GINI INDEX
5,988
TOTAL POPULATION
3,164
MALE POPULATION
2,824
FEMALE POPULATION
112.04
MALES / 100 FEMALES
89.25
FEMALES / 100 MALES
48.0
MEDIAN AGE
2.9
AVG FAMILY SIZE
2.0
AVG HOUSEHOLD SIZE
2,754
LABOR FORCE [ PEOPLE ]
56.5%
PERCENT IN LABOR FORCE
5.7%
UNEMPLOYMENT RATE
Lewistown Zip Codes
Lewistown Area Codes
Income in Lewistown
Income Overview in Lewistown
Per Capita Income in Lewistown is $27,557, while median incomes of families and households are $64,801 and $40,705 respectively.
| Characteristic | Number | Measure |
| Per Capita Income | 5,988 | $27,557 |
| Median Family Income | 1,323 | $64,801 |
| Mean Family Income | 1,323 | $75,107 |
| Median Household Income | 2,807 | $40,705 |
| Mean Household Income | 2,807 | $56,041 |
| Income Deficit | 1,323 | $20,838 |
| Wage / Income Gap (%) | 5,988 | 30.20% |
| Wage / Income Gap ($) | 5,988 | 69.80¢ per $1 |
| Gini / Inequality Index | 5,988 | 0.42 |
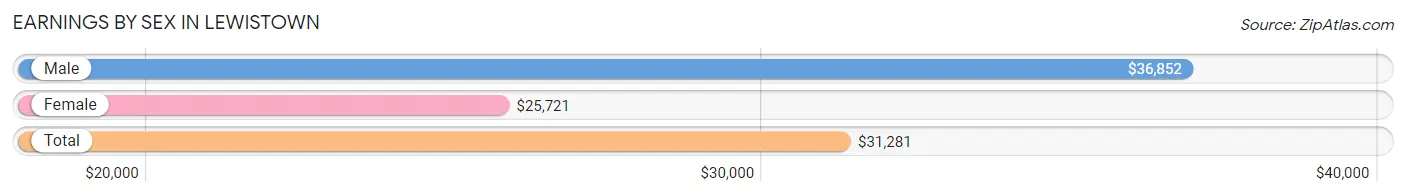
Earnings by Sex in Lewistown
Average Earnings in Lewistown are $31,281, $36,852 for men and $25,721 for women, a difference of 30.2%.
| Sex | Number | Average Earnings |
| Male | 1,725 (55.5%) | $36,852 |
| Female | 1,382 (44.5%) | $25,721 |
| Total | 3,107 (100.0%) | $31,281 |
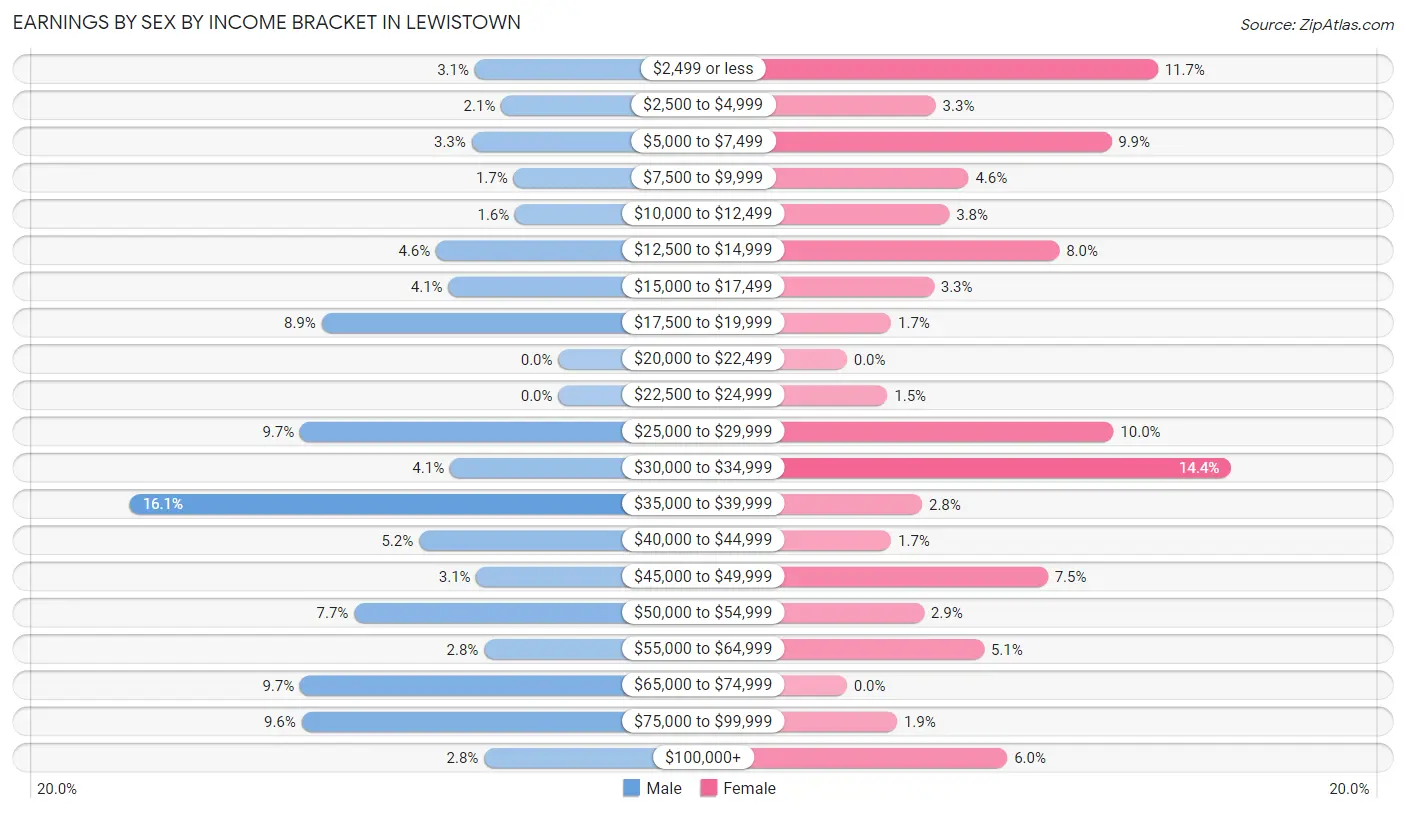
Earnings by Sex by Income Bracket in Lewistown
The most common earnings brackets in Lewistown are $35,000 to $39,999 for men (277 | 16.1%) and $30,000 to $34,999 for women (199 | 14.4%).
| Income | Male | Female |
| $2,499 or less | 54 (3.1%) | 161 (11.7%) |
| $2,500 to $4,999 | 37 (2.1%) | 46 (3.3%) |
| $5,000 to $7,499 | 56 (3.3%) | 137 (9.9%) |
| $7,500 to $9,999 | 29 (1.7%) | 63 (4.6%) |
| $10,000 to $12,499 | 28 (1.6%) | 53 (3.8%) |
| $12,500 to $14,999 | 79 (4.6%) | 110 (8.0%) |
| $15,000 to $17,499 | 71 (4.1%) | 45 (3.3%) |
| $17,500 to $19,999 | 153 (8.9%) | 23 (1.7%) |
| $20,000 to $22,499 | 0 (0.0%) | 0 (0.0%) |
| $22,500 to $24,999 | 0 (0.0%) | 21 (1.5%) |
| $25,000 to $29,999 | 167 (9.7%) | 138 (10.0%) |
| $30,000 to $34,999 | 70 (4.1%) | 199 (14.4%) |
| $35,000 to $39,999 | 277 (16.1%) | 39 (2.8%) |
| $40,000 to $44,999 | 90 (5.2%) | 23 (1.7%) |
| $45,000 to $49,999 | 53 (3.1%) | 104 (7.5%) |
| $50,000 to $54,999 | 132 (7.6%) | 40 (2.9%) |
| $55,000 to $64,999 | 48 (2.8%) | 71 (5.1%) |
| $65,000 to $74,999 | 167 (9.7%) | 0 (0.0%) |
| $75,000 to $99,999 | 166 (9.6%) | 26 (1.9%) |
| $100,000+ | 48 (2.8%) | 83 (6.0%) |
| Total | 1,725 (100.0%) | 1,382 (100.0%) |
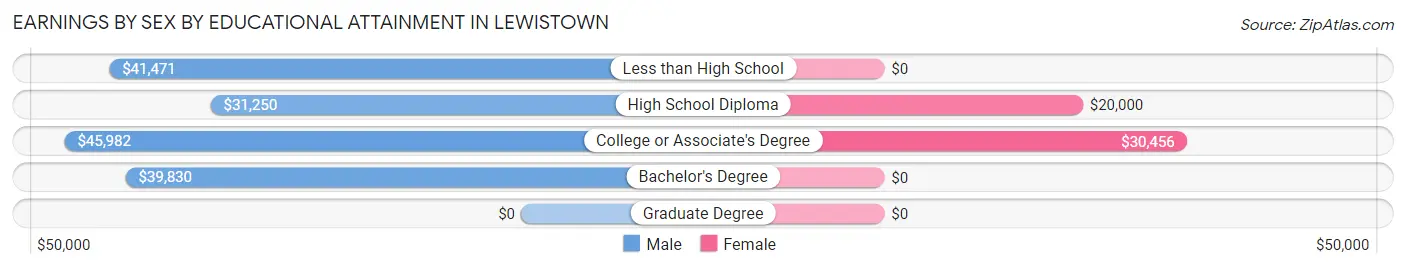
Earnings by Sex by Educational Attainment in Lewistown
Average earnings in Lewistown are $37,801 for men and $26,948 for women, a difference of 28.7%. Men with an educational attainment of college or associate's degree enjoy the highest average annual earnings of $45,982, while those with high school diploma education earn the least with $31,250. Women with an educational attainment of college or associate's degree earn the most with the average annual earnings of $30,456, while those with high school diploma education have the smallest earnings of $20,000.
| Educational Attainment | Male Income | Female Income |
| Less than High School | $41,471 | $0 |
| High School Diploma | $31,250 | $20,000 |
| College or Associate's Degree | $45,982 | $30,456 |
| Bachelor's Degree | $39,830 | $0 |
| Graduate Degree | - | - |
| Total | $37,801 | $26,948 |
Family Income in Lewistown
Family Income Brackets in Lewistown
According to the Lewistown family income data, there are 343 families falling into the $50,000 to $74,999 income range, which is the most common income bracket and makes up 25.9% of all families.
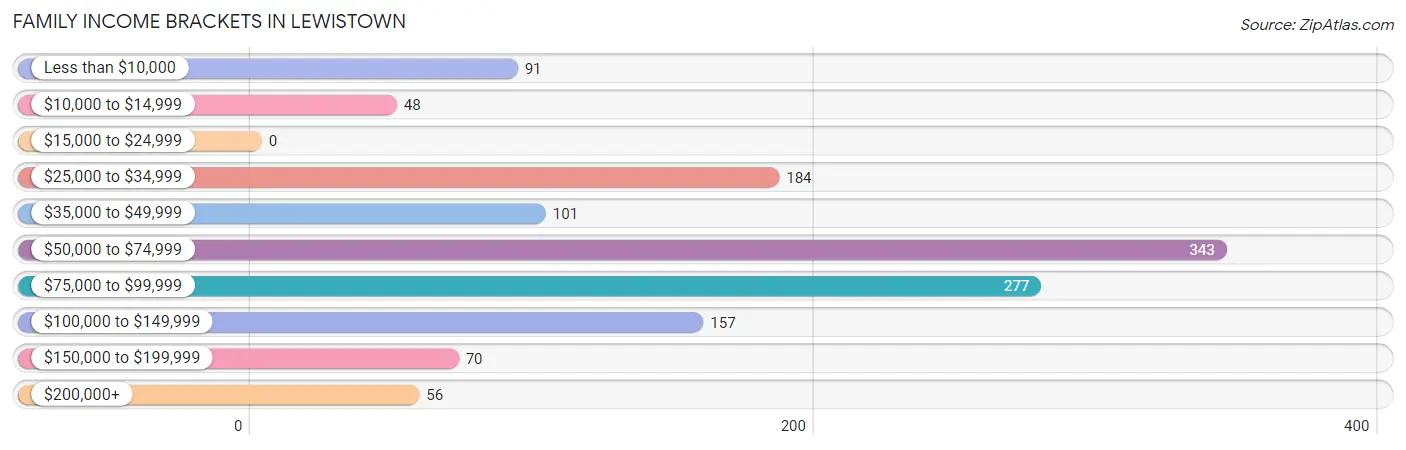
| Income Bracket | # Families | % Families |
| Less than $10,000 | 91 | 6.9% |
| $10,000 to $14,999 | 48 | 3.6% |
| $15,000 to $24,999 | 0 | 0.0% |
| $25,000 to $34,999 | 184 | 13.9% |
| $35,000 to $49,999 | 101 | 7.6% |
| $50,000 to $74,999 | 343 | 25.9% |
| $75,000 to $99,999 | 277 | 20.9% |
| $100,000 to $149,999 | 157 | 11.9% |
| $150,000 to $199,999 | 70 | 5.3% |
| $200,000+ | 56 | 4.2% |
Family Income by Famaliy Size in Lewistown
3-person families (163 | 12.3%) account for the highest median family income in Lewistown with $79,063 per family, while 2-person families (809 | 61.2%) have the highest median income of $27,974 per family member.
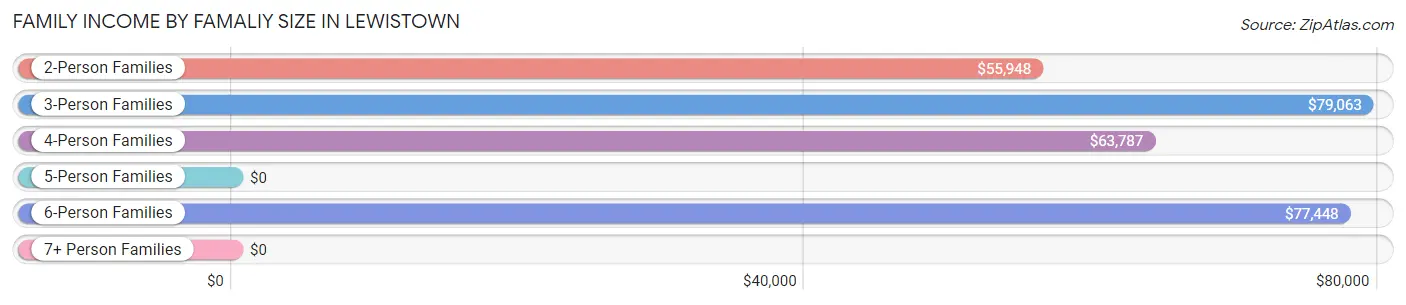
| Income Bracket | # Families | Median Income |
| 2-Person Families | 809 (61.2%) | $55,948 |
| 3-Person Families | 163 (12.3%) | $79,063 |
| 4-Person Families | 177 (13.4%) | $63,787 |
| 5-Person Families | 20 (1.5%) | $0 |
| 6-Person Families | 141 (10.7%) | $77,448 |
| 7+ Person Families | 13 (1.0%) | $0 |
| Total | 1,323 (100.0%) | $64,801 |
Family Income by Number of Earners in Lewistown
The median family income in Lewistown is $64,801, with families comprising 3+ earners (47) having the highest median family income of $106,438, while families with 1 earner (402) have the lowest median family income of $35,682, accounting for 3.5% and 30.4% of families, respectively.
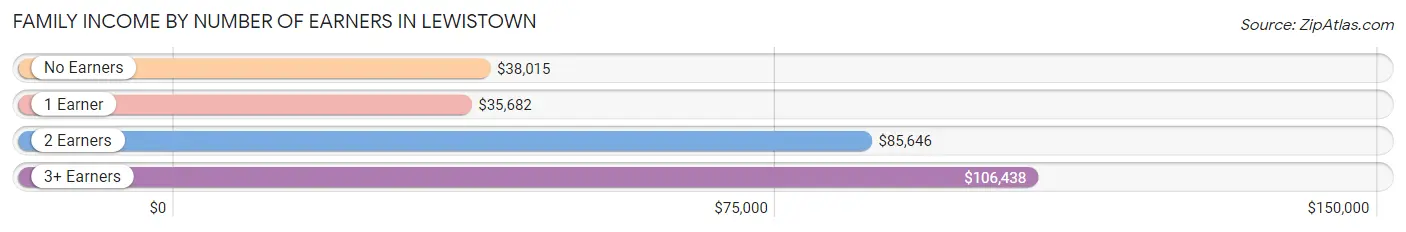
| Number of Earners | # Families | Median Income |
| No Earners | 293 (22.2%) | $38,015 |
| 1 Earner | 402 (30.4%) | $35,682 |
| 2 Earners | 581 (43.9%) | $85,646 |
| 3+ Earners | 47 (3.5%) | $106,438 |
| Total | 1,323 (100.0%) | $64,801 |
Household Income in Lewistown
Household Income Brackets in Lewistown
With 542 households falling in the category, the $35,000 to $49,999 income range is the most frequent in Lewistown, accounting for 19.3% of all households. In contrast, only 56 households (2.0%) fall into the $200,000+ income bracket, making it the least populous group.
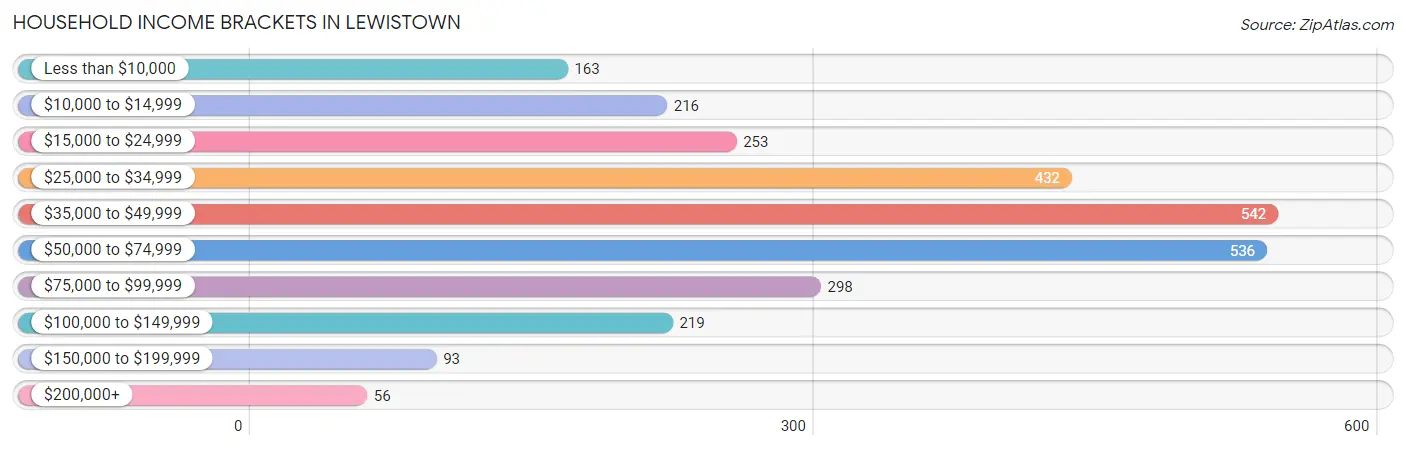
| Income Bracket | # Households | % Households |
| Less than $10,000 | 163 | 5.8% |
| $10,000 to $14,999 | 216 | 7.7% |
| $15,000 to $24,999 | 253 | 9.0% |
| $25,000 to $34,999 | 432 | 15.4% |
| $35,000 to $49,999 | 542 | 19.3% |
| $50,000 to $74,999 | 536 | 19.1% |
| $75,000 to $99,999 | 298 | 10.6% |
| $100,000 to $149,999 | 219 | 7.8% |
| $150,000 to $199,999 | 93 | 3.3% |
| $200,000+ | 56 | 2.0% |
Household Income by Householder Age in Lewistown
The median household income in Lewistown is $40,705, with the highest median household income of $64,958 found in the 25 to 44 years age bracket for the primary householder. A total of 741 households (26.4%) fall into this category. Meanwhile, the 15 to 24 years age bracket for the primary householder has the lowest median household income of $30,708, with 85 households (3.0%) in this group.
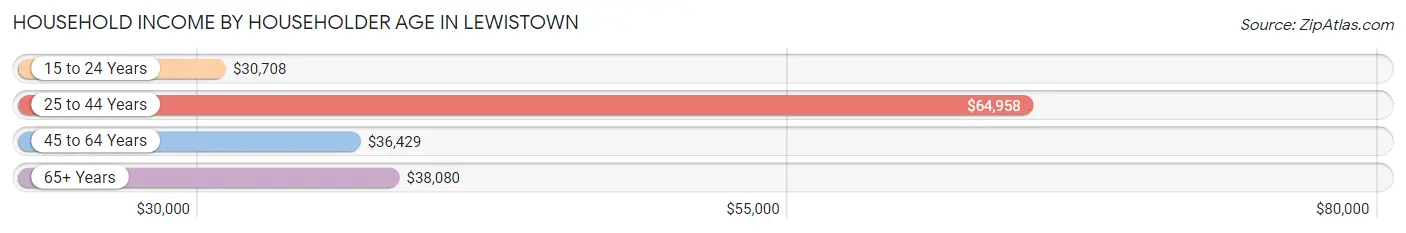
| Income Bracket | # Households | Median Income |
| 15 to 24 Years | 85 (3.0%) | $30,708 |
| 25 to 44 Years | 741 (26.4%) | $64,958 |
| 45 to 64 Years | 1,008 (35.9%) | $36,429 |
| 65+ Years | 973 (34.7%) | $38,080 |
| Total | 2,807 (100.0%) | $40,705 |
Poverty in Lewistown
Income Below Poverty by Sex and Age in Lewistown
With 16.0% poverty level for males and 22.6% for females among the residents of Lewistown, 15 year old males and 18 to 24 year old females are the most vulnerable to poverty, with 26 males (52.0%) and 124 females (69.3%) in their respective age groups living below the poverty level.
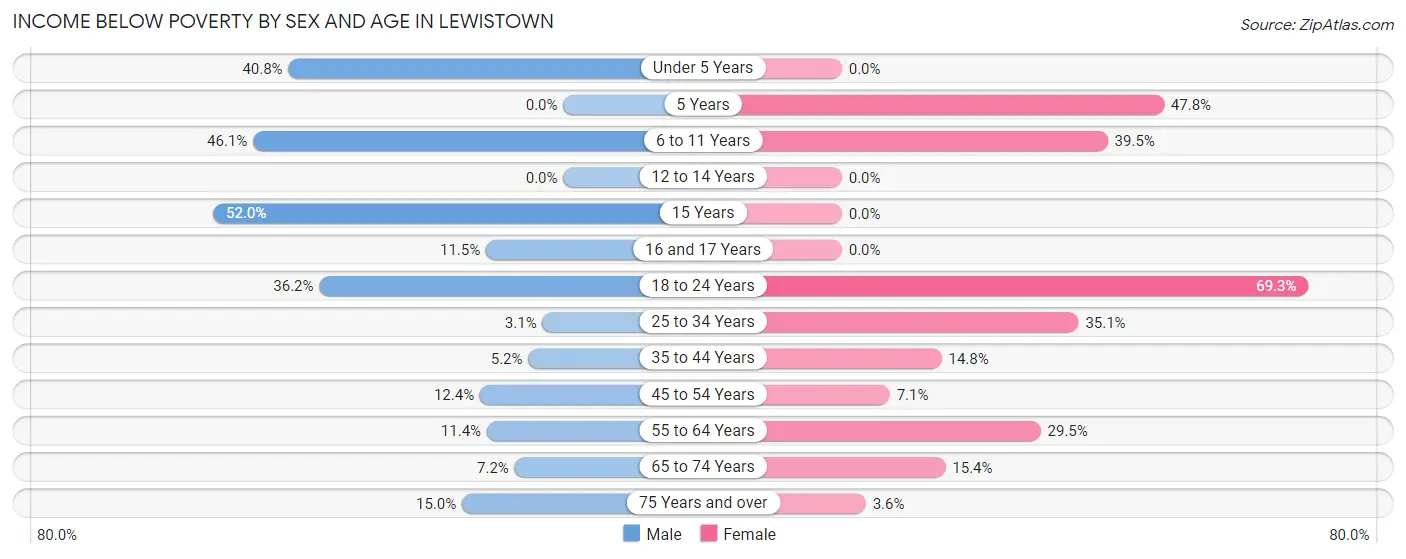
| Age Bracket | Male | Female |
| Under 5 Years | 60 (40.8%) | 0 (0.0%) |
| 5 Years | 0 (0.0%) | 22 (47.8%) |
| 6 to 11 Years | 152 (46.1%) | 92 (39.5%) |
| 12 to 14 Years | 0 (0.0%) | 0 (0.0%) |
| 15 Years | 26 (52.0%) | 0 (0.0%) |
| 16 and 17 Years | 14 (11.5%) | 0 (0.0%) |
| 18 to 24 Years | 25 (36.2%) | 124 (69.3%) |
| 25 to 34 Years | 13 (3.1%) | 104 (35.1%) |
| 35 to 44 Years | 13 (5.2%) | 48 (14.8%) |
| 45 to 54 Years | 52 (12.4%) | 19 (7.1%) |
| 55 to 64 Years | 48 (11.4%) | 124 (29.5%) |
| 65 to 74 Years | 25 (7.2%) | 64 (15.4%) |
| 75 Years and over | 51 (15.0%) | 12 (3.5%) |
| Total | 479 (16.0%) | 609 (22.6%) |
Income Above Poverty by Sex and Age in Lewistown
According to the poverty statistics in Lewistown, males aged 5 years and females aged under 5 years are the age groups that are most secure financially, with 100.0% of males and 100.0% of females in these age groups living above the poverty line.
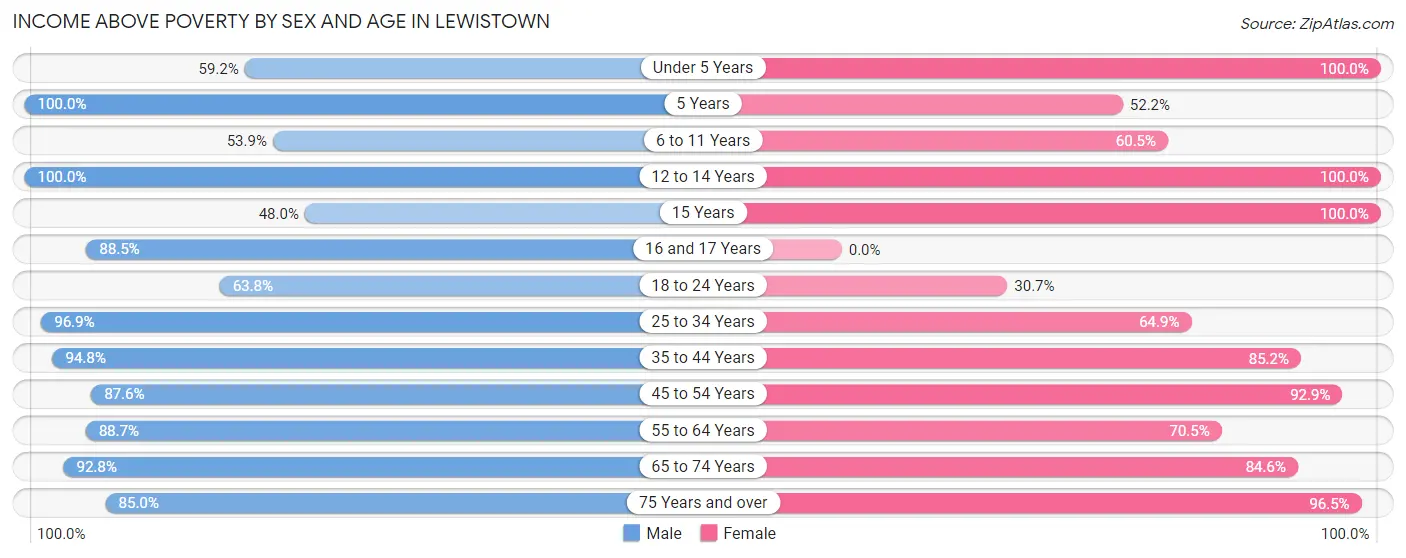
| Age Bracket | Male | Female |
| Under 5 Years | 87 (59.2%) | 73 (100.0%) |
| 5 Years | 9 (100.0%) | 24 (52.2%) |
| 6 to 11 Years | 178 (53.9%) | 141 (60.5%) |
| 12 to 14 Years | 76 (100.0%) | 73 (100.0%) |
| 15 Years | 24 (48.0%) | 28 (100.0%) |
| 16 and 17 Years | 108 (88.5%) | 0 (0.0%) |
| 18 to 24 Years | 44 (63.8%) | 55 (30.7%) |
| 25 to 34 Years | 406 (96.9%) | 192 (64.9%) |
| 35 to 44 Years | 237 (94.8%) | 276 (85.2%) |
| 45 to 54 Years | 368 (87.6%) | 248 (92.9%) |
| 55 to 64 Years | 375 (88.6%) | 296 (70.5%) |
| 65 to 74 Years | 321 (92.8%) | 352 (84.6%) |
| 75 Years and over | 288 (85.0%) | 326 (96.5%) |
| Total | 2,521 (84.0%) | 2,084 (77.4%) |
Income Below Poverty Among Married-Couple Families in Lewistown
The poverty statistics for married-couple families in Lewistown show that 4.2% or 42 of the total 1,013 families live below the poverty line. Families with 1 or 2 children have the highest poverty rate of 4.5%, comprising of 9 families. On the other hand, families with 3 or 4 children have the lowest poverty rate of 0.0%, which includes 0 families.
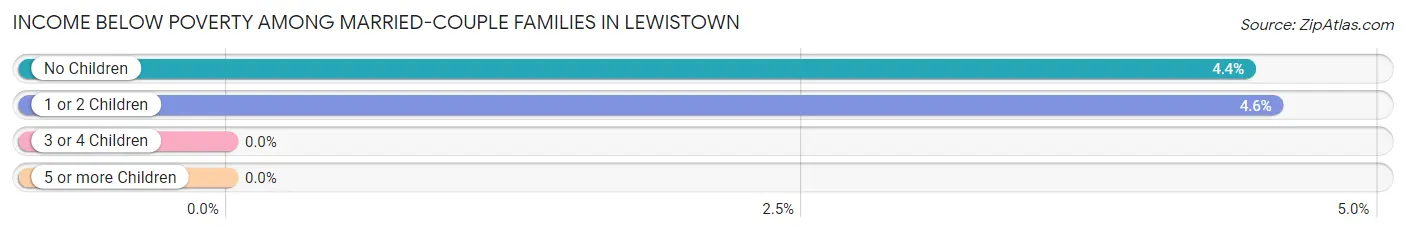
| Children | Above Poverty | Below Poverty |
| No Children | 712 (95.6%) | 33 (4.4%) |
| 1 or 2 Children | 189 (95.5%) | 9 (4.5%) |
| 3 or 4 Children | 70 (100.0%) | 0 (0.0%) |
| 5 or more Children | 0 (0.0%) | 0 (0.0%) |
| Total | 971 (95.9%) | 42 (4.2%) |
Income Below Poverty Among Single-Parent Households in Lewistown
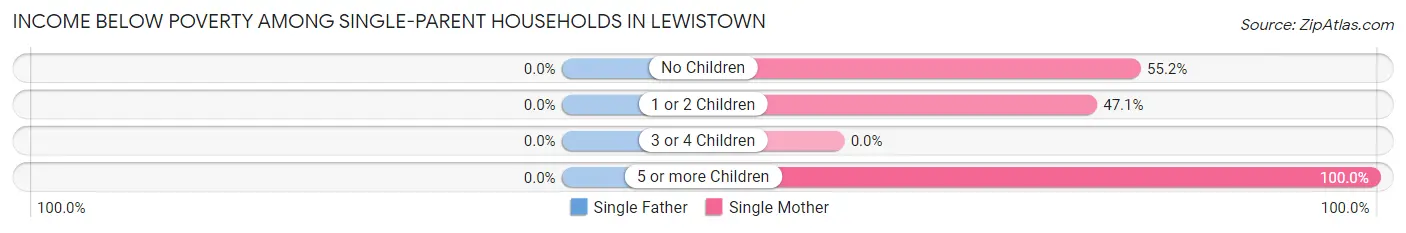
| Children | Single Father | Single Mother |
| No Children | 0 (0.0%) | 37 (55.2%) |
| 1 or 2 Children | 0 (0.0%) | 8 (47.1%) |
| 3 or 4 Children | 0 (0.0%) | 0 (0.0%) |
| 5 or more Children | 0 (0.0%) | 60 (100.0%) |
| Total | 0 (0.0%) | 105 (65.6%) |
Income Below Poverty Among Married-Couple vs Single-Parent Households in Lewistown
The poverty data for Lewistown shows that 42 of the married-couple family households (4.2%) and 105 of the single-parent households (33.9%) are living below the poverty level. Within the married-couple family households, those with 1 or 2 children have the highest poverty rate, with 9 households (4.5%) falling below the poverty line. Among the single-parent households, those with 5 or more children have the highest poverty rate, with 60 household (100.0%) living below poverty.
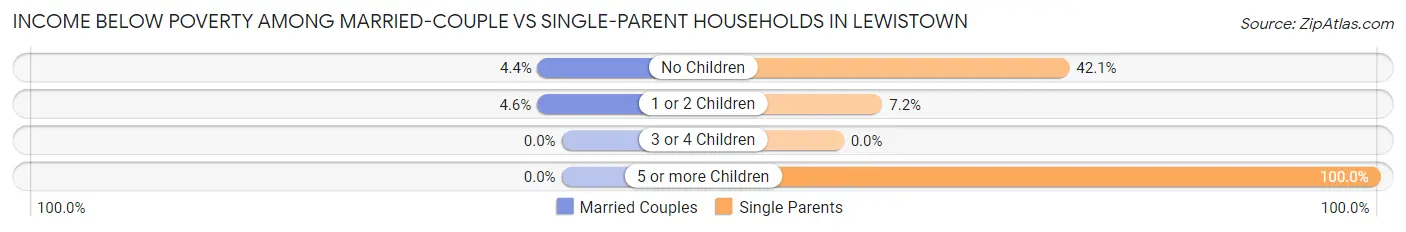
| Children | Married-Couple Families | Single-Parent Households |
| No Children | 33 (4.4%) | 37 (42.0%) |
| 1 or 2 Children | 9 (4.5%) | 8 (7.2%) |
| 3 or 4 Children | 0 (0.0%) | 0 (0.0%) |
| 5 or more Children | 0 (0.0%) | 60 (100.0%) |
| Total | 42 (4.2%) | 105 (33.9%) |
Race in Lewistown
The most populous races in Lewistown are White / Caucasian (5,516 | 92.1%), Hispanic or Latino (141 | 2.4%), and Some other Race (138 | 2.3%).
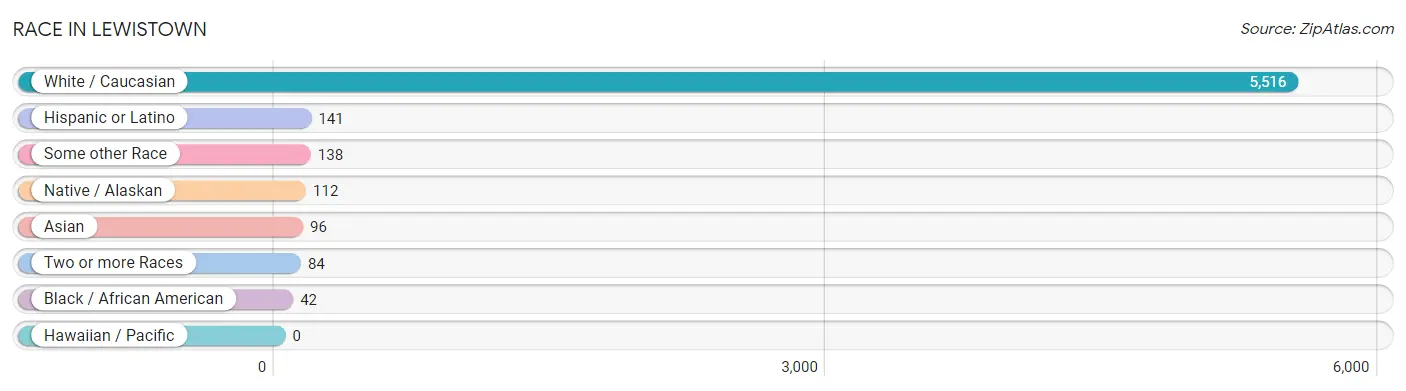
| Race | # Population | % Population |
| Asian | 96 | 1.6% |
| Black / African American | 42 | 0.7% |
| Hawaiian / Pacific | 0 | 0.0% |
| Hispanic or Latino | 141 | 2.4% |
| Native / Alaskan | 112 | 1.9% |
| White / Caucasian | 5,516 | 92.1% |
| Two or more Races | 84 | 1.4% |
| Some other Race | 138 | 2.3% |
| Total | 5,988 | 100.0% |
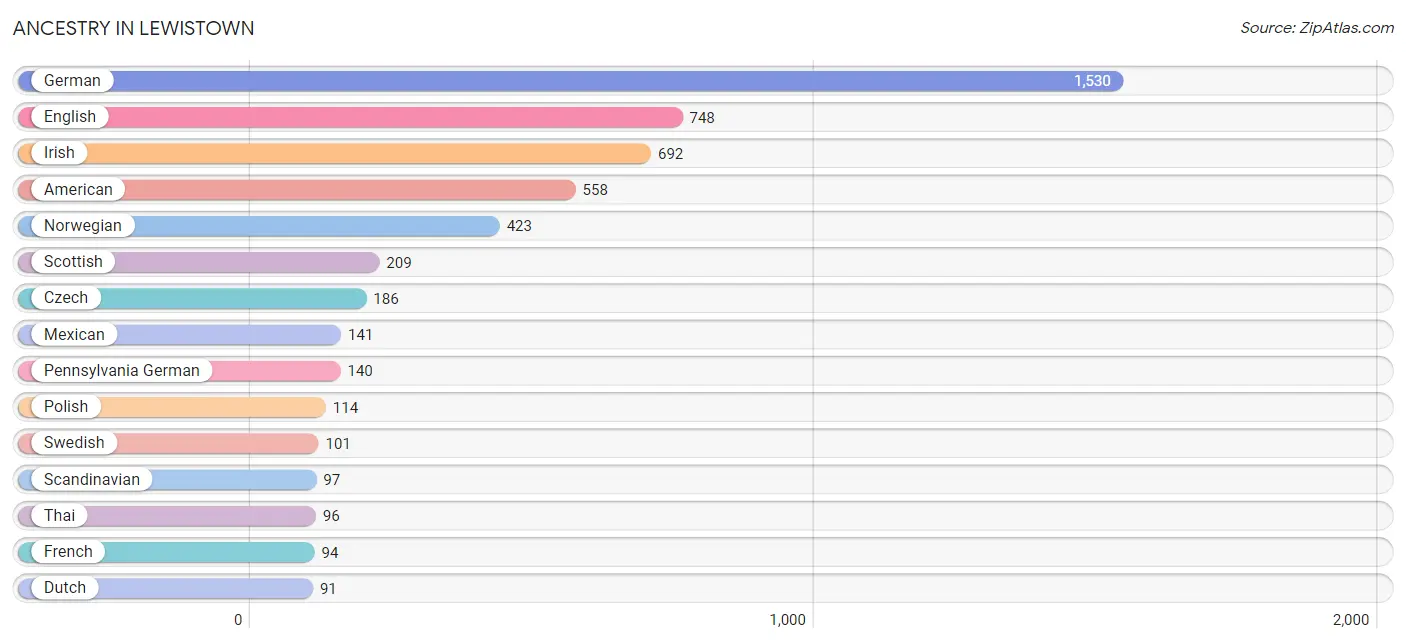
Ancestry in Lewistown
The most populous ancestries reported in Lewistown are German (1,530 | 25.6%), English (748 | 12.5%), Irish (692 | 11.6%), American (558 | 9.3%), and Norwegian (423 | 7.1%), together accounting for 66.0% of all Lewistown residents.
| Ancestry | # Population | % Population |
| American | 558 | 9.3% |
| Arapaho | 28 | 0.5% |
| Austrian | 23 | 0.4% |
| Basque | 3 | 0.1% |
| Belgian | 5 | 0.1% |
| Blackfeet | 3 | 0.1% |
| British | 83 | 1.4% |
| Cheyenne | 2 | 0.0% |
| Choctaw | 8 | 0.1% |
| Cree | 2 | 0.0% |
| Croatian | 18 | 0.3% |
| Crow | 8 | 0.1% |
| Czech | 186 | 3.1% |
| Czechoslovakian | 28 | 0.5% |
| Danish | 42 | 0.7% |
| Dutch | 91 | 1.5% |
| Eastern European | 7 | 0.1% |
| English | 748 | 12.5% |
| European | 53 | 0.9% |
| French | 94 | 1.6% |
| French Canadian | 62 | 1.0% |
| German | 1,530 | 25.6% |
| Hungarian | 25 | 0.4% |
| Irish | 692 | 11.6% |
| Italian | 76 | 1.3% |
| Lithuanian | 3 | 0.1% |
| Mexican | 141 | 2.4% |
| Norwegian | 423 | 7.1% |
| Pennsylvania German | 140 | 2.3% |
| Polish | 114 | 1.9% |
| Portuguese | 1 | 0.0% |
| Russian | 3 | 0.1% |
| Scandinavian | 97 | 1.6% |
| Scotch-Irish | 65 | 1.1% |
| Scottish | 209 | 3.5% |
| Sioux | 12 | 0.2% |
| Slavic | 4 | 0.1% |
| Swedish | 101 | 1.7% |
| Swiss | 19 | 0.3% |
| Thai | 96 | 1.6% |
| Tohono O'Odham | 3 | 0.1% |
| Welsh | 37 | 0.6% | View All 42 Rows |
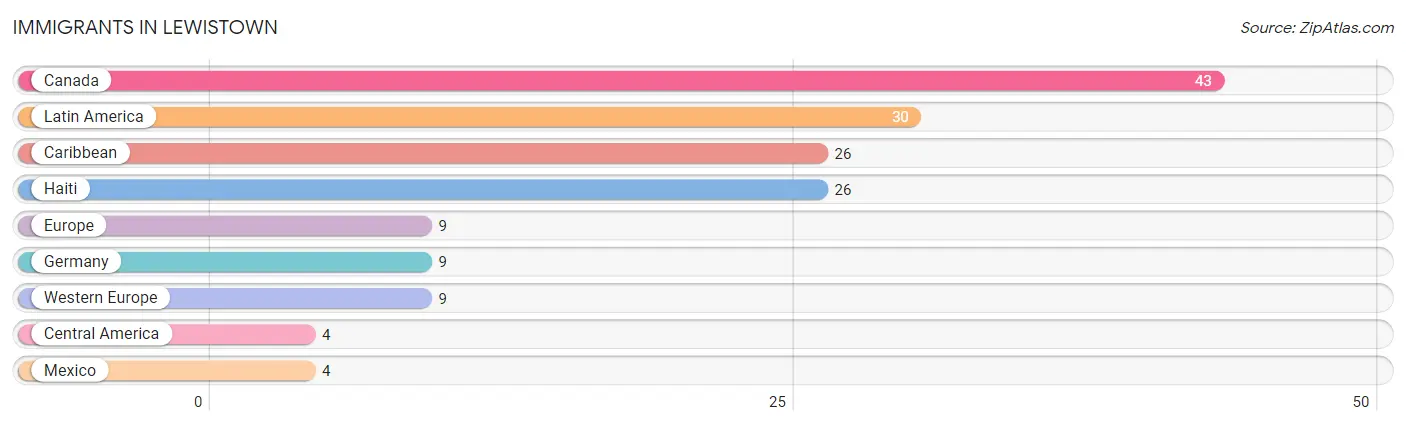
Immigrants in Lewistown
The most numerous immigrant groups reported in Lewistown came from Canada (43 | 0.7%), Latin America (30 | 0.5%), Caribbean (26 | 0.4%), Haiti (26 | 0.4%), and Europe (9 | 0.2%), together accounting for 2.2% of all Lewistown residents.
| Immigration Origin | # Population | % Population |
| Canada | 43 | 0.7% |
| Caribbean | 26 | 0.4% |
| Central America | 4 | 0.1% |
| Europe | 9 | 0.2% |
| Germany | 9 | 0.2% |
| Haiti | 26 | 0.4% |
| Latin America | 30 | 0.5% |
| Mexico | 4 | 0.1% |
| Western Europe | 9 | 0.2% | View All 9 Rows |
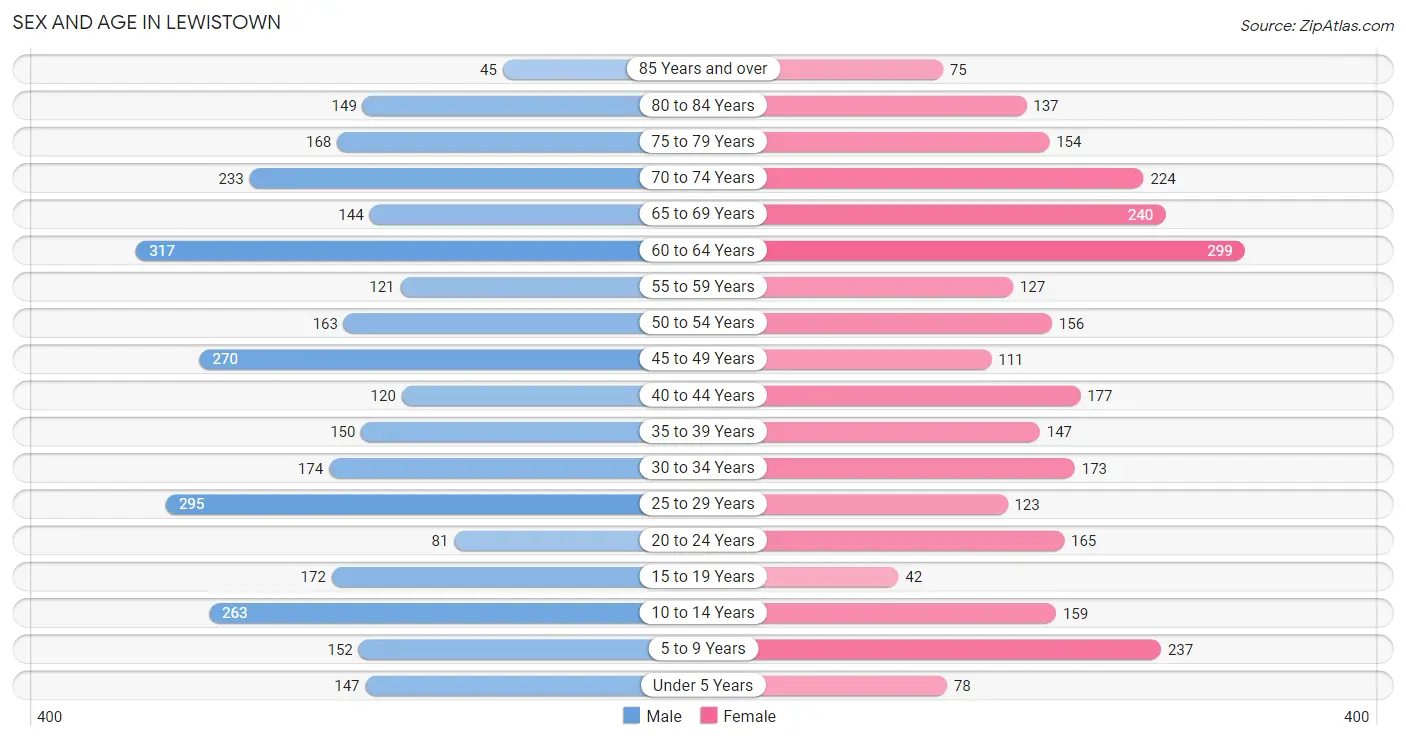
Sex and Age in Lewistown
Sex and Age in Lewistown
The most populous age groups in Lewistown are 60 to 64 Years (317 | 10.0%) for men and 60 to 64 Years (299 | 10.6%) for women.
| Age Bracket | Male | Female |
| Under 5 Years | 147 (4.6%) | 78 (2.8%) |
| 5 to 9 Years | 152 (4.8%) | 237 (8.4%) |
| 10 to 14 Years | 263 (8.3%) | 159 (5.6%) |
| 15 to 19 Years | 172 (5.4%) | 42 (1.5%) |
| 20 to 24 Years | 81 (2.6%) | 165 (5.8%) |
| 25 to 29 Years | 295 (9.3%) | 123 (4.4%) |
| 30 to 34 Years | 174 (5.5%) | 173 (6.1%) |
| 35 to 39 Years | 150 (4.7%) | 147 (5.2%) |
| 40 to 44 Years | 120 (3.8%) | 177 (6.3%) |
| 45 to 49 Years | 270 (8.5%) | 111 (3.9%) |
| 50 to 54 Years | 163 (5.1%) | 156 (5.5%) |
| 55 to 59 Years | 121 (3.8%) | 127 (4.5%) |
| 60 to 64 Years | 317 (10.0%) | 299 (10.6%) |
| 65 to 69 Years | 144 (4.5%) | 240 (8.5%) |
| 70 to 74 Years | 233 (7.4%) | 224 (7.9%) |
| 75 to 79 Years | 168 (5.3%) | 154 (5.4%) |
| 80 to 84 Years | 149 (4.7%) | 137 (4.9%) |
| 85 Years and over | 45 (1.4%) | 75 (2.7%) |
| Total | 3,164 (100.0%) | 2,824 (100.0%) |
Families and Households in Lewistown
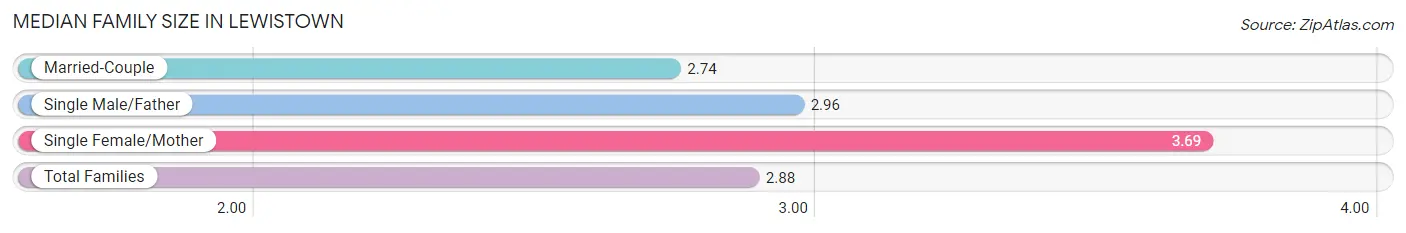
Median Family Size in Lewistown
The median family size in Lewistown is 2.88 persons per family, with single female/mother families (160 | 12.1%) accounting for the largest median family size of 3.69 persons per family. On the other hand, married-couple families (1,013 | 76.6%) represent the smallest median family size with 2.74 persons per family.
| Family Type | # Families | Family Size |
| Married-Couple | 1,013 (76.6%) | 2.74 |
| Single Male/Father | 150 (11.3%) | 2.96 |
| Single Female/Mother | 160 (12.1%) | 3.69 |
| Total Families | 1,323 (100.0%) | 2.88 |
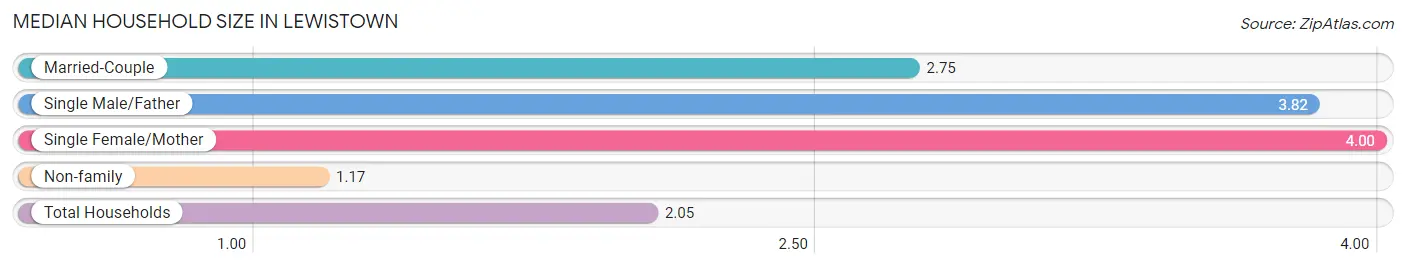
Median Household Size in Lewistown
The median household size in Lewistown is 2.05 persons per household, with single female/mother households (160 | 5.7%) accounting for the largest median household size of 4 persons per household. non-family households (1,484 | 52.9%) represent the smallest median household size with 1.17 persons per household.
| Household Type | # Households | Household Size |
| Married-Couple | 1,013 (36.1%) | 2.75 |
| Single Male/Father | 150 (5.3%) | 3.82 |
| Single Female/Mother | 160 (5.7%) | 4.00 |
| Non-family | 1,484 (52.9%) | 1.17 |
| Total Households | 2,807 (100.0%) | 2.05 |
Household Size by Marriage Status in Lewistown
Out of a total of 2,807 households in Lewistown, 1,323 (47.1%) are family households, while 1,484 (52.9%) are nonfamily households. The most numerous type of family households are 2-person households, comprising 767, and the most common type of nonfamily households are 1-person households, comprising 1,288.
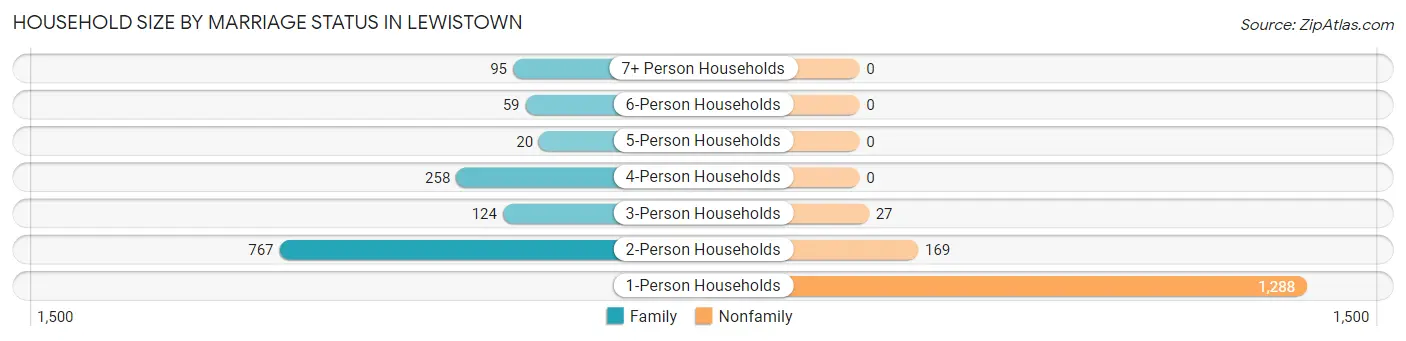
| Household Size | Family Households | Nonfamily Households |
| 1-Person Households | - | 1,288 (45.9%) |
| 2-Person Households | 767 (27.3%) | 169 (6.0%) |
| 3-Person Households | 124 (4.4%) | 27 (1.0%) |
| 4-Person Households | 258 (9.2%) | 0 (0.0%) |
| 5-Person Households | 20 (0.7%) | 0 (0.0%) |
| 6-Person Households | 59 (2.1%) | 0 (0.0%) |
| 7+ Person Households | 95 (3.4%) | 0 (0.0%) |
| Total | 1,323 (47.1%) | 1,484 (52.9%) |
Female Fertility in Lewistown
Fertility by Age in Lewistown
Average fertility rate in Lewistown is 72.0 births per 1,000 women. Women in the age bracket of 20 to 34 years have the highest fertility rate with 76.0 births per 1,000 women. Women in the age bracket of 20 to 34 years acount for 51.5% of all women with births.
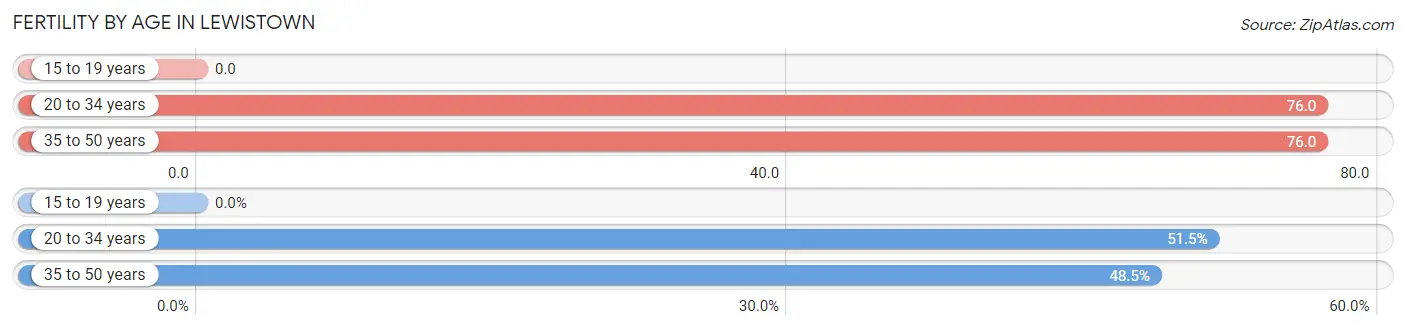
| Age Bracket | Women with Births | Births / 1,000 Women |
| 15 to 19 years | 0 (0.0%) | 0.0 |
| 20 to 34 years | 35 (51.5%) | 76.0 |
| 35 to 50 years | 33 (48.5%) | 76.0 |
| Total | 68 (100.0%) | 72.0 |
Fertility by Age by Marriage Status in Lewistown
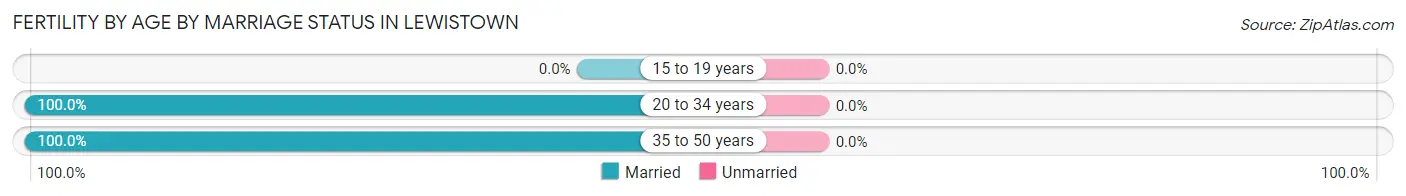
| Age Bracket | Married | Unmarried |
| 15 to 19 years | 0 (0.0%) | 0 (0.0%) |
| 20 to 34 years | 35 (100.0%) | 0 (0.0%) |
| 35 to 50 years | 33 (100.0%) | 0 (0.0%) |
| Total | 68 (100.0%) | 0 (0.0%) |
Fertility by Education in Lewistown
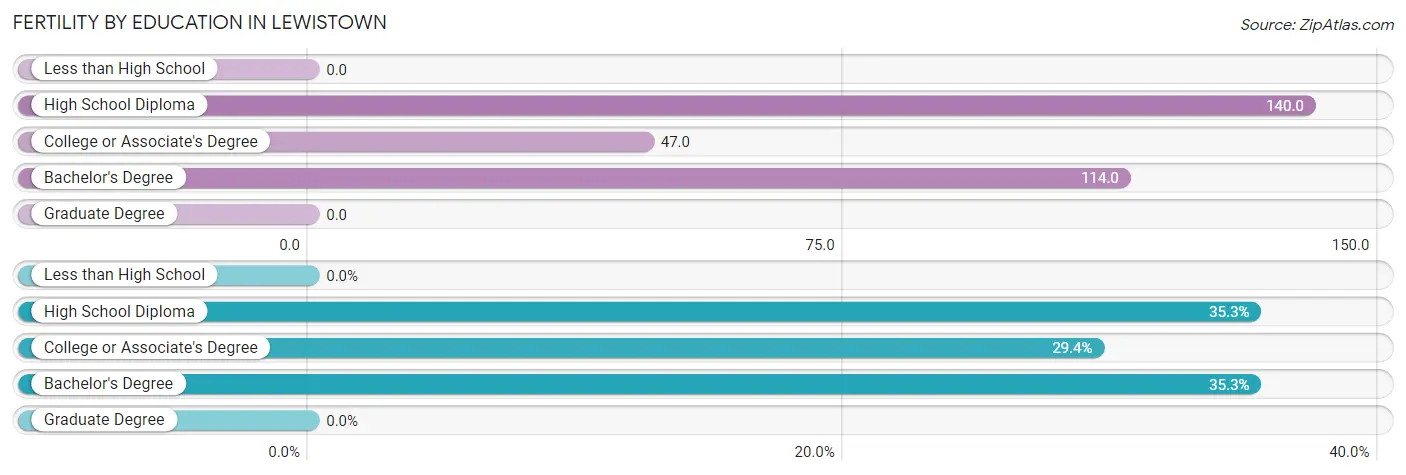
| Educational Attainment | Women with Births | Births / 1,000 Women |
| Less than High School | 0 (0.0%) | 0.0 |
| High School Diploma | 24 (35.3%) | 140.0 |
| College or Associate's Degree | 20 (29.4%) | 47.0 |
| Bachelor's Degree | 24 (35.3%) | 114.0 |
| Graduate Degree | 0 (0.0%) | 0.0 |
| Total | 68 (100.0%) | 72.0 |
Fertility by Education by Marriage Status in Lewistown
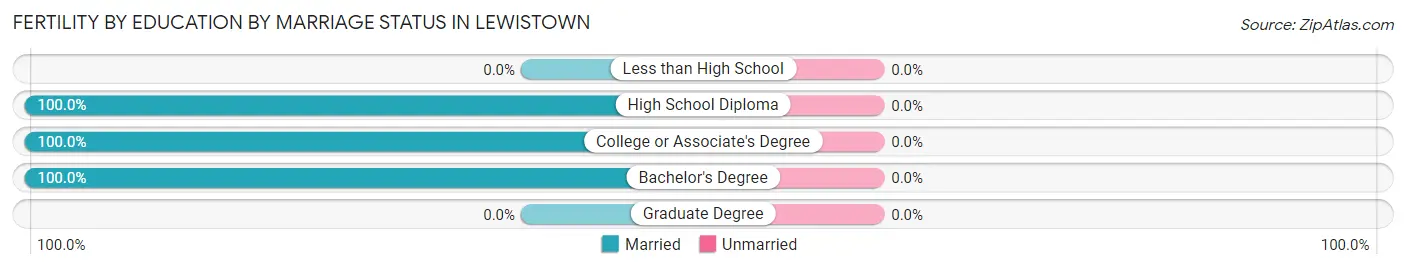
| Educational Attainment | Married | Unmarried |
| Less than High School | 0 (0.0%) | 0 (0.0%) |
| High School Diploma | 24 (100.0%) | 0 (0.0%) |
| College or Associate's Degree | 20 (100.0%) | 0 (0.0%) |
| Bachelor's Degree | 24 (100.0%) | 0 (0.0%) |
| Graduate Degree | 0 (0.0%) | 0 (0.0%) |
| Total | 68 (100.0%) | 0 (0.0%) |
Employment Characteristics in Lewistown
Employment by Class of Employer in Lewistown
Among the 2,597 employed individuals in Lewistown, private company employees (1,272 | 49.0%), not-for-profit organizations (515 | 19.8%), and self-employed (not incorporated) (294 | 11.3%) make up the most common classes of employment.
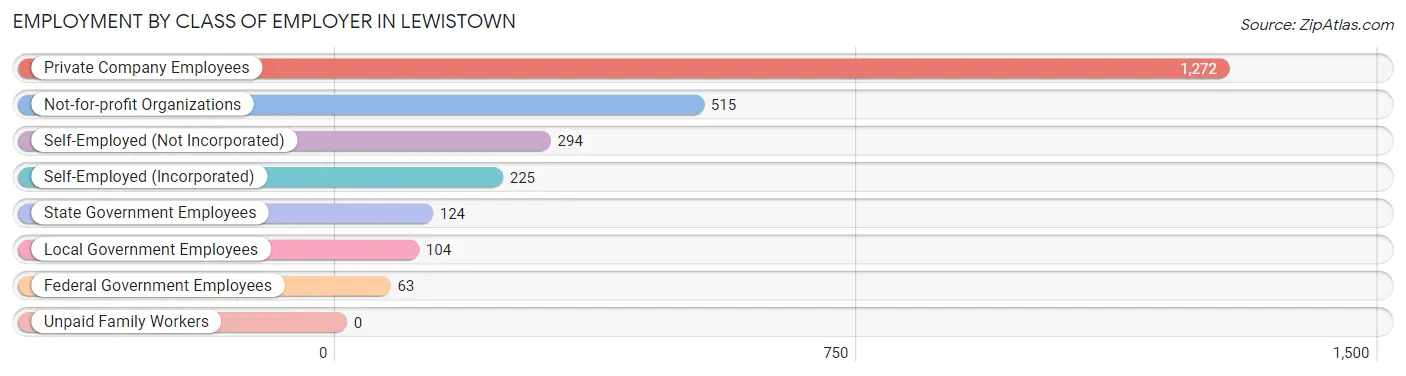
| Employer Class | # Employees | % Employees |
| Private Company Employees | 1,272 | 49.0% |
| Self-Employed (Incorporated) | 225 | 8.7% |
| Self-Employed (Not Incorporated) | 294 | 11.3% |
| Not-for-profit Organizations | 515 | 19.8% |
| Local Government Employees | 104 | 4.0% |
| State Government Employees | 124 | 4.8% |
| Federal Government Employees | 63 | 2.4% |
| Unpaid Family Workers | 0 | 0.0% |
| Total | 2,597 | 100.0% |
Employment Status by Age in Lewistown
According to the labor force statistics for Lewistown, out of the total population over 16 years of age (4,874), 56.5% or 2,754 individuals are in the labor force, with 5.7% or 157 of them unemployed. The age group with the highest labor force participation rate is 20 to 24 years, with 95.1% or 234 individuals in the labor force. Within the labor force, the 20 to 24 years age range has the highest percentage of unemployed individuals, with 43.2% or 101 of them being unemployed.
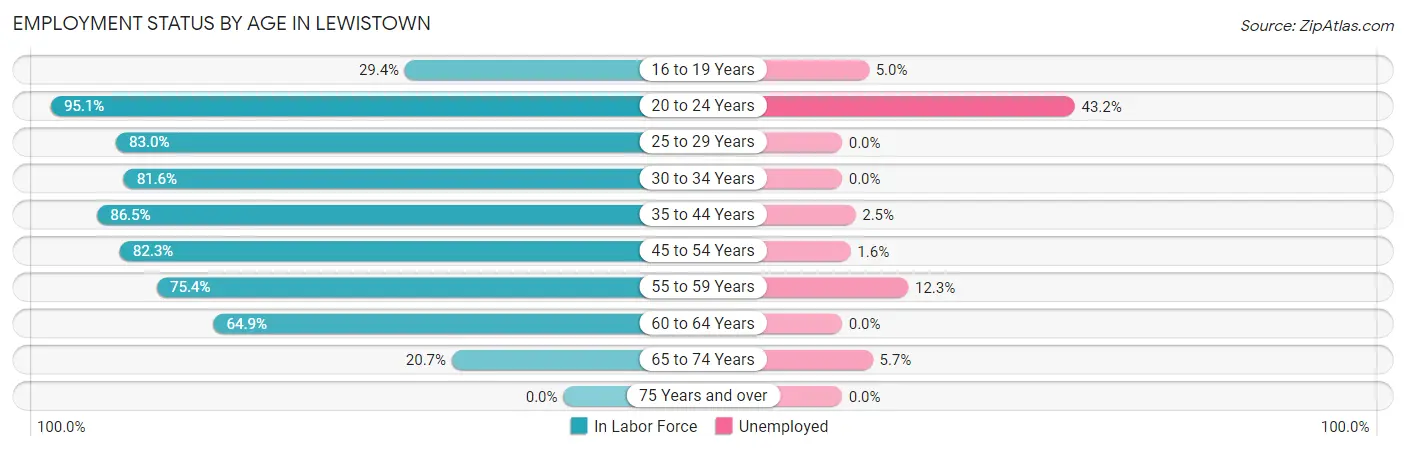
| Age Bracket | In Labor Force | Unemployed |
| 16 to 19 Years | 40 (29.4%) | 2 (5.0%) |
| 20 to 24 Years | 234 (95.1%) | 101 (43.2%) |
| 25 to 29 Years | 347 (83.0%) | 0 (0.0%) |
| 30 to 34 Years | 283 (81.6%) | 0 (0.0%) |
| 35 to 44 Years | 514 (86.5%) | 13 (2.5%) |
| 45 to 54 Years | 576 (82.3%) | 9 (1.6%) |
| 55 to 59 Years | 187 (75.4%) | 23 (12.3%) |
| 60 to 64 Years | 400 (64.9%) | 0 (0.0%) |
| 65 to 74 Years | 174 (20.7%) | 10 (5.7%) |
| 75 Years and over | 0 (0.0%) | 0 (0.0%) |
| Total | 2,754 (56.5%) | 157 (5.7%) |
Employment Status by Educational Attainment in Lewistown
According to labor force statistics for Lewistown, 78.9% of individuals (2,306) out of the total population between 25 and 64 years of age (2,923) are in the labor force, with 2.0% or 46 of them being unemployed. The group with the highest labor force participation rate are those with the educational attainment of bachelor's degree or higher, with 86.2% or 646 individuals in the labor force. Within the labor force, individuals with college / associate degree education have the highest percentage of unemployment, with 4.4% or 36 of them being unemployed.
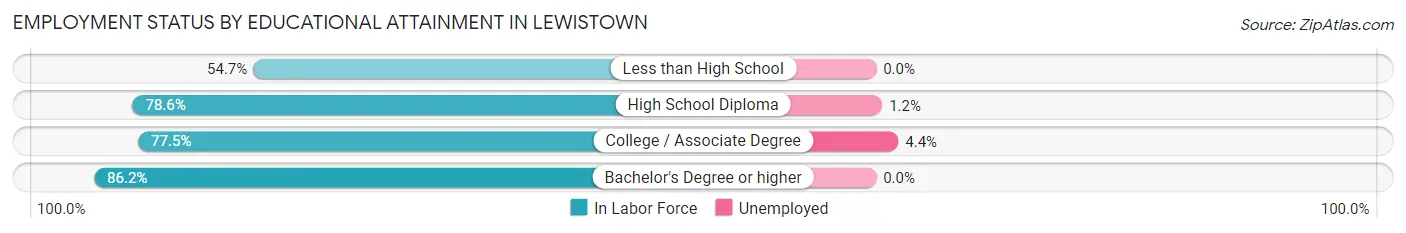
| Educational Attainment | In Labor Force | Unemployed |
| Less than High School | 81 (54.7%) | 0 (0.0%) |
| High School Diploma | 766 (78.6%) | 12 (1.2%) |
| College / Associate Degree | 815 (77.5%) | 46 (4.4%) |
| Bachelor's Degree or higher | 646 (86.2%) | 0 (0.0%) |
| Total | 2,306 (78.9%) | 58 (2.0%) |
Employment Occupations by Sex in Lewistown
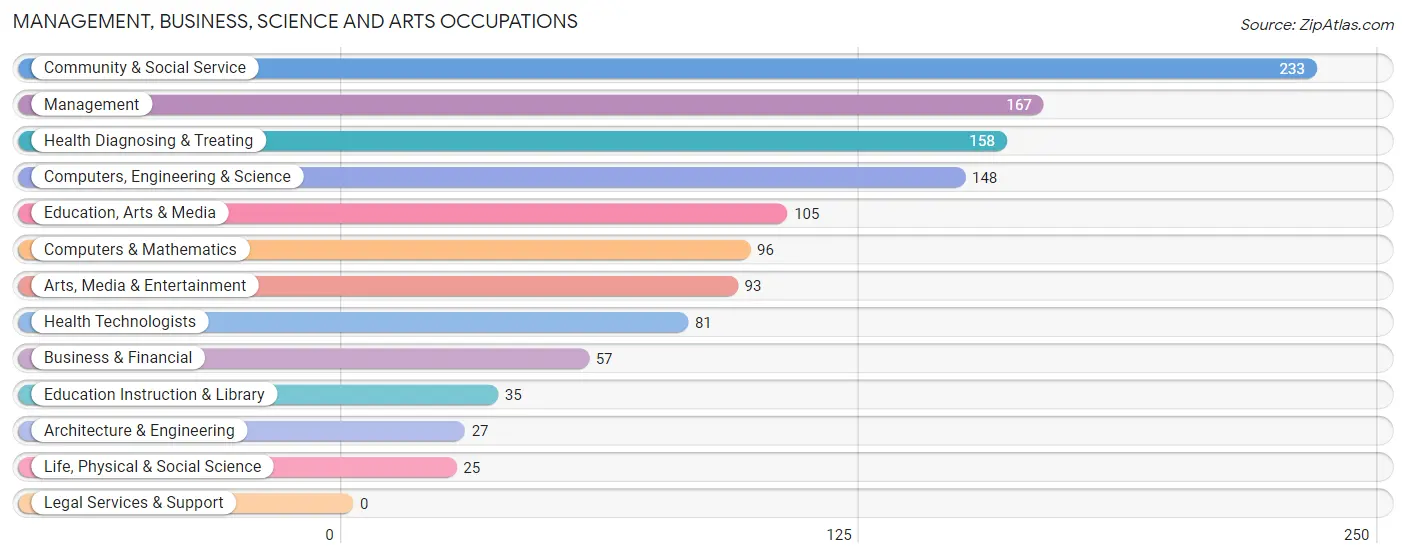
Management, Business, Science and Arts Occupations
The most common Management, Business, Science and Arts occupations in Lewistown are Community & Social Service (233 | 9.0%), Management (167 | 6.4%), Health Diagnosing & Treating (158 | 6.1%), Computers, Engineering & Science (148 | 5.7%), and Education, Arts & Media (105 | 4.0%).
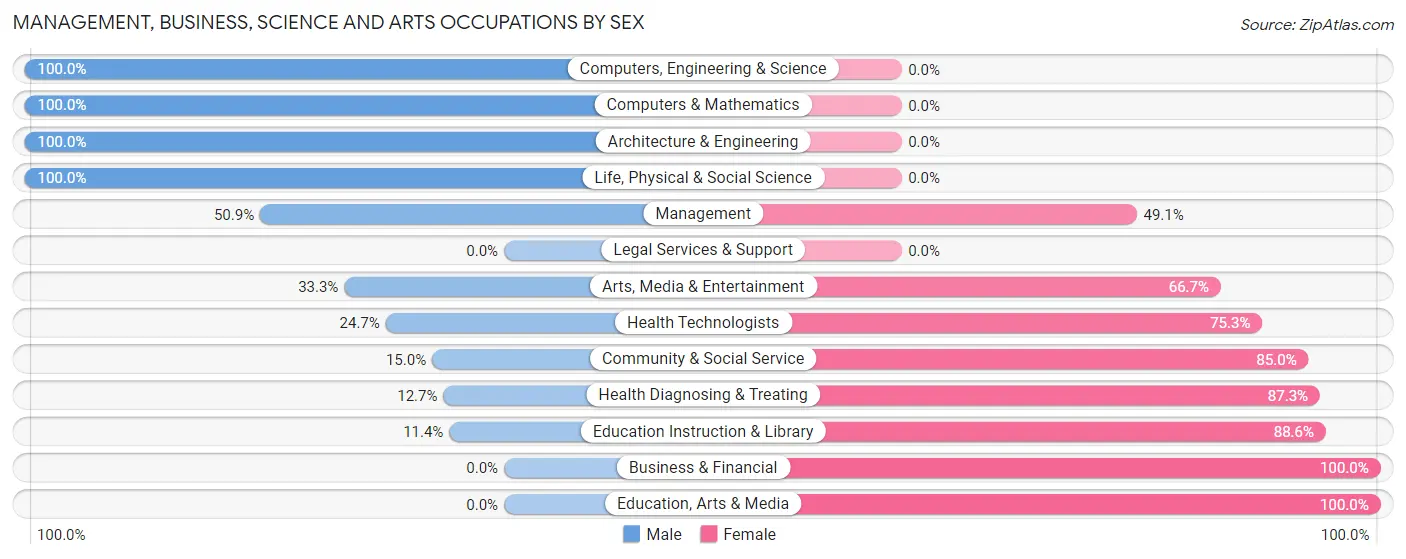
Management, Business, Science and Arts Occupations by Sex
Within the Management, Business, Science and Arts occupations in Lewistown, the most male-oriented occupations are Computers, Engineering & Science (100.0%), Computers & Mathematics (100.0%), and Architecture & Engineering (100.0%), while the most female-oriented occupations are Business & Financial (100.0%), Education, Arts & Media (100.0%), and Education Instruction & Library (88.6%).
| Occupation | Male | Female |
| Management | 85 (50.9%) | 82 (49.1%) |
| Business & Financial | 0 (0.0%) | 57 (100.0%) |
| Computers, Engineering & Science | 148 (100.0%) | 0 (0.0%) |
| Computers & Mathematics | 96 (100.0%) | 0 (0.0%) |
| Architecture & Engineering | 27 (100.0%) | 0 (0.0%) |
| Life, Physical & Social Science | 25 (100.0%) | 0 (0.0%) |
| Community & Social Service | 35 (15.0%) | 198 (85.0%) |
| Education, Arts & Media | 0 (0.0%) | 105 (100.0%) |
| Legal Services & Support | 0 (0.0%) | 0 (0.0%) |
| Education Instruction & Library | 4 (11.4%) | 31 (88.6%) |
| Arts, Media & Entertainment | 31 (33.3%) | 62 (66.7%) |
| Health Diagnosing & Treating | 20 (12.7%) | 138 (87.3%) |
| Health Technologists | 20 (24.7%) | 61 (75.3%) |
| Total (Category) | 288 (37.8%) | 475 (62.3%) |
| Total (Overall) | 1,509 (58.1%) | 1,088 (41.9%) |
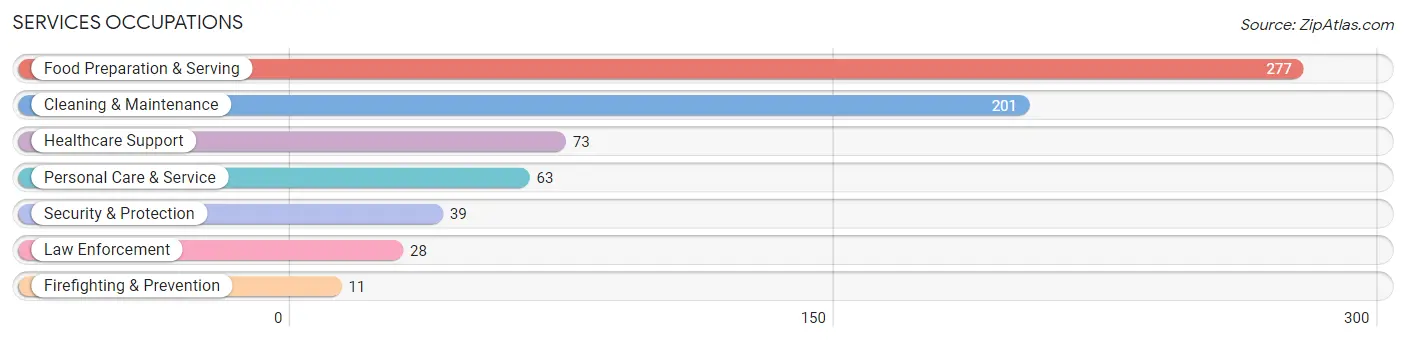
Services Occupations
The most common Services occupations in Lewistown are Food Preparation & Serving (277 | 10.7%), Cleaning & Maintenance (201 | 7.7%), Healthcare Support (73 | 2.8%), Personal Care & Service (63 | 2.4%), and Security & Protection (39 | 1.5%).
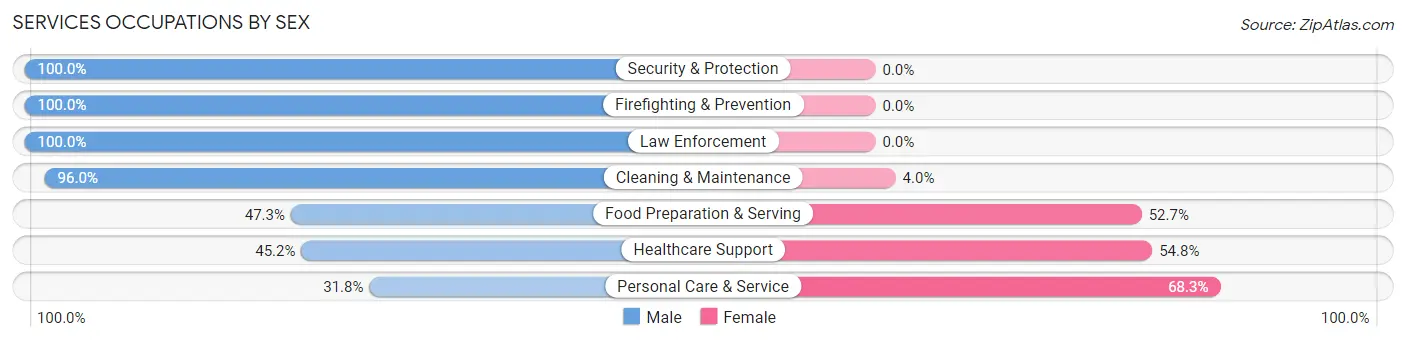
Services Occupations by Sex
Within the Services occupations in Lewistown, the most male-oriented occupations are Security & Protection (100.0%), Firefighting & Prevention (100.0%), and Law Enforcement (100.0%), while the most female-oriented occupations are Personal Care & Service (68.2%), Healthcare Support (54.8%), and Food Preparation & Serving (52.7%).
| Occupation | Male | Female |
| Healthcare Support | 33 (45.2%) | 40 (54.8%) |
| Security & Protection | 39 (100.0%) | 0 (0.0%) |
| Firefighting & Prevention | 11 (100.0%) | 0 (0.0%) |
| Law Enforcement | 28 (100.0%) | 0 (0.0%) |
| Food Preparation & Serving | 131 (47.3%) | 146 (52.7%) |
| Cleaning & Maintenance | 193 (96.0%) | 8 (4.0%) |
| Personal Care & Service | 20 (31.8%) | 43 (68.2%) |
| Total (Category) | 416 (63.7%) | 237 (36.3%) |
| Total (Overall) | 1,509 (58.1%) | 1,088 (41.9%) |
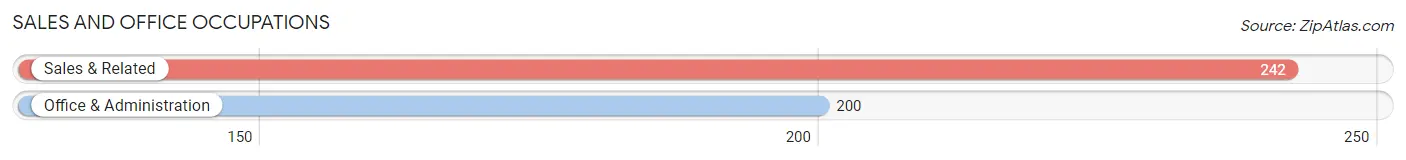
Sales and Office Occupations
The most common Sales and Office occupations in Lewistown are Sales & Related (242 | 9.3%), and Office & Administration (200 | 7.7%).
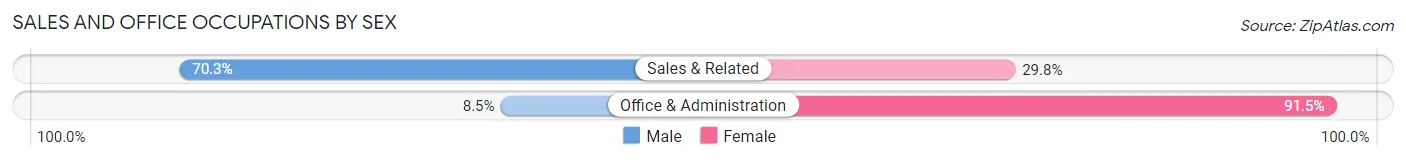
Sales and Office Occupations by Sex
| Occupation | Male | Female |
| Sales & Related | 170 (70.3%) | 72 (29.7%) |
| Office & Administration | 17 (8.5%) | 183 (91.5%) |
| Total (Category) | 187 (42.3%) | 255 (57.7%) |
| Total (Overall) | 1,509 (58.1%) | 1,088 (41.9%) |
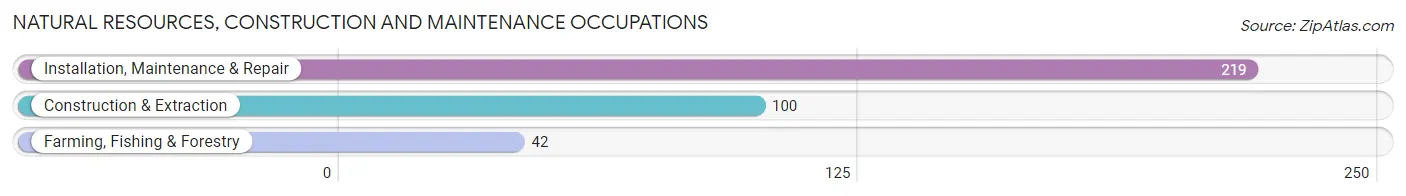
Natural Resources, Construction and Maintenance Occupations
The most common Natural Resources, Construction and Maintenance occupations in Lewistown are Installation, Maintenance & Repair (219 | 8.4%), Construction & Extraction (100 | 3.8%), and Farming, Fishing & Forestry (42 | 1.6%).
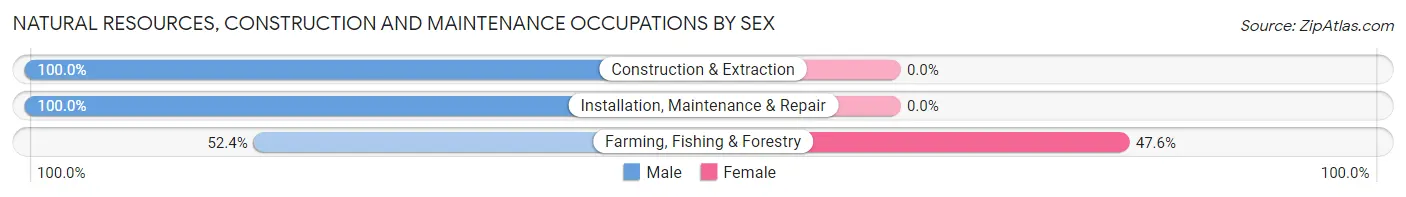
Natural Resources, Construction and Maintenance Occupations by Sex
| Occupation | Male | Female |
| Farming, Fishing & Forestry | 22 (52.4%) | 20 (47.6%) |
| Construction & Extraction | 100 (100.0%) | 0 (0.0%) |
| Installation, Maintenance & Repair | 219 (100.0%) | 0 (0.0%) |
| Total (Category) | 341 (94.5%) | 20 (5.5%) |
| Total (Overall) | 1,509 (58.1%) | 1,088 (41.9%) |
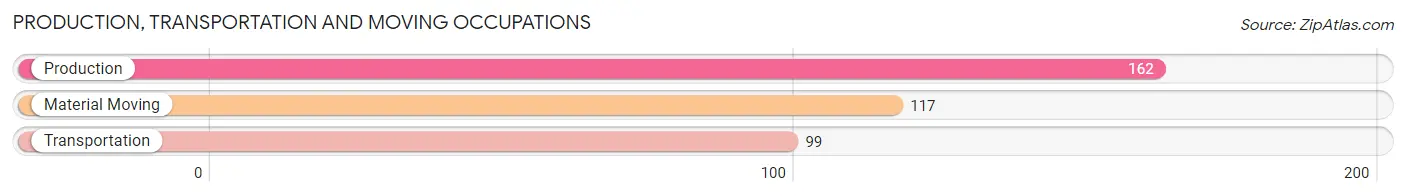
Production, Transportation and Moving Occupations
The most common Production, Transportation and Moving occupations in Lewistown are Production (162 | 6.2%), Material Moving (117 | 4.5%), and Transportation (99 | 3.8%).
Production, Transportation and Moving Occupations by Sex
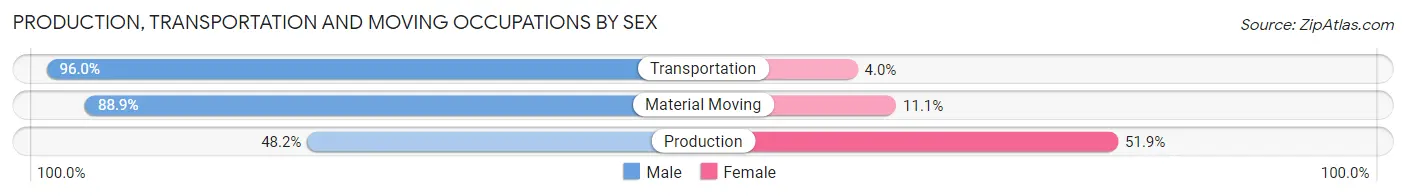
| Occupation | Male | Female |
| Production | 78 (48.1%) | 84 (51.8%) |
| Transportation | 95 (96.0%) | 4 (4.0%) |
| Material Moving | 104 (88.9%) | 13 (11.1%) |
| Total (Category) | 277 (73.3%) | 101 (26.7%) |
| Total (Overall) | 1,509 (58.1%) | 1,088 (41.9%) |
Employment Industries by Sex in Lewistown
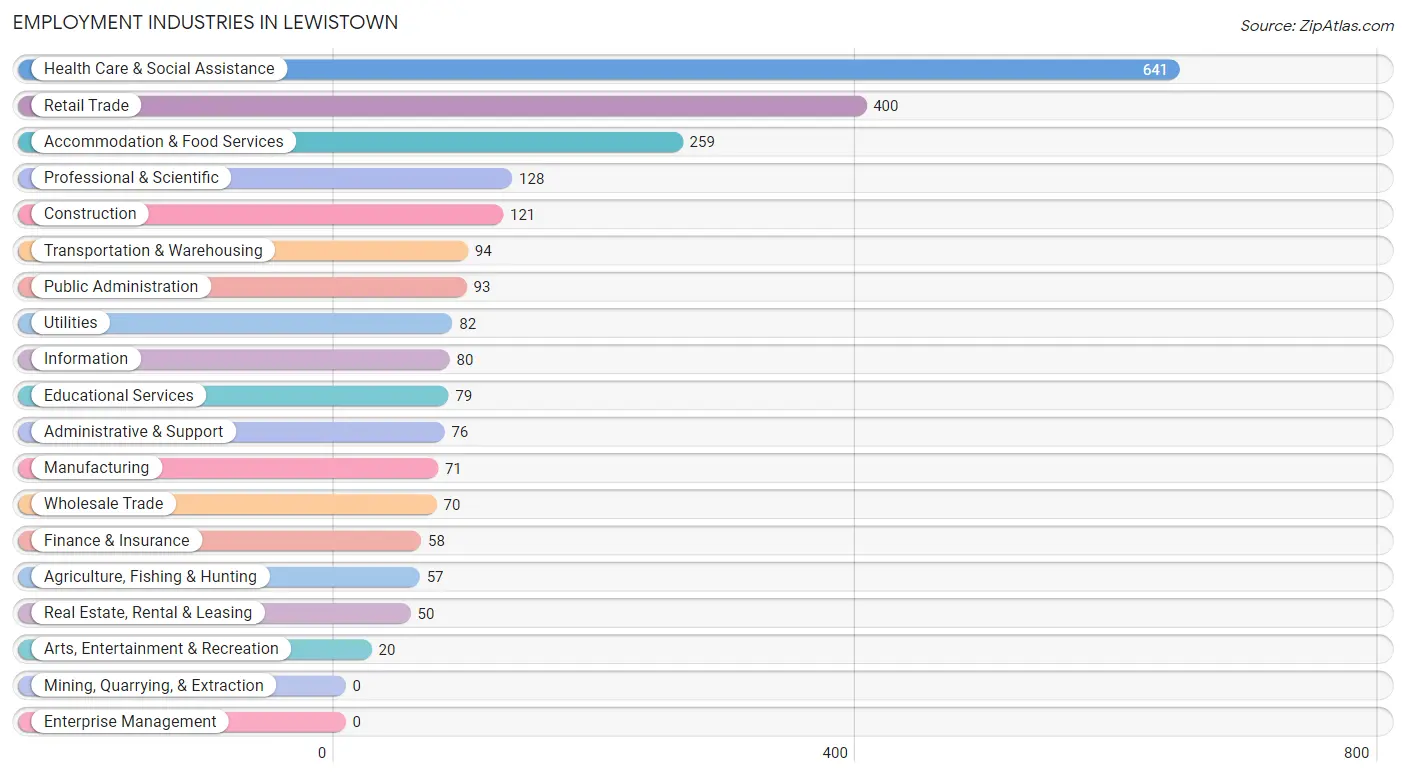
Employment Industries in Lewistown
The major employment industries in Lewistown include Health Care & Social Assistance (641 | 24.7%), Retail Trade (400 | 15.4%), Accommodation & Food Services (259 | 10.0%), Professional & Scientific (128 | 4.9%), and Construction (121 | 4.7%).
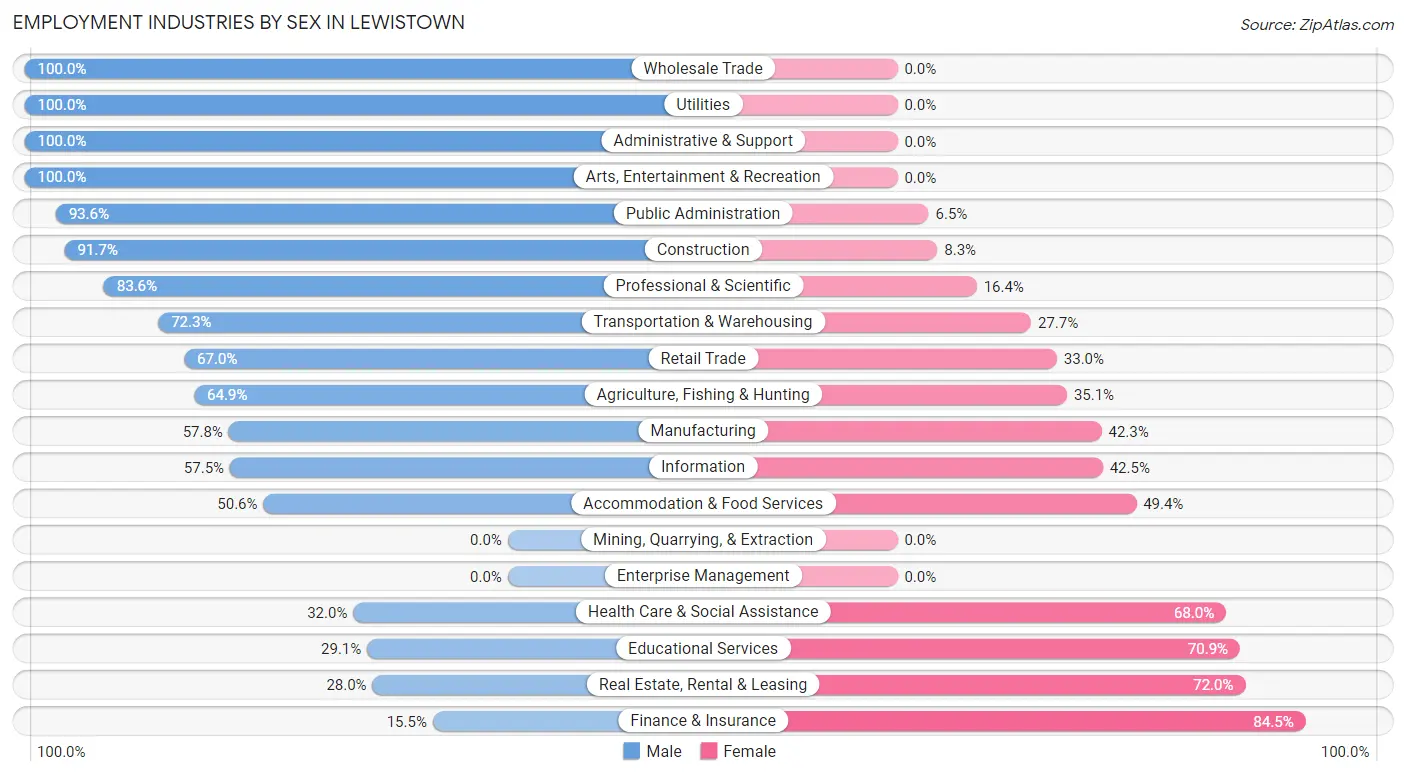
Employment Industries by Sex in Lewistown
The Lewistown industries that see more men than women are Wholesale Trade (100.0%), Utilities (100.0%), and Administrative & Support (100.0%), whereas the industries that tend to have a higher number of women are Finance & Insurance (84.5%), Real Estate, Rental & Leasing (72.0%), and Educational Services (70.9%).
| Industry | Male | Female |
| Agriculture, Fishing & Hunting | 37 (64.9%) | 20 (35.1%) |
| Mining, Quarrying, & Extraction | 0 (0.0%) | 0 (0.0%) |
| Construction | 111 (91.7%) | 10 (8.3%) |
| Manufacturing | 41 (57.8%) | 30 (42.2%) |
| Wholesale Trade | 70 (100.0%) | 0 (0.0%) |
| Retail Trade | 268 (67.0%) | 132 (33.0%) |
| Transportation & Warehousing | 68 (72.3%) | 26 (27.7%) |
| Utilities | 82 (100.0%) | 0 (0.0%) |
| Information | 46 (57.5%) | 34 (42.5%) |
| Finance & Insurance | 9 (15.5%) | 49 (84.5%) |
| Real Estate, Rental & Leasing | 14 (28.0%) | 36 (72.0%) |
| Professional & Scientific | 107 (83.6%) | 21 (16.4%) |
| Enterprise Management | 0 (0.0%) | 0 (0.0%) |
| Administrative & Support | 76 (100.0%) | 0 (0.0%) |
| Educational Services | 23 (29.1%) | 56 (70.9%) |
| Health Care & Social Assistance | 205 (32.0%) | 436 (68.0%) |
| Arts, Entertainment & Recreation | 20 (100.0%) | 0 (0.0%) |
| Accommodation & Food Services | 131 (50.6%) | 128 (49.4%) |
| Public Administration | 87 (93.5%) | 6 (6.5%) |
| Total | 1,509 (58.1%) | 1,088 (41.9%) |
Education in Lewistown
School Enrollment in Lewistown
The most common levels of schooling among the 1,051 students in Lewistown are elementary school (344 | 32.7%), middle school (243 | 23.1%), and high school (176 | 16.8%).
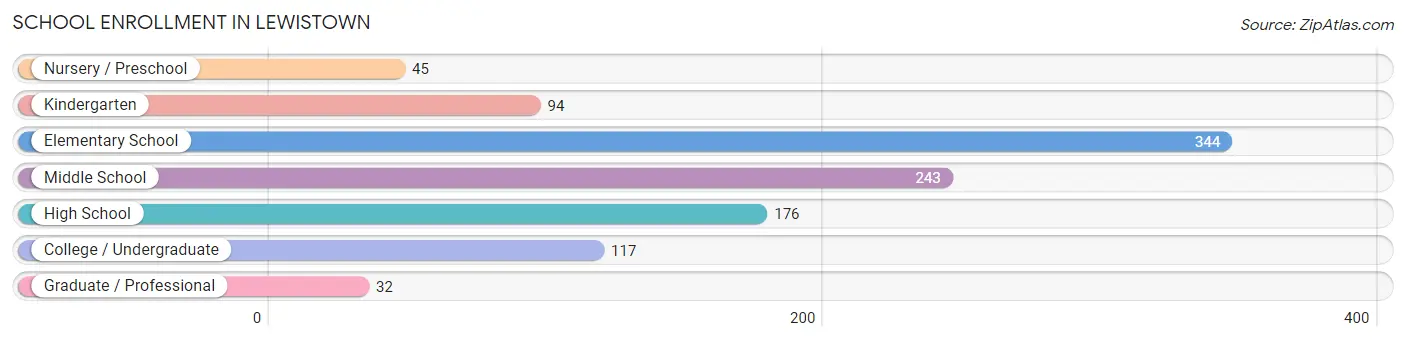
| School Level | # Students | % Students |
| Nursery / Preschool | 45 | 4.3% |
| Kindergarten | 94 | 8.9% |
| Elementary School | 344 | 32.7% |
| Middle School | 243 | 23.1% |
| High School | 176 | 16.8% |
| College / Undergraduate | 117 | 11.1% |
| Graduate / Professional | 32 | 3.0% |
| Total | 1,051 | 100.0% |
School Enrollment by Age by Funding Source in Lewistown
Out of a total of 1,051 students who are enrolled in schools in Lewistown, 58 (5.5%) attend a private institution, while the remaining 993 (94.5%) are enrolled in public schools. The age group of 35 years and over has the highest likelihood of being enrolled in private schools, with 34 (52.3% in the age bracket) enrolled. Conversely, the age group of 3 to 4 year olds has the lowest likelihood of being enrolled in a private school, with 21 (100.0% in the age bracket) attending a public institution.
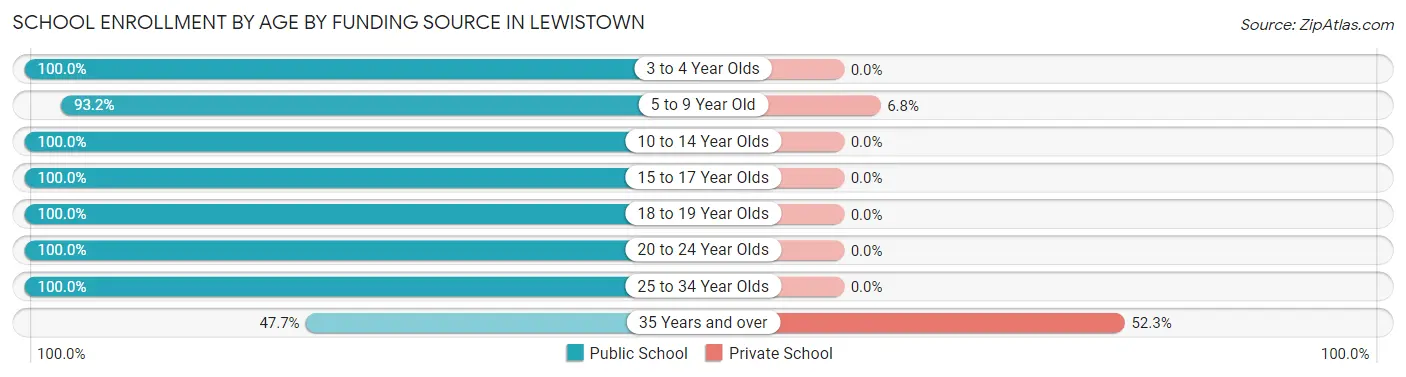
| Age Bracket | Public School | Private School |
| 3 to 4 Year Olds | 21 (100.0%) | 0 (0.0%) |
| 5 to 9 Year Old | 329 (93.2%) | 24 (6.8%) |
| 10 to 14 Year Olds | 371 (100.0%) | 0 (0.0%) |
| 15 to 17 Year Olds | 200 (100.0%) | 0 (0.0%) |
| 18 to 19 Year Olds | 12 (100.0%) | 0 (0.0%) |
| 20 to 24 Year Olds | 21 (100.0%) | 0 (0.0%) |
| 25 to 34 Year Olds | 8 (100.0%) | 0 (0.0%) |
| 35 Years and over | 31 (47.7%) | 34 (52.3%) |
| Total | 993 (94.5%) | 58 (5.5%) |
Educational Attainment by Field of Study in Lewistown
Education (328 | 29.9%), arts & humanities (165 | 15.0%), business (128 | 11.7%), science & technology (111 | 10.1%), and bio, nature & agricultural (99 | 9.0%) are the most common fields of study among 1,098 individuals in Lewistown who have obtained a bachelor's degree or higher.
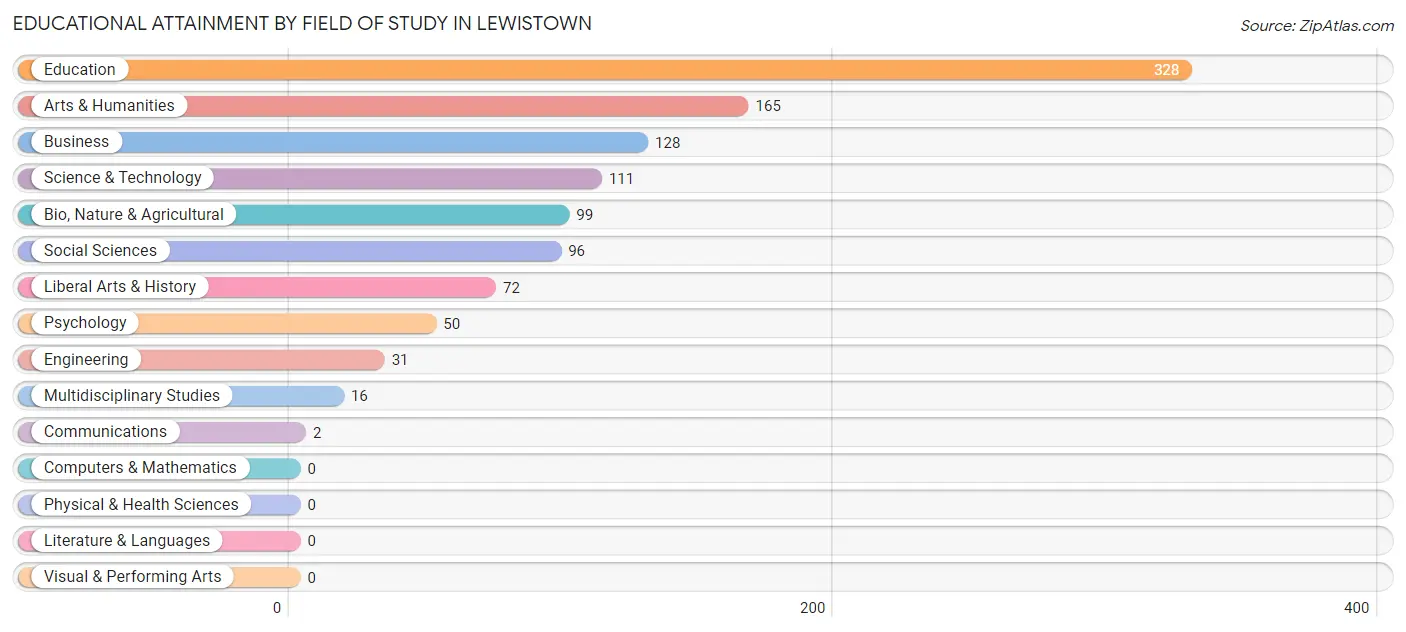
| Field of Study | # Graduates | % Graduates |
| Computers & Mathematics | 0 | 0.0% |
| Bio, Nature & Agricultural | 99 | 9.0% |
| Physical & Health Sciences | 0 | 0.0% |
| Psychology | 50 | 4.5% |
| Social Sciences | 96 | 8.7% |
| Engineering | 31 | 2.8% |
| Multidisciplinary Studies | 16 | 1.5% |
| Science & Technology | 111 | 10.1% |
| Business | 128 | 11.7% |
| Education | 328 | 29.9% |
| Literature & Languages | 0 | 0.0% |
| Liberal Arts & History | 72 | 6.6% |
| Visual & Performing Arts | 0 | 0.0% |
| Communications | 2 | 0.2% |
| Arts & Humanities | 165 | 15.0% |
| Total | 1,098 | 100.0% |
Transportation & Commute in Lewistown
Vehicle Availability by Sex in Lewistown
The most prevalent vehicle ownership categories in Lewistown are males with 3 vehicles (460, accounting for 30.5%) and females with 3 vehicles (345, making up 42.3%).
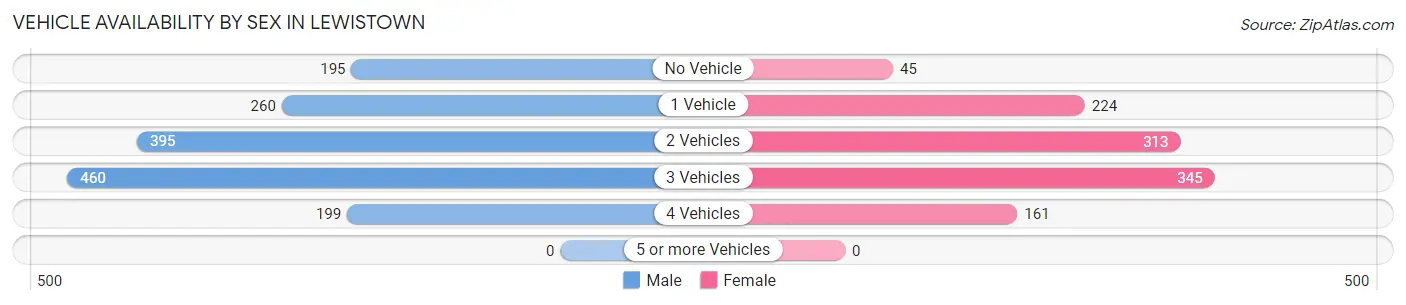
| Vehicles Available | Male | Female |
| No Vehicle | 195 (12.9%) | 45 (4.1%) |
| 1 Vehicle | 260 (17.2%) | 224 (20.6%) |
| 2 Vehicles | 395 (26.2%) | 313 (28.8%) |
| 3 Vehicles | 460 (30.5%) | 345 (31.7%) |
| 4 Vehicles | 199 (13.2%) | 161 (14.8%) |
| 5 or more Vehicles | 0 (0.0%) | 0 (0.0%) |
| Total | 1,509 (100.0%) | 1,088 (100.0%) |
Commute Time in Lewistown
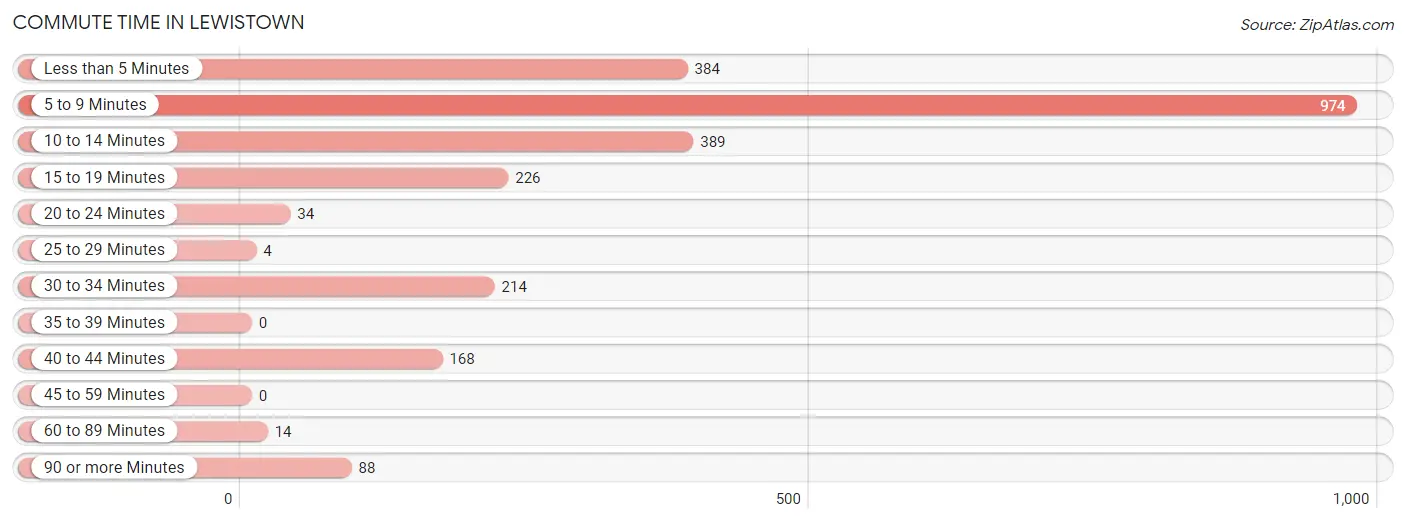
The most frequently occuring commute durations in Lewistown are 5 to 9 minutes (974 commuters, 39.0%), 10 to 14 minutes (389 commuters, 15.6%), and less than 5 minutes (384 commuters, 15.4%).
| Commute Time | # Commuters | % Commuters |
| Less than 5 Minutes | 384 | 15.4% |
| 5 to 9 Minutes | 974 | 39.0% |
| 10 to 14 Minutes | 389 | 15.6% |
| 15 to 19 Minutes | 226 | 9.1% |
| 20 to 24 Minutes | 34 | 1.4% |
| 25 to 29 Minutes | 4 | 0.2% |
| 30 to 34 Minutes | 214 | 8.6% |
| 35 to 39 Minutes | 0 | 0.0% |
| 40 to 44 Minutes | 168 | 6.7% |
| 45 to 59 Minutes | 0 | 0.0% |
| 60 to 89 Minutes | 14 | 0.6% |
| 90 or more Minutes | 88 | 3.5% |
Commute Time by Sex in Lewistown
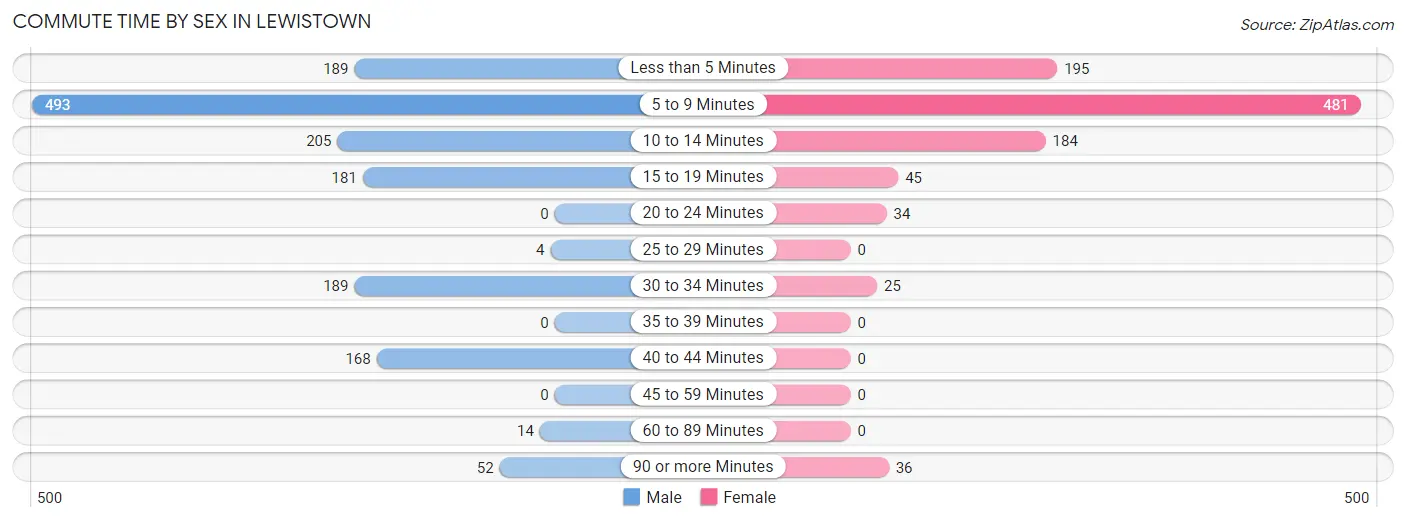
The most common commute times in Lewistown are 5 to 9 minutes (493 commuters, 33.0%) for males and 5 to 9 minutes (481 commuters, 48.1%) for females.
| Commute Time | Male | Female |
| Less than 5 Minutes | 189 (12.6%) | 195 (19.5%) |
| 5 to 9 Minutes | 493 (33.0%) | 481 (48.1%) |
| 10 to 14 Minutes | 205 (13.7%) | 184 (18.4%) |
| 15 to 19 Minutes | 181 (12.1%) | 45 (4.5%) |
| 20 to 24 Minutes | 0 (0.0%) | 34 (3.4%) |
| 25 to 29 Minutes | 4 (0.3%) | 0 (0.0%) |
| 30 to 34 Minutes | 189 (12.6%) | 25 (2.5%) |
| 35 to 39 Minutes | 0 (0.0%) | 0 (0.0%) |
| 40 to 44 Minutes | 168 (11.2%) | 0 (0.0%) |
| 45 to 59 Minutes | 0 (0.0%) | 0 (0.0%) |
| 60 to 89 Minutes | 14 (0.9%) | 0 (0.0%) |
| 90 or more Minutes | 52 (3.5%) | 36 (3.6%) |
Time of Departure to Work by Sex in Lewistown
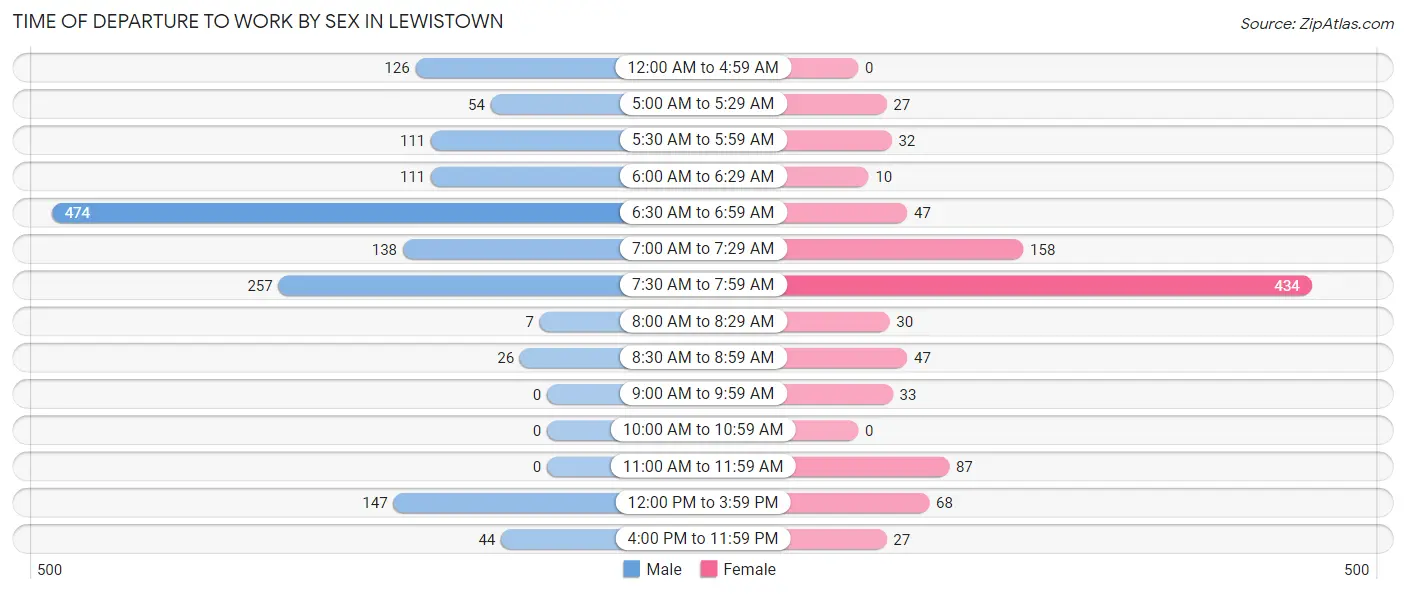
The most frequent times of departure to work in Lewistown are 6:30 AM to 6:59 AM (474, 31.7%) for males and 7:30 AM to 7:59 AM (434, 43.4%) for females.
| Time of Departure | Male | Female |
| 12:00 AM to 4:59 AM | 126 (8.4%) | 0 (0.0%) |
| 5:00 AM to 5:29 AM | 54 (3.6%) | 27 (2.7%) |
| 5:30 AM to 5:59 AM | 111 (7.4%) | 32 (3.2%) |
| 6:00 AM to 6:29 AM | 111 (7.4%) | 10 (1.0%) |
| 6:30 AM to 6:59 AM | 474 (31.7%) | 47 (4.7%) |
| 7:00 AM to 7:29 AM | 138 (9.2%) | 158 (15.8%) |
| 7:30 AM to 7:59 AM | 257 (17.2%) | 434 (43.4%) |
| 8:00 AM to 8:29 AM | 7 (0.5%) | 30 (3.0%) |
| 8:30 AM to 8:59 AM | 26 (1.7%) | 47 (4.7%) |
| 9:00 AM to 9:59 AM | 0 (0.0%) | 33 (3.3%) |
| 10:00 AM to 10:59 AM | 0 (0.0%) | 0 (0.0%) |
| 11:00 AM to 11:59 AM | 0 (0.0%) | 87 (8.7%) |
| 12:00 PM to 3:59 PM | 147 (9.8%) | 68 (6.8%) |
| 4:00 PM to 11:59 PM | 44 (2.9%) | 27 (2.7%) |
| Total | 1,495 (100.0%) | 1,000 (100.0%) |
Housing Occupancy in Lewistown
Occupancy by Ownership in Lewistown
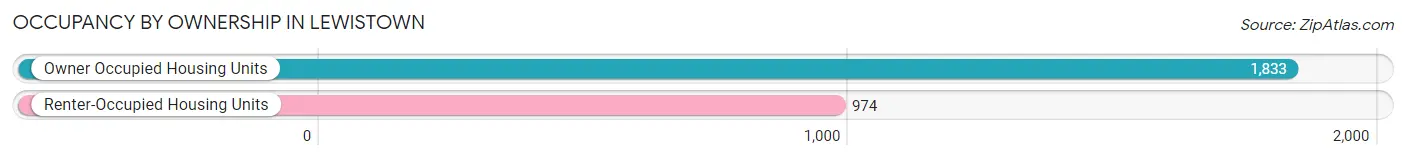
Of the total 2,807 dwellings in Lewistown, owner-occupied units account for 1,833 (65.3%), while renter-occupied units make up 974 (34.7%).
| Occupancy | # Housing Units | % Housing Units |
| Owner Occupied Housing Units | 1,833 | 65.3% |
| Renter-Occupied Housing Units | 974 | 34.7% |
| Total Occupied Housing Units | 2,807 | 100.0% |
Occupancy by Household Size in Lewistown
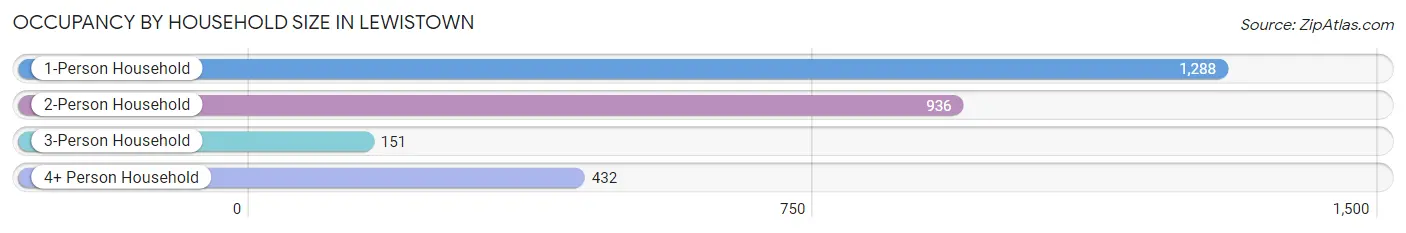
| Household Size | # Housing Units | % Housing Units |
| 1-Person Household | 1,288 | 45.9% |
| 2-Person Household | 936 | 33.4% |
| 3-Person Household | 151 | 5.4% |
| 4+ Person Household | 432 | 15.4% |
| Total Housing Units | 2,807 | 100.0% |
Occupancy by Ownership by Household Size in Lewistown
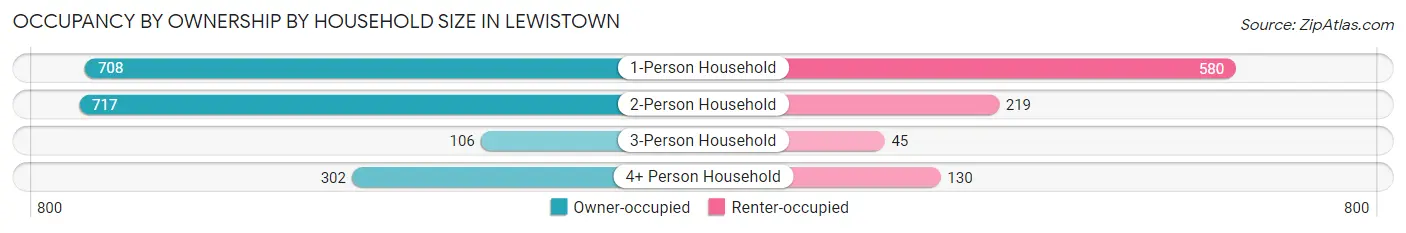
| Household Size | Owner-occupied | Renter-occupied |
| 1-Person Household | 708 (55.0%) | 580 (45.0%) |
| 2-Person Household | 717 (76.6%) | 219 (23.4%) |
| 3-Person Household | 106 (70.2%) | 45 (29.8%) |
| 4+ Person Household | 302 (69.9%) | 130 (30.1%) |
| Total Housing Units | 1,833 (65.3%) | 974 (34.7%) |
Occupancy by Educational Attainment in Lewistown
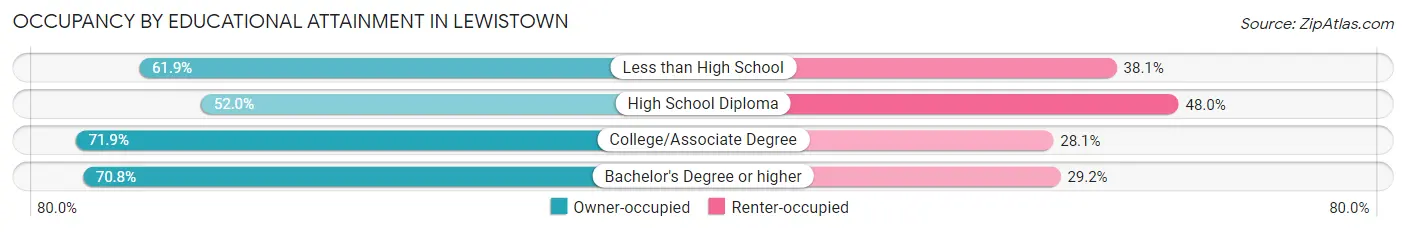
| Household Size | Owner-occupied | Renter-occupied |
| Less than High School | 73 (61.9%) | 45 (38.1%) |
| High School Diploma | 433 (52.0%) | 399 (48.0%) |
| College/Associate Degree | 809 (71.9%) | 316 (28.1%) |
| Bachelor's Degree or higher | 518 (70.8%) | 214 (29.2%) |
Occupancy by Age of Householder in Lewistown
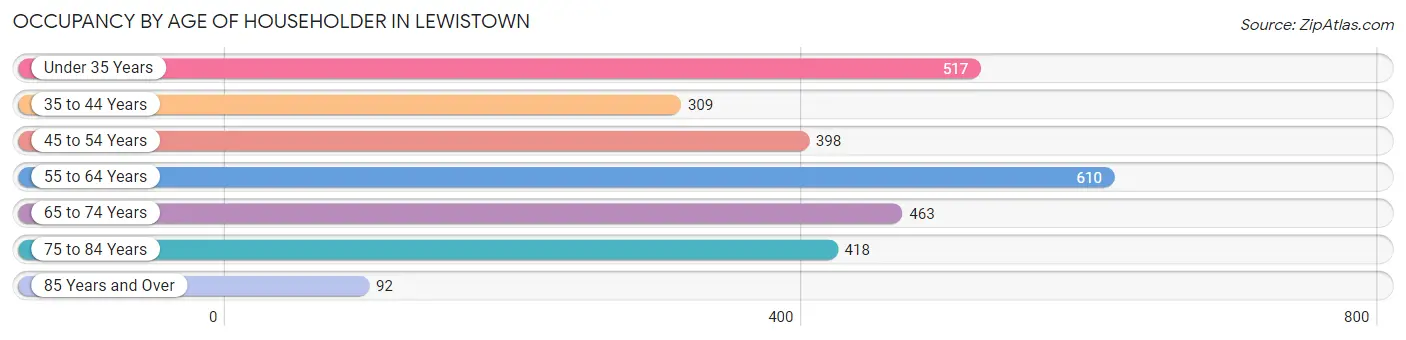
| Age Bracket | # Households | % Households |
| Under 35 Years | 517 | 18.4% |
| 35 to 44 Years | 309 | 11.0% |
| 45 to 54 Years | 398 | 14.2% |
| 55 to 64 Years | 610 | 21.7% |
| 65 to 74 Years | 463 | 16.5% |
| 75 to 84 Years | 418 | 14.9% |
| 85 Years and Over | 92 | 3.3% |
| Total | 2,807 | 100.0% |
Housing Finances in Lewistown
Median Income by Occupancy in Lewistown
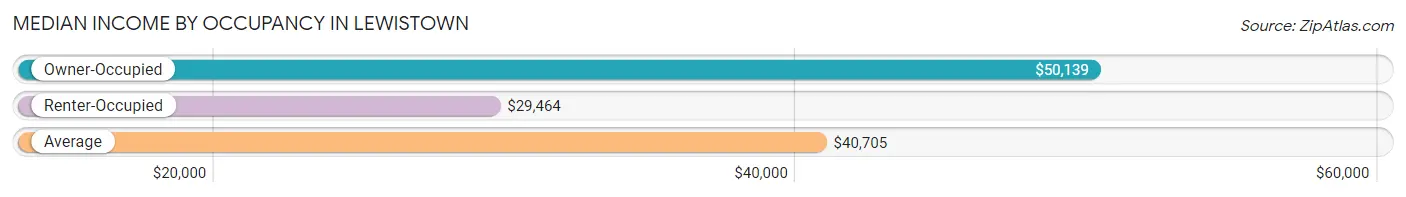
| Occupancy Type | # Households | Median Income |
| Owner-Occupied | 1,833 (65.3%) | $50,139 |
| Renter-Occupied | 974 (34.7%) | $29,464 |
| Average | 2,807 (100.0%) | $40,705 |
Occupancy by Householder Income Bracket in Lewistown
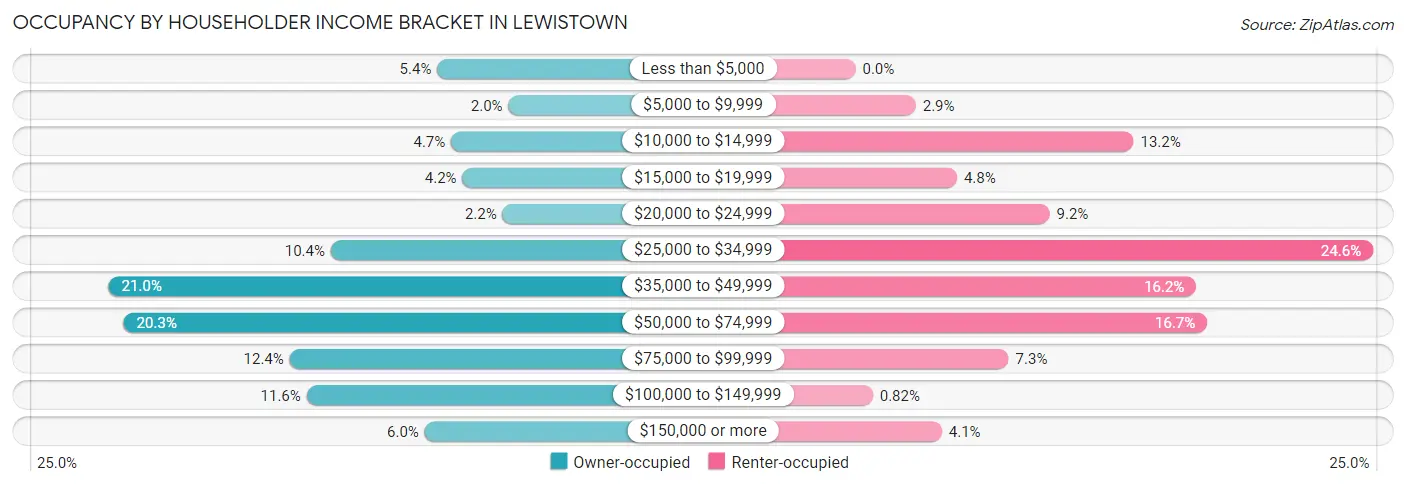
| Income Bracket | Owner-occupied | Renter-occupied |
| Less than $5,000 | 98 (5.3%) | 0 (0.0%) |
| $5,000 to $9,999 | 36 (2.0%) | 28 (2.9%) |
| $10,000 to $14,999 | 86 (4.7%) | 129 (13.2%) |
| $15,000 to $19,999 | 76 (4.2%) | 47 (4.8%) |
| $20,000 to $24,999 | 41 (2.2%) | 90 (9.2%) |
| $25,000 to $34,999 | 191 (10.4%) | 240 (24.6%) |
| $35,000 to $49,999 | 385 (21.0%) | 158 (16.2%) |
| $50,000 to $74,999 | 372 (20.3%) | 163 (16.7%) |
| $75,000 to $99,999 | 227 (12.4%) | 71 (7.3%) |
| $100,000 to $149,999 | 212 (11.6%) | 8 (0.8%) |
| $150,000 or more | 109 (5.9%) | 40 (4.1%) |
| Total | 1,833 (100.0%) | 974 (100.0%) |
Monthly Housing Cost Tiers in Lewistown
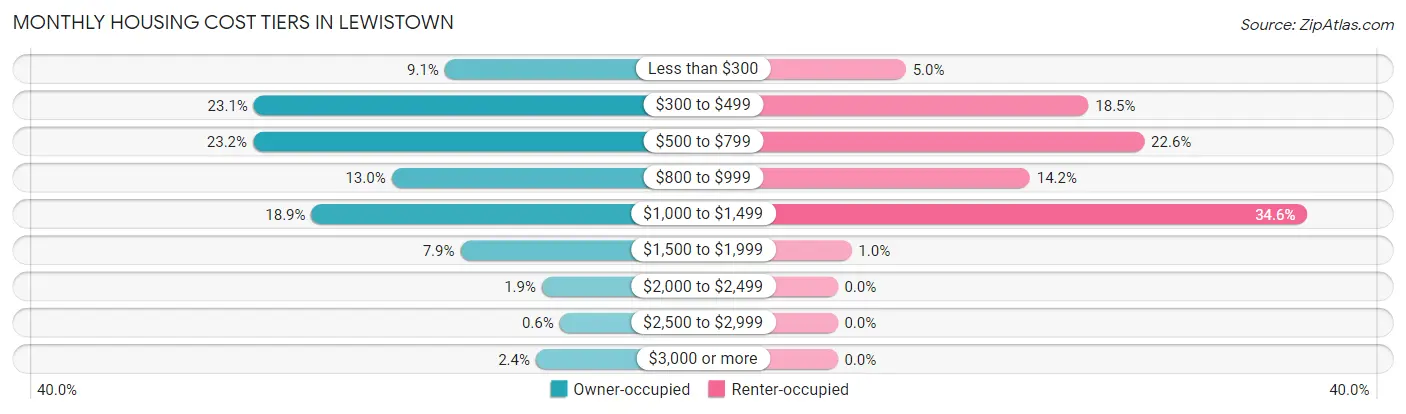
| Monthly Cost | Owner-occupied | Renter-occupied |
| Less than $300 | 166 (9.1%) | 49 (5.0%) |
| $300 to $499 | 424 (23.1%) | 180 (18.5%) |
| $500 to $799 | 425 (23.2%) | 220 (22.6%) |
| $800 to $999 | 238 (13.0%) | 138 (14.2%) |
| $1,000 to $1,499 | 346 (18.9%) | 337 (34.6%) |
| $1,500 to $1,999 | 145 (7.9%) | 10 (1.0%) |
| $2,000 to $2,499 | 35 (1.9%) | 0 (0.0%) |
| $2,500 to $2,999 | 11 (0.6%) | 0 (0.0%) |
| $3,000 or more | 43 (2.4%) | 0 (0.0%) |
| Total | 1,833 (100.0%) | 974 (100.0%) |
Physical Housing Characteristics in Lewistown
Housing Structures in Lewistown
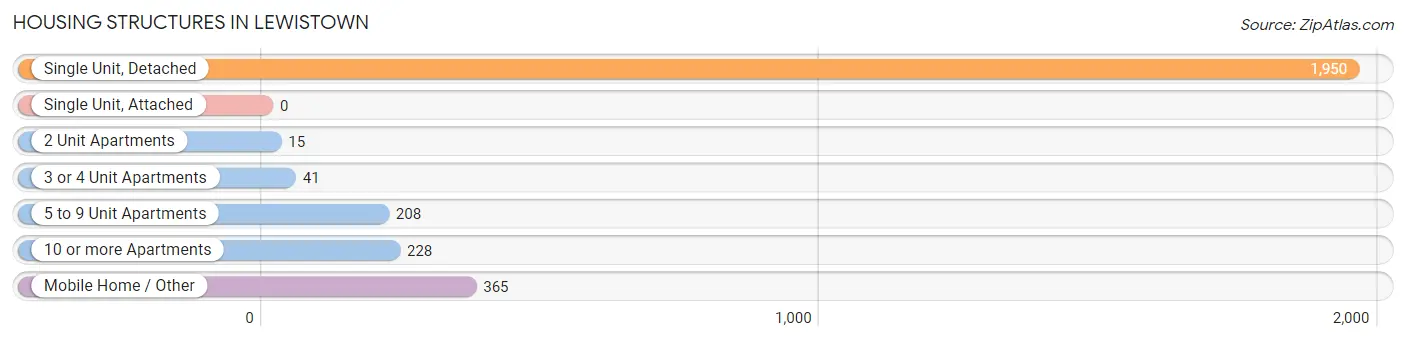
| Structure Type | # Housing Units | % Housing Units |
| Single Unit, Detached | 1,950 | 69.5% |
| Single Unit, Attached | 0 | 0.0% |
| 2 Unit Apartments | 15 | 0.5% |
| 3 or 4 Unit Apartments | 41 | 1.5% |
| 5 to 9 Unit Apartments | 208 | 7.4% |
| 10 or more Apartments | 228 | 8.1% |
| Mobile Home / Other | 365 | 13.0% |
| Total | 2,807 | 100.0% |
Housing Structures by Occupancy in Lewistown
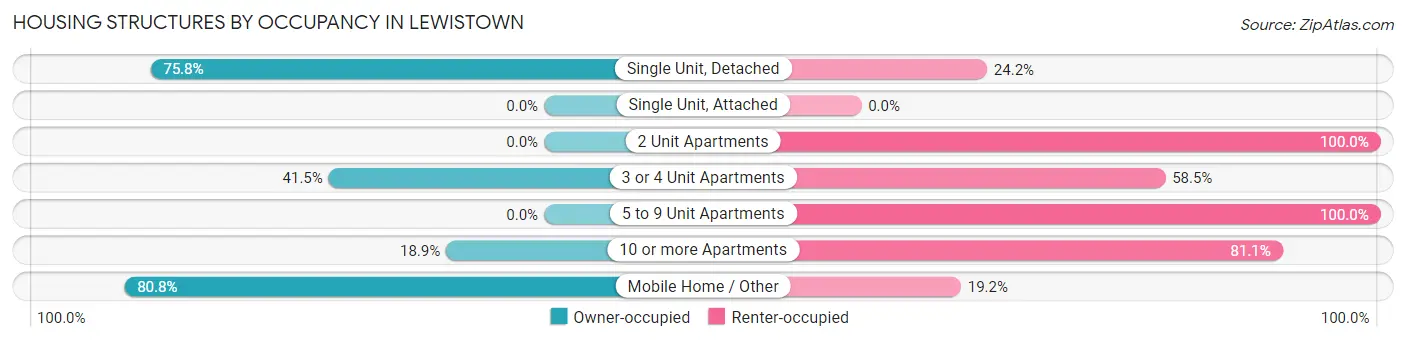
| Structure Type | Owner-occupied | Renter-occupied |
| Single Unit, Detached | 1,478 (75.8%) | 472 (24.2%) |
| Single Unit, Attached | 0 (0.0%) | 0 (0.0%) |
| 2 Unit Apartments | 0 (0.0%) | 15 (100.0%) |
| 3 or 4 Unit Apartments | 17 (41.5%) | 24 (58.5%) |
| 5 to 9 Unit Apartments | 0 (0.0%) | 208 (100.0%) |
| 10 or more Apartments | 43 (18.9%) | 185 (81.1%) |
| Mobile Home / Other | 295 (80.8%) | 70 (19.2%) |
| Total | 1,833 (65.3%) | 974 (34.7%) |
Housing Structures by Number of Rooms in Lewistown
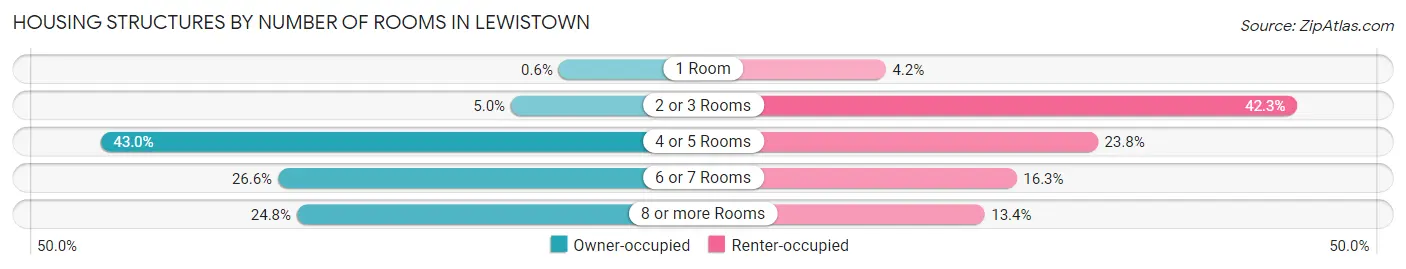
| Number of Rooms | Owner-occupied | Renter-occupied |
| 1 Room | 11 (0.6%) | 41 (4.2%) |
| 2 or 3 Rooms | 92 (5.0%) | 412 (42.3%) |
| 4 or 5 Rooms | 788 (43.0%) | 232 (23.8%) |
| 6 or 7 Rooms | 487 (26.6%) | 159 (16.3%) |
| 8 or more Rooms | 455 (24.8%) | 130 (13.4%) |
| Total | 1,833 (100.0%) | 974 (100.0%) |
Housing Structure by Heating Type in Lewistown
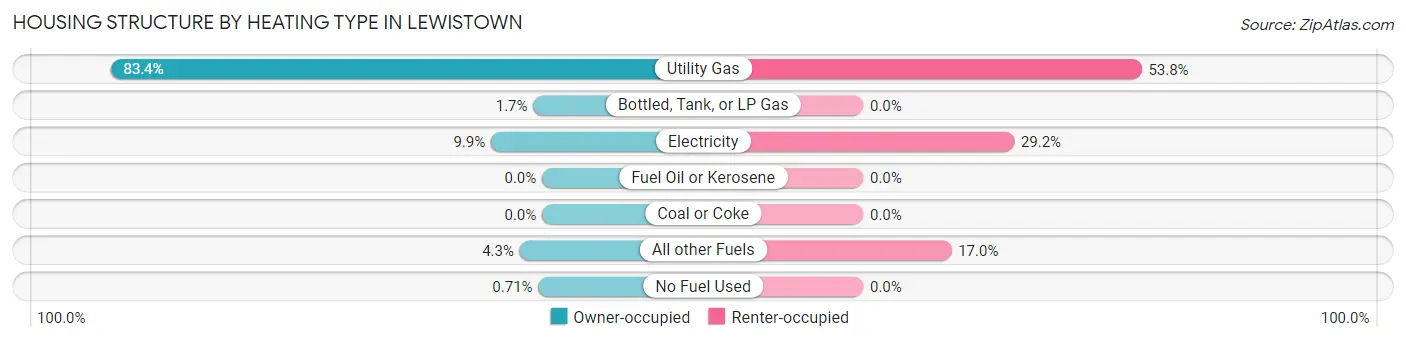
| Heating Type | Owner-occupied | Renter-occupied |
| Utility Gas | 1,529 (83.4%) | 524 (53.8%) |
| Bottled, Tank, or LP Gas | 31 (1.7%) | 0 (0.0%) |
| Electricity | 181 (9.9%) | 284 (29.2%) |
| Fuel Oil or Kerosene | 0 (0.0%) | 0 (0.0%) |
| Coal or Coke | 0 (0.0%) | 0 (0.0%) |
| All other Fuels | 79 (4.3%) | 166 (17.0%) |
| No Fuel Used | 13 (0.7%) | 0 (0.0%) |
| Total | 1,833 (100.0%) | 974 (100.0%) |
Household Vehicle Usage in Lewistown
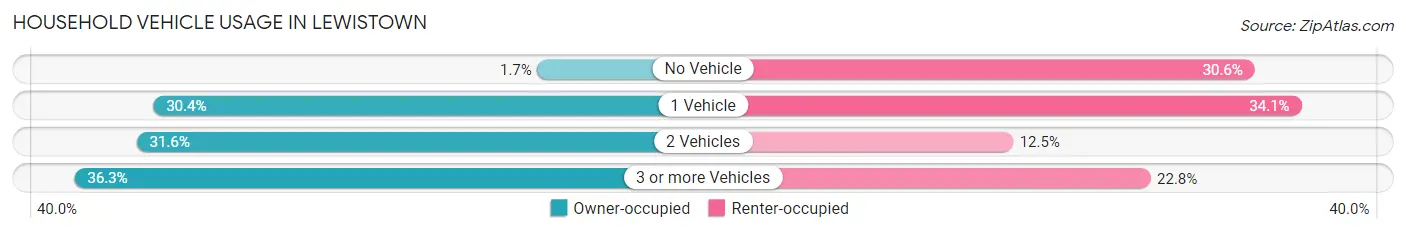
| Vehicles per Household | Owner-occupied | Renter-occupied |
| No Vehicle | 31 (1.7%) | 298 (30.6%) |
| 1 Vehicle | 557 (30.4%) | 332 (34.1%) |
| 2 Vehicles | 580 (31.6%) | 122 (12.5%) |
| 3 or more Vehicles | 665 (36.3%) | 222 (22.8%) |
| Total | 1,833 (100.0%) | 974 (100.0%) |
Real Estate & Mortgages in Lewistown
Real Estate and Mortgage Overview in Lewistown
| Characteristic | Without Mortgage | With Mortgage |
| Housing Units | 971 | 862 |
| Median Property Value | $111,000 | $179,100 |
| Median Household Income | $37,404 | $74 |
| Monthly Housing Costs | $437 | $32 |
| Real Estate Taxes | $1,514 | $13 |
Property Value by Mortgage Status in Lewistown
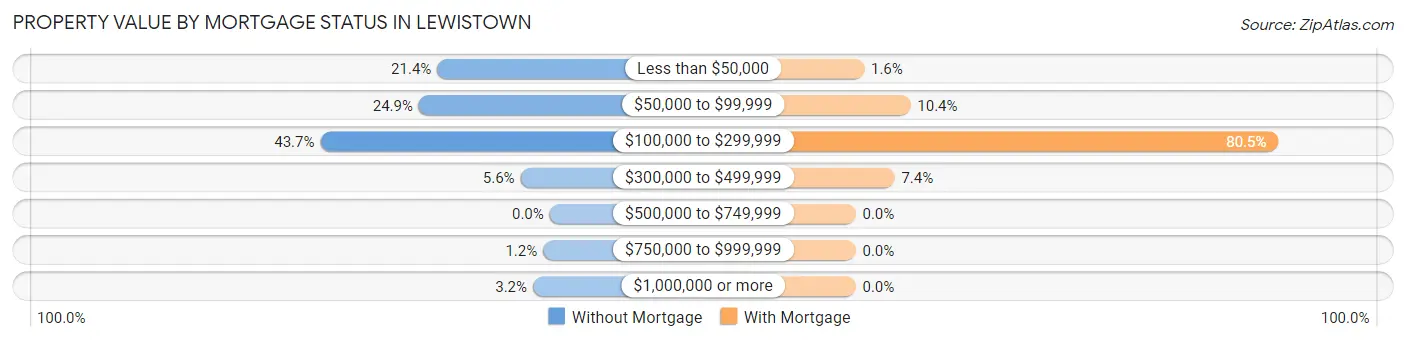
| Property Value | Without Mortgage | With Mortgage |
| Less than $50,000 | 208 (21.4%) | 14 (1.6%) |
| $50,000 to $99,999 | 242 (24.9%) | 90 (10.4%) |
| $100,000 to $299,999 | 424 (43.7%) | 694 (80.5%) |
| $300,000 to $499,999 | 54 (5.6%) | 64 (7.4%) |
| $500,000 to $749,999 | 0 (0.0%) | 0 (0.0%) |
| $750,000 to $999,999 | 12 (1.2%) | 0 (0.0%) |
| $1,000,000 or more | 31 (3.2%) | 0 (0.0%) |
| Total | 971 (100.0%) | 862 (100.0%) |
Household Income by Mortgage Status in Lewistown
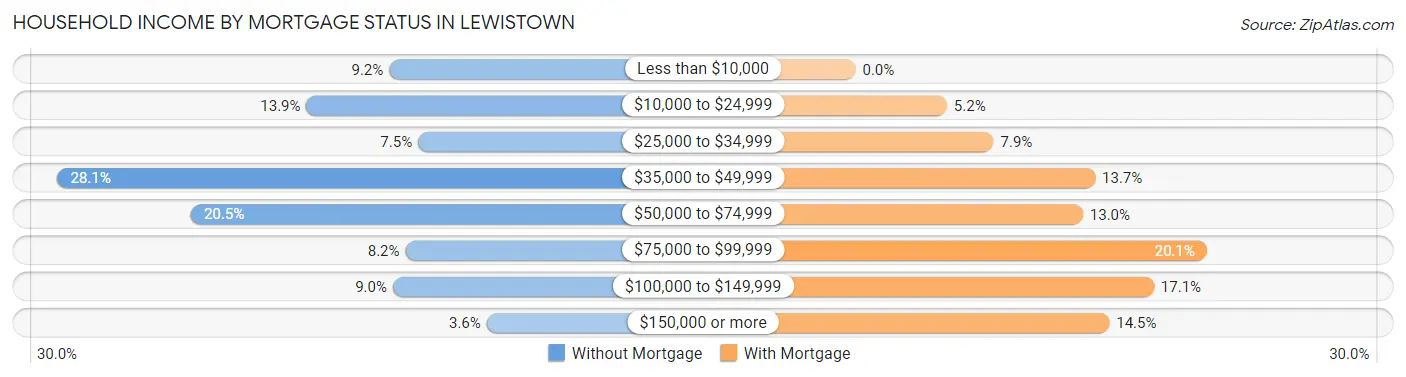
| Household Income | Without Mortgage | With Mortgage |
| Less than $10,000 | 89 (9.2%) | 0 (0.0%) |
| $10,000 to $24,999 | 135 (13.9%) | 45 (5.2%) |
| $25,000 to $34,999 | 73 (7.5%) | 68 (7.9%) |
| $35,000 to $49,999 | 273 (28.1%) | 118 (13.7%) |
| $50,000 to $74,999 | 199 (20.5%) | 112 (13.0%) |
| $75,000 to $99,999 | 80 (8.2%) | 173 (20.1%) |
| $100,000 to $149,999 | 87 (9.0%) | 147 (17.1%) |
| $150,000 or more | 35 (3.6%) | 125 (14.5%) |
| Total | 971 (100.0%) | 862 (100.0%) |
Property Value to Household Income Ratio in Lewistown
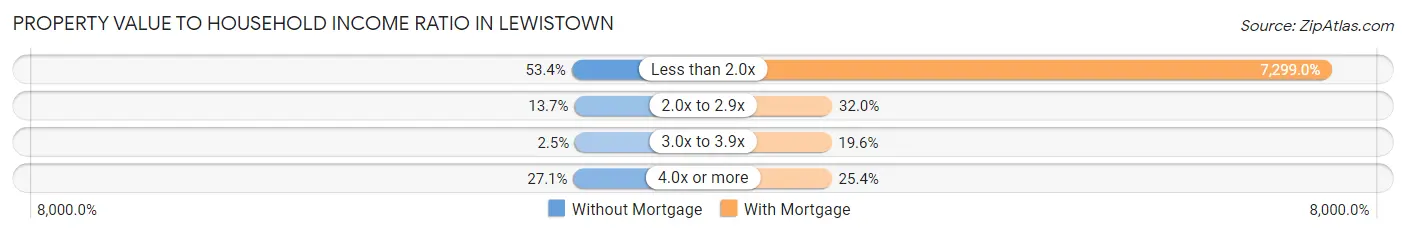
| Value-to-Income Ratio | Without Mortgage | With Mortgage |
| Less than 2.0x | 518 (53.3%) | 62,917 (7,299.0%) |
| 2.0x to 2.9x | 133 (13.7%) | 276 (32.0%) |
| 3.0x to 3.9x | 24 (2.5%) | 169 (19.6%) |
| 4.0x or more | 263 (27.1%) | 219 (25.4%) |
| Total | 971 (100.0%) | 862 (100.0%) |
Real Estate Taxes by Mortgage Status in Lewistown
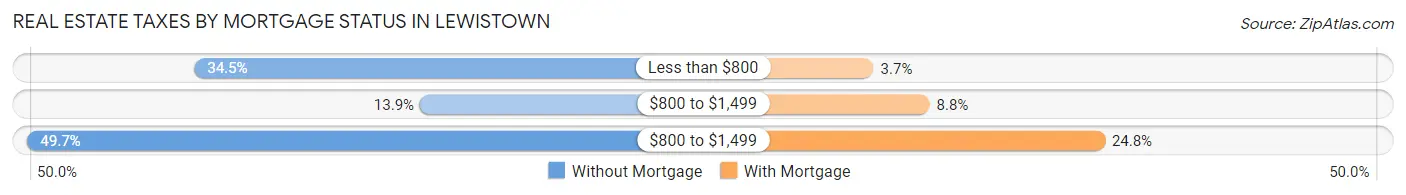
| Property Taxes | Without Mortgage | With Mortgage |
| Less than $800 | 335 (34.5%) | 32 (3.7%) |
| $800 to $1,499 | 135 (13.9%) | 76 (8.8%) |
| $800 to $1,499 | 483 (49.7%) | 214 (24.8%) |
| Total | 971 (100.0%) | 862 (100.0%) |
Health & Disability in Lewistown
Health Insurance Coverage by Age in Lewistown
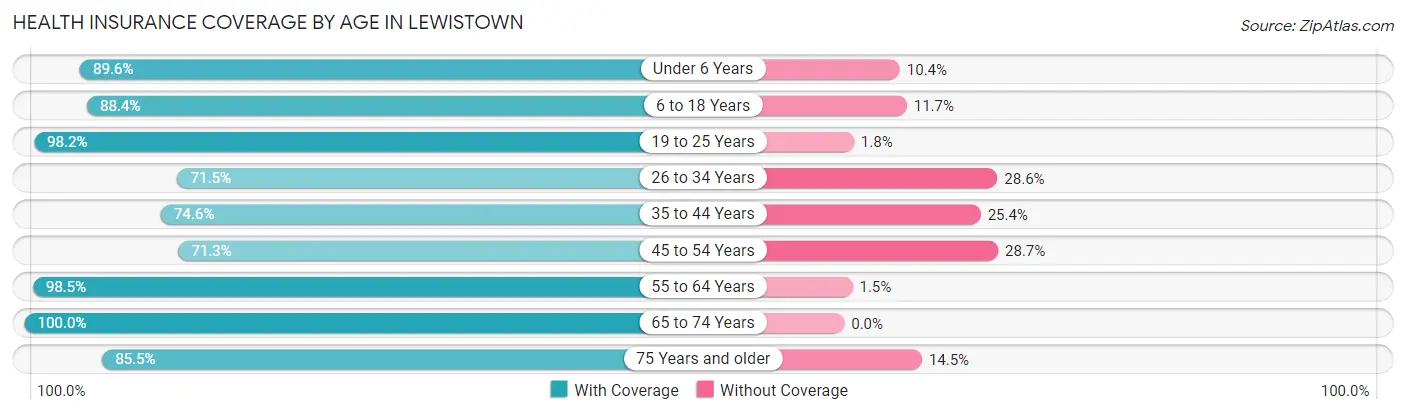
| Age Bracket | With Coverage | Without Coverage |
| Under 6 Years | 251 (89.6%) | 29 (10.4%) |
| 6 to 18 Years | 857 (88.3%) | 113 (11.7%) |
| 19 to 25 Years | 330 (98.2%) | 6 (1.8%) |
| 26 to 34 Years | 438 (71.5%) | 175 (28.5%) |
| 35 to 44 Years | 428 (74.6%) | 146 (25.4%) |
| 45 to 54 Years | 490 (71.3%) | 197 (28.7%) |
| 55 to 64 Years | 830 (98.5%) | 13 (1.5%) |
| 65 to 74 Years | 762 (100.0%) | 0 (0.0%) |
| 75 Years and older | 579 (85.5%) | 98 (14.5%) |
| Total | 4,965 (86.5%) | 777 (13.5%) |
Health Insurance Coverage by Citizenship Status in Lewistown
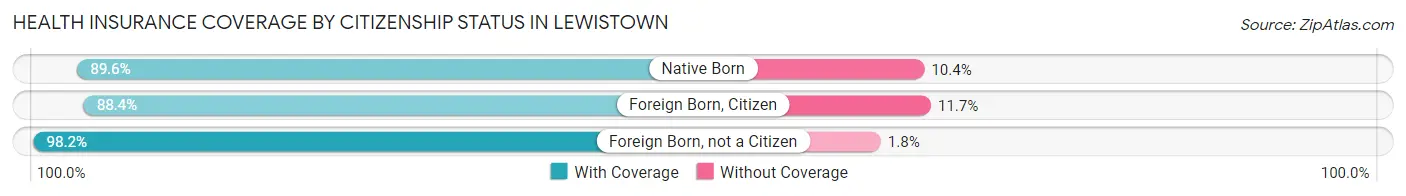
| Citizenship Status | With Coverage | Without Coverage |
| Native Born | 251 (89.6%) | 29 (10.4%) |
| Foreign Born, Citizen | 857 (88.3%) | 113 (11.7%) |
| Foreign Born, not a Citizen | 330 (98.2%) | 6 (1.8%) |
Health Insurance Coverage by Household Income in Lewistown
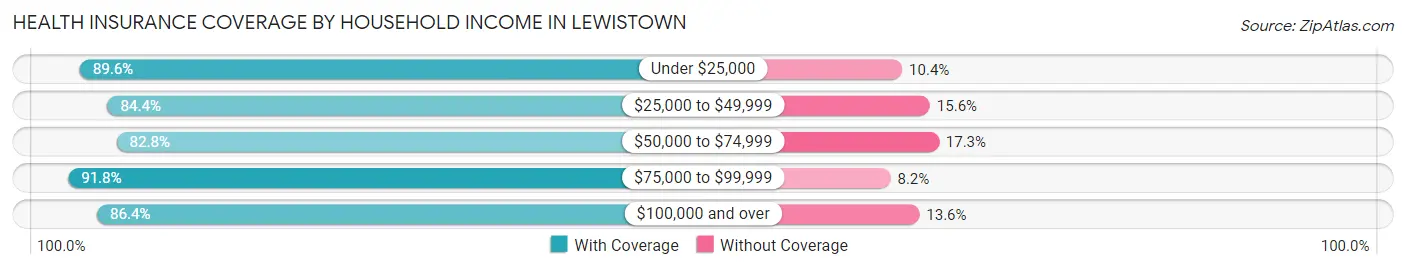
| Household Income | With Coverage | Without Coverage |
| Under $25,000 | 778 (89.6%) | 90 (10.4%) |
| $25,000 to $49,999 | 1,236 (84.4%) | 228 (15.6%) |
| $50,000 to $74,999 | 1,103 (82.8%) | 230 (17.2%) |
| $75,000 to $99,999 | 908 (91.8%) | 81 (8.2%) |
| $100,000 and over | 940 (86.4%) | 148 (13.6%) |
Public vs Private Health Insurance Coverage by Age in Lewistown
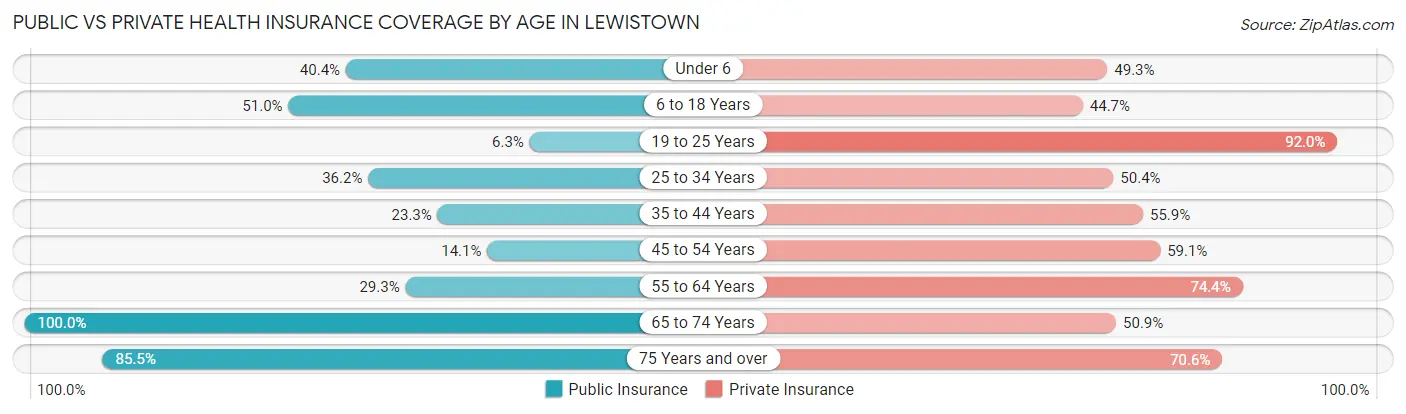
| Age Bracket | Public Insurance | Private Insurance |
| Under 6 | 113 (40.4%) | 138 (49.3%) |
| 6 to 18 Years | 495 (51.0%) | 434 (44.7%) |
| 19 to 25 Years | 21 (6.2%) | 309 (92.0%) |
| 25 to 34 Years | 222 (36.2%) | 309 (50.4%) |
| 35 to 44 Years | 134 (23.3%) | 321 (55.9%) |
| 45 to 54 Years | 97 (14.1%) | 406 (59.1%) |
| 55 to 64 Years | 247 (29.3%) | 627 (74.4%) |
| 65 to 74 Years | 762 (100.0%) | 388 (50.9%) |
| 75 Years and over | 579 (85.5%) | 478 (70.6%) |
| Total | 2,670 (46.5%) | 3,410 (59.4%) |
Disability Status by Sex by Age in Lewistown
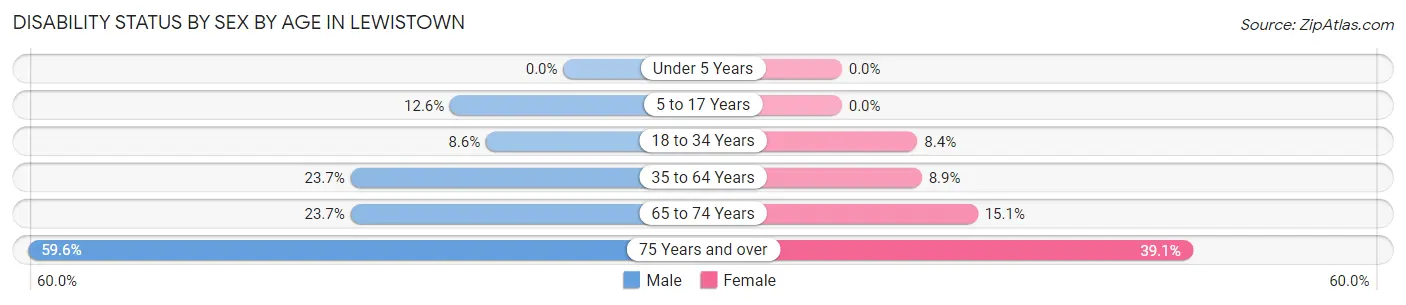
| Age Bracket | Male | Female |
| Under 5 Years | 0 (0.0%) | 0 (0.0%) |
| 5 to 17 Years | 74 (12.6%) | 0 (0.0%) |
| 18 to 34 Years | 42 (8.6%) | 40 (8.4%) |
| 35 to 64 Years | 259 (23.7%) | 90 (8.9%) |
| 65 to 74 Years | 82 (23.7%) | 63 (15.1%) |
| 75 Years and over | 202 (59.6%) | 132 (39.1%) |
Disability Class by Sex by Age in Lewistown
Disability Class: Hearing Difficulty
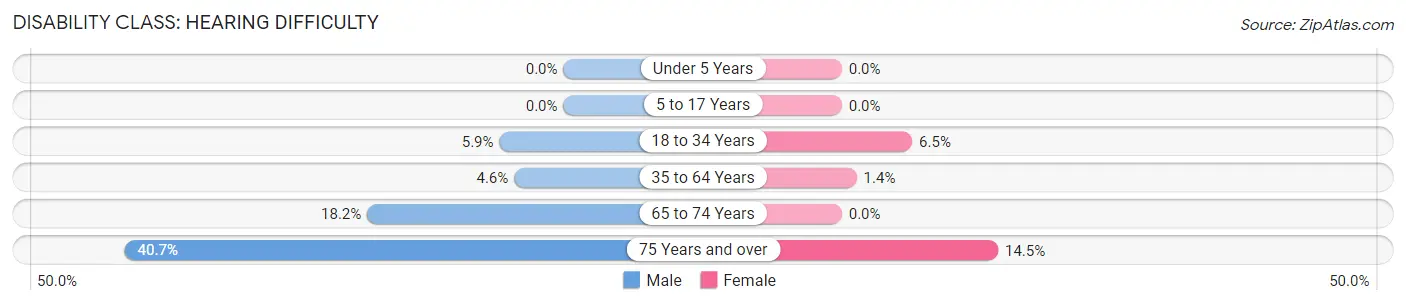
| Age Bracket | Male | Female |
| Under 5 Years | 0 (0.0%) | 0 (0.0%) |
| 5 to 17 Years | 0 (0.0%) | 0 (0.0%) |
| 18 to 34 Years | 29 (5.9%) | 31 (6.5%) |
| 35 to 64 Years | 50 (4.6%) | 14 (1.4%) |
| 65 to 74 Years | 63 (18.2%) | 0 (0.0%) |
| 75 Years and over | 138 (40.7%) | 49 (14.5%) |
Disability Class: Vision Difficulty
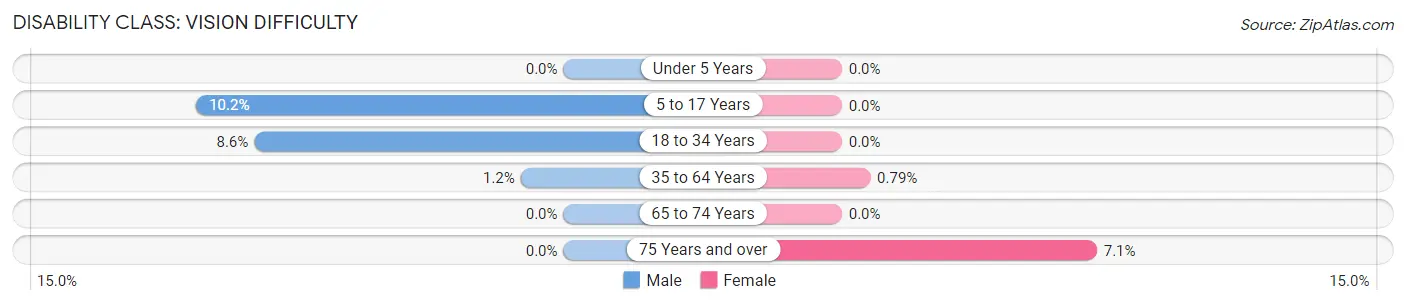
| Age Bracket | Male | Female |
| Under 5 Years | 0 (0.0%) | 0 (0.0%) |
| 5 to 17 Years | 60 (10.2%) | 0 (0.0%) |
| 18 to 34 Years | 42 (8.6%) | 0 (0.0%) |
| 35 to 64 Years | 13 (1.2%) | 8 (0.8%) |
| 65 to 74 Years | 0 (0.0%) | 0 (0.0%) |
| 75 Years and over | 0 (0.0%) | 24 (7.1%) |
Disability Class: Cognitive Difficulty
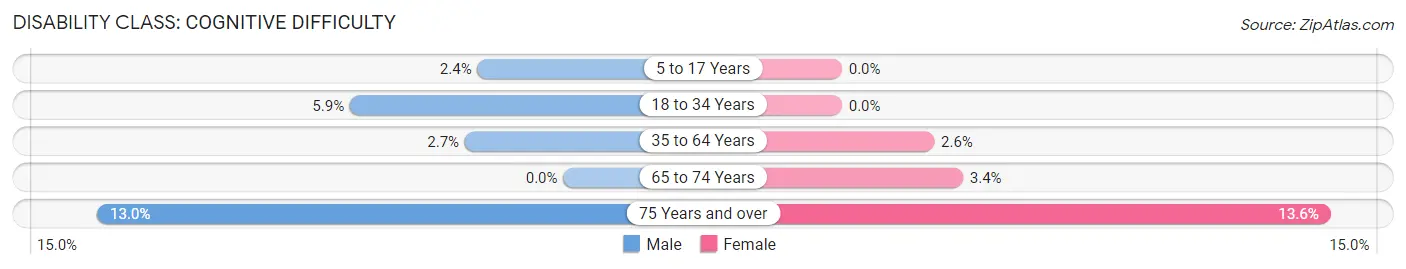
| Age Bracket | Male | Female |
| 5 to 17 Years | 14 (2.4%) | 0 (0.0%) |
| 18 to 34 Years | 29 (5.9%) | 0 (0.0%) |
| 35 to 64 Years | 30 (2.7%) | 26 (2.6%) |
| 65 to 74 Years | 0 (0.0%) | 14 (3.4%) |
| 75 Years and over | 44 (13.0%) | 46 (13.6%) |
Disability Class: Ambulatory Difficulty
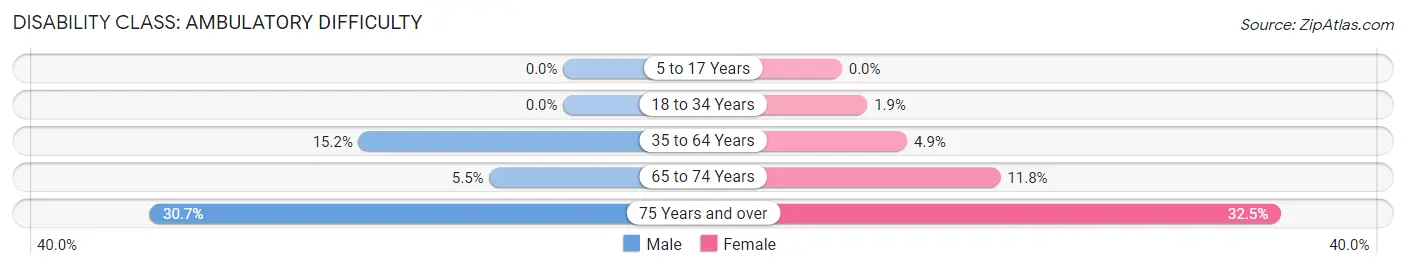
| Age Bracket | Male | Female |
| 5 to 17 Years | 0 (0.0%) | 0 (0.0%) |
| 18 to 34 Years | 0 (0.0%) | 9 (1.9%) |
| 35 to 64 Years | 166 (15.2%) | 49 (4.9%) |
| 65 to 74 Years | 19 (5.5%) | 49 (11.8%) |
| 75 Years and over | 104 (30.7%) | 110 (32.5%) |
Disability Class: Self-Care Difficulty
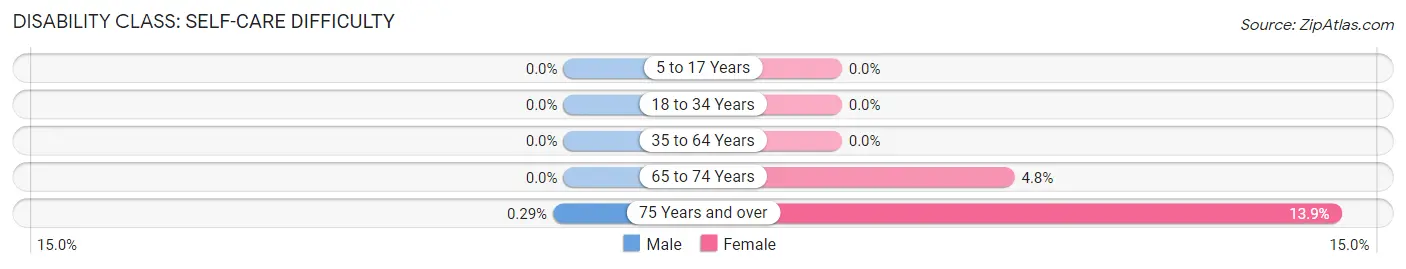
| Age Bracket | Male | Female |
| 5 to 17 Years | 0 (0.0%) | 0 (0.0%) |
| 18 to 34 Years | 0 (0.0%) | 0 (0.0%) |
| 35 to 64 Years | 0 (0.0%) | 0 (0.0%) |
| 65 to 74 Years | 0 (0.0%) | 20 (4.8%) |
| 75 Years and over | 1 (0.3%) | 47 (13.9%) |
Technology Access in Lewistown
Computing Device Access in Lewistown
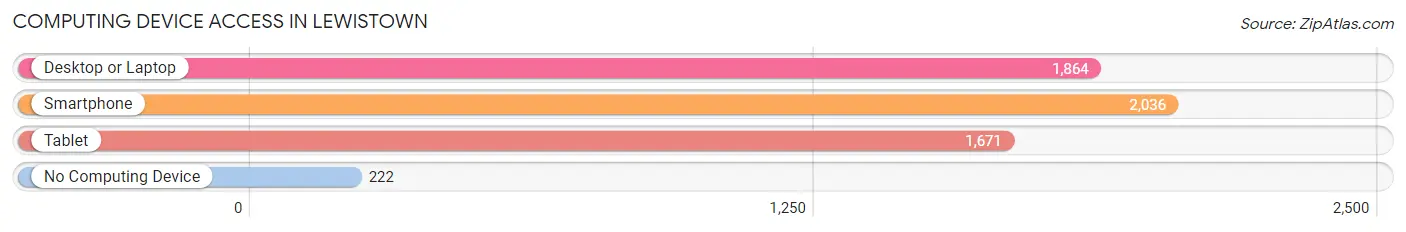
| Device Type | # Households | % Households |
| Desktop or Laptop | 1,864 | 66.4% |
| Smartphone | 2,036 | 72.5% |
| Tablet | 1,671 | 59.5% |
| No Computing Device | 222 | 7.9% |
| Total | 2,807 | 100.0% |
Internet Access in Lewistown
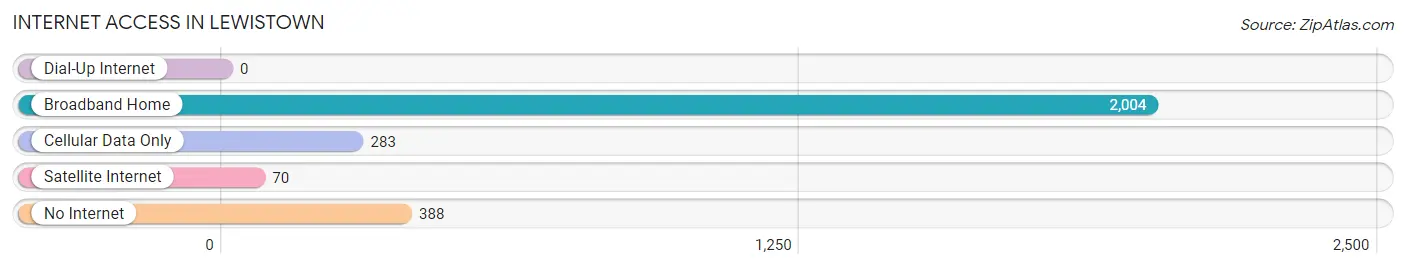
| Internet Type | # Households | % Households |
| Dial-Up Internet | 0 | 0.0% |
| Broadband Home | 2,004 | 71.4% |
| Cellular Data Only | 283 | 10.1% |
| Satellite Internet | 70 | 2.5% |
| No Internet | 388 | 13.8% |
| Total | 2,807 | 100.0% |
Lewistown Summary
Lewistown, Montana is a small city located in the central part of the state, in Fergus County. It is the county seat and the largest city in the county, with a population of 6,845 as of the 2010 census. The city is situated in the foothills of the Rocky Mountains, and is surrounded by rolling hills and prairies.
History
The area that is now Lewistown was first inhabited by the Piegan Blackfeet Native American tribe. The first white settlers arrived in the area in the late 1800s, and the city was officially founded in 1882. The city was named after Captain William Lewis, who was a leader of the first group of settlers.
Lewistown quickly grew into a bustling town, and by the early 1900s, it had become the largest city in Fergus County. The city was a major hub for the agricultural industry, and it was also home to several businesses, including a flour mill, a brewery, and a brickyard.
In the early 1900s, Lewistown was also a major stop on the Great Northern Railway. The railway brought in many new settlers, and the city continued to grow. By the 1950s, Lewistown had become a major center for the oil and gas industry, and it remains an important hub for the industry today.
Geography
Lewistown is located in the central part of Montana, in Fergus County. It is situated in the foothills of the Rocky Mountains, and is surrounded by rolling hills and prairies. The city is located at an elevation of 3,717 feet, and has a total area of 4.2 square miles.
The climate in Lewistown is semi-arid, with hot summers and cold winters. The average high temperature in the summer is 85 degrees Fahrenheit, and the average low temperature in the winter is 11 degrees Fahrenheit. The city receives an average of 16 inches of precipitation per year.
Economy
The economy of Lewistown is largely based on agriculture and the oil and gas industry. The city is home to several large agricultural businesses, including a grain elevator, a feed mill, and a fertilizer plant. The oil and gas industry is also a major employer in the city, and there are several oil and gas companies located in the area.
In addition to these industries, Lewistown is also home to several retail stores, restaurants, and other businesses. The city is also home to a hospital, a community college, and a branch of the Montana State University system.
Demographics
As of the 2010 census, the population of Lewistown was 6,845. The racial makeup of the city was 94.3% White, 0.7% African American, 0.7% Native American, 0.4% Asian, 0.1% Pacific Islander, 1.7% from other races, and 2.1% from two or more races. Hispanic or Latino of any race were 4.2% of the population.
The median household income in Lewistown was $37,917, and the median family income was $45,938. The per capita income was $20,845. About 11.3% of the population was below the poverty line.
Lewistown is a small city with a rich history and a diverse economy. The city is home to several large agricultural businesses, as well as several oil and gas companies. The city also has a diverse population, with a mix of different racial and ethnic backgrounds. Lewistown is a great place to live and work, and it is a great place to visit.
Common Questions
What is Per Capita Income in Lewistown?
Per Capita income in Lewistown is $27,557.
What is the Median Family Income in Lewistown?
Median Family Income in Lewistown is $64,801.
What is the Median Household income in Lewistown?
Median Household Income in Lewistown is $40,705.
What is Income or Wage Gap in Lewistown?
Income or Wage Gap in Lewistown is 30.2%.
Women in Lewistown earn 69.8 cents for every dollar earned by a man.
What is Family Income Deficit in Lewistown?
Family Income Deficit in Lewistown is $20,838.
Families that are below poverty line in Lewistown earn $20,838 less on average than the poverty threshold level.
What is Inequality or Gini Index in Lewistown?
Inequality or Gini Index in Lewistown is 0.42.
What is the Total Population of Lewistown?
Total Population of Lewistown is 5,988.
What is the Total Male Population of Lewistown?
Total Male Population of Lewistown is 3,164.
What is the Total Female Population of Lewistown?
Total Female Population of Lewistown is 2,824.
What is the Ratio of Males per 100 Females in Lewistown?
There are 112.04 Males per 100 Females in Lewistown.
What is the Ratio of Females per 100 Males in Lewistown?
There are 89.25 Females per 100 Males in Lewistown.
What is the Median Population Age in Lewistown?
Median Population Age in Lewistown is 48.0 Years.
What is the Average Family Size in Lewistown
Average Family Size in Lewistown is 2.9 People.
What is the Average Household Size in Lewistown
Average Household Size in Lewistown is 2.0 People.
How Large is the Labor Force in Lewistown?
There are 2,754 People in the Labor Forcein in Lewistown.
What is the Percentage of People in the Labor Force in Lewistown?
56.5% of People are in the Labor Force in Lewistown.
What is the Unemployment Rate in Lewistown?
Unemployment Rate in Lewistown is 5.7%.