Black Eagle, MT Map & Demographics
Black Eagle Map
Black Eagle Overview
$25,410
PER CAPITA INCOME
$35,278
AVG FAMILY INCOME
0.41
INEQUALITY / GINI INDEX
672
TOTAL POPULATION
432
MALE POPULATION
240
FEMALE POPULATION
180.00
MALES / 100 FEMALES
55.56
FEMALES / 100 MALES
45.8
MEDIAN AGE
2.7
AVG FAMILY SIZE
2.1
AVG HOUSEHOLD SIZE
293
LABOR FORCE [ PEOPLE ]
52.4%
PERCENT IN LABOR FORCE
Black Eagle Zip Codes
Black Eagle Area Codes
Income in Black Eagle
Income Overview in Black Eagle
| Characteristic | Number | Measure |
| Per Capita Income | 672 | $25,410 |
| Median Family Income | 184 | $35,278 |
| Mean Family Income | 184 | $54,021 |
| Median Household Income | 327 | $0 |
| Mean Household Income | 327 | $52,085 |
| Income Deficit | 184 | $0 |
| Wage / Income Gap (%) | 672 | 0.00% |
| Wage / Income Gap ($) | 672 | 100.00¢ per $1 |
| Gini / Inequality Index | 672 | 0.41 |
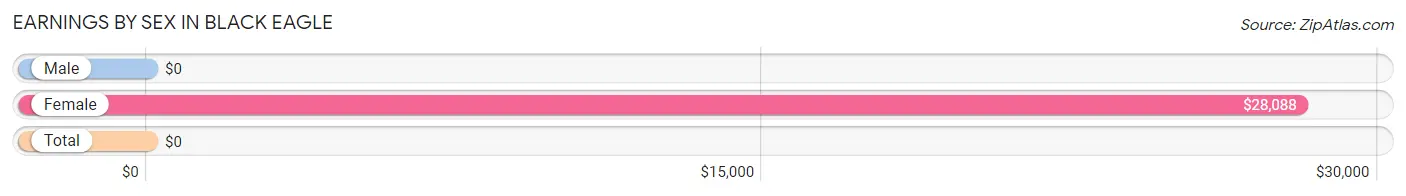
Earnings by Sex in Black Eagle
| Sex | Number | Average Earnings |
| Male | 197 (61.0%) | $0 |
| Female | 126 (39.0%) | $28,088 |
| Total | 323 (100.0%) | $0 |
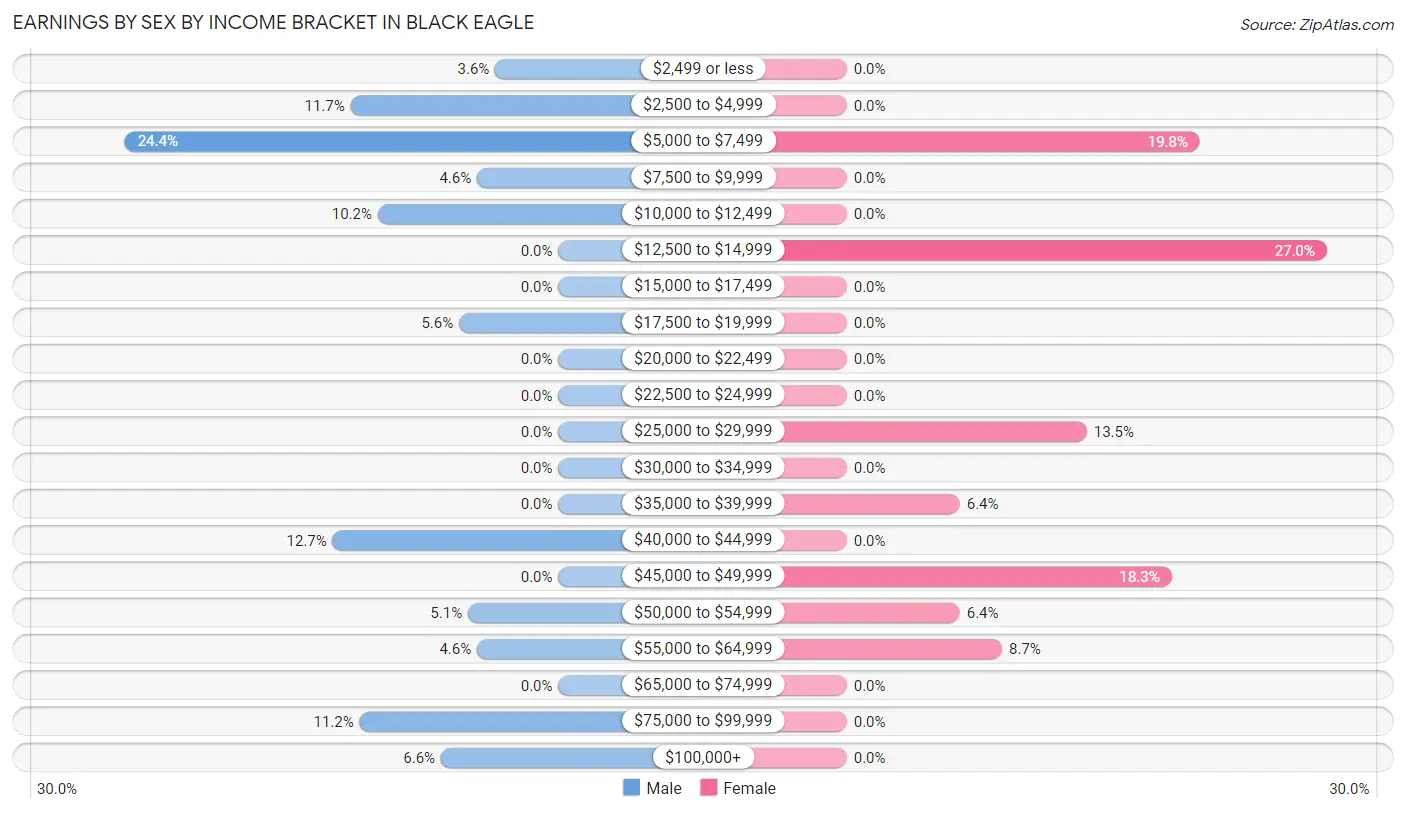
Earnings by Sex by Income Bracket in Black Eagle
The most common earnings brackets in Black Eagle are $5,000 to $7,499 for men (48 | 24.4%) and $12,500 to $14,999 for women (34 | 27.0%).
| Income | Male | Female |
| $2,499 or less | 7 (3.5%) | 0 (0.0%) |
| $2,500 to $4,999 | 23 (11.7%) | 0 (0.0%) |
| $5,000 to $7,499 | 48 (24.4%) | 25 (19.8%) |
| $7,500 to $9,999 | 9 (4.6%) | 0 (0.0%) |
| $10,000 to $12,499 | 20 (10.2%) | 0 (0.0%) |
| $12,500 to $14,999 | 0 (0.0%) | 34 (27.0%) |
| $15,000 to $17,499 | 0 (0.0%) | 0 (0.0%) |
| $17,500 to $19,999 | 11 (5.6%) | 0 (0.0%) |
| $20,000 to $22,499 | 0 (0.0%) | 0 (0.0%) |
| $22,500 to $24,999 | 0 (0.0%) | 0 (0.0%) |
| $25,000 to $29,999 | 0 (0.0%) | 17 (13.5%) |
| $30,000 to $34,999 | 0 (0.0%) | 0 (0.0%) |
| $35,000 to $39,999 | 0 (0.0%) | 8 (6.4%) |
| $40,000 to $44,999 | 25 (12.7%) | 0 (0.0%) |
| $45,000 to $49,999 | 0 (0.0%) | 23 (18.2%) |
| $50,000 to $54,999 | 10 (5.1%) | 8 (6.4%) |
| $55,000 to $64,999 | 9 (4.6%) | 11 (8.7%) |
| $65,000 to $74,999 | 0 (0.0%) | 0 (0.0%) |
| $75,000 to $99,999 | 22 (11.2%) | 0 (0.0%) |
| $100,000+ | 13 (6.6%) | 0 (0.0%) |
| Total | 197 (100.0%) | 126 (100.0%) |
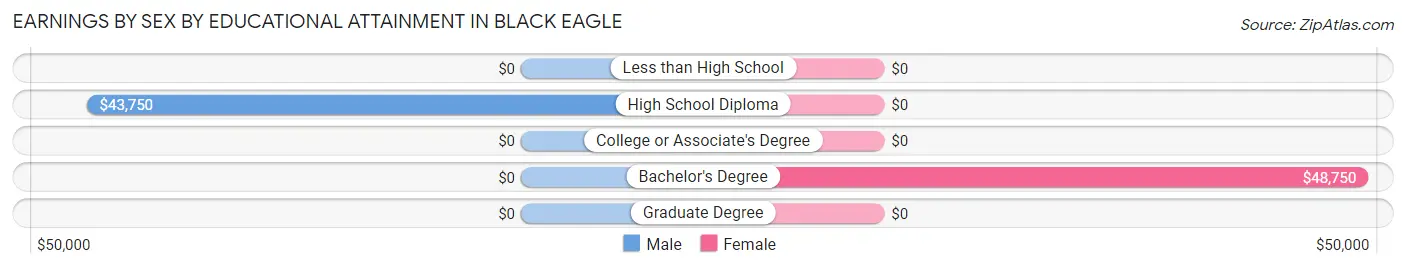
Earnings by Sex by Educational Attainment in Black Eagle
| Educational Attainment | Male Income | Female Income |
| Less than High School | - | - |
| High School Diploma | $43,750 | $0 |
| College or Associate's Degree | - | - |
| Bachelor's Degree | - | - |
| Graduate Degree | - | - |
| Total | - | - |
Family Income in Black Eagle
Family Income Brackets in Black Eagle
According to the Black Eagle family income data, there are 52 families falling into the $25,000 to $34,999 income range, which is the most common income bracket and makes up 28.3% of all families.
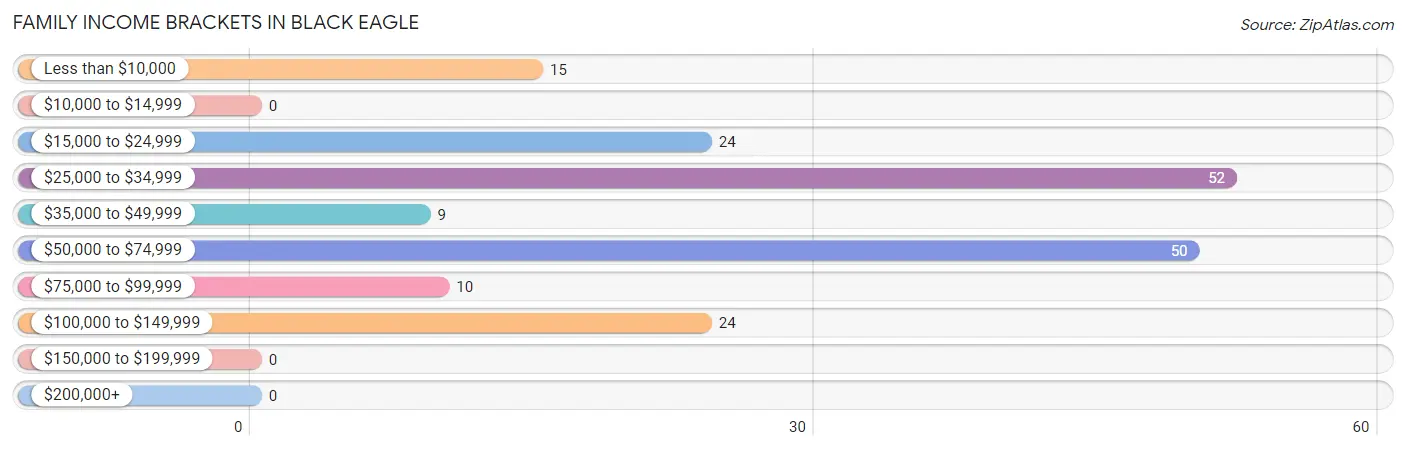
| Income Bracket | # Families | % Families |
| Less than $10,000 | 15 | 8.2% |
| $10,000 to $14,999 | 0 | 0.0% |
| $15,000 to $24,999 | 24 | 13.0% |
| $25,000 to $34,999 | 52 | 28.3% |
| $35,000 to $49,999 | 9 | 4.9% |
| $50,000 to $74,999 | 50 | 27.2% |
| $75,000 to $99,999 | 10 | 5.4% |
| $100,000 to $149,999 | 24 | 13.0% |
| $150,000 to $199,999 | 0 | 0.0% |
| $200,000+ | 0 | 0.0% |
Family Income by Famaliy Size in Black Eagle
2-person families (119 | 64.7%) account for the highest median family income in Black Eagle with $53,125 per family, while 2-person families (119 | 64.7%) have the highest median income of $26,562 per family member.
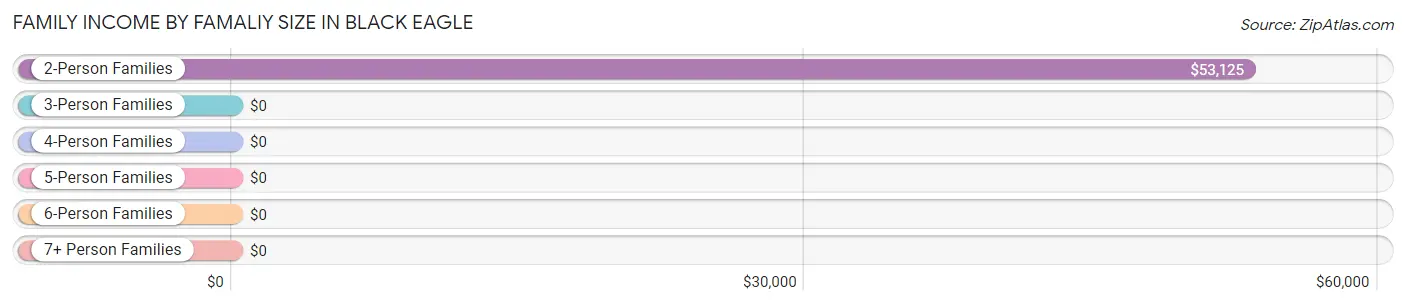
| Income Bracket | # Families | Median Income |
| 2-Person Families | 119 (64.7%) | $53,125 |
| 3-Person Families | 23 (12.5%) | $0 |
| 4-Person Families | 24 (13.0%) | $0 |
| 5-Person Families | 18 (9.8%) | $0 |
| 6-Person Families | 0 (0.0%) | $0 |
| 7+ Person Families | 0 (0.0%) | $0 |
| Total | 184 (100.0%) | $35,278 |
Family Income by Number of Earners in Black Eagle
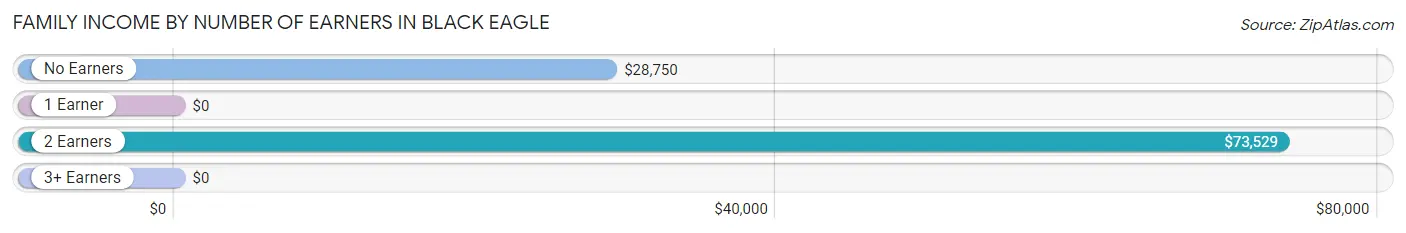
| Number of Earners | # Families | Median Income |
| No Earners | 81 (44.0%) | $28,750 |
| 1 Earner | 15 (8.2%) | $0 |
| 2 Earners | 88 (47.8%) | $73,529 |
| 3+ Earners | 0 (0.0%) | $0 |
| Total | 184 (100.0%) | $35,278 |
Household Income in Black Eagle
Household Income Brackets in Black Eagle
With 99 households falling in the category, the $50,000 to $74,999 income range is the most frequent in Black Eagle, accounting for 30.3% of all households.
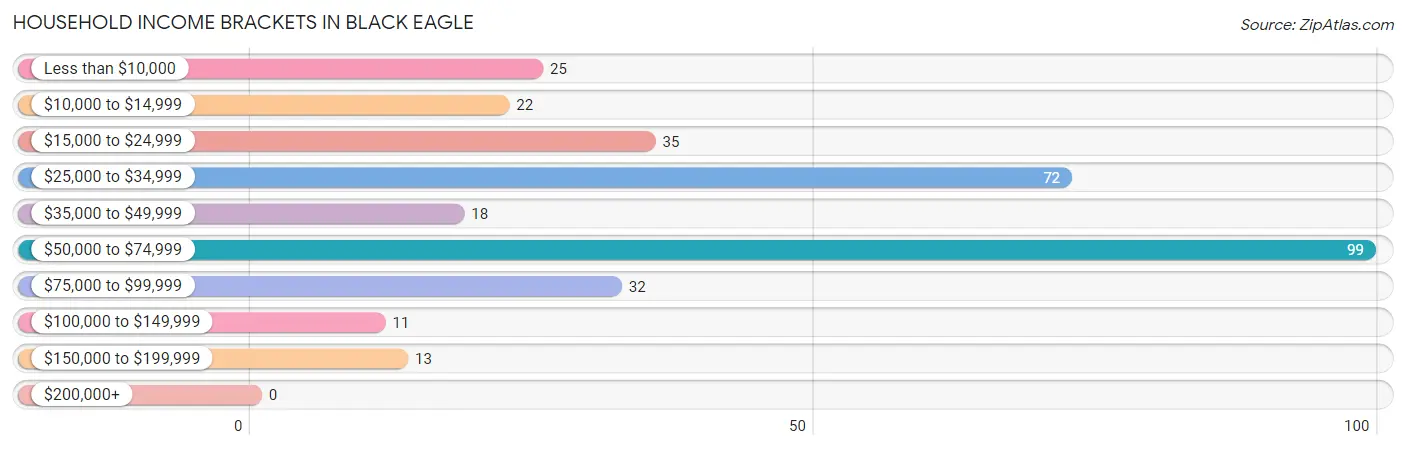
| Income Bracket | # Households | % Households |
| Less than $10,000 | 25 | 7.6% |
| $10,000 to $14,999 | 22 | 6.7% |
| $15,000 to $24,999 | 35 | 10.7% |
| $25,000 to $34,999 | 72 | 22.0% |
| $35,000 to $49,999 | 18 | 5.5% |
| $50,000 to $74,999 | 99 | 30.3% |
| $75,000 to $99,999 | 32 | 9.8% |
| $100,000 to $149,999 | 11 | 3.4% |
| $150,000 to $199,999 | 13 | 4.0% |
| $200,000+ | 0 | 0.0% |
Household Income by Householder Age in Black Eagle
The median household income in Black Eagle is $0, with the highest median household income of $53,421 found in the 25 to 44 years age bracket for the primary householder. A total of 102 households (31.2%) fall into this category.
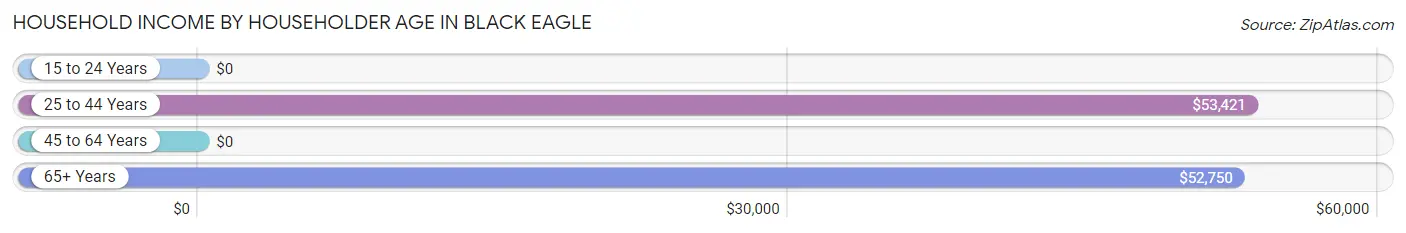
| Income Bracket | # Households | Median Income |
| 15 to 24 Years | 0 (0.0%) | $0 |
| 25 to 44 Years | 102 (31.2%) | $53,421 |
| 45 to 64 Years | 103 (31.5%) | $0 |
| 65+ Years | 122 (37.3%) | $52,750 |
| Total | 327 (100.0%) | $0 |
Poverty in Black Eagle
Income Below Poverty by Sex and Age in Black Eagle
With 34.7% poverty level for males and 34.6% for females among the residents of Black Eagle, under 5 year old males and 25 to 34 year old females are the most vulnerable to poverty, with 19 males (100.0%) and 15 females (100.0%) in their respective age groups living below the poverty level.
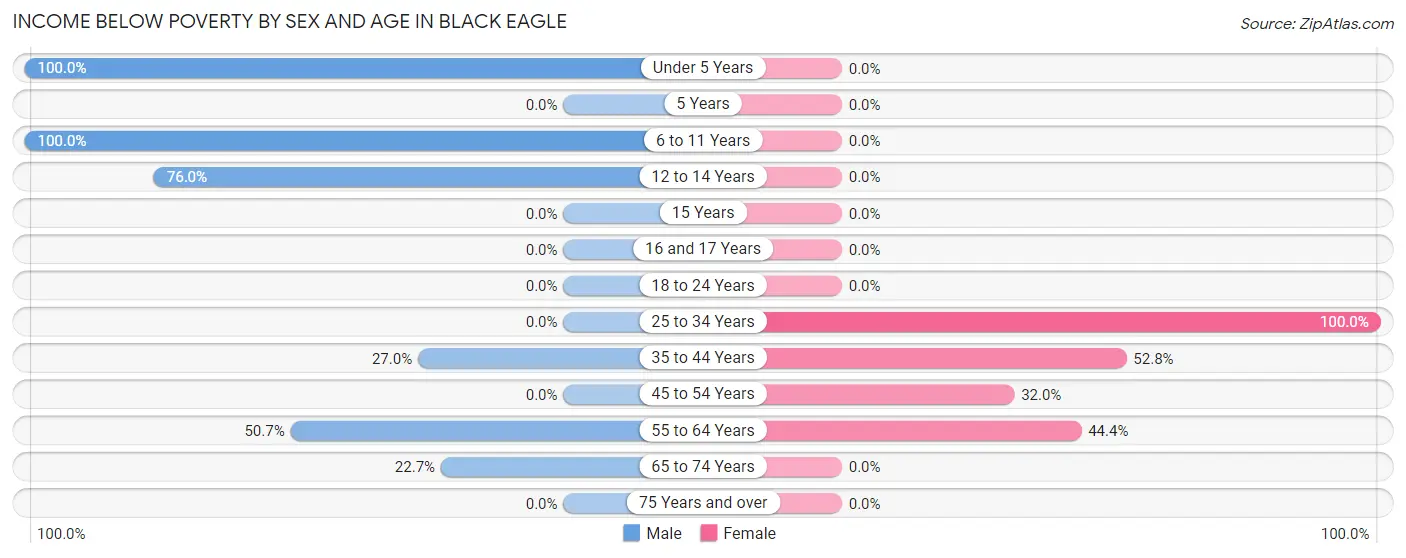
| Age Bracket | Male | Female |
| Under 5 Years | 19 (100.0%) | 0 (0.0%) |
| 5 Years | 0 (0.0%) | 0 (0.0%) |
| 6 to 11 Years | 27 (100.0%) | 0 (0.0%) |
| 12 to 14 Years | 38 (76.0%) | 0 (0.0%) |
| 15 Years | 0 (0.0%) | 0 (0.0%) |
| 16 and 17 Years | 0 (0.0%) | 0 (0.0%) |
| 18 to 24 Years | 0 (0.0%) | 0 (0.0%) |
| 25 to 34 Years | 0 (0.0%) | 15 (100.0%) |
| 35 to 44 Years | 17 (27.0%) | 28 (52.8%) |
| 45 to 54 Years | 0 (0.0%) | 16 (32.0%) |
| 55 to 64 Years | 39 (50.6%) | 24 (44.4%) |
| 65 to 74 Years | 10 (22.7%) | 0 (0.0%) |
| 75 Years and over | 0 (0.0%) | 0 (0.0%) |
| Total | 150 (34.7%) | 83 (34.6%) |
Income Above Poverty by Sex and Age in Black Eagle
According to the poverty statistics in Black Eagle, males aged 16 and 17 years and females aged 6 to 11 years are the age groups that are most secure financially, with 100.0% of males and 100.0% of females in these age groups living above the poverty line.
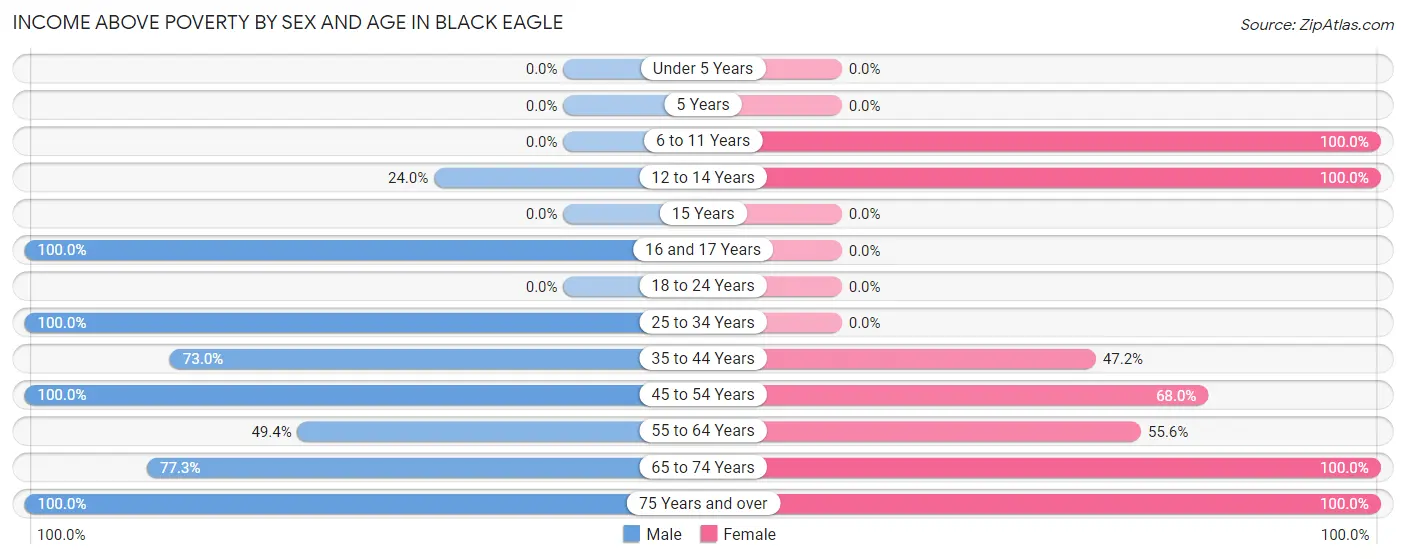
| Age Bracket | Male | Female |
| Under 5 Years | 0 (0.0%) | 0 (0.0%) |
| 5 Years | 0 (0.0%) | 0 (0.0%) |
| 6 to 11 Years | 0 (0.0%) | 9 (100.0%) |
| 12 to 14 Years | 12 (24.0%) | 8 (100.0%) |
| 15 Years | 0 (0.0%) | 0 (0.0%) |
| 16 and 17 Years | 13 (100.0%) | 0 (0.0%) |
| 18 to 24 Years | 0 (0.0%) | 0 (0.0%) |
| 25 to 34 Years | 58 (100.0%) | 0 (0.0%) |
| 35 to 44 Years | 46 (73.0%) | 25 (47.2%) |
| 45 to 54 Years | 26 (100.0%) | 34 (68.0%) |
| 55 to 64 Years | 38 (49.3%) | 30 (55.6%) |
| 65 to 74 Years | 34 (77.3%) | 33 (100.0%) |
| 75 Years and over | 55 (100.0%) | 18 (100.0%) |
| Total | 282 (65.3%) | 157 (65.4%) |
Income Below Poverty Among Married-Couple Families in Black Eagle
The poverty statistics for married-couple families in Black Eagle show that 39.3% or 42 of the total 107 families live below the poverty line. Families with 3 or 4 children have the highest poverty rate of 100.0%, comprising of 18 families. On the other hand, families with 1 or 2 children have the lowest poverty rate of 0.0%, which includes 0 families.
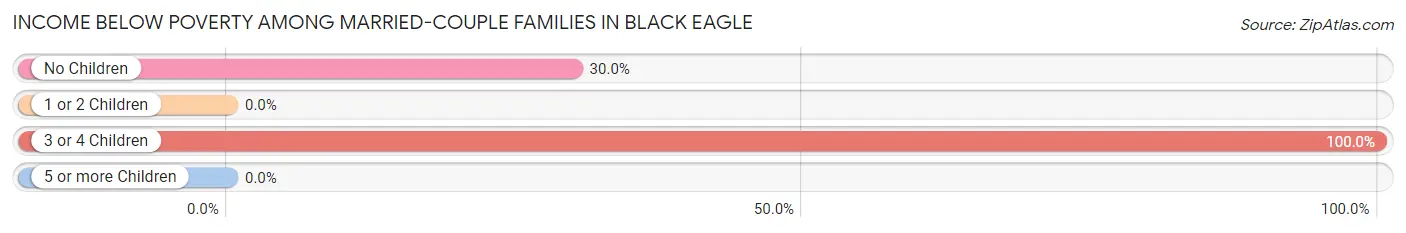
| Children | Above Poverty | Below Poverty |
| No Children | 56 (70.0%) | 24 (30.0%) |
| 1 or 2 Children | 9 (100.0%) | 0 (0.0%) |
| 3 or 4 Children | 0 (0.0%) | 18 (100.0%) |
| 5 or more Children | 0 (0.0%) | 0 (0.0%) |
| Total | 65 (60.8%) | 42 (39.3%) |
Income Below Poverty Among Single-Parent Households in Black Eagle
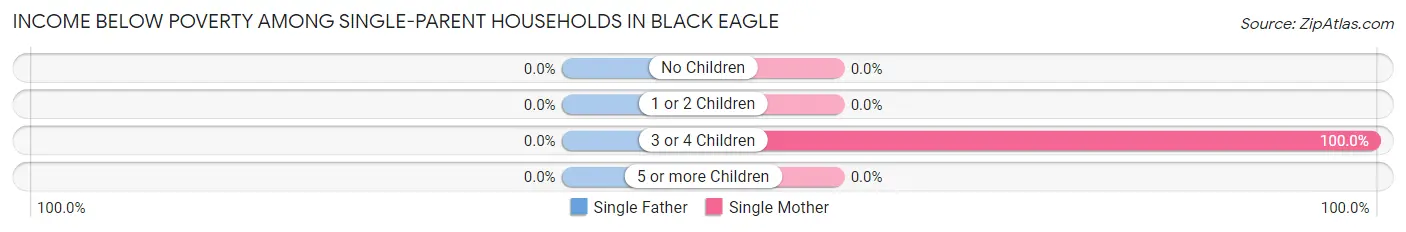
| Children | Single Father | Single Mother |
| No Children | 0 (0.0%) | 0 (0.0%) |
| 1 or 2 Children | 0 (0.0%) | 0 (0.0%) |
| 3 or 4 Children | 0 (0.0%) | 15 (100.0%) |
| 5 or more Children | 0 (0.0%) | 0 (0.0%) |
| Total | 0 (0.0%) | 15 (27.3%) |
Income Below Poverty Among Married-Couple vs Single-Parent Households in Black Eagle
The poverty data for Black Eagle shows that 42 of the married-couple family households (39.3%) and 15 of the single-parent households (19.5%) are living below the poverty level. Within the married-couple family households, those with 3 or 4 children have the highest poverty rate, with 18 households (100.0%) falling below the poverty line. Among the single-parent households, those with 3 or 4 children have the highest poverty rate, with 15 household (100.0%) living below poverty.
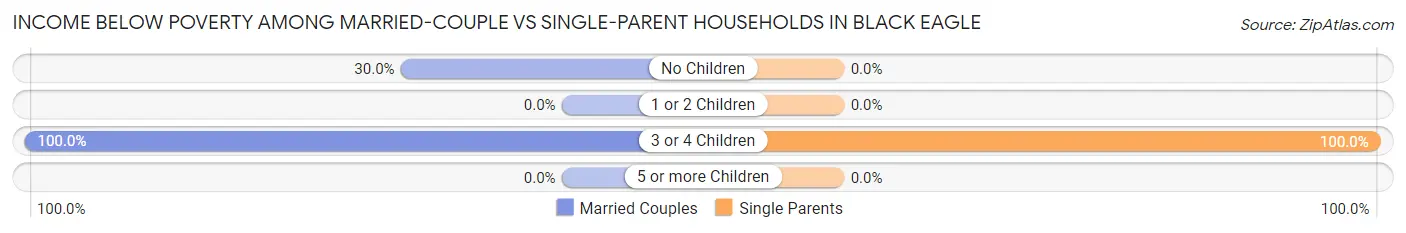
| Children | Married-Couple Families | Single-Parent Households |
| No Children | 24 (30.0%) | 0 (0.0%) |
| 1 or 2 Children | 0 (0.0%) | 0 (0.0%) |
| 3 or 4 Children | 18 (100.0%) | 15 (100.0%) |
| 5 or more Children | 0 (0.0%) | 0 (0.0%) |
| Total | 42 (39.3%) | 15 (19.5%) |
Race in Black Eagle
The most populous races in Black Eagle are White / Caucasian (563 | 83.8%), Hispanic or Latino (56 | 8.3%), and Two or more Races (51 | 7.6%).
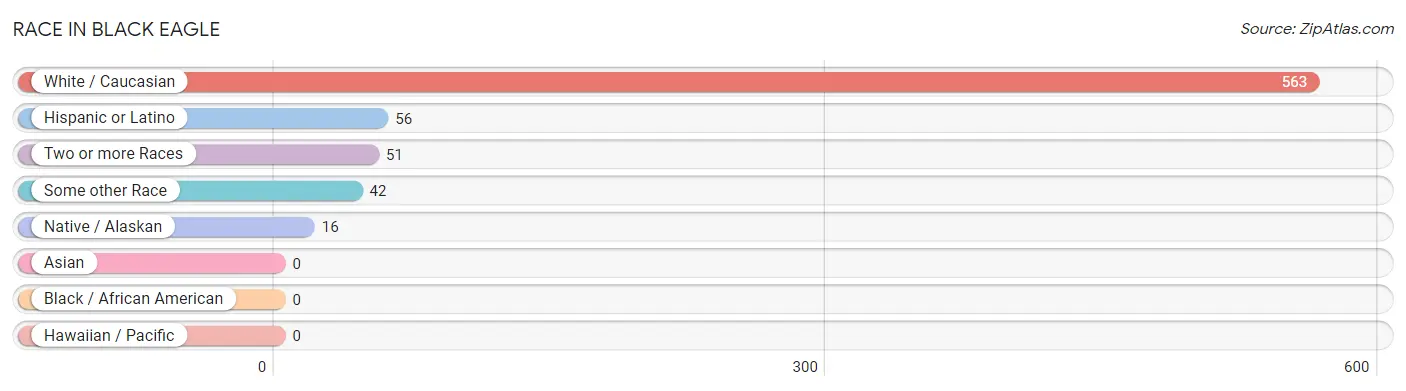
| Race | # Population | % Population |
| Asian | 0 | 0.0% |
| Black / African American | 0 | 0.0% |
| Hawaiian / Pacific | 0 | 0.0% |
| Hispanic or Latino | 56 | 8.3% |
| Native / Alaskan | 16 | 2.4% |
| White / Caucasian | 563 | 83.8% |
| Two or more Races | 51 | 7.6% |
| Some other Race | 42 | 6.2% |
| Total | 672 | 100.0% |
Ancestry in Black Eagle
The most populous ancestries reported in Black Eagle are German (87 | 13.0%), Irish (87 | 13.0%), American (70 | 10.4%), Mexican (56 | 8.3%), and French (43 | 6.4%), together accounting for 51.0% of all Black Eagle residents.
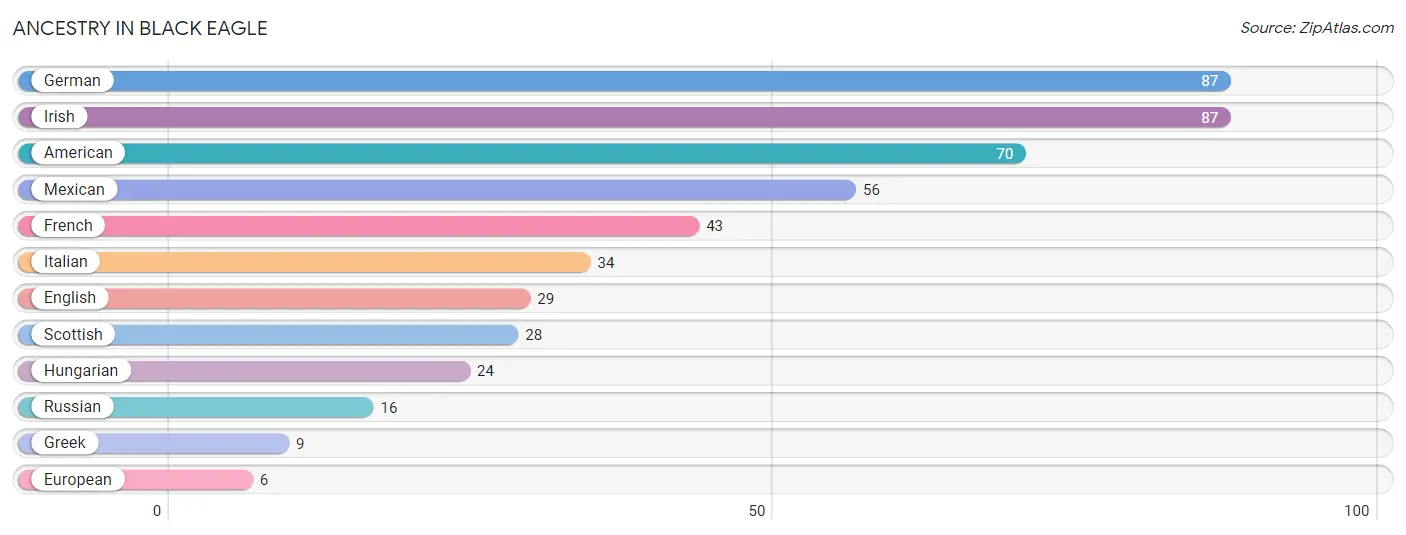
| Ancestry | # Population | % Population |
| American | 70 | 10.4% |
| English | 29 | 4.3% |
| European | 6 | 0.9% |
| French | 43 | 6.4% |
| German | 87 | 13.0% |
| Greek | 9 | 1.3% |
| Hungarian | 24 | 3.6% |
| Irish | 87 | 13.0% |
| Italian | 34 | 5.1% |
| Mexican | 56 | 8.3% |
| Russian | 16 | 2.4% |
| Scottish | 28 | 4.2% | View All 12 Rows |
Immigrants in Black Eagle
The most numerous immigrant groups reported in Black Eagle came from Europe (9 | 1.3%), Germany (9 | 1.3%), and Western Europe (9 | 1.3%), together accounting for 4.0% of all Black Eagle residents.
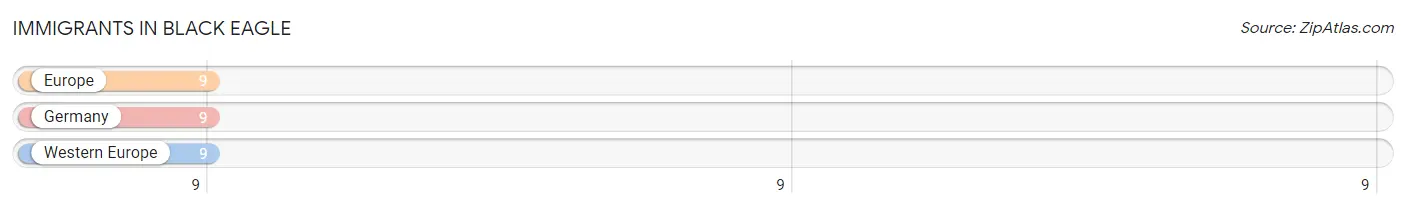
| Immigration Origin | # Population | % Population |
| Europe | 9 | 1.3% |
| Germany | 9 | 1.3% |
| Western Europe | 9 | 1.3% | View All 3 Rows |
Sex and Age in Black Eagle
Sex and Age in Black Eagle
The most populous age groups in Black Eagle are 55 to 59 Years (62 | 14.3%) for men and 55 to 59 Years (46 | 19.2%) for women.
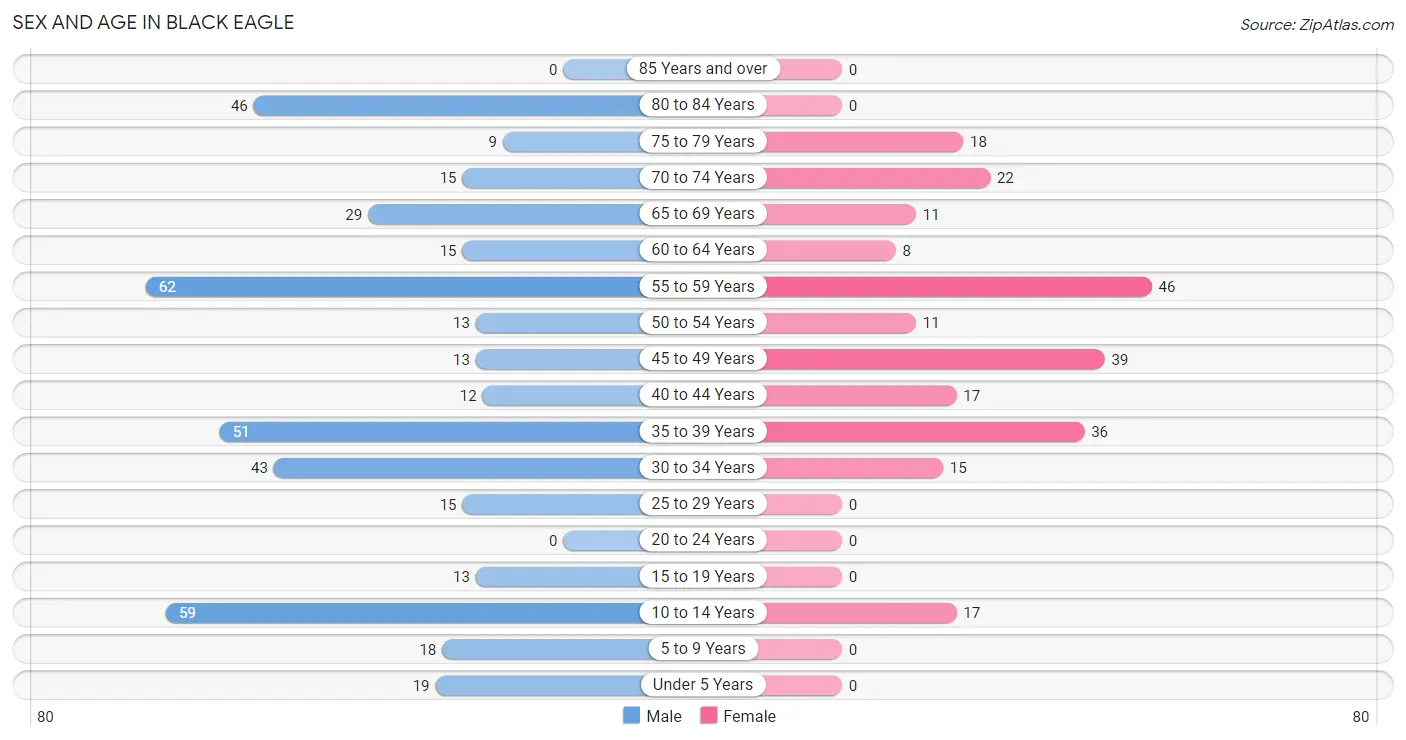
| Age Bracket | Male | Female |
| Under 5 Years | 19 (4.4%) | 0 (0.0%) |
| 5 to 9 Years | 18 (4.2%) | 0 (0.0%) |
| 10 to 14 Years | 59 (13.7%) | 17 (7.1%) |
| 15 to 19 Years | 13 (3.0%) | 0 (0.0%) |
| 20 to 24 Years | 0 (0.0%) | 0 (0.0%) |
| 25 to 29 Years | 15 (3.5%) | 0 (0.0%) |
| 30 to 34 Years | 43 (10.0%) | 15 (6.2%) |
| 35 to 39 Years | 51 (11.8%) | 36 (15.0%) |
| 40 to 44 Years | 12 (2.8%) | 17 (7.1%) |
| 45 to 49 Years | 13 (3.0%) | 39 (16.3%) |
| 50 to 54 Years | 13 (3.0%) | 11 (4.6%) |
| 55 to 59 Years | 62 (14.3%) | 46 (19.2%) |
| 60 to 64 Years | 15 (3.5%) | 8 (3.3%) |
| 65 to 69 Years | 29 (6.7%) | 11 (4.6%) |
| 70 to 74 Years | 15 (3.5%) | 22 (9.2%) |
| 75 to 79 Years | 9 (2.1%) | 18 (7.5%) |
| 80 to 84 Years | 46 (10.6%) | 0 (0.0%) |
| 85 Years and over | 0 (0.0%) | 0 (0.0%) |
| Total | 432 (100.0%) | 240 (100.0%) |
Families and Households in Black Eagle
Median Family Size in Black Eagle
The median family size in Black Eagle is 2.71 persons per family, with single male/father families (22 | 12.0%) accounting for the largest median family size of 3.27 persons per family. On the other hand, married-couple families (107 | 58.2%) represent the smallest median family size with 2.57 persons per family.
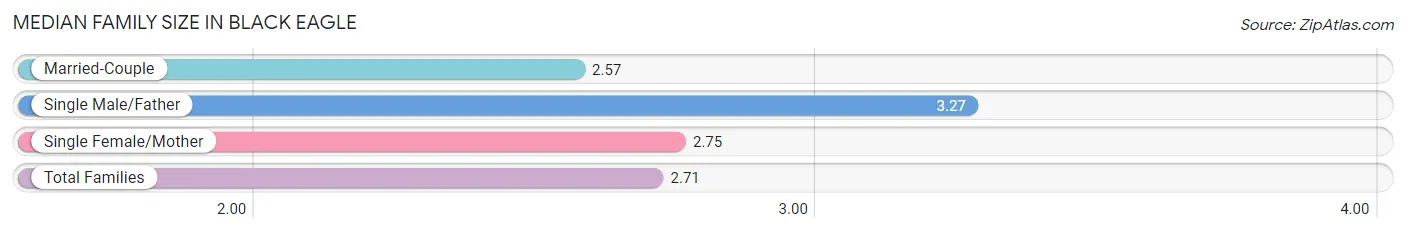
| Family Type | # Families | Family Size |
| Married-Couple | 107 (58.2%) | 2.57 |
| Single Male/Father | 22 (12.0%) | 3.27 |
| Single Female/Mother | 55 (29.9%) | 2.75 |
| Total Families | 184 (100.0%) | 2.71 |
Median Household Size in Black Eagle
The median household size in Black Eagle is 2.06 persons per household, with single male/father households (22 | 6.7%) accounting for the largest median household size of 3.82 persons per household. non-family households (143 | 43.7%) represent the smallest median household size with 1.13 persons per household.
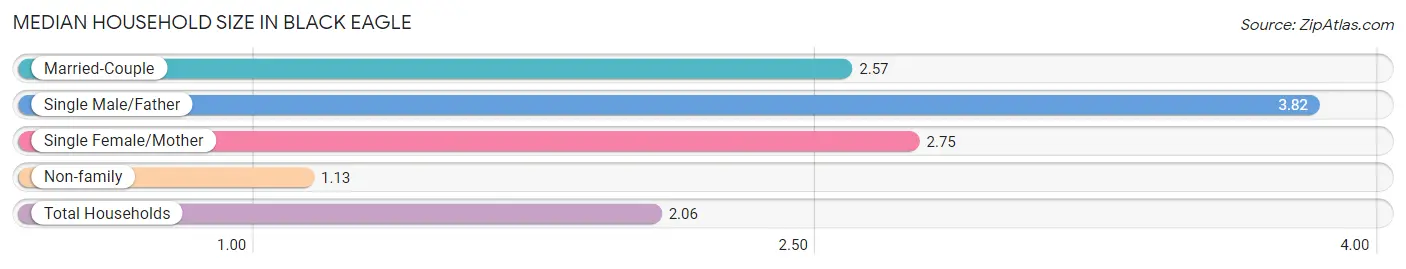
| Household Type | # Households | Household Size |
| Married-Couple | 107 (32.7%) | 2.57 |
| Single Male/Father | 22 (6.7%) | 3.82 |
| Single Female/Mother | 55 (16.8%) | 2.75 |
| Non-family | 143 (43.7%) | 1.13 |
| Total Households | 327 (100.0%) | 2.06 |
Household Size by Marriage Status in Black Eagle
Out of a total of 327 households in Black Eagle, 184 (56.3%) are family households, while 143 (43.7%) are nonfamily households. The most numerous type of family households are 2-person households, comprising 119, and the most common type of nonfamily households are 1-person households, comprising 121.
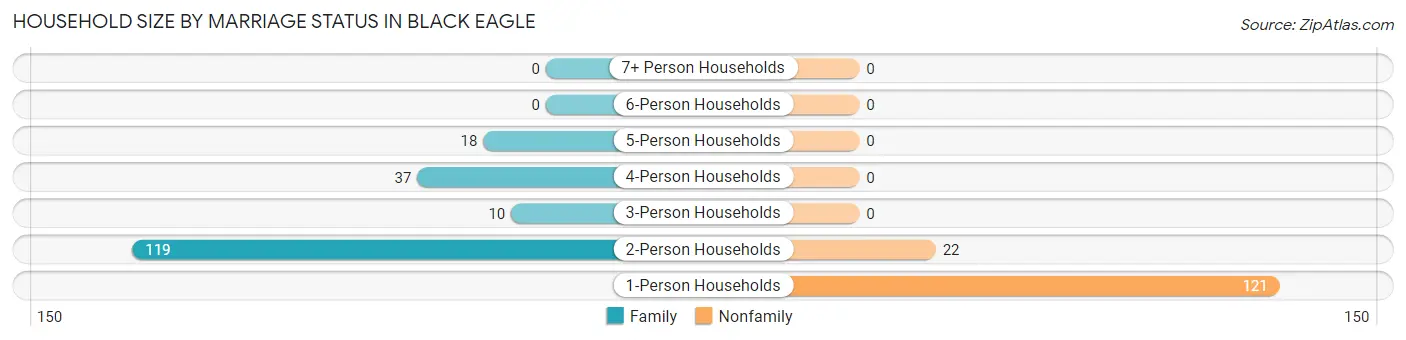
| Household Size | Family Households | Nonfamily Households |
| 1-Person Households | - | 121 (37.0%) |
| 2-Person Households | 119 (36.4%) | 22 (6.7%) |
| 3-Person Households | 10 (3.1%) | 0 (0.0%) |
| 4-Person Households | 37 (11.3%) | 0 (0.0%) |
| 5-Person Households | 18 (5.5%) | 0 (0.0%) |
| 6-Person Households | 0 (0.0%) | 0 (0.0%) |
| 7+ Person Households | 0 (0.0%) | 0 (0.0%) |
| Total | 184 (56.3%) | 143 (43.7%) |
Female Fertility in Black Eagle
Fertility by Age in Black Eagle
| Age Bracket | Women with Births | Births / 1,000 Women |
| 15 to 19 years | 0 (0.0%) | 0.0 |
| 20 to 34 years | 0 (0.0%) | 0.0 |
| 35 to 50 years | 0 (0.0%) | 0.0 |
| Total | 0 (0.0%) | 0.0 |
Fertility by Age by Marriage Status in Black Eagle
| Age Bracket | Married | Unmarried |
| 15 to 19 years | 0 (0.0%) | 0 (0.0%) |
| 20 to 34 years | 0 (0.0%) | 0 (0.0%) |
| 35 to 50 years | 0 (0.0%) | 0 (0.0%) |
| Total | 0 (0.0%) | 0 (0.0%) |
Fertility by Education in Black Eagle
| Educational Attainment | Women with Births | Births / 1,000 Women |
| Less than High School | 0 (0.0%) | 0.0 |
| High School Diploma | 0 (0.0%) | 0.0 |
| College or Associate's Degree | 0 (0.0%) | 0.0 |
| Bachelor's Degree | 0 (0.0%) | 0.0 |
| Graduate Degree | 0 (0.0%) | 0.0 |
| Total | 0 (0.0%) | 0.0 |
Fertility by Education by Marriage Status in Black Eagle
| Educational Attainment | Married | Unmarried |
| Less than High School | 0 (0.0%) | 0 (0.0%) |
| High School Diploma | 0 (0.0%) | 0 (0.0%) |
| College or Associate's Degree | 0 (0.0%) | 0 (0.0%) |
| Bachelor's Degree | 0 (0.0%) | 0 (0.0%) |
| Graduate Degree | 0 (0.0%) | 0 (0.0%) |
| Total | 0 (0.0%) | 0 (0.0%) |
Employment Characteristics in Black Eagle
Employment by Class of Employer in Black Eagle
Among the 293 employed individuals in Black Eagle, private company employees (202 | 68.9%), local government employees (33 | 11.3%), and self-employed (not incorporated) (29 | 9.9%) make up the most common classes of employment.
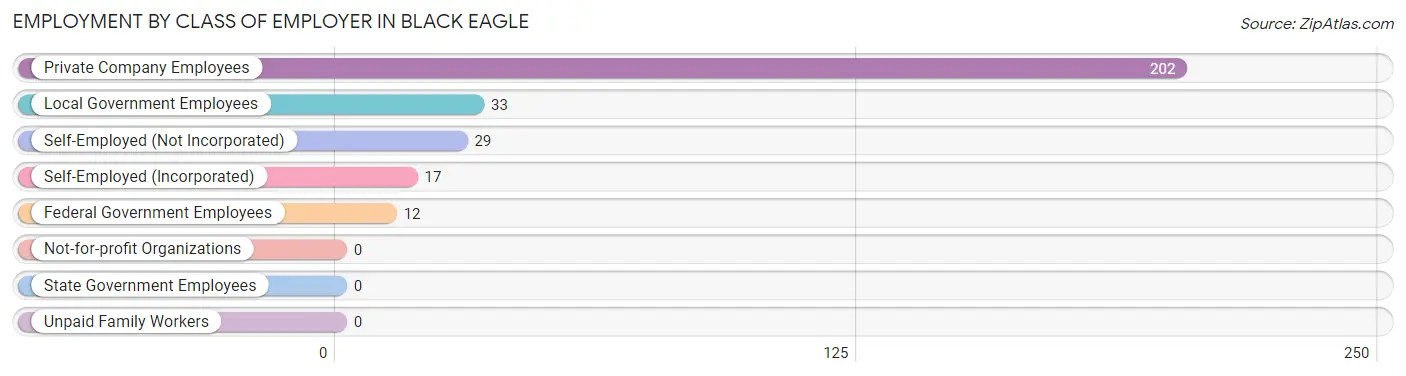
| Employer Class | # Employees | % Employees |
| Private Company Employees | 202 | 68.9% |
| Self-Employed (Incorporated) | 17 | 5.8% |
| Self-Employed (Not Incorporated) | 29 | 9.9% |
| Not-for-profit Organizations | 0 | 0.0% |
| Local Government Employees | 33 | 11.3% |
| State Government Employees | 0 | 0.0% |
| Federal Government Employees | 12 | 4.1% |
| Unpaid Family Workers | 0 | 0.0% |
| Total | 293 | 100.0% |
Employment Status by Age in Black Eagle
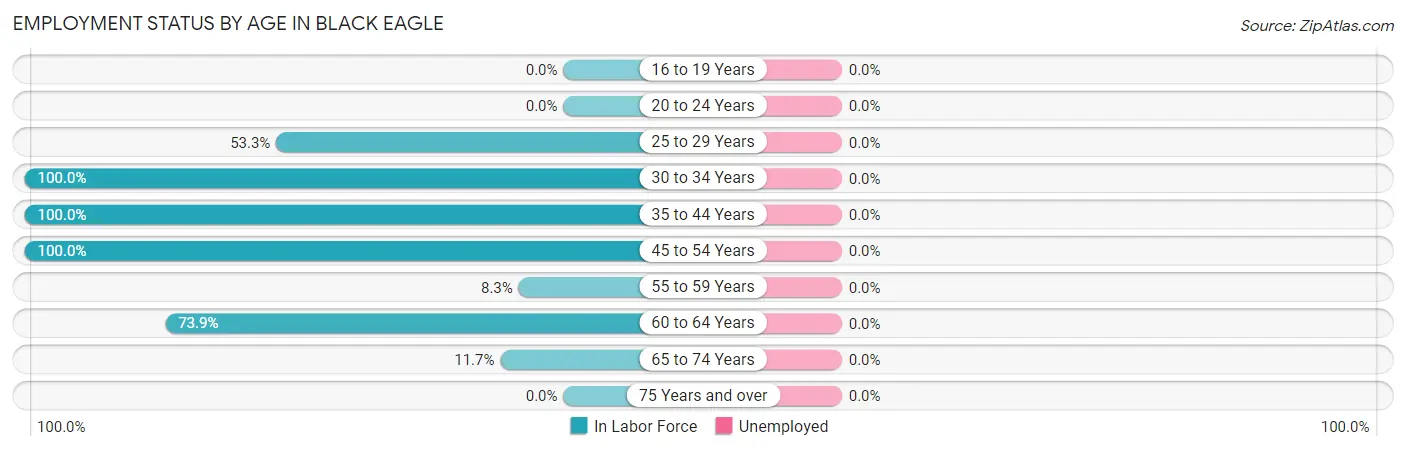
| Age Bracket | In Labor Force | Unemployed |
| 16 to 19 Years | 0 (0.0%) | 0 (0.0%) |
| 20 to 24 Years | 0 (0.0%) | 0 (0.0%) |
| 25 to 29 Years | 8 (53.3%) | 0 (0.0%) |
| 30 to 34 Years | 58 (100.0%) | 0 (0.0%) |
| 35 to 44 Years | 116 (100.0%) | 0 (0.0%) |
| 45 to 54 Years | 76 (100.0%) | 0 (0.0%) |
| 55 to 59 Years | 9 (8.3%) | 0 (0.0%) |
| 60 to 64 Years | 17 (73.9%) | 0 (0.0%) |
| 65 to 74 Years | 9 (11.7%) | 0 (0.0%) |
| 75 Years and over | 0 (0.0%) | 0 (0.0%) |
| Total | 293 (52.4%) | 0 (0.0%) |
Employment Status by Educational Attainment in Black Eagle
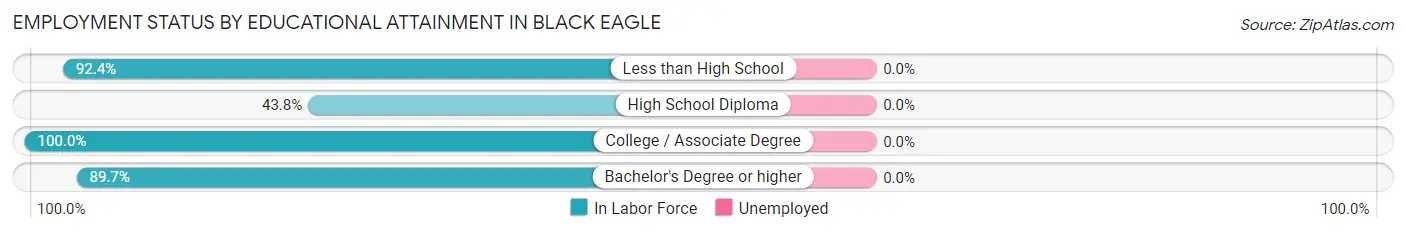
| Educational Attainment | In Labor Force | Unemployed |
| Less than High School | 85 (92.4%) | 0 (0.0%) |
| High School Diploma | 77 (43.8%) | 0 (0.0%) |
| College / Associate Degree | 70 (100.0%) | 0 (0.0%) |
| Bachelor's Degree or higher | 52 (89.7%) | 0 (0.0%) |
| Total | 284 (71.7%) | 0 (0.0%) |
Employment Occupations by Sex in Black Eagle
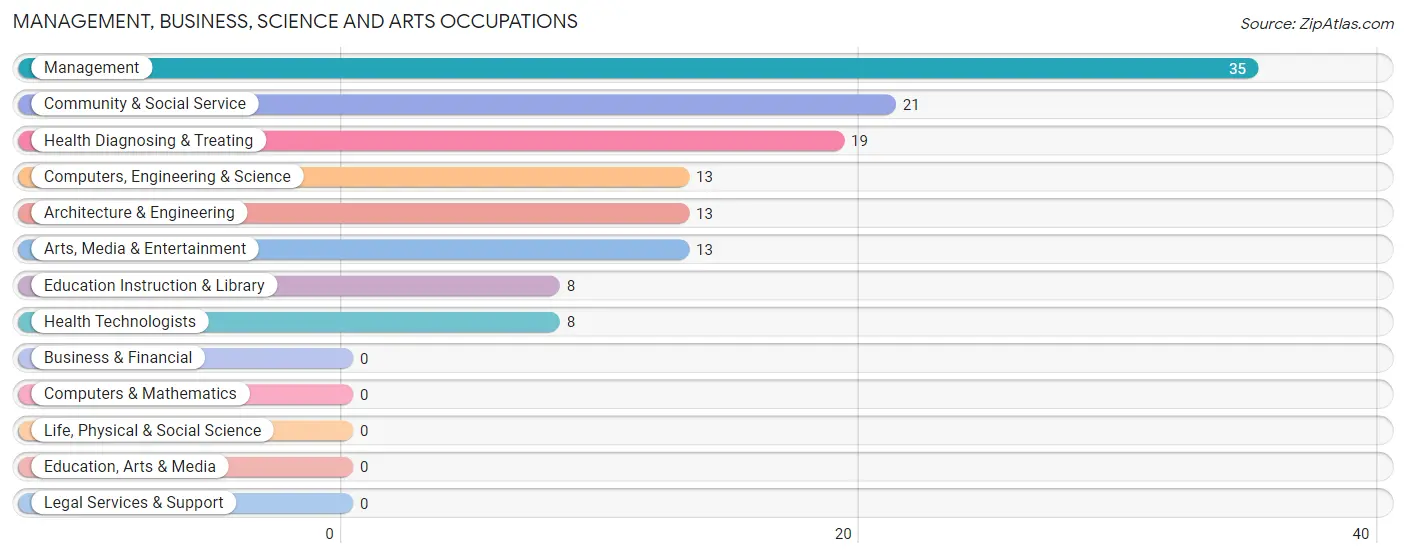
Management, Business, Science and Arts Occupations
The most common Management, Business, Science and Arts occupations in Black Eagle are Management (35 | 11.9%), Community & Social Service (21 | 7.2%), Health Diagnosing & Treating (19 | 6.5%), Computers, Engineering & Science (13 | 4.4%), and Architecture & Engineering (13 | 4.4%).
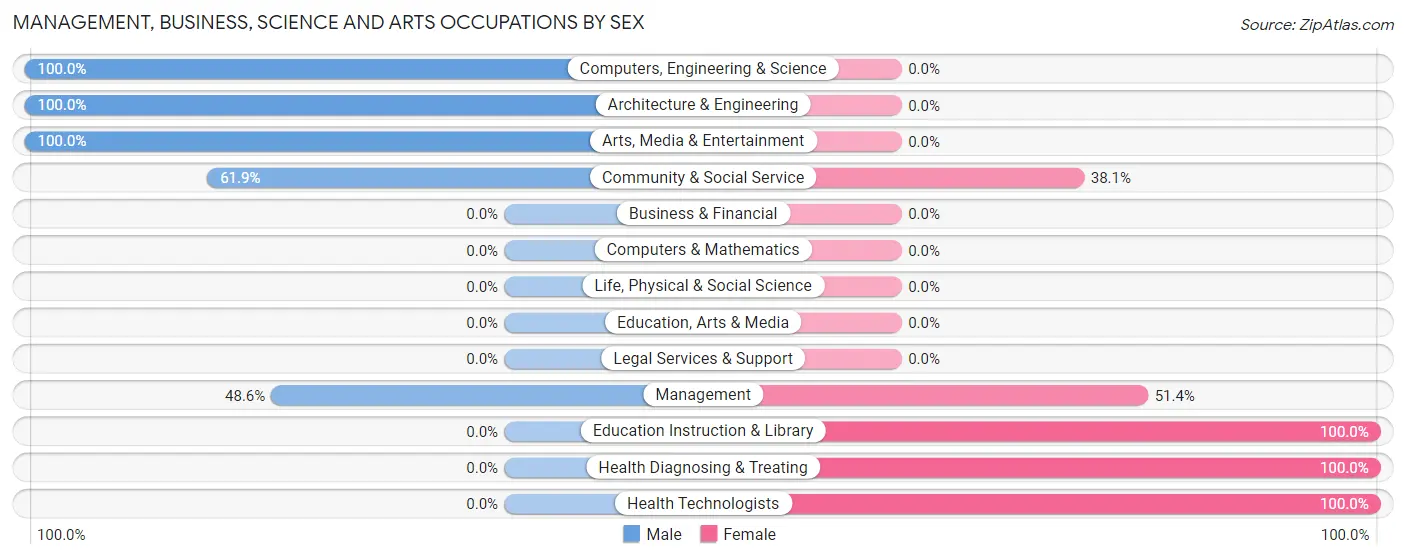
Management, Business, Science and Arts Occupations by Sex
Within the Management, Business, Science and Arts occupations in Black Eagle, the most male-oriented occupations are Computers, Engineering & Science (100.0%), Architecture & Engineering (100.0%), and Arts, Media & Entertainment (100.0%), while the most female-oriented occupations are Education Instruction & Library (100.0%), Health Diagnosing & Treating (100.0%), and Health Technologists (100.0%).
| Occupation | Male | Female |
| Management | 17 (48.6%) | 18 (51.4%) |
| Business & Financial | 0 (0.0%) | 0 (0.0%) |
| Computers, Engineering & Science | 13 (100.0%) | 0 (0.0%) |
| Computers & Mathematics | 0 (0.0%) | 0 (0.0%) |
| Architecture & Engineering | 13 (100.0%) | 0 (0.0%) |
| Life, Physical & Social Science | 0 (0.0%) | 0 (0.0%) |
| Community & Social Service | 13 (61.9%) | 8 (38.1%) |
| Education, Arts & Media | 0 (0.0%) | 0 (0.0%) |
| Legal Services & Support | 0 (0.0%) | 0 (0.0%) |
| Education Instruction & Library | 0 (0.0%) | 8 (100.0%) |
| Arts, Media & Entertainment | 13 (100.0%) | 0 (0.0%) |
| Health Diagnosing & Treating | 0 (0.0%) | 19 (100.0%) |
| Health Technologists | 0 (0.0%) | 8 (100.0%) |
| Total (Category) | 43 (48.9%) | 45 (51.1%) |
| Total (Overall) | 167 (57.0%) | 126 (43.0%) |
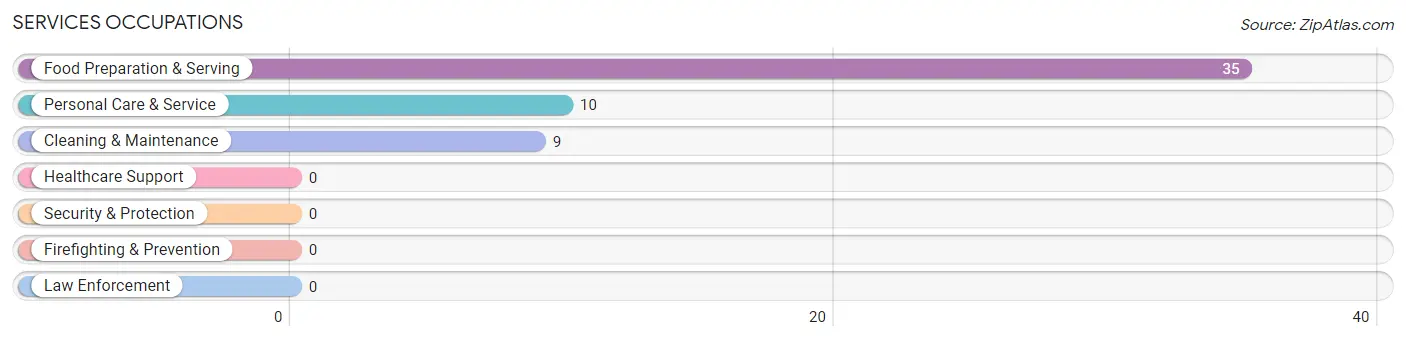
Services Occupations
The most common Services occupations in Black Eagle are Food Preparation & Serving (35 | 11.9%), Personal Care & Service (10 | 3.4%), and Cleaning & Maintenance (9 | 3.1%).
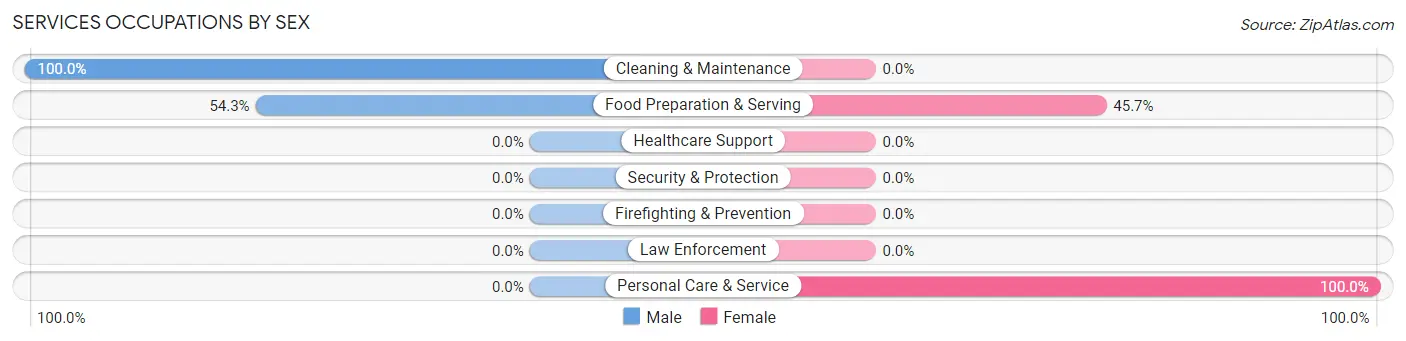
Services Occupations by Sex
Within the Services occupations in Black Eagle, the most male-oriented occupations are Cleaning & Maintenance (100.0%), and Food Preparation & Serving (54.3%), while the most female-oriented occupations are Personal Care & Service (100.0%), and Food Preparation & Serving (45.7%).
| Occupation | Male | Female |
| Healthcare Support | 0 (0.0%) | 0 (0.0%) |
| Security & Protection | 0 (0.0%) | 0 (0.0%) |
| Firefighting & Prevention | 0 (0.0%) | 0 (0.0%) |
| Law Enforcement | 0 (0.0%) | 0 (0.0%) |
| Food Preparation & Serving | 19 (54.3%) | 16 (45.7%) |
| Cleaning & Maintenance | 9 (100.0%) | 0 (0.0%) |
| Personal Care & Service | 0 (0.0%) | 10 (100.0%) |
| Total (Category) | 28 (51.8%) | 26 (48.1%) |
| Total (Overall) | 167 (57.0%) | 126 (43.0%) |
Sales and Office Occupations
The most common Sales and Office occupations in Black Eagle are Office & Administration (40 | 13.7%), and Sales & Related (12 | 4.1%).
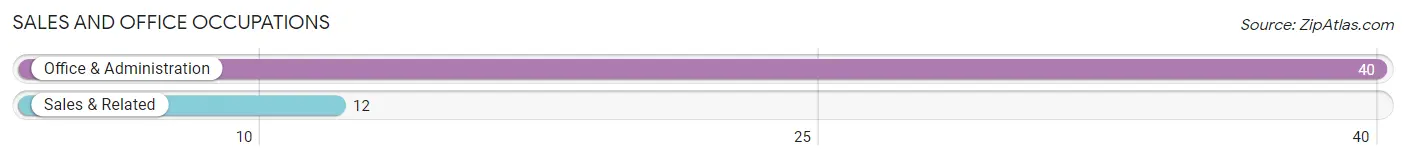
Sales and Office Occupations by Sex
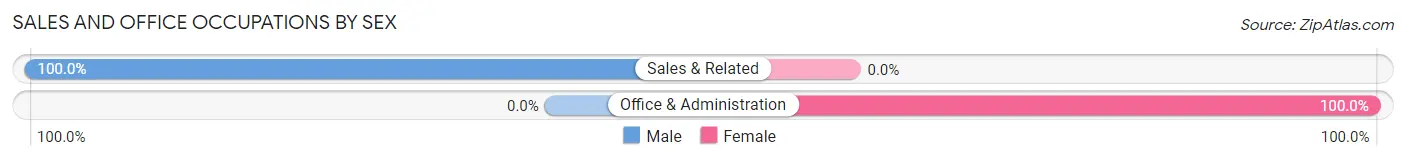
| Occupation | Male | Female |
| Sales & Related | 12 (100.0%) | 0 (0.0%) |
| Office & Administration | 0 (0.0%) | 40 (100.0%) |
| Total (Category) | 12 (23.1%) | 40 (76.9%) |
| Total (Overall) | 167 (57.0%) | 126 (43.0%) |
Natural Resources, Construction and Maintenance Occupations
The most common Natural Resources, Construction and Maintenance occupations in Black Eagle are Construction & Extraction (35 | 11.9%), and Installation, Maintenance & Repair (18 | 6.1%).
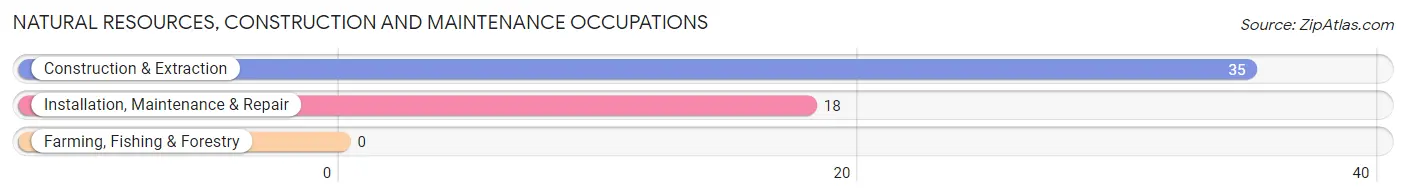
Natural Resources, Construction and Maintenance Occupations by Sex
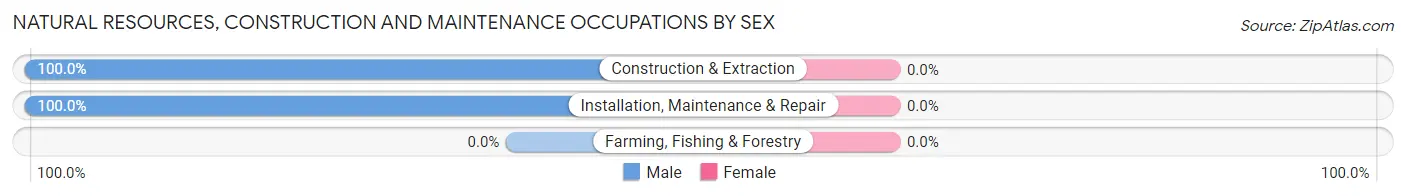
| Occupation | Male | Female |
| Farming, Fishing & Forestry | 0 (0.0%) | 0 (0.0%) |
| Construction & Extraction | 35 (100.0%) | 0 (0.0%) |
| Installation, Maintenance & Repair | 18 (100.0%) | 0 (0.0%) |
| Total (Category) | 53 (100.0%) | 0 (0.0%) |
| Total (Overall) | 167 (57.0%) | 126 (43.0%) |
Production, Transportation and Moving Occupations
The most common Production, Transportation and Moving occupations in Black Eagle are Transportation (24 | 8.2%), and Production (22 | 7.5%).
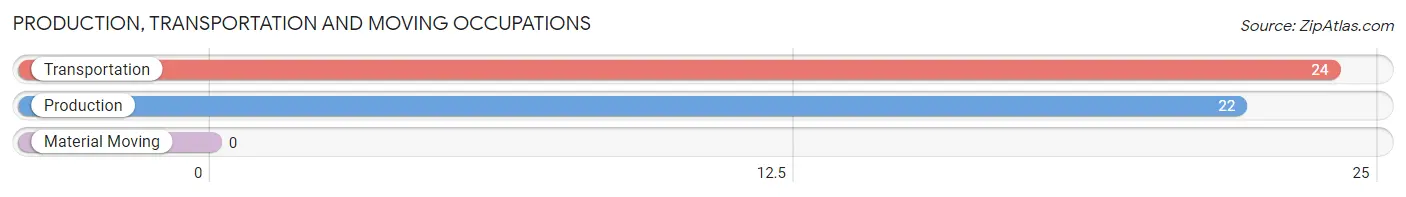
Production, Transportation and Moving Occupations by Sex
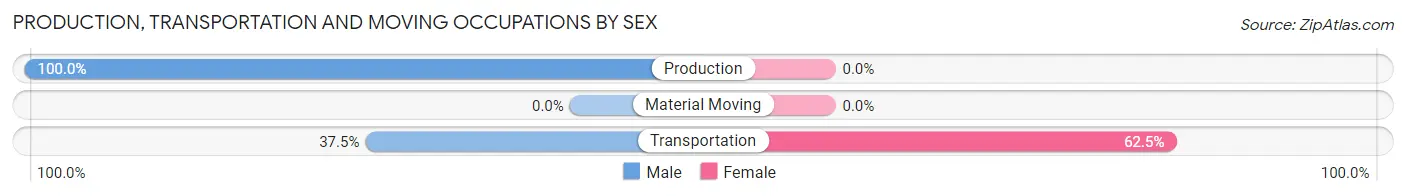
| Occupation | Male | Female |
| Production | 22 (100.0%) | 0 (0.0%) |
| Transportation | 9 (37.5%) | 15 (62.5%) |
| Material Moving | 0 (0.0%) | 0 (0.0%) |
| Total (Category) | 31 (67.4%) | 15 (32.6%) |
| Total (Overall) | 167 (57.0%) | 126 (43.0%) |
Employment Industries by Sex in Black Eagle
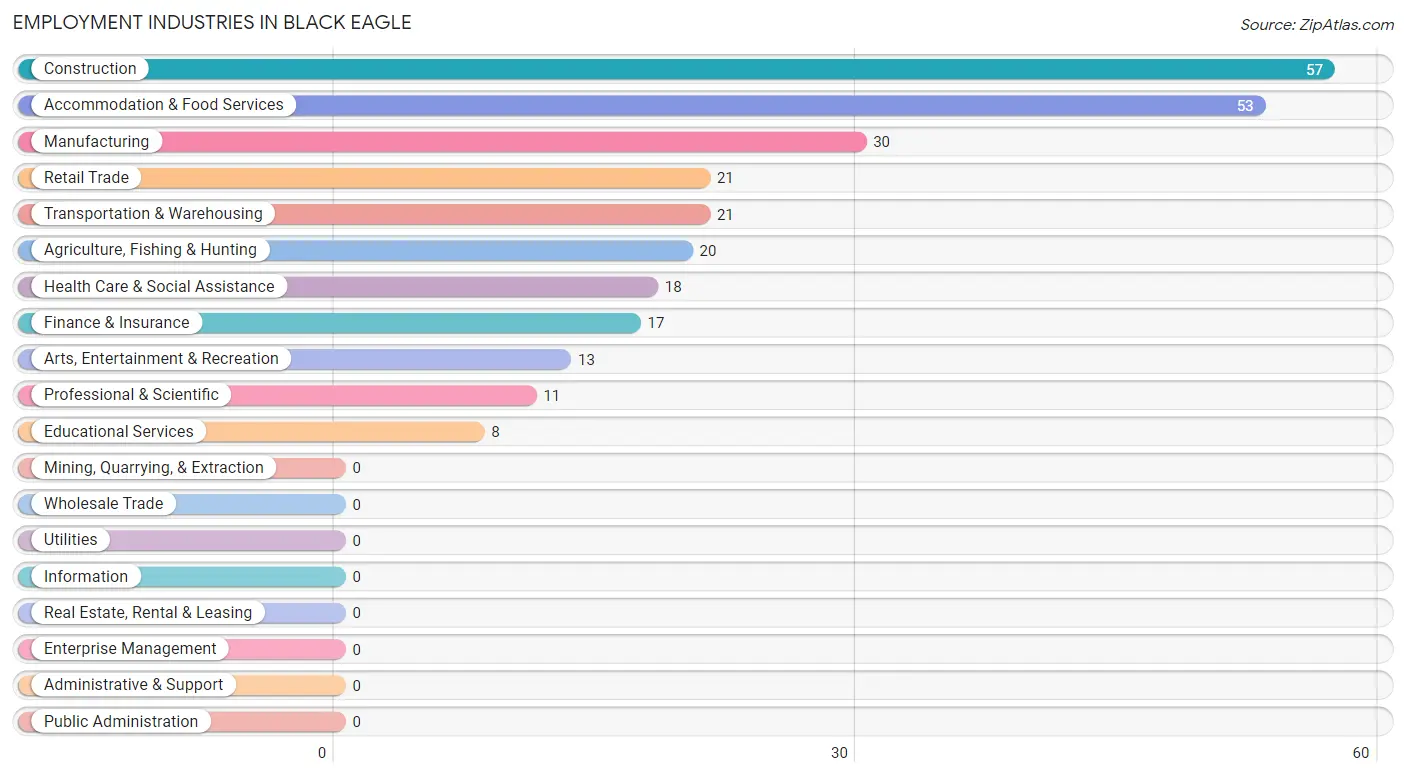
Employment Industries in Black Eagle
The major employment industries in Black Eagle include Construction (57 | 19.5%), Accommodation & Food Services (53 | 18.1%), Manufacturing (30 | 10.2%), Retail Trade (21 | 7.2%), and Transportation & Warehousing (21 | 7.2%).
Employment Industries by Sex in Black Eagle
The Black Eagle industries that see more men than women are Construction (100.0%), Manufacturing (100.0%), and Retail Trade (100.0%), whereas the industries that tend to have a higher number of women are Finance & Insurance (100.0%), Professional & Scientific (100.0%), and Educational Services (100.0%).
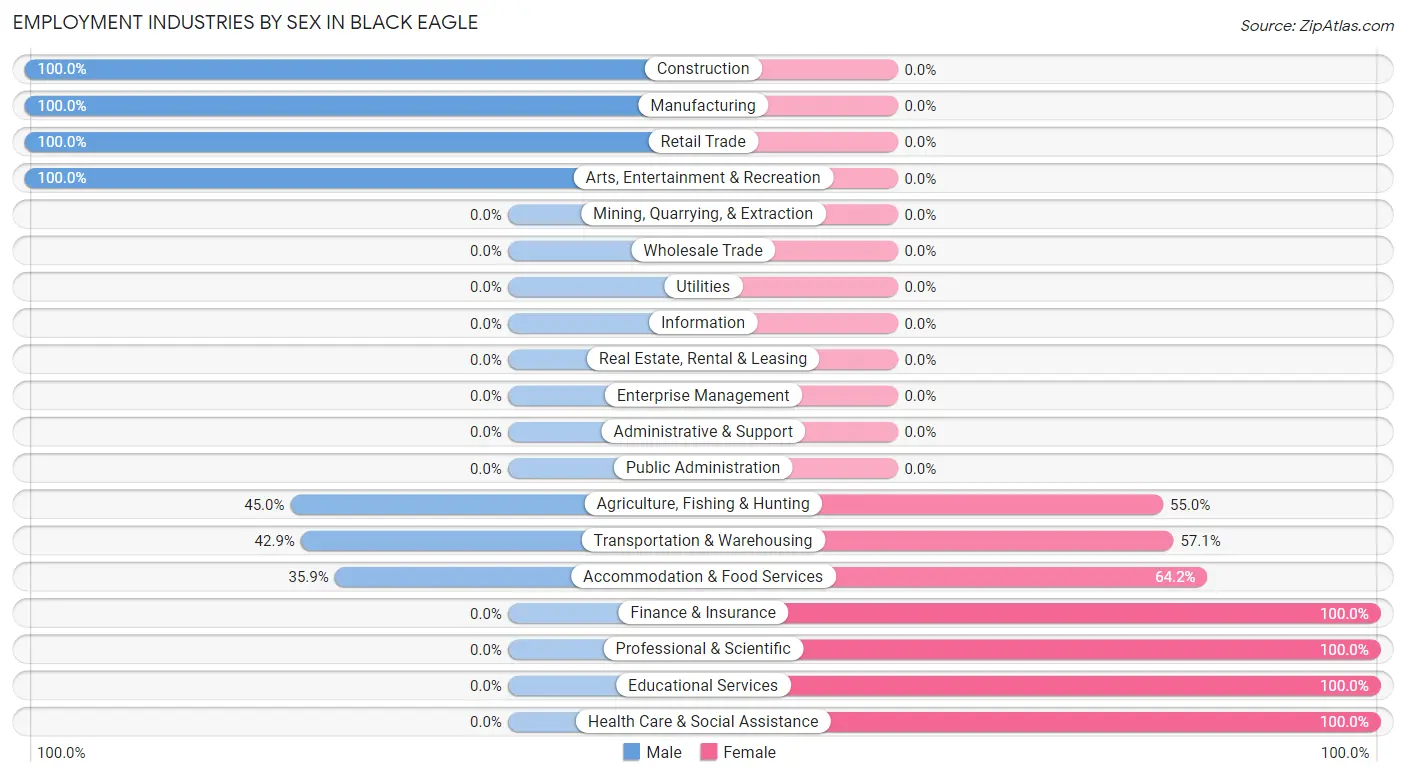
| Industry | Male | Female |
| Agriculture, Fishing & Hunting | 9 (45.0%) | 11 (55.0%) |
| Mining, Quarrying, & Extraction | 0 (0.0%) | 0 (0.0%) |
| Construction | 57 (100.0%) | 0 (0.0%) |
| Manufacturing | 30 (100.0%) | 0 (0.0%) |
| Wholesale Trade | 0 (0.0%) | 0 (0.0%) |
| Retail Trade | 21 (100.0%) | 0 (0.0%) |
| Transportation & Warehousing | 9 (42.9%) | 12 (57.1%) |
| Utilities | 0 (0.0%) | 0 (0.0%) |
| Information | 0 (0.0%) | 0 (0.0%) |
| Finance & Insurance | 0 (0.0%) | 17 (100.0%) |
| Real Estate, Rental & Leasing | 0 (0.0%) | 0 (0.0%) |
| Professional & Scientific | 0 (0.0%) | 11 (100.0%) |
| Enterprise Management | 0 (0.0%) | 0 (0.0%) |
| Administrative & Support | 0 (0.0%) | 0 (0.0%) |
| Educational Services | 0 (0.0%) | 8 (100.0%) |
| Health Care & Social Assistance | 0 (0.0%) | 18 (100.0%) |
| Arts, Entertainment & Recreation | 13 (100.0%) | 0 (0.0%) |
| Accommodation & Food Services | 19 (35.8%) | 34 (64.1%) |
| Public Administration | 0 (0.0%) | 0 (0.0%) |
| Total | 167 (57.0%) | 126 (43.0%) |
Education in Black Eagle
School Enrollment in Black Eagle
The most common levels of schooling among the 138 students in Black Eagle are middle school (67 | 48.5%), nursery / preschool (19 | 13.8%), and elementary school (18 | 13.0%).
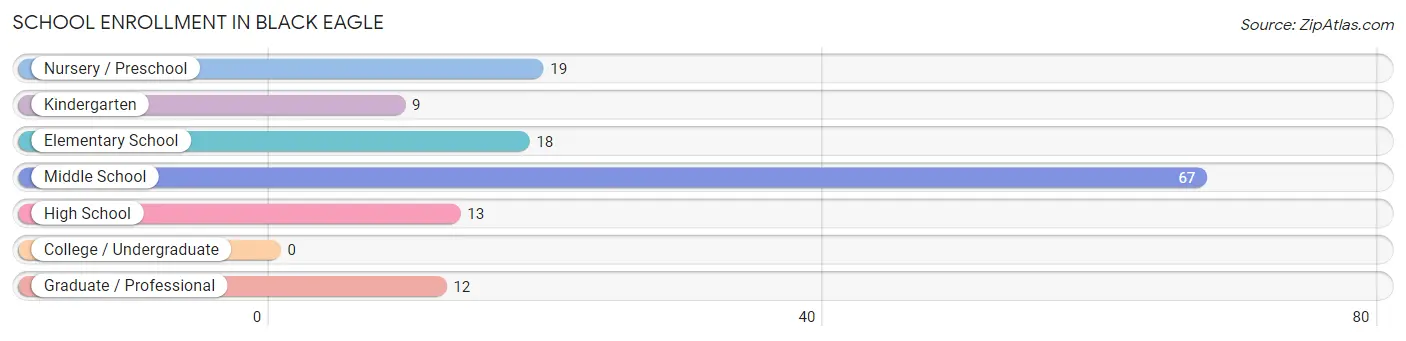
| School Level | # Students | % Students |
| Nursery / Preschool | 19 | 13.8% |
| Kindergarten | 9 | 6.5% |
| Elementary School | 18 | 13.0% |
| Middle School | 67 | 48.5% |
| High School | 13 | 9.4% |
| College / Undergraduate | 0 | 0.0% |
| Graduate / Professional | 12 | 8.7% |
| Total | 138 | 100.0% |
School Enrollment by Age by Funding Source in Black Eagle
Out of a total of 138 students who are enrolled in schools in Black Eagle, 38 (27.5%) attend a private institution, while the remaining 100 (72.5%) are enrolled in public schools. The age group of 3 to 4 year olds has the highest likelihood of being enrolled in private schools, with 19 (100.0% in the age bracket) enrolled. Conversely, the age group of 5 to 9 year old has the lowest likelihood of being enrolled in a private school, with 18 (100.0% in the age bracket) attending a public institution.
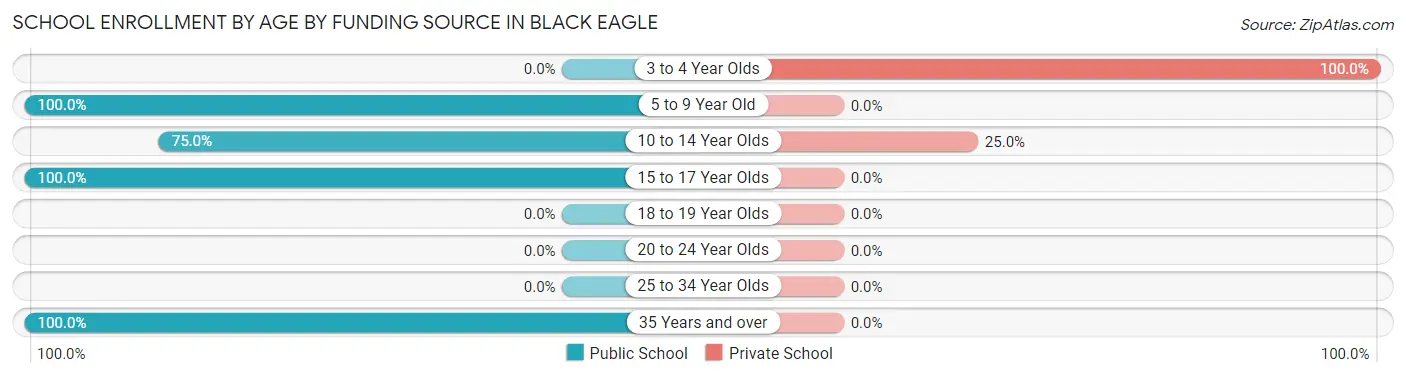
| Age Bracket | Public School | Private School |
| 3 to 4 Year Olds | 0 (0.0%) | 19 (100.0%) |
| 5 to 9 Year Old | 18 (100.0%) | 0 (0.0%) |
| 10 to 14 Year Olds | 57 (75.0%) | 19 (25.0%) |
| 15 to 17 Year Olds | 13 (100.0%) | 0 (0.0%) |
| 18 to 19 Year Olds | 0 (0.0%) | 0 (0.0%) |
| 20 to 24 Year Olds | 0 (0.0%) | 0 (0.0%) |
| 25 to 34 Year Olds | 0 (0.0%) | 0 (0.0%) |
| 35 Years and over | 12 (100.0%) | 0 (0.0%) |
| Total | 100 (72.5%) | 38 (27.5%) |
Educational Attainment by Field of Study in Black Eagle
Computers & mathematics (19 | 32.8%), liberal arts & history (12 | 20.7%), psychology (11 | 19.0%), science & technology (8 | 13.8%), and education (8 | 13.8%) are the most common fields of study among 58 individuals in Black Eagle who have obtained a bachelor's degree or higher.
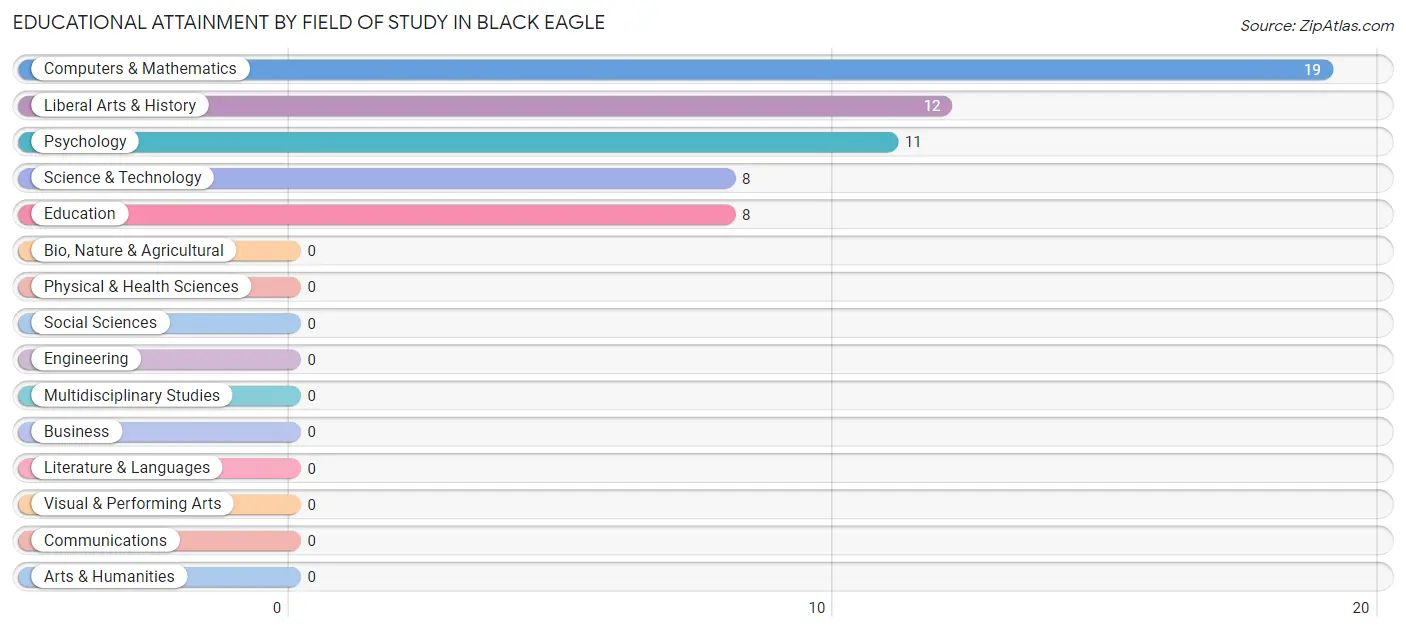
| Field of Study | # Graduates | % Graduates |
| Computers & Mathematics | 19 | 32.8% |
| Bio, Nature & Agricultural | 0 | 0.0% |
| Physical & Health Sciences | 0 | 0.0% |
| Psychology | 11 | 19.0% |
| Social Sciences | 0 | 0.0% |
| Engineering | 0 | 0.0% |
| Multidisciplinary Studies | 0 | 0.0% |
| Science & Technology | 8 | 13.8% |
| Business | 0 | 0.0% |
| Education | 8 | 13.8% |
| Literature & Languages | 0 | 0.0% |
| Liberal Arts & History | 12 | 20.7% |
| Visual & Performing Arts | 0 | 0.0% |
| Communications | 0 | 0.0% |
| Arts & Humanities | 0 | 0.0% |
| Total | 58 | 100.0% |
Transportation & Commute in Black Eagle
Vehicle Availability by Sex in Black Eagle
The most prevalent vehicle ownership categories in Black Eagle are males with 2 vehicles (80, accounting for 47.9%) and females with 2 vehicles (64, making up 63.5%).
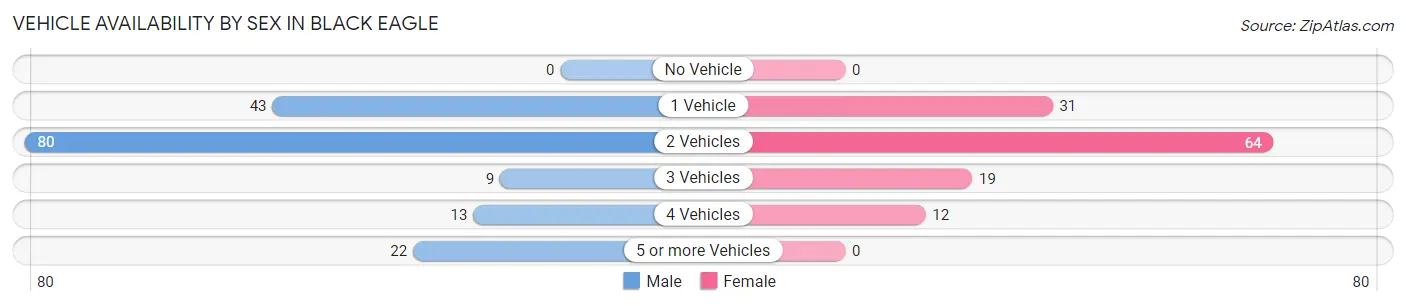
| Vehicles Available | Male | Female |
| No Vehicle | 0 (0.0%) | 0 (0.0%) |
| 1 Vehicle | 43 (25.8%) | 31 (24.6%) |
| 2 Vehicles | 80 (47.9%) | 64 (50.8%) |
| 3 Vehicles | 9 (5.4%) | 19 (15.1%) |
| 4 Vehicles | 13 (7.8%) | 12 (9.5%) |
| 5 or more Vehicles | 22 (13.2%) | 0 (0.0%) |
| Total | 167 (100.0%) | 126 (100.0%) |
Commute Time in Black Eagle
The most frequently occuring commute durations in Black Eagle are 10 to 14 minutes (83 commuters, 29.4%), 15 to 19 minutes (80 commuters, 28.4%), and 20 to 24 minutes (43 commuters, 15.2%).
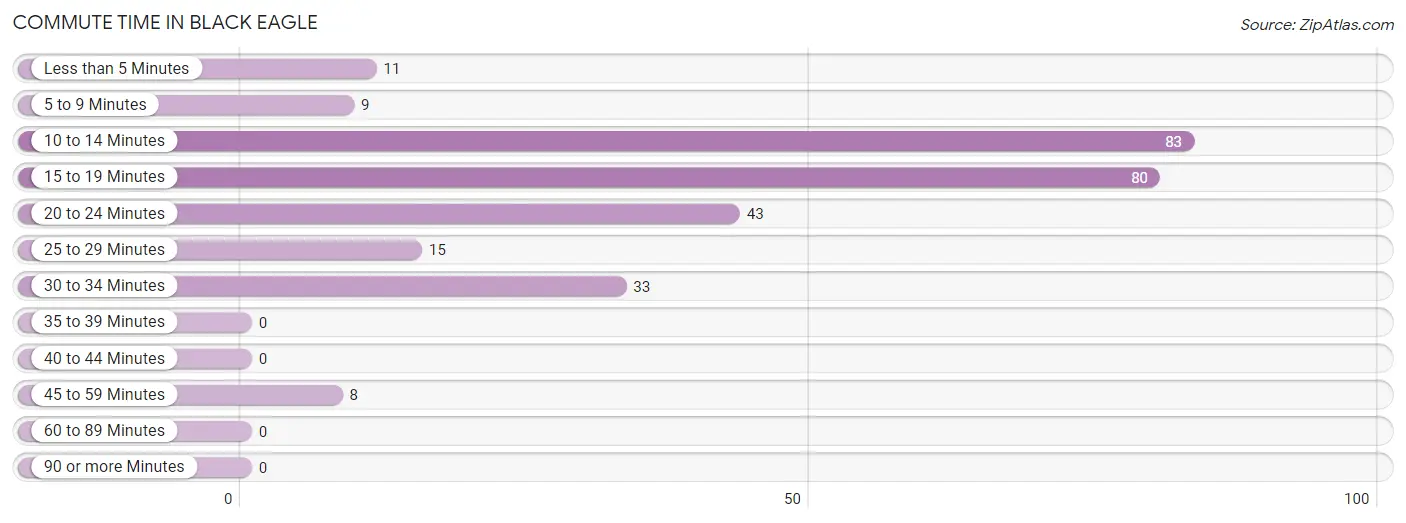
| Commute Time | # Commuters | % Commuters |
| Less than 5 Minutes | 11 | 3.9% |
| 5 to 9 Minutes | 9 | 3.2% |
| 10 to 14 Minutes | 83 | 29.4% |
| 15 to 19 Minutes | 80 | 28.4% |
| 20 to 24 Minutes | 43 | 15.2% |
| 25 to 29 Minutes | 15 | 5.3% |
| 30 to 34 Minutes | 33 | 11.7% |
| 35 to 39 Minutes | 0 | 0.0% |
| 40 to 44 Minutes | 0 | 0.0% |
| 45 to 59 Minutes | 8 | 2.8% |
| 60 to 89 Minutes | 0 | 0.0% |
| 90 or more Minutes | 0 | 0.0% |
Commute Time by Sex in Black Eagle
The most common commute times in Black Eagle are 10 to 14 minutes (56 commuters, 33.5%) for males and 15 to 19 minutes (37 commuters, 32.2%) for females.
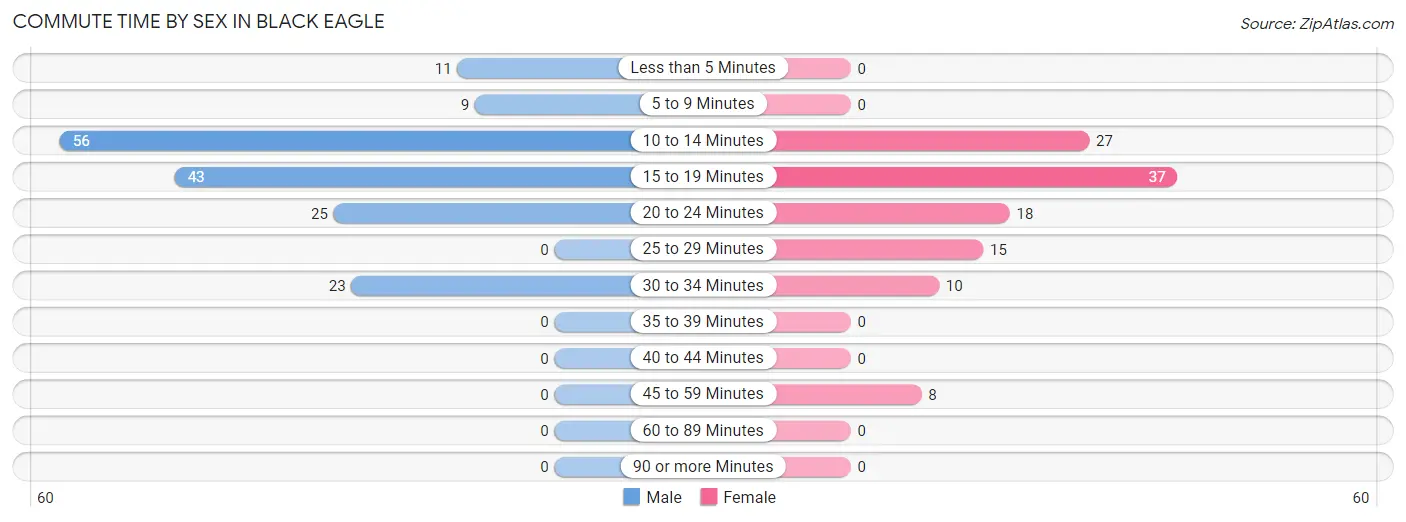
| Commute Time | Male | Female |
| Less than 5 Minutes | 11 (6.6%) | 0 (0.0%) |
| 5 to 9 Minutes | 9 (5.4%) | 0 (0.0%) |
| 10 to 14 Minutes | 56 (33.5%) | 27 (23.5%) |
| 15 to 19 Minutes | 43 (25.8%) | 37 (32.2%) |
| 20 to 24 Minutes | 25 (15.0%) | 18 (15.7%) |
| 25 to 29 Minutes | 0 (0.0%) | 15 (13.0%) |
| 30 to 34 Minutes | 23 (13.8%) | 10 (8.7%) |
| 35 to 39 Minutes | 0 (0.0%) | 0 (0.0%) |
| 40 to 44 Minutes | 0 (0.0%) | 0 (0.0%) |
| 45 to 59 Minutes | 0 (0.0%) | 8 (7.0%) |
| 60 to 89 Minutes | 0 (0.0%) | 0 (0.0%) |
| 90 or more Minutes | 0 (0.0%) | 0 (0.0%) |
Time of Departure to Work by Sex in Black Eagle
The most frequent times of departure to work in Black Eagle are 7:00 AM to 7:29 AM (39, 23.4%) for males and 8:30 AM to 8:59 AM (40, 34.8%) for females.
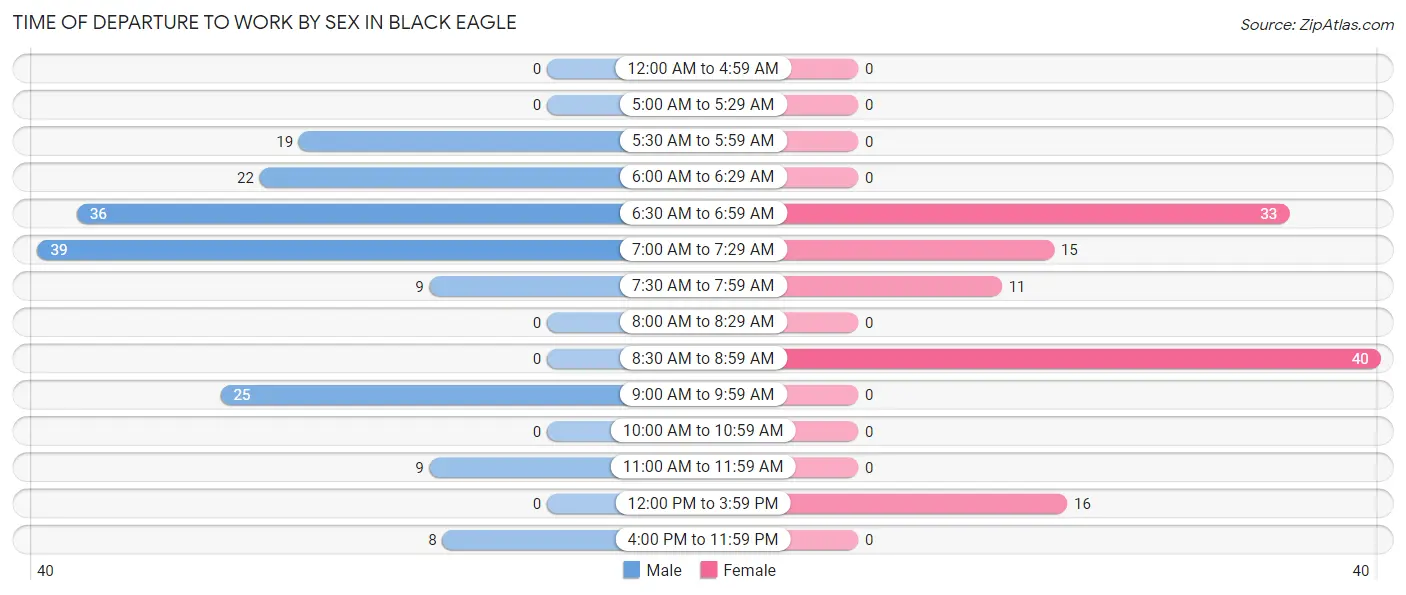
| Time of Departure | Male | Female |
| 12:00 AM to 4:59 AM | 0 (0.0%) | 0 (0.0%) |
| 5:00 AM to 5:29 AM | 0 (0.0%) | 0 (0.0%) |
| 5:30 AM to 5:59 AM | 19 (11.4%) | 0 (0.0%) |
| 6:00 AM to 6:29 AM | 22 (13.2%) | 0 (0.0%) |
| 6:30 AM to 6:59 AM | 36 (21.6%) | 33 (28.7%) |
| 7:00 AM to 7:29 AM | 39 (23.4%) | 15 (13.0%) |
| 7:30 AM to 7:59 AM | 9 (5.4%) | 11 (9.6%) |
| 8:00 AM to 8:29 AM | 0 (0.0%) | 0 (0.0%) |
| 8:30 AM to 8:59 AM | 0 (0.0%) | 40 (34.8%) |
| 9:00 AM to 9:59 AM | 25 (15.0%) | 0 (0.0%) |
| 10:00 AM to 10:59 AM | 0 (0.0%) | 0 (0.0%) |
| 11:00 AM to 11:59 AM | 9 (5.4%) | 0 (0.0%) |
| 12:00 PM to 3:59 PM | 0 (0.0%) | 16 (13.9%) |
| 4:00 PM to 11:59 PM | 8 (4.8%) | 0 (0.0%) |
| Total | 167 (100.0%) | 115 (100.0%) |
Housing Occupancy in Black Eagle
Occupancy by Ownership in Black Eagle
Of the total 327 dwellings in Black Eagle, owner-occupied units account for 191 (58.4%), while renter-occupied units make up 136 (41.6%).
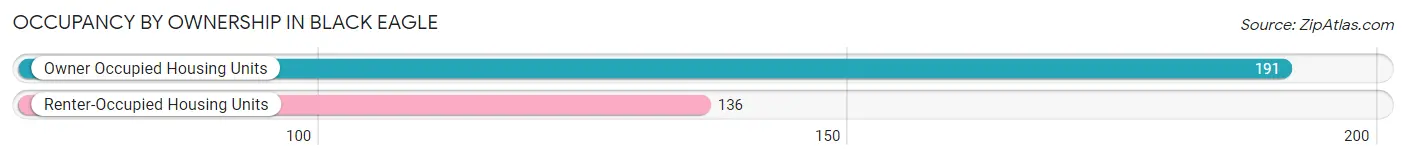
| Occupancy | # Housing Units | % Housing Units |
| Owner Occupied Housing Units | 191 | 58.4% |
| Renter-Occupied Housing Units | 136 | 41.6% |
| Total Occupied Housing Units | 327 | 100.0% |
Occupancy by Household Size in Black Eagle
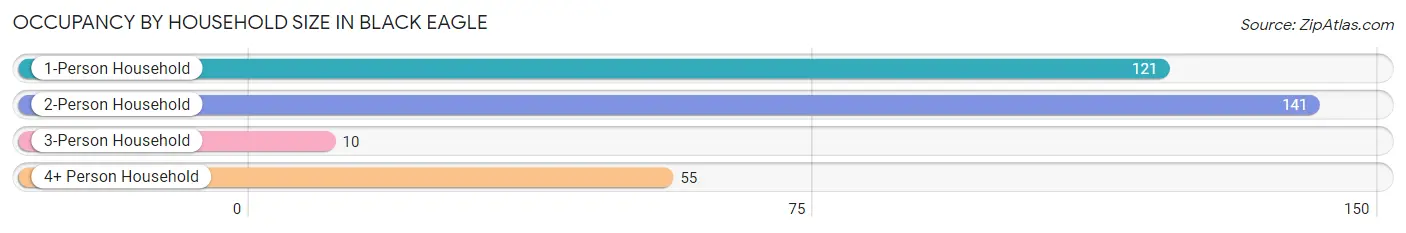
| Household Size | # Housing Units | % Housing Units |
| 1-Person Household | 121 | 37.0% |
| 2-Person Household | 141 | 43.1% |
| 3-Person Household | 10 | 3.1% |
| 4+ Person Household | 55 | 16.8% |
| Total Housing Units | 327 | 100.0% |
Occupancy by Ownership by Household Size in Black Eagle
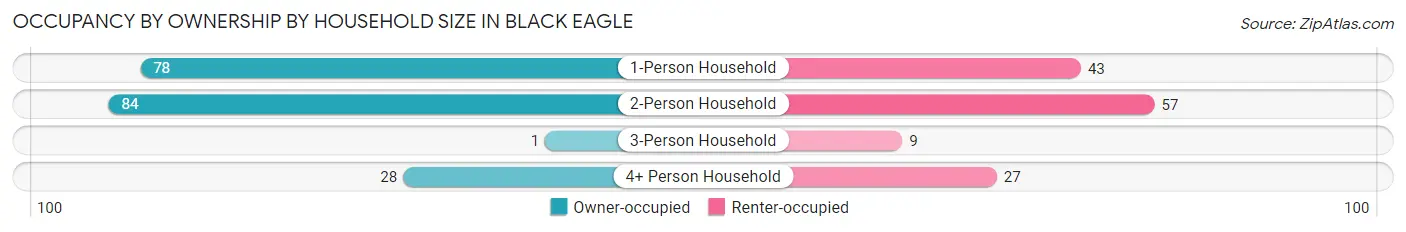
| Household Size | Owner-occupied | Renter-occupied |
| 1-Person Household | 78 (64.5%) | 43 (35.5%) |
| 2-Person Household | 84 (59.6%) | 57 (40.4%) |
| 3-Person Household | 1 (10.0%) | 9 (90.0%) |
| 4+ Person Household | 28 (50.9%) | 27 (49.1%) |
| Total Housing Units | 191 (58.4%) | 136 (41.6%) |
Occupancy by Educational Attainment in Black Eagle
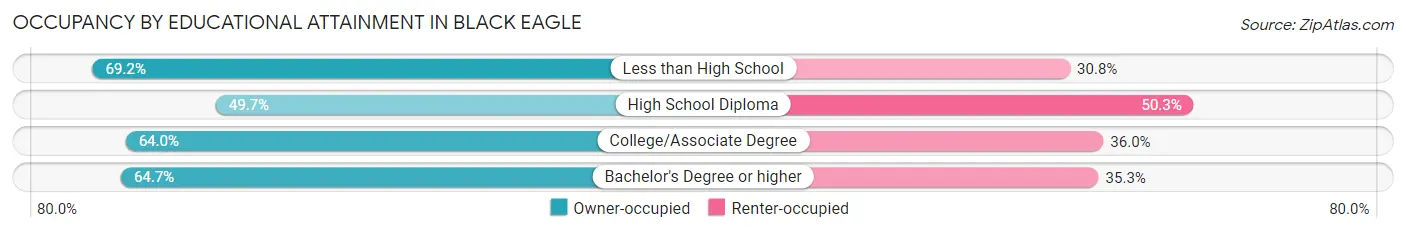
| Household Size | Owner-occupied | Renter-occupied |
| Less than High School | 36 (69.2%) | 16 (30.8%) |
| High School Diploma | 73 (49.7%) | 74 (50.3%) |
| College/Associate Degree | 71 (64.0%) | 40 (36.0%) |
| Bachelor's Degree or higher | 11 (64.7%) | 6 (35.3%) |
Occupancy by Age of Householder in Black Eagle
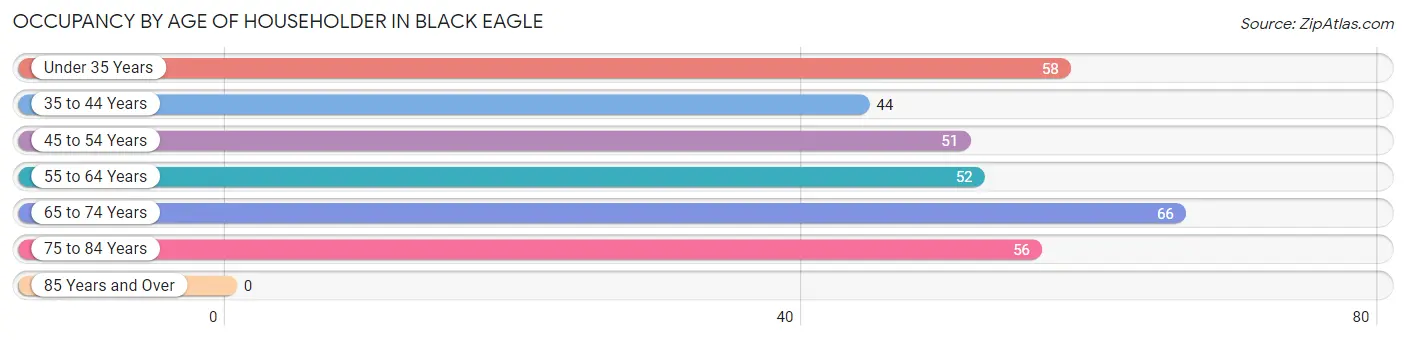
| Age Bracket | # Households | % Households |
| Under 35 Years | 58 | 17.7% |
| 35 to 44 Years | 44 | 13.5% |
| 45 to 54 Years | 51 | 15.6% |
| 55 to 64 Years | 52 | 15.9% |
| 65 to 74 Years | 66 | 20.2% |
| 75 to 84 Years | 56 | 17.1% |
| 85 Years and Over | 0 | 0.0% |
| Total | 327 | 100.0% |
Housing Finances in Black Eagle
Median Income by Occupancy in Black Eagle
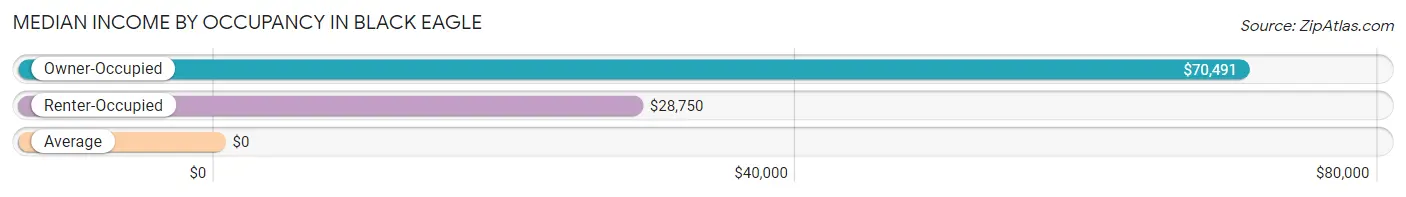
| Occupancy Type | # Households | Median Income |
| Owner-Occupied | 191 (58.4%) | $70,491 |
| Renter-Occupied | 136 (41.6%) | $28,750 |
| Average | 327 (100.0%) | $0 |
Occupancy by Householder Income Bracket in Black Eagle
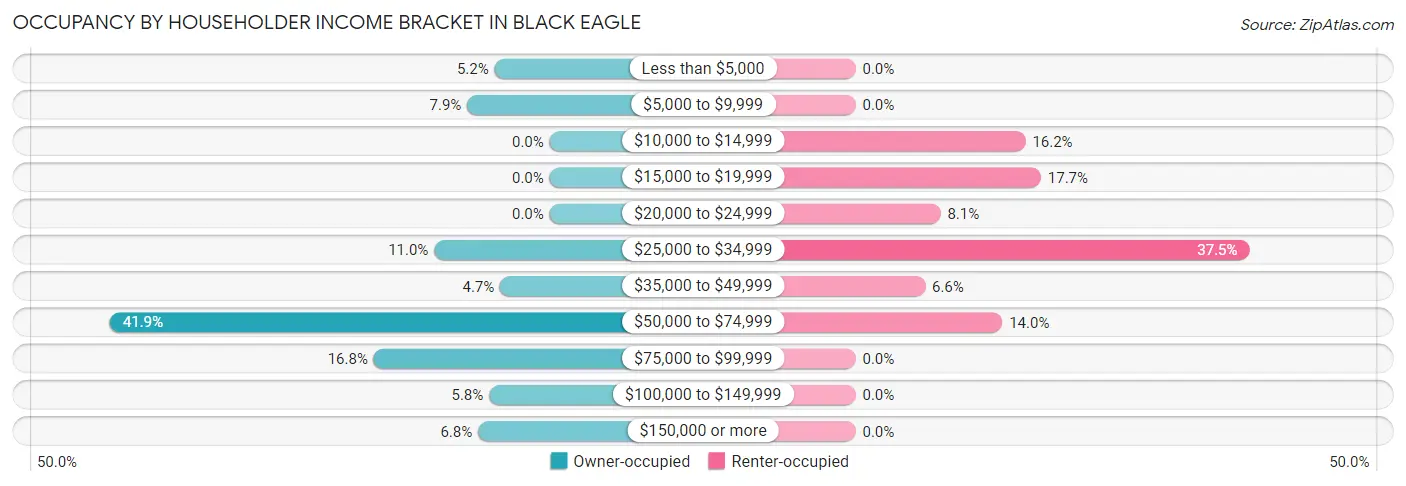
| Income Bracket | Owner-occupied | Renter-occupied |
| Less than $5,000 | 10 (5.2%) | 0 (0.0%) |
| $5,000 to $9,999 | 15 (7.9%) | 0 (0.0%) |
| $10,000 to $14,999 | 0 (0.0%) | 22 (16.2%) |
| $15,000 to $19,999 | 0 (0.0%) | 24 (17.6%) |
| $20,000 to $24,999 | 0 (0.0%) | 11 (8.1%) |
| $25,000 to $34,999 | 21 (11.0%) | 51 (37.5%) |
| $35,000 to $49,999 | 9 (4.7%) | 9 (6.6%) |
| $50,000 to $74,999 | 80 (41.9%) | 19 (14.0%) |
| $75,000 to $99,999 | 32 (16.8%) | 0 (0.0%) |
| $100,000 to $149,999 | 11 (5.8%) | 0 (0.0%) |
| $150,000 or more | 13 (6.8%) | 0 (0.0%) |
| Total | 191 (100.0%) | 136 (100.0%) |
Monthly Housing Cost Tiers in Black Eagle
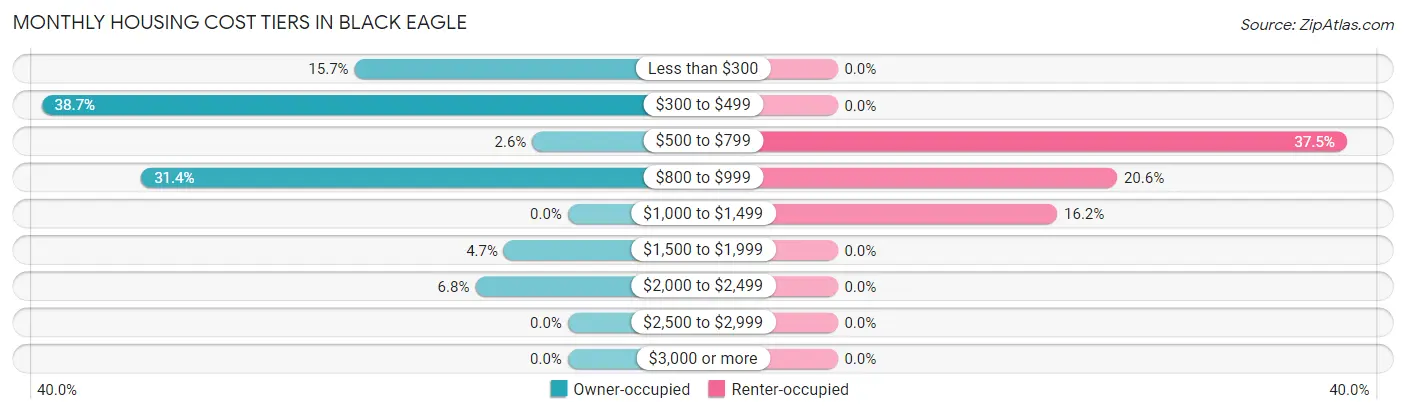
| Monthly Cost | Owner-occupied | Renter-occupied |
| Less than $300 | 30 (15.7%) | 0 (0.0%) |
| $300 to $499 | 74 (38.7%) | 0 (0.0%) |
| $500 to $799 | 5 (2.6%) | 51 (37.5%) |
| $800 to $999 | 60 (31.4%) | 28 (20.6%) |
| $1,000 to $1,499 | 0 (0.0%) | 22 (16.2%) |
| $1,500 to $1,999 | 9 (4.7%) | 0 (0.0%) |
| $2,000 to $2,499 | 13 (6.8%) | 0 (0.0%) |
| $2,500 to $2,999 | 0 (0.0%) | 0 (0.0%) |
| $3,000 or more | 0 (0.0%) | 0 (0.0%) |
| Total | 191 (100.0%) | 136 (100.0%) |
Physical Housing Characteristics in Black Eagle
Housing Structures in Black Eagle
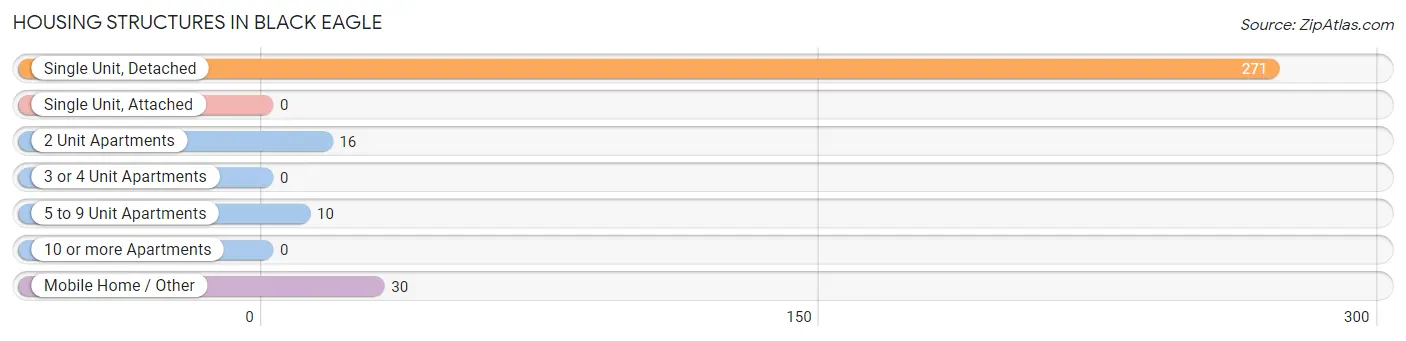
| Structure Type | # Housing Units | % Housing Units |
| Single Unit, Detached | 271 | 82.9% |
| Single Unit, Attached | 0 | 0.0% |
| 2 Unit Apartments | 16 | 4.9% |
| 3 or 4 Unit Apartments | 0 | 0.0% |
| 5 to 9 Unit Apartments | 10 | 3.1% |
| 10 or more Apartments | 0 | 0.0% |
| Mobile Home / Other | 30 | 9.2% |
| Total | 327 | 100.0% |
Housing Structures by Occupancy in Black Eagle
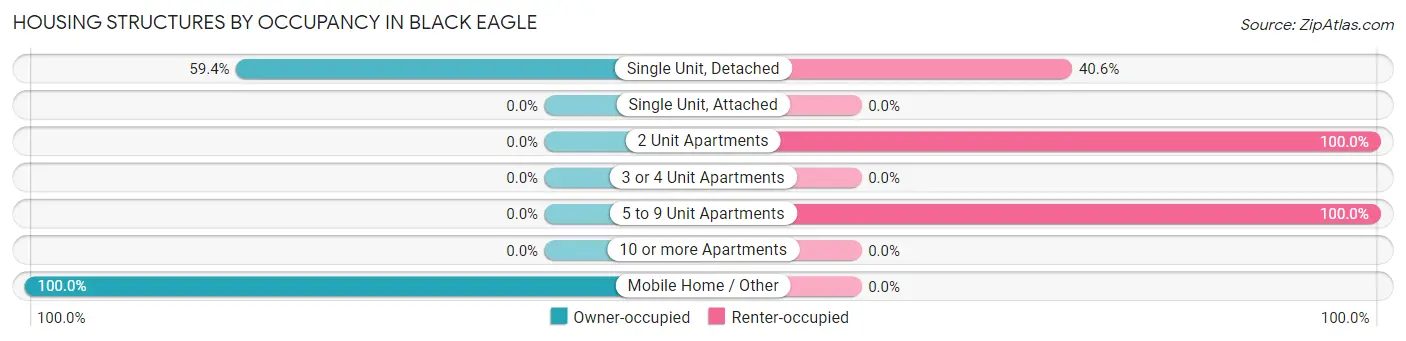
| Structure Type | Owner-occupied | Renter-occupied |
| Single Unit, Detached | 161 (59.4%) | 110 (40.6%) |
| Single Unit, Attached | 0 (0.0%) | 0 (0.0%) |
| 2 Unit Apartments | 0 (0.0%) | 16 (100.0%) |
| 3 or 4 Unit Apartments | 0 (0.0%) | 0 (0.0%) |
| 5 to 9 Unit Apartments | 0 (0.0%) | 10 (100.0%) |
| 10 or more Apartments | 0 (0.0%) | 0 (0.0%) |
| Mobile Home / Other | 30 (100.0%) | 0 (0.0%) |
| Total | 191 (58.4%) | 136 (41.6%) |
Housing Structures by Number of Rooms in Black Eagle
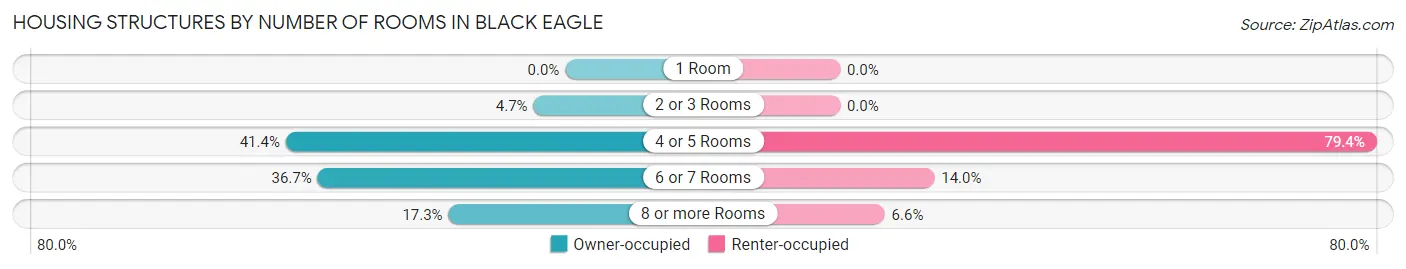
| Number of Rooms | Owner-occupied | Renter-occupied |
| 1 Room | 0 (0.0%) | 0 (0.0%) |
| 2 or 3 Rooms | 9 (4.7%) | 0 (0.0%) |
| 4 or 5 Rooms | 79 (41.4%) | 108 (79.4%) |
| 6 or 7 Rooms | 70 (36.6%) | 19 (14.0%) |
| 8 or more Rooms | 33 (17.3%) | 9 (6.6%) |
| Total | 191 (100.0%) | 136 (100.0%) |
Housing Structure by Heating Type in Black Eagle
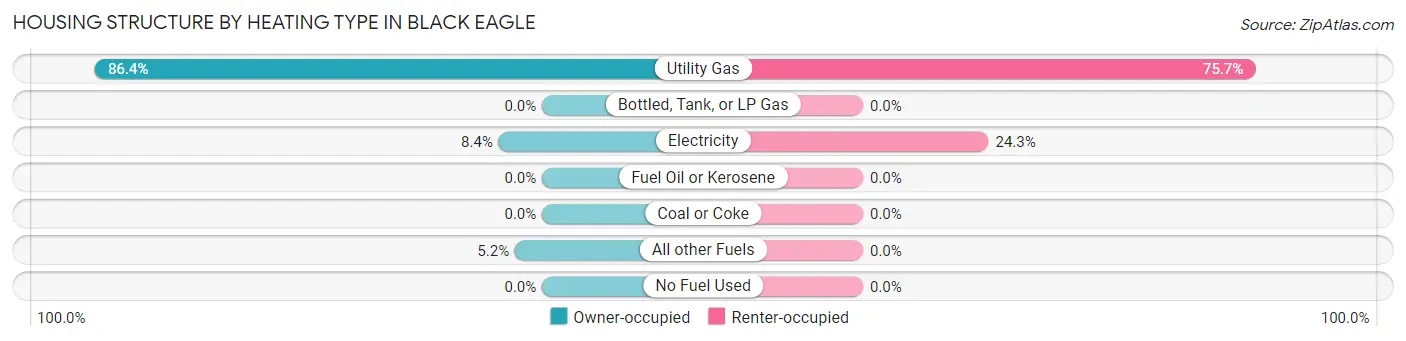
| Heating Type | Owner-occupied | Renter-occupied |
| Utility Gas | 165 (86.4%) | 103 (75.7%) |
| Bottled, Tank, or LP Gas | 0 (0.0%) | 0 (0.0%) |
| Electricity | 16 (8.4%) | 33 (24.3%) |
| Fuel Oil or Kerosene | 0 (0.0%) | 0 (0.0%) |
| Coal or Coke | 0 (0.0%) | 0 (0.0%) |
| All other Fuels | 10 (5.2%) | 0 (0.0%) |
| No Fuel Used | 0 (0.0%) | 0 (0.0%) |
| Total | 191 (100.0%) | 136 (100.0%) |
Household Vehicle Usage in Black Eagle
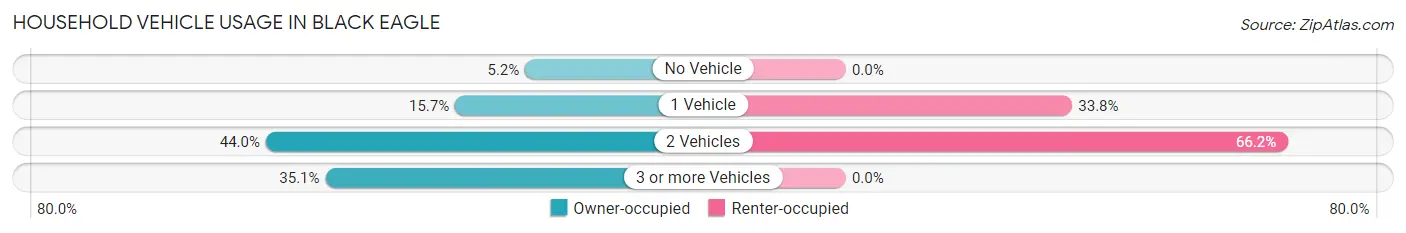
| Vehicles per Household | Owner-occupied | Renter-occupied |
| No Vehicle | 10 (5.2%) | 0 (0.0%) |
| 1 Vehicle | 30 (15.7%) | 46 (33.8%) |
| 2 Vehicles | 84 (44.0%) | 90 (66.2%) |
| 3 or more Vehicles | 67 (35.1%) | 0 (0.0%) |
| Total | 191 (100.0%) | 136 (100.0%) |
Real Estate & Mortgages in Black Eagle
Real Estate and Mortgage Overview in Black Eagle
| Characteristic | Without Mortgage | With Mortgage |
| Housing Units | 109 | 82 |
| Median Property Value | $181,300 | $136,400 |
| Median Household Income | $54,625 | $13 |
| Monthly Housing Costs | $363 | $0 |
| Real Estate Taxes | $1,773 | $0 |
Property Value by Mortgage Status in Black Eagle
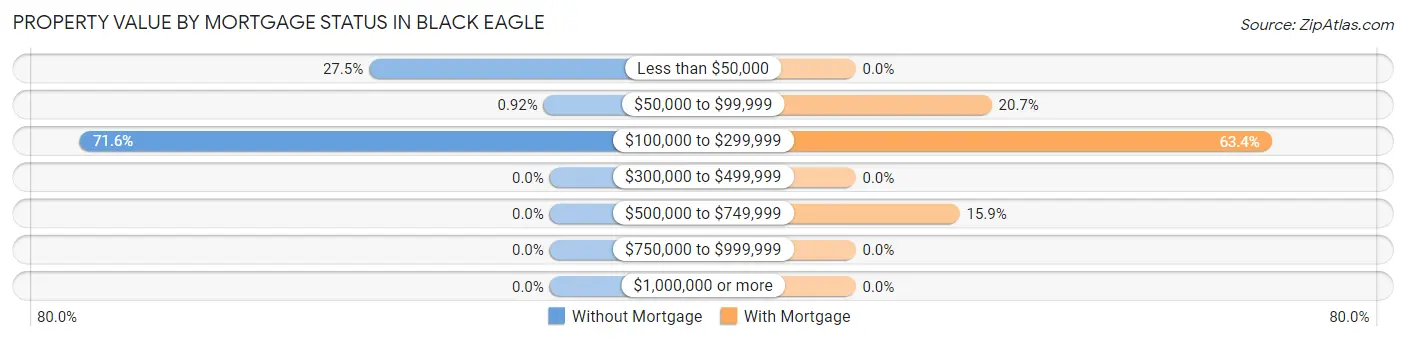
| Property Value | Without Mortgage | With Mortgage |
| Less than $50,000 | 30 (27.5%) | 0 (0.0%) |
| $50,000 to $99,999 | 1 (0.9%) | 17 (20.7%) |
| $100,000 to $299,999 | 78 (71.6%) | 52 (63.4%) |
| $300,000 to $499,999 | 0 (0.0%) | 0 (0.0%) |
| $500,000 to $749,999 | 0 (0.0%) | 13 (15.9%) |
| $750,000 to $999,999 | 0 (0.0%) | 0 (0.0%) |
| $1,000,000 or more | 0 (0.0%) | 0 (0.0%) |
| Total | 109 (100.0%) | 82 (100.0%) |
Household Income by Mortgage Status in Black Eagle
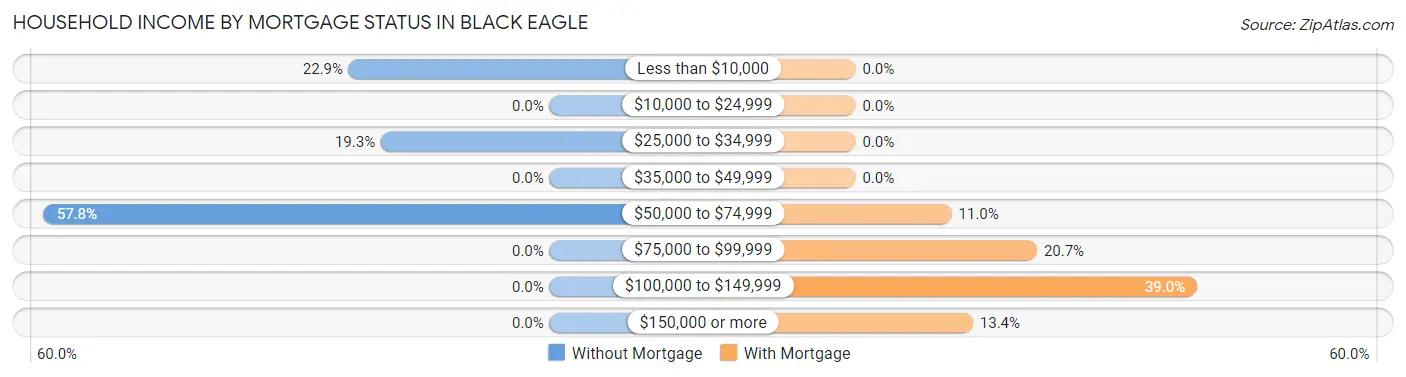
| Household Income | Without Mortgage | With Mortgage |
| Less than $10,000 | 25 (22.9%) | 0 (0.0%) |
| $10,000 to $24,999 | 0 (0.0%) | 0 (0.0%) |
| $25,000 to $34,999 | 21 (19.3%) | 0 (0.0%) |
| $35,000 to $49,999 | 0 (0.0%) | 0 (0.0%) |
| $50,000 to $74,999 | 63 (57.8%) | 9 (11.0%) |
| $75,000 to $99,999 | 0 (0.0%) | 17 (20.7%) |
| $100,000 to $149,999 | 0 (0.0%) | 32 (39.0%) |
| $150,000 or more | 0 (0.0%) | 11 (13.4%) |
| Total | 109 (100.0%) | 82 (100.0%) |
Property Value to Household Income Ratio in Black Eagle
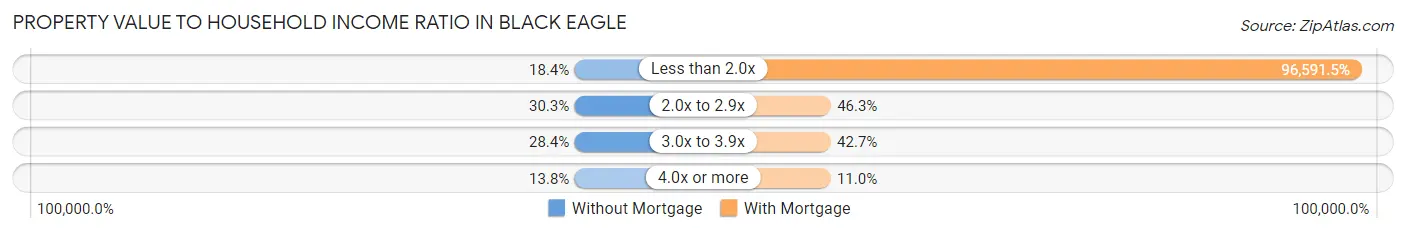
| Value-to-Income Ratio | Without Mortgage | With Mortgage |
| Less than 2.0x | 20 (18.3%) | 79,205 (96,591.5%) |
| 2.0x to 2.9x | 33 (30.3%) | 38 (46.3%) |
| 3.0x to 3.9x | 31 (28.4%) | 35 (42.7%) |
| 4.0x or more | 15 (13.8%) | 9 (11.0%) |
| Total | 109 (100.0%) | 82 (100.0%) |
Real Estate Taxes by Mortgage Status in Black Eagle
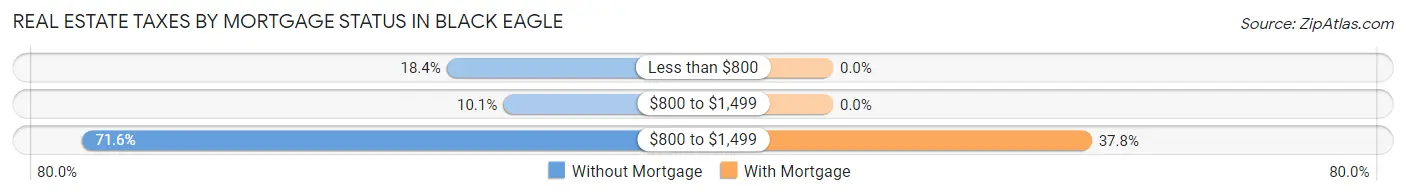
| Property Taxes | Without Mortgage | With Mortgage |
| Less than $800 | 20 (18.3%) | 0 (0.0%) |
| $800 to $1,499 | 11 (10.1%) | 0 (0.0%) |
| $800 to $1,499 | 78 (71.6%) | 31 (37.8%) |
| Total | 109 (100.0%) | 82 (100.0%) |
Health & Disability in Black Eagle
Health Insurance Coverage by Age in Black Eagle
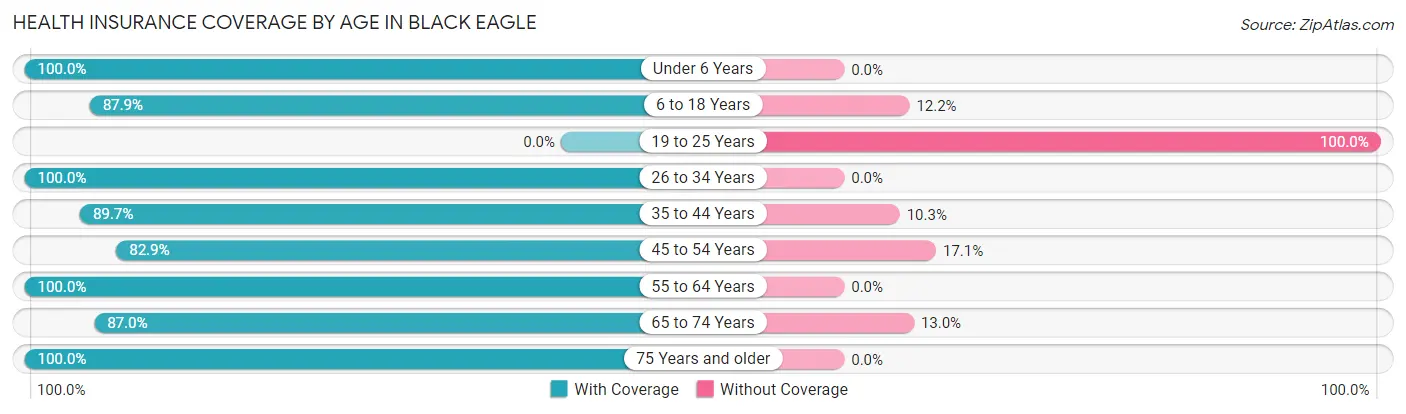
| Age Bracket | With Coverage | Without Coverage |
| Under 6 Years | 19 (100.0%) | 0 (0.0%) |
| 6 to 18 Years | 94 (87.8%) | 13 (12.1%) |
| 19 to 25 Years | 0 (0.0%) | 15 (100.0%) |
| 26 to 34 Years | 58 (100.0%) | 0 (0.0%) |
| 35 to 44 Years | 104 (89.7%) | 12 (10.3%) |
| 45 to 54 Years | 63 (82.9%) | 13 (17.1%) |
| 55 to 64 Years | 131 (100.0%) | 0 (0.0%) |
| 65 to 74 Years | 67 (87.0%) | 10 (13.0%) |
| 75 Years and older | 73 (100.0%) | 0 (0.0%) |
| Total | 609 (90.6%) | 63 (9.4%) |
Health Insurance Coverage by Citizenship Status in Black Eagle
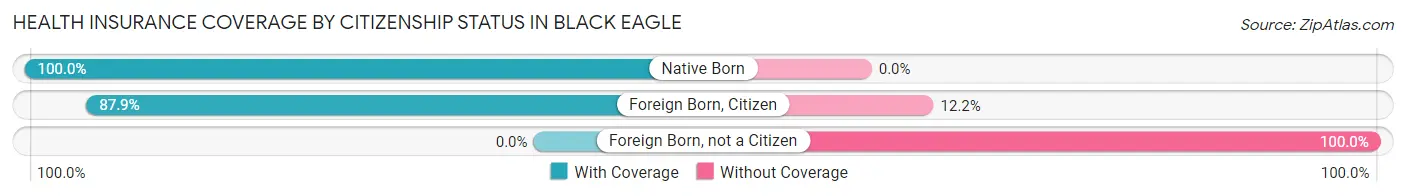
| Citizenship Status | With Coverage | Without Coverage |
| Native Born | 19 (100.0%) | 0 (0.0%) |
| Foreign Born, Citizen | 94 (87.8%) | 13 (12.1%) |
| Foreign Born, not a Citizen | 0 (0.0%) | 15 (100.0%) |
Health Insurance Coverage by Household Income in Black Eagle
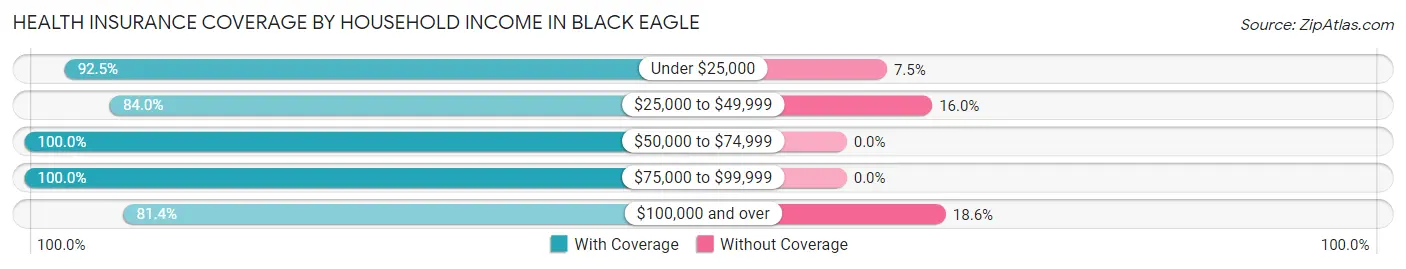
| Household Income | With Coverage | Without Coverage |
| Under $25,000 | 123 (92.5%) | 10 (7.5%) |
| $25,000 to $49,999 | 210 (84.0%) | 40 (16.0%) |
| $50,000 to $74,999 | 179 (100.0%) | 0 (0.0%) |
| $75,000 to $99,999 | 40 (100.0%) | 0 (0.0%) |
| $100,000 and over | 57 (81.4%) | 13 (18.6%) |
Public vs Private Health Insurance Coverage by Age in Black Eagle
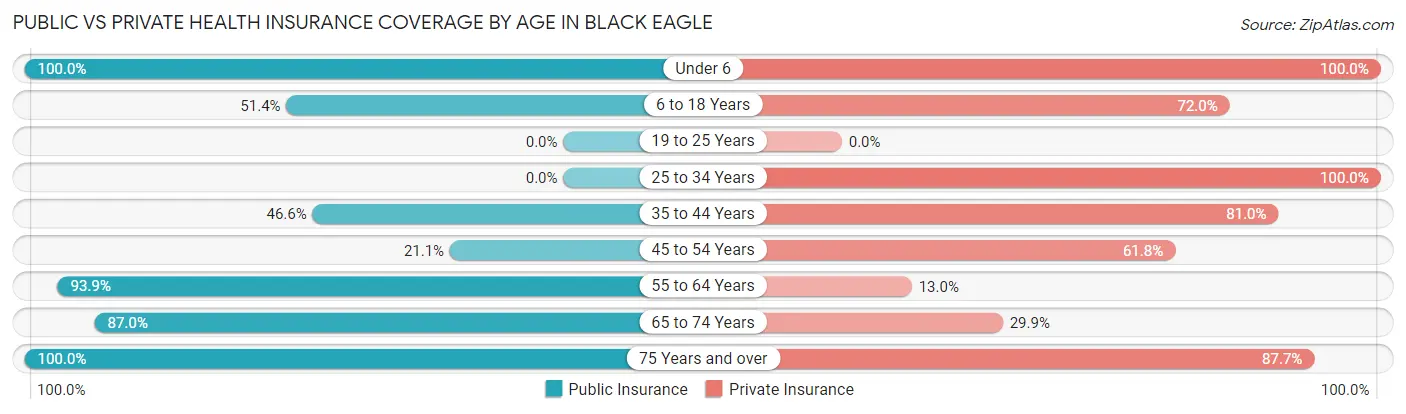
| Age Bracket | Public Insurance | Private Insurance |
| Under 6 | 19 (100.0%) | 19 (100.0%) |
| 6 to 18 Years | 55 (51.4%) | 77 (72.0%) |
| 19 to 25 Years | 0 (0.0%) | 0 (0.0%) |
| 25 to 34 Years | 0 (0.0%) | 58 (100.0%) |
| 35 to 44 Years | 54 (46.6%) | 94 (81.0%) |
| 45 to 54 Years | 16 (21.0%) | 47 (61.8%) |
| 55 to 64 Years | 123 (93.9%) | 17 (13.0%) |
| 65 to 74 Years | 67 (87.0%) | 23 (29.9%) |
| 75 Years and over | 73 (100.0%) | 64 (87.7%) |
| Total | 407 (60.6%) | 399 (59.4%) |
Disability Status by Sex by Age in Black Eagle
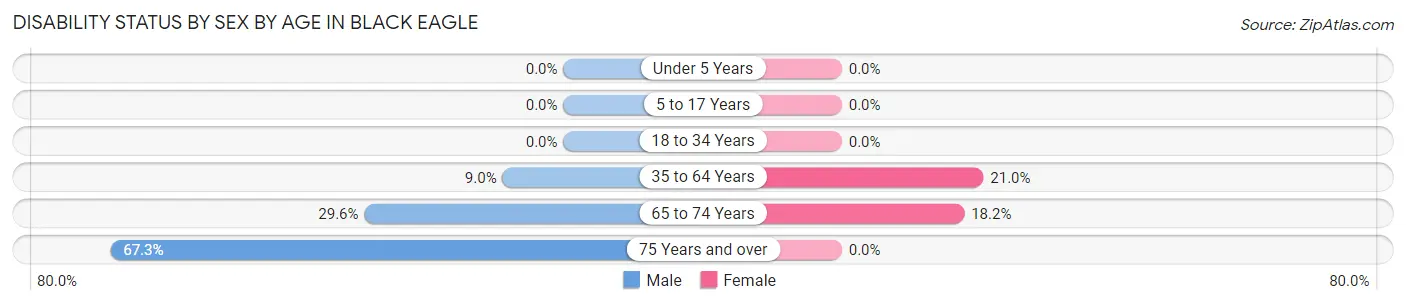
| Age Bracket | Male | Female |
| Under 5 Years | 0 (0.0%) | 0 (0.0%) |
| 5 to 17 Years | 0 (0.0%) | 0 (0.0%) |
| 18 to 34 Years | 0 (0.0%) | 0 (0.0%) |
| 35 to 64 Years | 15 (9.0%) | 33 (21.0%) |
| 65 to 74 Years | 13 (29.5%) | 6 (18.2%) |
| 75 Years and over | 37 (67.3%) | 0 (0.0%) |
Disability Class by Sex by Age in Black Eagle
Disability Class: Hearing Difficulty
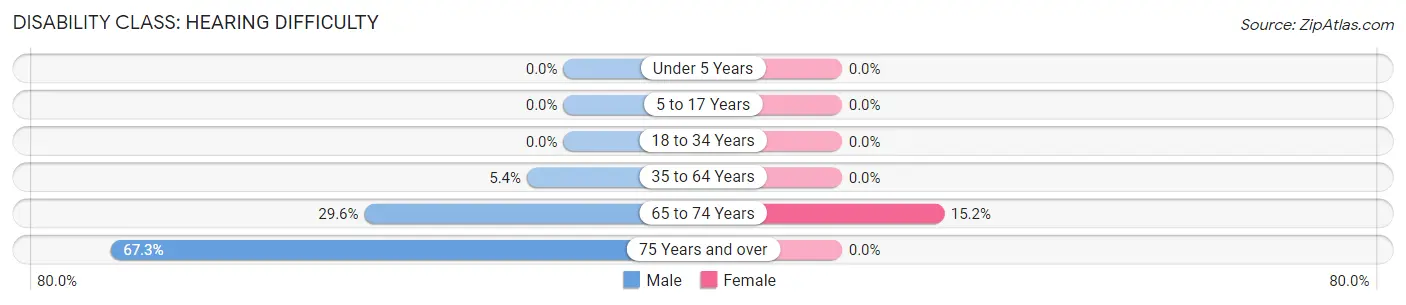
| Age Bracket | Male | Female |
| Under 5 Years | 0 (0.0%) | 0 (0.0%) |
| 5 to 17 Years | 0 (0.0%) | 0 (0.0%) |
| 18 to 34 Years | 0 (0.0%) | 0 (0.0%) |
| 35 to 64 Years | 9 (5.4%) | 0 (0.0%) |
| 65 to 74 Years | 13 (29.5%) | 5 (15.1%) |
| 75 Years and over | 37 (67.3%) | 0 (0.0%) |
Disability Class: Vision Difficulty
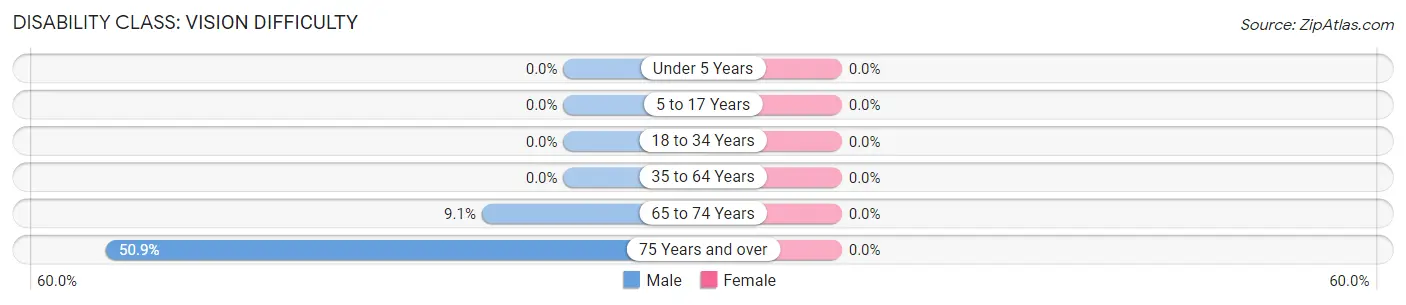
| Age Bracket | Male | Female |
| Under 5 Years | 0 (0.0%) | 0 (0.0%) |
| 5 to 17 Years | 0 (0.0%) | 0 (0.0%) |
| 18 to 34 Years | 0 (0.0%) | 0 (0.0%) |
| 35 to 64 Years | 0 (0.0%) | 0 (0.0%) |
| 65 to 74 Years | 4 (9.1%) | 0 (0.0%) |
| 75 Years and over | 28 (50.9%) | 0 (0.0%) |
Disability Class: Cognitive Difficulty
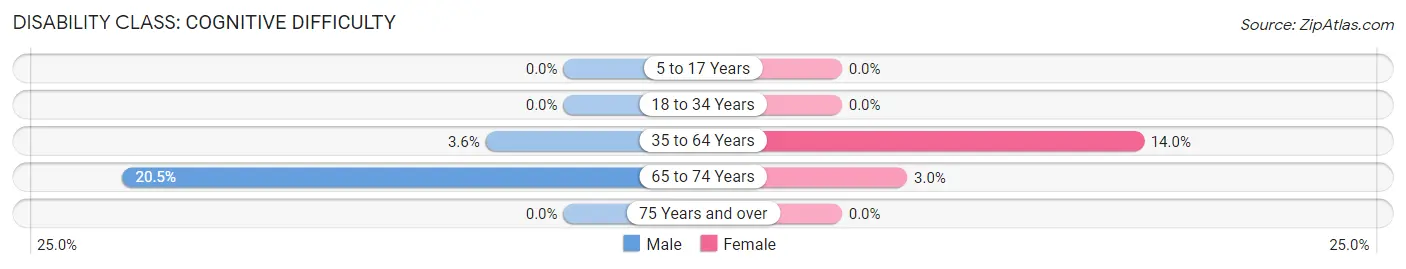
| Age Bracket | Male | Female |
| 5 to 17 Years | 0 (0.0%) | 0 (0.0%) |
| 18 to 34 Years | 0 (0.0%) | 0 (0.0%) |
| 35 to 64 Years | 6 (3.6%) | 22 (14.0%) |
| 65 to 74 Years | 9 (20.4%) | 1 (3.0%) |
| 75 Years and over | 0 (0.0%) | 0 (0.0%) |
Disability Class: Ambulatory Difficulty
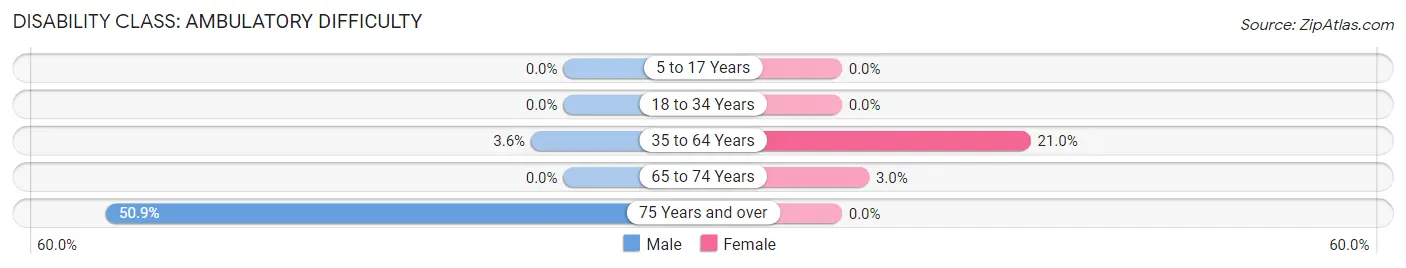
| Age Bracket | Male | Female |
| 5 to 17 Years | 0 (0.0%) | 0 (0.0%) |
| 18 to 34 Years | 0 (0.0%) | 0 (0.0%) |
| 35 to 64 Years | 6 (3.6%) | 33 (21.0%) |
| 65 to 74 Years | 0 (0.0%) | 1 (3.0%) |
| 75 Years and over | 28 (50.9%) | 0 (0.0%) |
Disability Class: Self-Care Difficulty
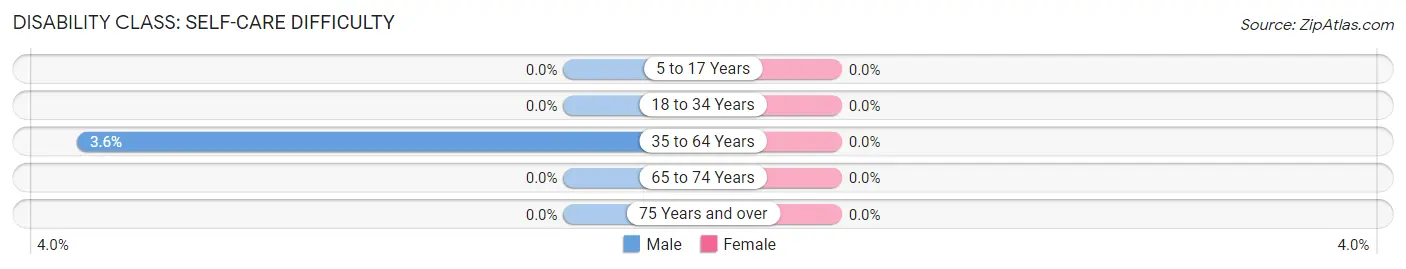
| Age Bracket | Male | Female |
| 5 to 17 Years | 0 (0.0%) | 0 (0.0%) |
| 18 to 34 Years | 0 (0.0%) | 0 (0.0%) |
| 35 to 64 Years | 6 (3.6%) | 0 (0.0%) |
| 65 to 74 Years | 0 (0.0%) | 0 (0.0%) |
| 75 Years and over | 0 (0.0%) | 0 (0.0%) |
Technology Access in Black Eagle
Computing Device Access in Black Eagle
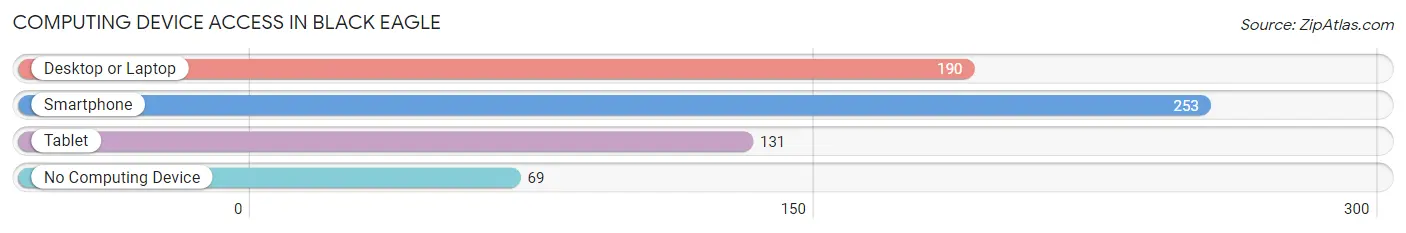
| Device Type | # Households | % Households |
| Desktop or Laptop | 190 | 58.1% |
| Smartphone | 253 | 77.4% |
| Tablet | 131 | 40.1% |
| No Computing Device | 69 | 21.1% |
| Total | 327 | 100.0% |
Internet Access in Black Eagle
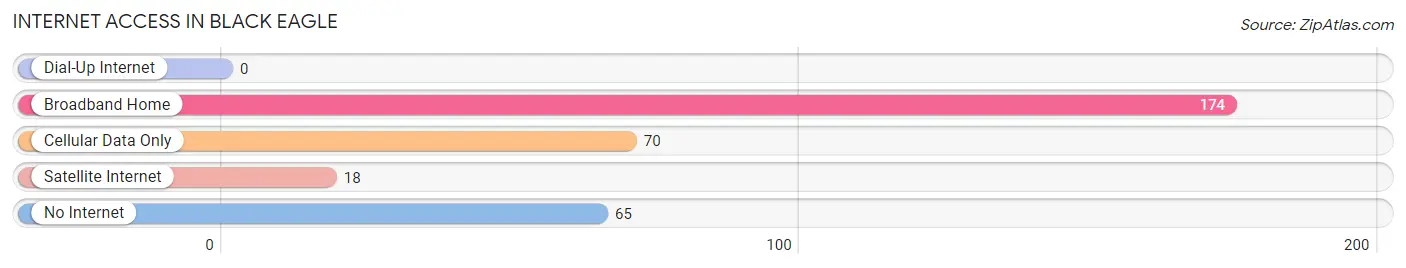
| Internet Type | # Households | % Households |
| Dial-Up Internet | 0 | 0.0% |
| Broadband Home | 174 | 53.2% |
| Cellular Data Only | 70 | 21.4% |
| Satellite Internet | 18 | 5.5% |
| No Internet | 65 | 19.9% |
| Total | 327 | 100.0% |
Black Eagle Summary
Introduction
Black Eagle is a small city located in Cascade County, Montana. It is situated on the banks of the Missouri River, just north of Great Falls. The city was founded in 1883 and has a population of approximately 2,500 people. The city is known for its rich history, diverse geography, vibrant economy, and unique demographics.
History
Black Eagle was founded in 1883 by a group of settlers from the Blackfeet Nation. The city was named after the Blackfeet chief, Black Eagle. The settlers were attracted to the area due to its abundance of natural resources, including timber, coal, and water. The city quickly grew and became an important trading center for the region.
In the early 1900s, the city experienced a period of rapid growth. The Great Northern Railway was built through the city, connecting it to other parts of Montana and the rest of the country. This allowed for the development of new industries, such as lumber mills, coal mines, and other businesses.
The city continued to grow throughout the 20th century. In the 1950s, the city was home to a large military base, which provided jobs and economic stability to the area. The base was closed in the 1970s, but the city continued to thrive.
Geography
Black Eagle is located in Cascade County, Montana. The city is situated on the banks of the Missouri River, just north of Great Falls. The city is surrounded by rolling hills and mountains, providing a beautiful backdrop for the city. The city is also home to several parks and recreational areas, including Black Eagle Falls and Black Eagle Lake.
The city has a total area of 4.2 square miles, with a population density of 590 people per square mile. The city is located at an elevation of 3,400 feet above sea level.
Economy
Black Eagle has a vibrant economy that is driven by a variety of industries. The city is home to several manufacturing companies, including a paper mill, a furniture factory, and a metal fabrication plant. The city is also home to several retail stores, restaurants, and other businesses.
The city is also home to a large military base, which provides jobs and economic stability to the area. The base is home to several military units, including the Montana Air National Guard.
Demographics
Black Eagle has a population of approximately 2,500 people. The city is predominantly white, with a small percentage of African Americans, Native Americans, and other ethnicities. The median household income is $45,000, and the median age is 37.
Conclusion
Black Eagle is a small city located in Cascade County, Montana. The city is known for its rich history, diverse geography, vibrant economy, and unique demographics. The city is home to several manufacturing companies, retail stores, restaurants, and other businesses. The city is also home to a large military base, which provides jobs and economic stability to the area. Black Eagle has a population of approximately 2,500 people, with a median household income of $45,000 and a median age of 37.
Common Questions
What is Per Capita Income in Black Eagle?
Per Capita income in Black Eagle is $25,410.
What is the Median Family Income in Black Eagle?
Median Family Income in Black Eagle is $35,278.
What is Inequality or Gini Index in Black Eagle?
Inequality or Gini Index in Black Eagle is 0.41.
What is the Total Population of Black Eagle?
Total Population of Black Eagle is 672.
What is the Total Male Population of Black Eagle?
Total Male Population of Black Eagle is 432.
What is the Total Female Population of Black Eagle?
Total Female Population of Black Eagle is 240.
What is the Ratio of Males per 100 Females in Black Eagle?
There are 180.00 Males per 100 Females in Black Eagle.
What is the Ratio of Females per 100 Males in Black Eagle?
There are 55.56 Females per 100 Males in Black Eagle.
What is the Median Population Age in Black Eagle?
Median Population Age in Black Eagle is 45.8 Years.
What is the Average Family Size in Black Eagle
Average Family Size in Black Eagle is 2.7 People.
What is the Average Household Size in Black Eagle
Average Household Size in Black Eagle is 2.1 People.
How Large is the Labor Force in Black Eagle?
There are 293 People in the Labor Forcein in Black Eagle.
What is the Percentage of People in the Labor Force in Black Eagle?
52.4% of People are in the Labor Force in Black Eagle.