Hobson, MT Map & Demographics
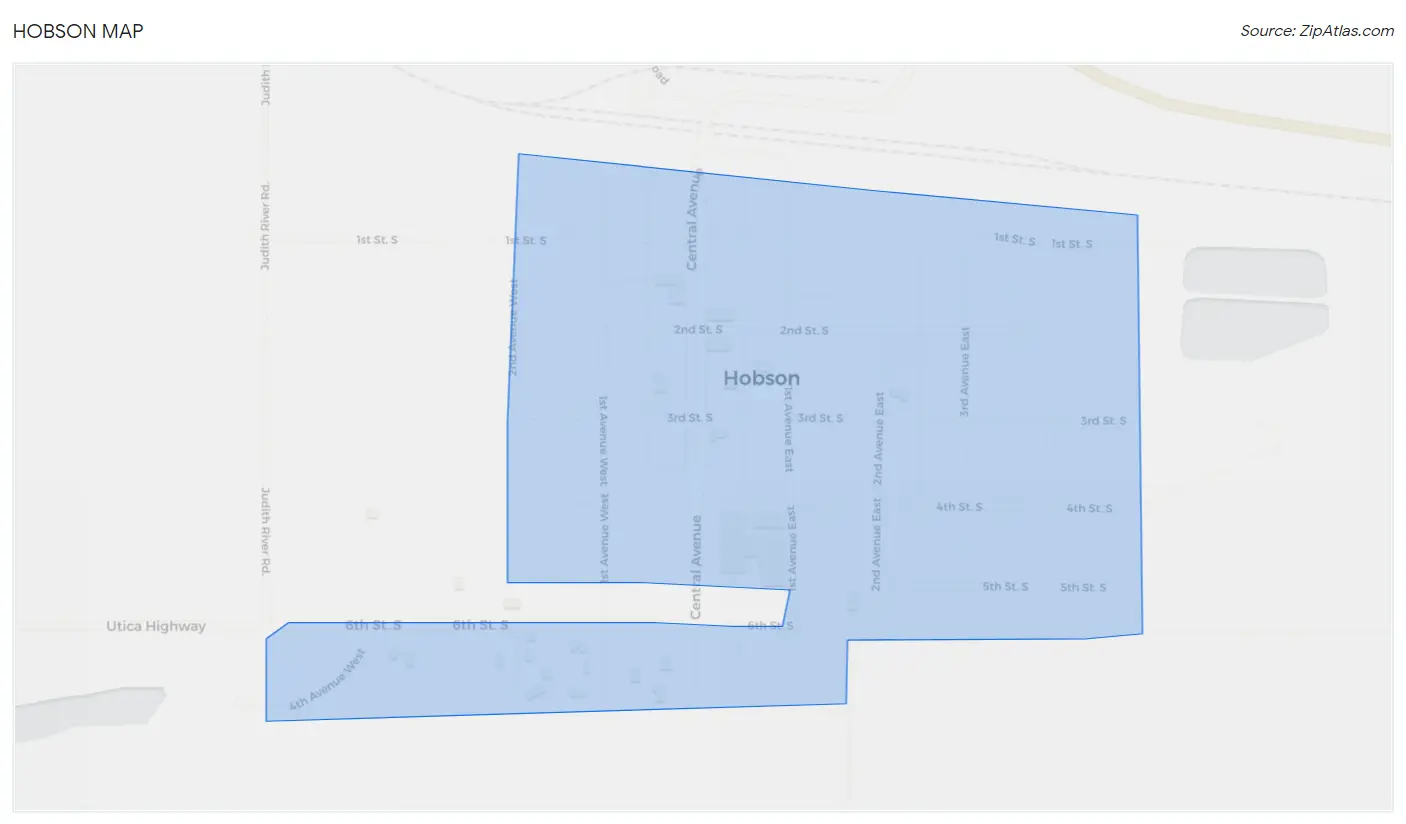
Hobson Map
Hobson Overview
$22,753
PER CAPITA INCOME
$43,125
AVG FAMILY INCOME
$33,542
AVG HOUSEHOLD INCOME
11.4%
WAGE / INCOME GAP [ % ]
88.6¢/ $1
WAGE / INCOME GAP [ $ ]
0.37
INEQUALITY / GINI INDEX
169
TOTAL POPULATION
77
MALE POPULATION
92
FEMALE POPULATION
83.70
MALES / 100 FEMALES
119.48
FEMALES / 100 MALES
65.4
MEDIAN AGE
2.5
AVG FAMILY SIZE
1.8
AVG HOUSEHOLD SIZE
80
LABOR FORCE [ PEOPLE ]
52.6%
PERCENT IN LABOR FORCE
17.5%
UNEMPLOYMENT RATE
Hobson Zip Codes
Hobson Area Codes
Income in Hobson
Income Overview in Hobson
Per Capita Income in Hobson is $22,753, while median incomes of families and households are $43,125 and $33,542 respectively.
| Characteristic | Number | Measure |
| Per Capita Income | 169 | $22,753 |
| Median Family Income | 51 | $43,125 |
| Mean Family Income | 51 | $53,053 |
| Median Household Income | 95 | $33,542 |
| Mean Household Income | 95 | $40,951 |
| Income Deficit | 51 | $0 |
| Wage / Income Gap (%) | 169 | 11.40% |
| Wage / Income Gap ($) | 169 | 88.60¢ per $1 |
| Gini / Inequality Index | 169 | 0.37 |
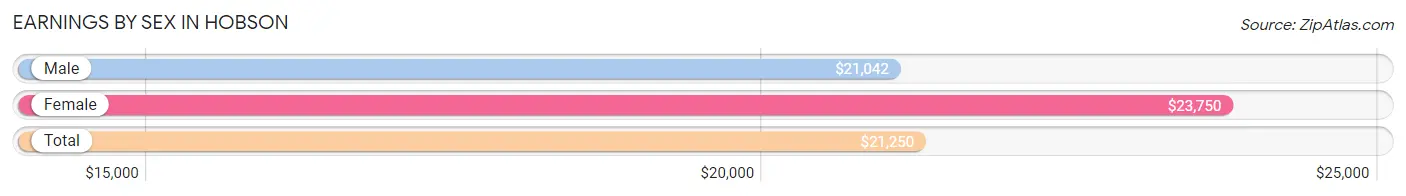
Earnings by Sex in Hobson
Average Earnings in Hobson are $21,250, $21,042 for men and $23,750 for women, a difference of 11.4%.
| Sex | Number | Average Earnings |
| Male | 55 (59.8%) | $21,042 |
| Female | 37 (40.2%) | $23,750 |
| Total | 92 (100.0%) | $21,250 |
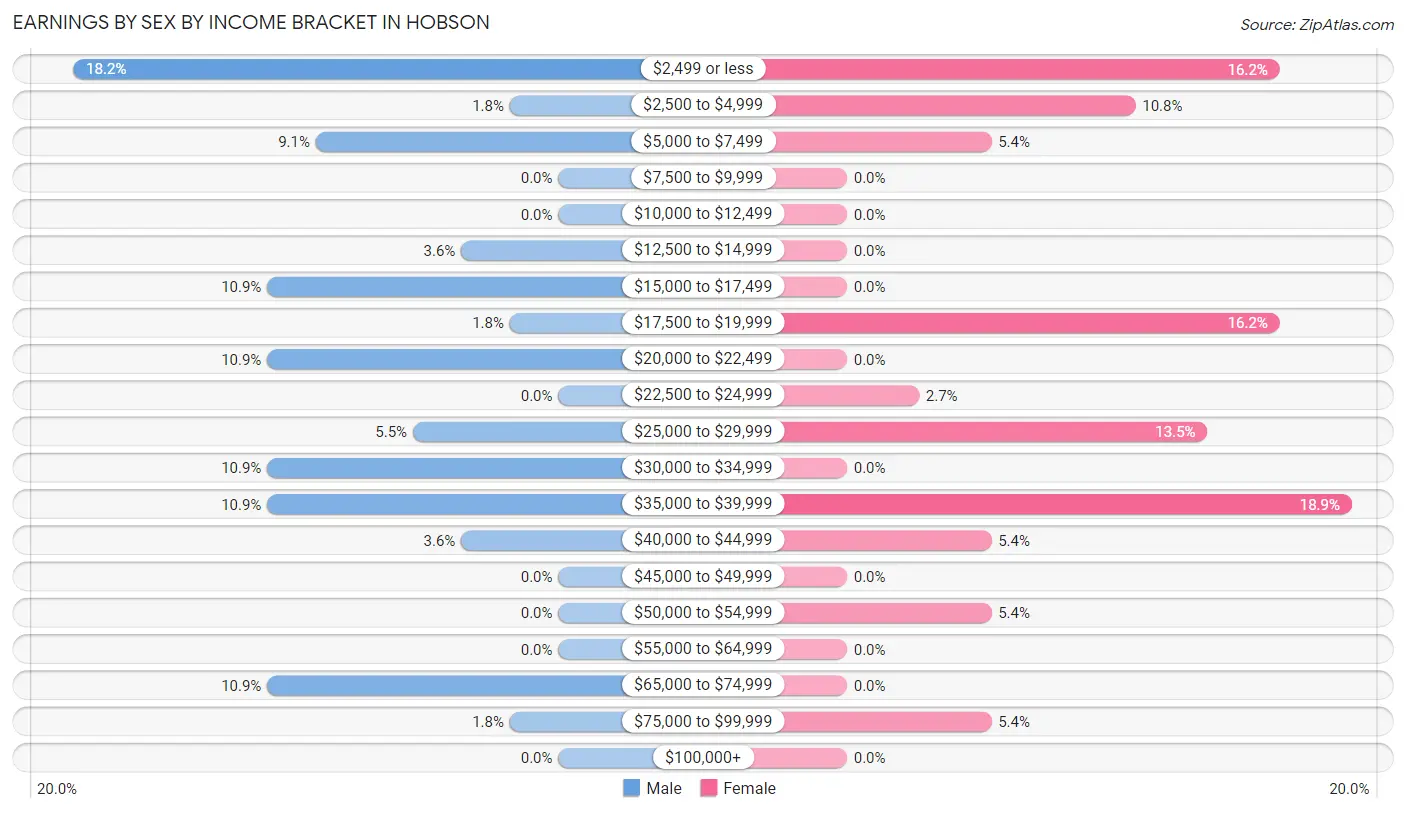
Earnings by Sex by Income Bracket in Hobson
The most common earnings brackets in Hobson are $2,499 or less for men (10 | 18.2%) and $35,000 to $39,999 for women (7 | 18.9%).
| Income | Male | Female |
| $2,499 or less | 10 (18.2%) | 6 (16.2%) |
| $2,500 to $4,999 | 1 (1.8%) | 4 (10.8%) |
| $5,000 to $7,499 | 5 (9.1%) | 2 (5.4%) |
| $7,500 to $9,999 | 0 (0.0%) | 0 (0.0%) |
| $10,000 to $12,499 | 0 (0.0%) | 0 (0.0%) |
| $12,500 to $14,999 | 2 (3.6%) | 0 (0.0%) |
| $15,000 to $17,499 | 6 (10.9%) | 0 (0.0%) |
| $17,500 to $19,999 | 1 (1.8%) | 6 (16.2%) |
| $20,000 to $22,499 | 6 (10.9%) | 0 (0.0%) |
| $22,500 to $24,999 | 0 (0.0%) | 1 (2.7%) |
| $25,000 to $29,999 | 3 (5.4%) | 5 (13.5%) |
| $30,000 to $34,999 | 6 (10.9%) | 0 (0.0%) |
| $35,000 to $39,999 | 6 (10.9%) | 7 (18.9%) |
| $40,000 to $44,999 | 2 (3.6%) | 2 (5.4%) |
| $45,000 to $49,999 | 0 (0.0%) | 0 (0.0%) |
| $50,000 to $54,999 | 0 (0.0%) | 2 (5.4%) |
| $55,000 to $64,999 | 0 (0.0%) | 0 (0.0%) |
| $65,000 to $74,999 | 6 (10.9%) | 0 (0.0%) |
| $75,000 to $99,999 | 1 (1.8%) | 2 (5.4%) |
| $100,000+ | 0 (0.0%) | 0 (0.0%) |
| Total | 55 (100.0%) | 37 (100.0%) |
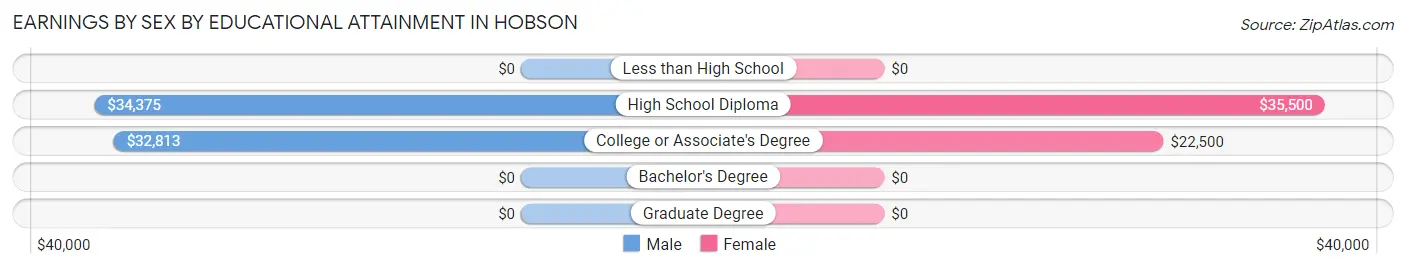
Earnings by Sex by Educational Attainment in Hobson
Average earnings in Hobson are $21,250 for men and $25,625 for women, a difference of 17.1%. Men with an educational attainment of high school diploma enjoy the highest average annual earnings of $34,375, while those with college or associate's degree education earn the least with $32,813. Women with an educational attainment of high school diploma earn the most with the average annual earnings of $35,500, while those with college or associate's degree education have the smallest earnings of $22,500.
| Educational Attainment | Male Income | Female Income |
| Less than High School | - | - |
| High School Diploma | $34,375 | $35,500 |
| College or Associate's Degree | $32,813 | $22,500 |
| Bachelor's Degree | - | - |
| Graduate Degree | - | - |
| Total | $21,250 | $25,625 |
Family Income in Hobson
Family Income Brackets in Hobson
According to the Hobson family income data, there are 15 families falling into the $25,000 to $34,999 income range, which is the most common income bracket and makes up 29.4% of all families.
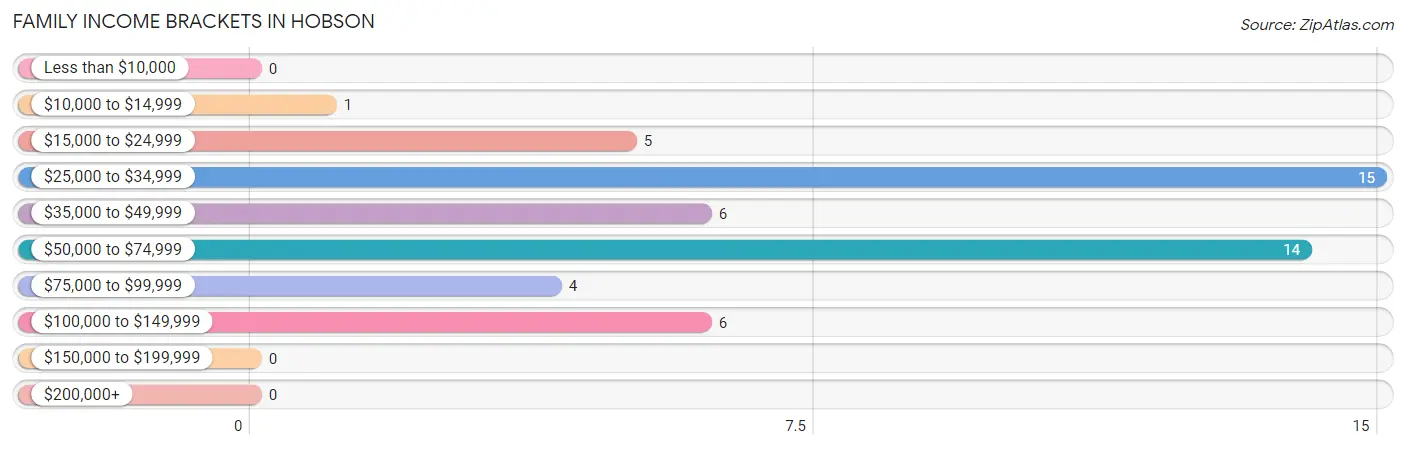
| Income Bracket | # Families | % Families |
| Less than $10,000 | 0 | 0.0% |
| $10,000 to $14,999 | 1 | 2.0% |
| $15,000 to $24,999 | 5 | 9.8% |
| $25,000 to $34,999 | 15 | 29.4% |
| $35,000 to $49,999 | 6 | 11.8% |
| $50,000 to $74,999 | 14 | 27.5% |
| $75,000 to $99,999 | 4 | 7.8% |
| $100,000 to $149,999 | 6 | 11.8% |
| $150,000 to $199,999 | 0 | 0.0% |
| $200,000+ | 0 | 0.0% |
Family Income by Famaliy Size in Hobson
2-person families (41 | 80.4%) account for the highest median family income in Hobson with $37,188 per family, while 2-person families (41 | 80.4%) have the highest median income of $18,594 per family member.
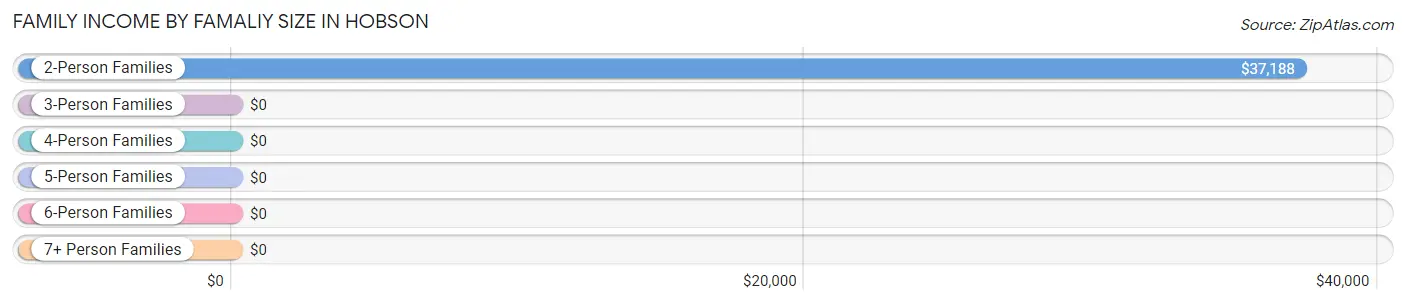
| Income Bracket | # Families | Median Income |
| 2-Person Families | 41 (80.4%) | $37,188 |
| 3-Person Families | 6 (11.8%) | $0 |
| 4-Person Families | 2 (3.9%) | $0 |
| 5-Person Families | 2 (3.9%) | $0 |
| 6-Person Families | 0 (0.0%) | $0 |
| 7+ Person Families | 0 (0.0%) | $0 |
| Total | 51 (100.0%) | $43,125 |
Family Income by Number of Earners in Hobson
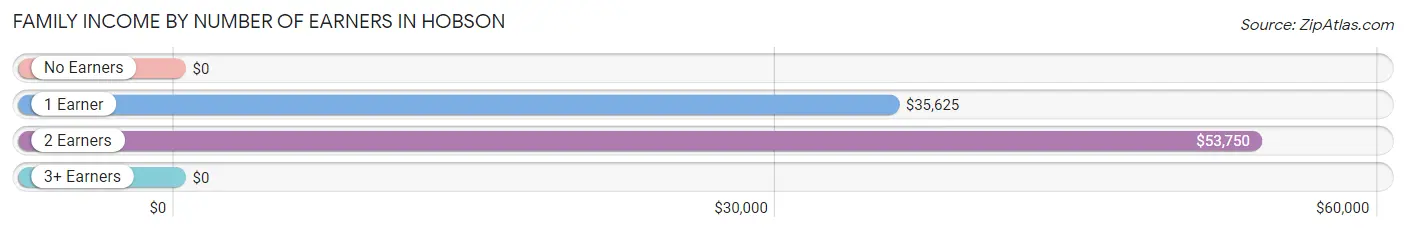
| Number of Earners | # Families | Median Income |
| No Earners | 11 (21.6%) | $0 |
| 1 Earner | 22 (43.1%) | $35,625 |
| 2 Earners | 16 (31.4%) | $53,750 |
| 3+ Earners | 2 (3.9%) | $0 |
| Total | 51 (100.0%) | $43,125 |
Household Income in Hobson
Household Income Brackets in Hobson
With 39 households falling in the category, the $25,000 to $34,999 income range is the most frequent in Hobson, accounting for 41.0% of all households.
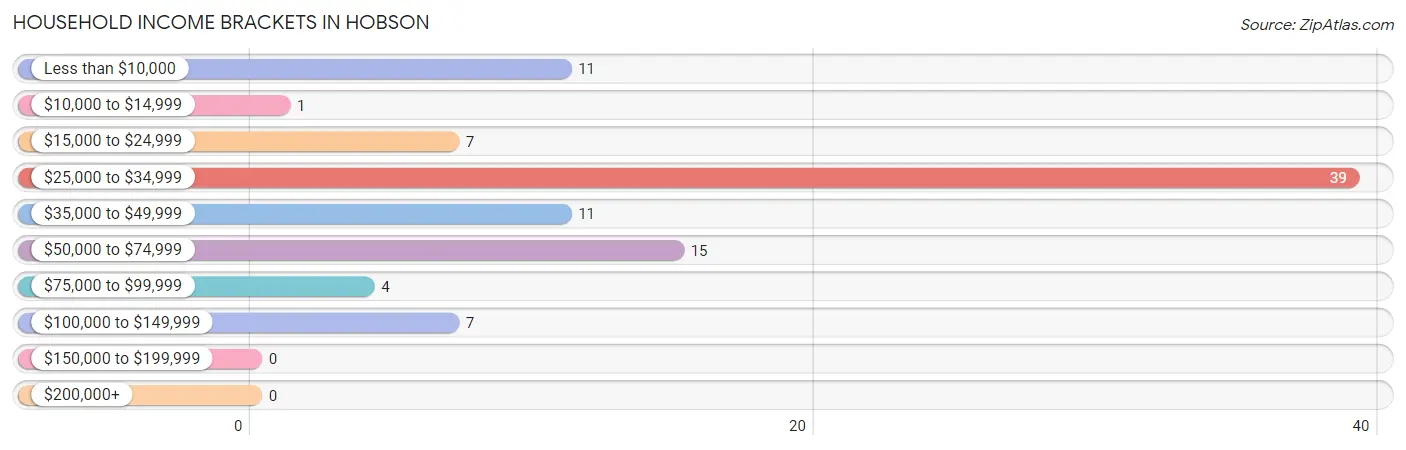
| Income Bracket | # Households | % Households |
| Less than $10,000 | 11 | 11.6% |
| $10,000 to $14,999 | 1 | 1.1% |
| $15,000 to $24,999 | 7 | 7.4% |
| $25,000 to $34,999 | 39 | 41.1% |
| $35,000 to $49,999 | 11 | 11.6% |
| $50,000 to $74,999 | 15 | 15.8% |
| $75,000 to $99,999 | 4 | 4.2% |
| $100,000 to $149,999 | 7 | 7.4% |
| $150,000 to $199,999 | 0 | 0.0% |
| $200,000+ | 0 | 0.0% |
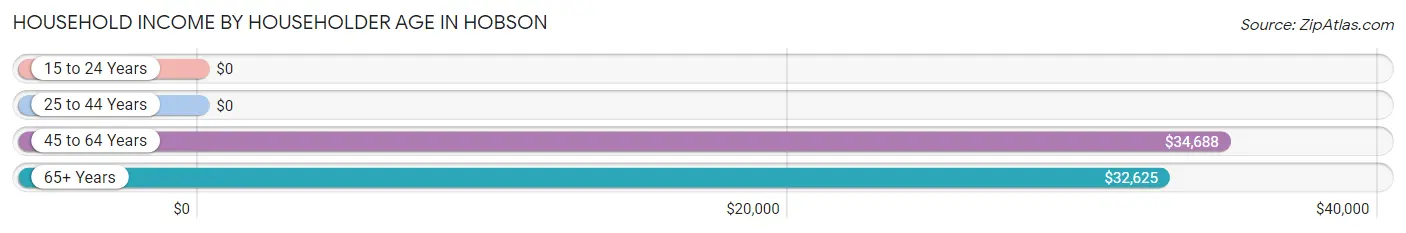
Household Income by Householder Age in Hobson
The median household income in Hobson is $33,542, with the highest median household income of $34,688 found in the 45 to 64 years age bracket for the primary householder. A total of 26 households (27.4%) fall into this category. Meanwhile, the 15 to 24 years age bracket for the primary householder has the lowest median household income of $0, with 3 households (3.2%) in this group.
| Income Bracket | # Households | Median Income |
| 15 to 24 Years | 3 (3.2%) | $0 |
| 25 to 44 Years | 5 (5.3%) | $0 |
| 45 to 64 Years | 26 (27.4%) | $34,688 |
| 65+ Years | 61 (64.2%) | $32,625 |
| Total | 95 (100.0%) | $33,542 |
Poverty in Hobson
Income Below Poverty by Sex and Age in Hobson
With 15.6% poverty level for males and 13.0% for females among the residents of Hobson, 45 to 54 year old males and 55 to 64 year old females are the most vulnerable to poverty, with 6 males (37.5%) and 4 females (36.4%) in their respective age groups living below the poverty level.
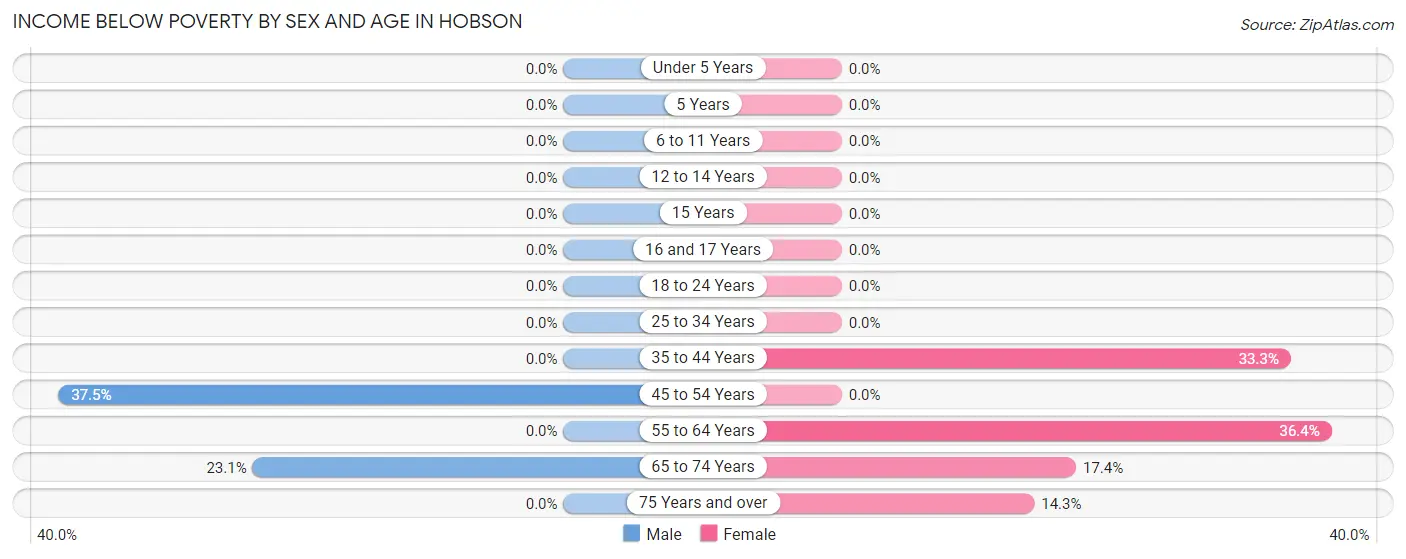
| Age Bracket | Male | Female |
| Under 5 Years | 0 (0.0%) | 0 (0.0%) |
| 5 Years | 0 (0.0%) | 0 (0.0%) |
| 6 to 11 Years | 0 (0.0%) | 0 (0.0%) |
| 12 to 14 Years | 0 (0.0%) | 0 (0.0%) |
| 15 Years | 0 (0.0%) | 0 (0.0%) |
| 16 and 17 Years | 0 (0.0%) | 0 (0.0%) |
| 18 to 24 Years | 0 (0.0%) | 0 (0.0%) |
| 25 to 34 Years | 0 (0.0%) | 0 (0.0%) |
| 35 to 44 Years | 0 (0.0%) | 1 (33.3%) |
| 45 to 54 Years | 6 (37.5%) | 0 (0.0%) |
| 55 to 64 Years | 0 (0.0%) | 4 (36.4%) |
| 65 to 74 Years | 6 (23.1%) | 4 (17.4%) |
| 75 Years and over | 0 (0.0%) | 3 (14.3%) |
| Total | 12 (15.6%) | 12 (13.0%) |
Income Above Poverty by Sex and Age in Hobson
According to the poverty statistics in Hobson, males aged 6 to 11 years and females aged 6 to 11 years are the age groups that are most secure financially, with 100.0% of males and 100.0% of females in these age groups living above the poverty line.
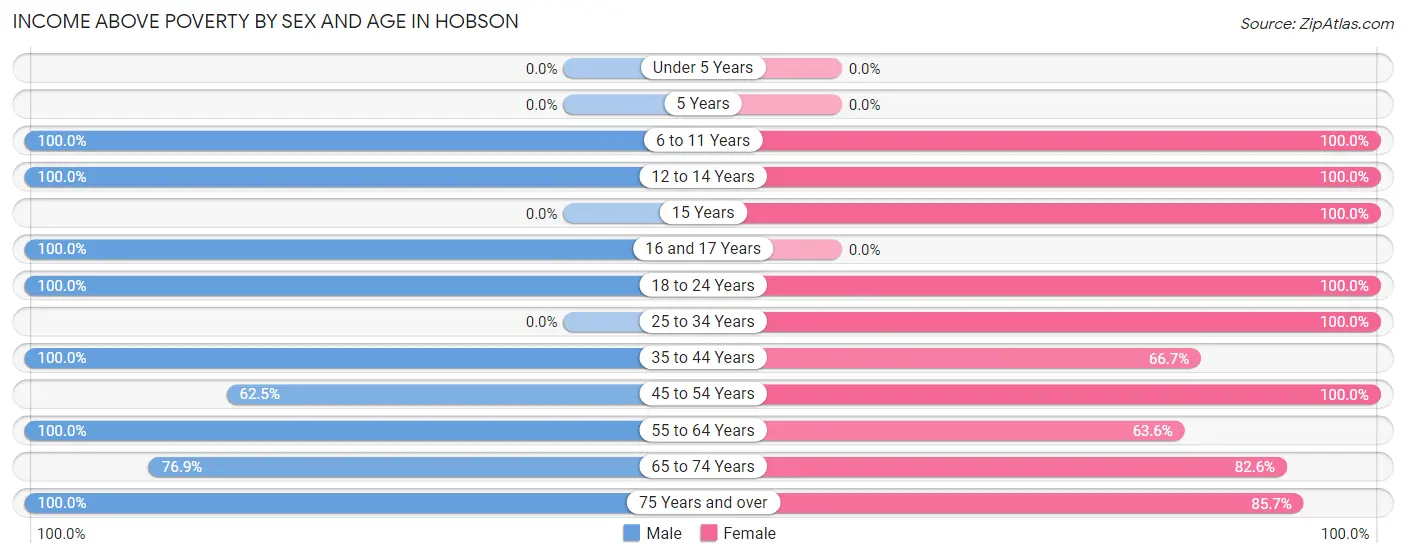
| Age Bracket | Male | Female |
| Under 5 Years | 0 (0.0%) | 0 (0.0%) |
| 5 Years | 0 (0.0%) | 0 (0.0%) |
| 6 to 11 Years | 2 (100.0%) | 2 (100.0%) |
| 12 to 14 Years | 2 (100.0%) | 7 (100.0%) |
| 15 Years | 0 (0.0%) | 4 (100.0%) |
| 16 and 17 Years | 4 (100.0%) | 0 (0.0%) |
| 18 to 24 Years | 3 (100.0%) | 9 (100.0%) |
| 25 to 34 Years | 0 (0.0%) | 1 (100.0%) |
| 35 to 44 Years | 2 (100.0%) | 2 (66.7%) |
| 45 to 54 Years | 10 (62.5%) | 11 (100.0%) |
| 55 to 64 Years | 5 (100.0%) | 7 (63.6%) |
| 65 to 74 Years | 20 (76.9%) | 19 (82.6%) |
| 75 Years and over | 17 (100.0%) | 18 (85.7%) |
| Total | 65 (84.4%) | 80 (87.0%) |
Income Below Poverty Among Married-Couple Families in Hobson
The poverty statistics for married-couple families in Hobson show that 2.6% or 1 of the total 39 families live below the poverty line. Families with no children have the highest poverty rate of 2.9%, comprising of 1 families. On the other hand, families with 1 or 2 children have the lowest poverty rate of 0.0%, which includes 0 families.
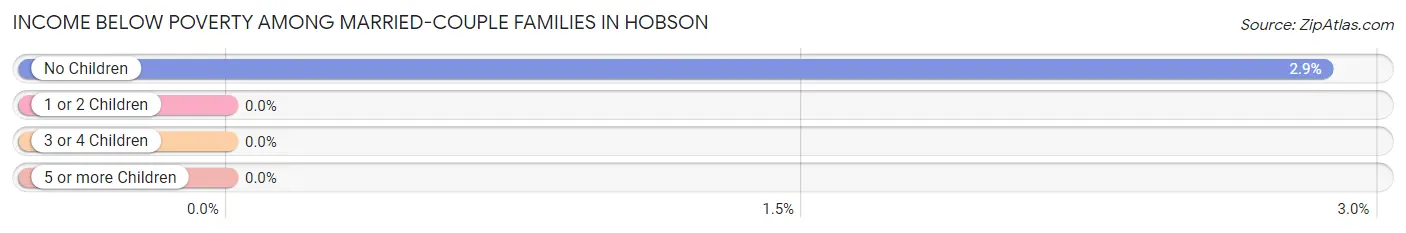
| Children | Above Poverty | Below Poverty |
| No Children | 34 (97.1%) | 1 (2.9%) |
| 1 or 2 Children | 4 (100.0%) | 0 (0.0%) |
| 3 or 4 Children | 0 (0.0%) | 0 (0.0%) |
| 5 or more Children | 0 (0.0%) | 0 (0.0%) |
| Total | 38 (97.4%) | 1 (2.6%) |
Income Below Poverty Among Single-Parent Households in Hobson
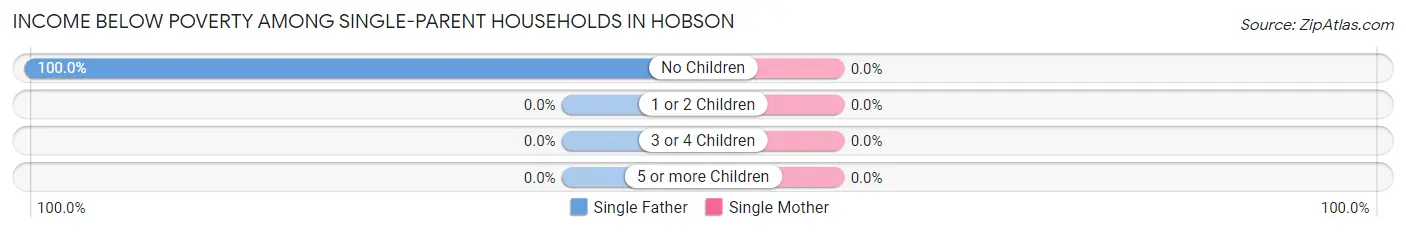
| Children | Single Father | Single Mother |
| No Children | 5 (100.0%) | 0 (0.0%) |
| 1 or 2 Children | 0 (0.0%) | 0 (0.0%) |
| 3 or 4 Children | 0 (0.0%) | 0 (0.0%) |
| 5 or more Children | 0 (0.0%) | 0 (0.0%) |
| Total | 5 (100.0%) | 0 (0.0%) |
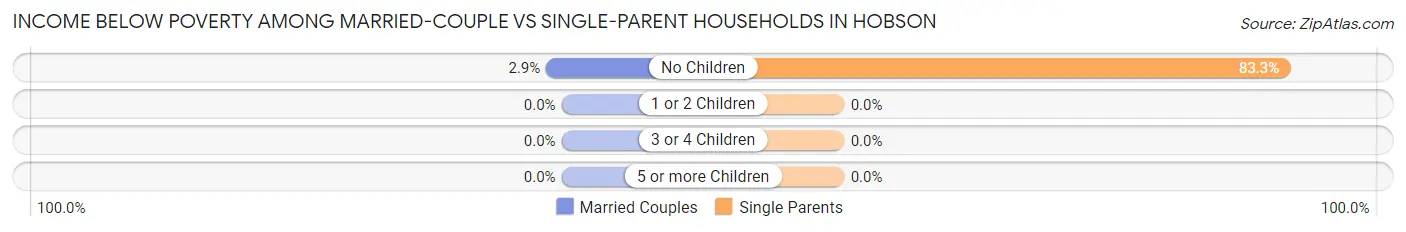
Income Below Poverty Among Married-Couple vs Single-Parent Households in Hobson
The poverty data for Hobson shows that 1 of the married-couple family households (2.6%) and 5 of the single-parent households (41.7%) are living below the poverty level. Within the married-couple family households, those with no children have the highest poverty rate, with 1 households (2.9%) falling below the poverty line. Among the single-parent households, those with no children have the highest poverty rate, with 5 household (83.3%) living below poverty.
| Children | Married-Couple Families | Single-Parent Households |
| No Children | 1 (2.9%) | 5 (83.3%) |
| 1 or 2 Children | 0 (0.0%) | 0 (0.0%) |
| 3 or 4 Children | 0 (0.0%) | 0 (0.0%) |
| 5 or more Children | 0 (0.0%) | 0 (0.0%) |
| Total | 1 (2.6%) | 5 (41.7%) |
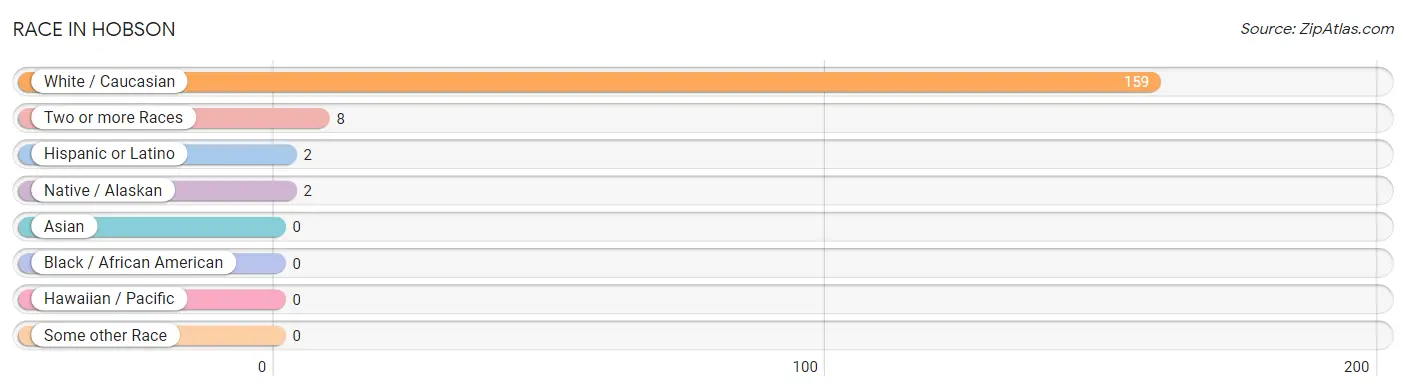
Race in Hobson
The most populous races in Hobson are White / Caucasian (159 | 94.1%), Two or more Races (8 | 4.7%), and Hispanic or Latino (2 | 1.2%).
| Race | # Population | % Population |
| Asian | 0 | 0.0% |
| Black / African American | 0 | 0.0% |
| Hawaiian / Pacific | 0 | 0.0% |
| Hispanic or Latino | 2 | 1.2% |
| Native / Alaskan | 2 | 1.2% |
| White / Caucasian | 159 | 94.1% |
| Two or more Races | 8 | 4.7% |
| Some other Race | 0 | 0.0% |
| Total | 169 | 100.0% |
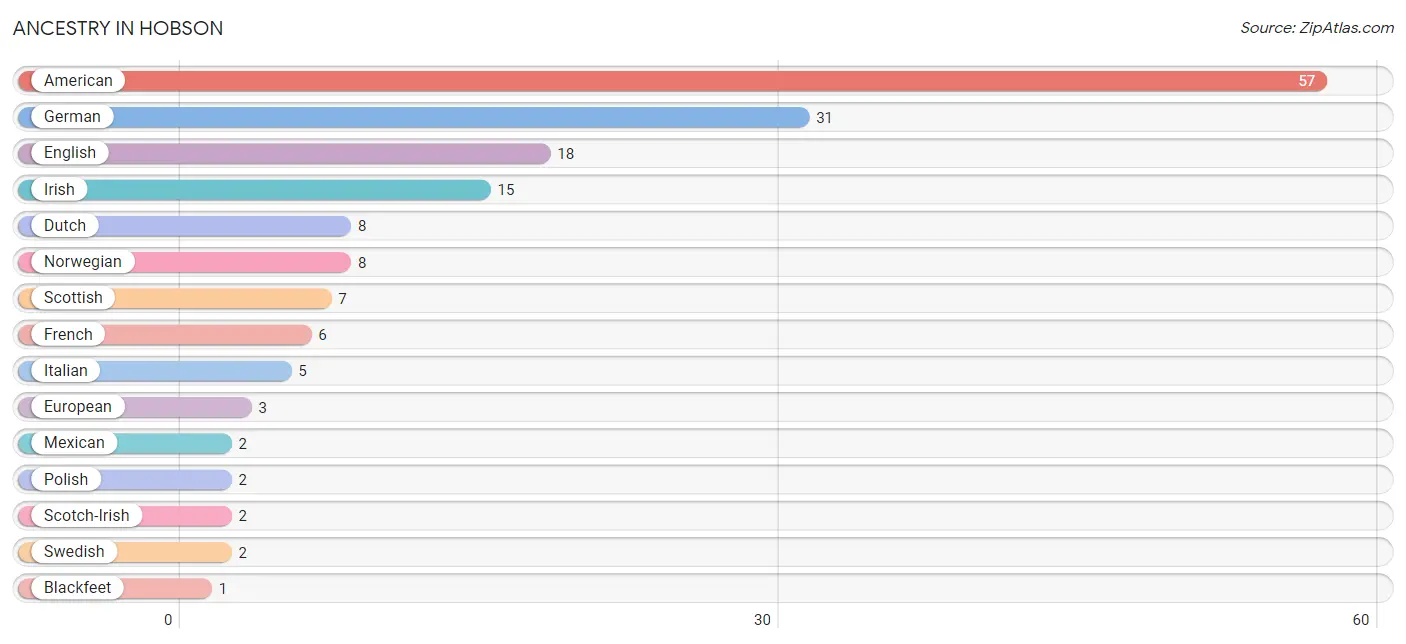
Ancestry in Hobson
The most populous ancestries reported in Hobson are American (57 | 33.7%), German (31 | 18.3%), English (18 | 10.6%), Irish (15 | 8.9%), and Dutch (8 | 4.7%), together accounting for 76.3% of all Hobson residents.
| Ancestry | # Population | % Population |
| American | 57 | 33.7% |
| Blackfeet | 1 | 0.6% |
| Dutch | 8 | 4.7% |
| English | 18 | 10.6% |
| European | 3 | 1.8% |
| French | 6 | 3.5% |
| French Canadian | 1 | 0.6% |
| German | 31 | 18.3% |
| Irish | 15 | 8.9% |
| Italian | 5 | 3.0% |
| Mexican | 2 | 1.2% |
| Norwegian | 8 | 4.7% |
| Polish | 2 | 1.2% |
| Scotch-Irish | 2 | 1.2% |
| Scottish | 7 | 4.1% |
| Sioux | 1 | 0.6% |
| Swedish | 2 | 1.2% | View All 17 Rows |
Immigrants in Hobson

| Immigration Origin | # Population | % Population | View All 0 Rows |
Sex and Age in Hobson
Sex and Age in Hobson
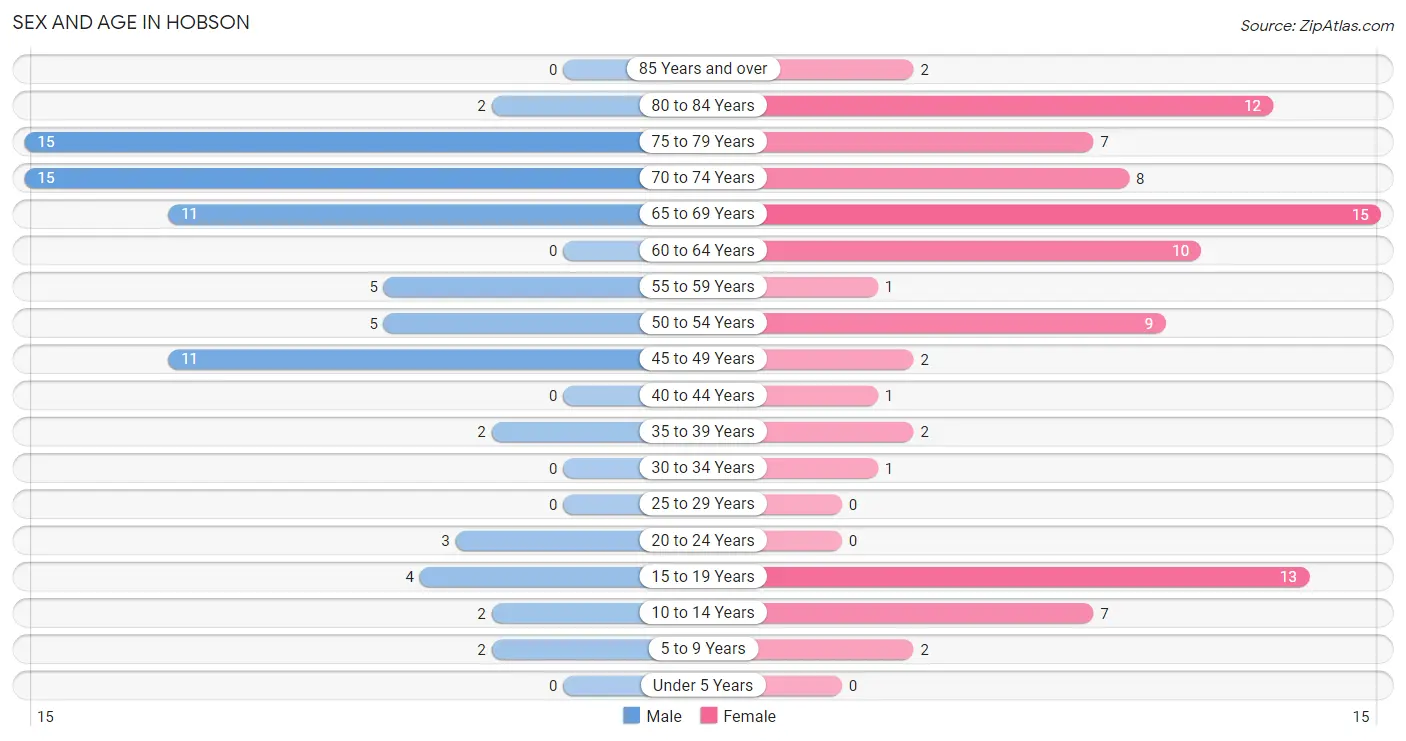
The most populous age groups in Hobson are 70 to 74 Years (15 | 19.5%) for men and 65 to 69 Years (15 | 16.3%) for women.
| Age Bracket | Male | Female |
| Under 5 Years | 0 (0.0%) | 0 (0.0%) |
| 5 to 9 Years | 2 (2.6%) | 2 (2.2%) |
| 10 to 14 Years | 2 (2.6%) | 7 (7.6%) |
| 15 to 19 Years | 4 (5.2%) | 13 (14.1%) |
| 20 to 24 Years | 3 (3.9%) | 0 (0.0%) |
| 25 to 29 Years | 0 (0.0%) | 0 (0.0%) |
| 30 to 34 Years | 0 (0.0%) | 1 (1.1%) |
| 35 to 39 Years | 2 (2.6%) | 2 (2.2%) |
| 40 to 44 Years | 0 (0.0%) | 1 (1.1%) |
| 45 to 49 Years | 11 (14.3%) | 2 (2.2%) |
| 50 to 54 Years | 5 (6.5%) | 9 (9.8%) |
| 55 to 59 Years | 5 (6.5%) | 1 (1.1%) |
| 60 to 64 Years | 0 (0.0%) | 10 (10.9%) |
| 65 to 69 Years | 11 (14.3%) | 15 (16.3%) |
| 70 to 74 Years | 15 (19.5%) | 8 (8.7%) |
| 75 to 79 Years | 15 (19.5%) | 7 (7.6%) |
| 80 to 84 Years | 2 (2.6%) | 12 (13.0%) |
| 85 Years and over | 0 (0.0%) | 2 (2.2%) |
| Total | 77 (100.0%) | 92 (100.0%) |
Families and Households in Hobson
Median Family Size in Hobson
The median family size in Hobson is 2.45 persons per family, with single female/mother families (7 | 13.7%) accounting for the largest median family size of 3.86 persons per family. On the other hand, single male/father families (5 | 9.8%) represent the smallest median family size with 2.20 persons per family.
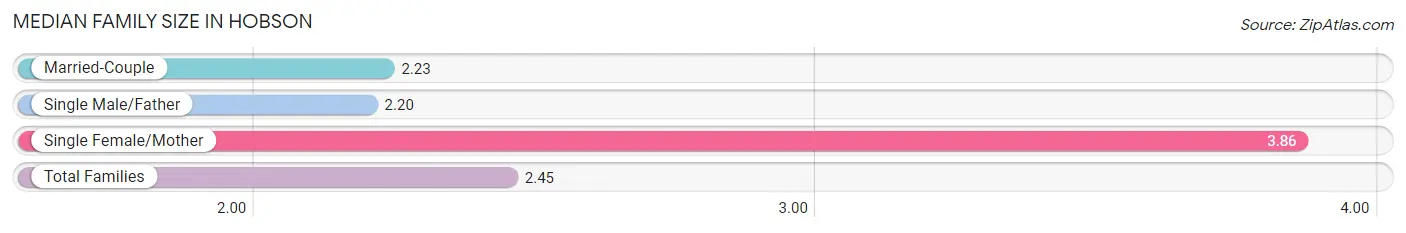
| Family Type | # Families | Family Size |
| Married-Couple | 39 (76.5%) | 2.23 |
| Single Male/Father | 5 (9.8%) | 2.20 |
| Single Female/Mother | 7 (13.7%) | 3.86 |
| Total Families | 51 (100.0%) | 2.45 |
Median Household Size in Hobson
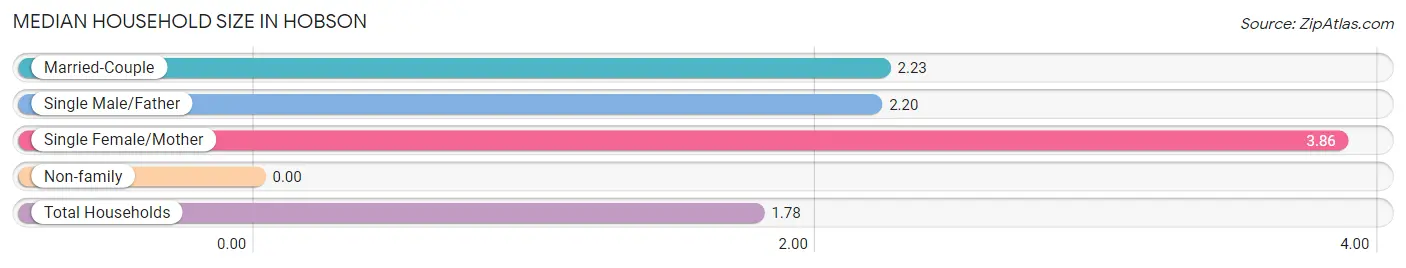
| Household Type | # Households | Household Size |
| Married-Couple | 39 (41.0%) | 2.23 |
| Single Male/Father | 5 (5.3%) | 2.20 |
| Single Female/Mother | 7 (7.4%) | 3.86 |
| Non-family | 44 (46.3%) | - |
| Total Households | 95 (100.0%) | 1.78 |
Household Size by Marriage Status in Hobson
Out of a total of 95 households in Hobson, 51 (53.7%) are family households, while 44 (46.3%) are nonfamily households. The most numerous type of family households are 2-person households, comprising 41, and the most common type of nonfamily households are 1-person households, comprising 44.
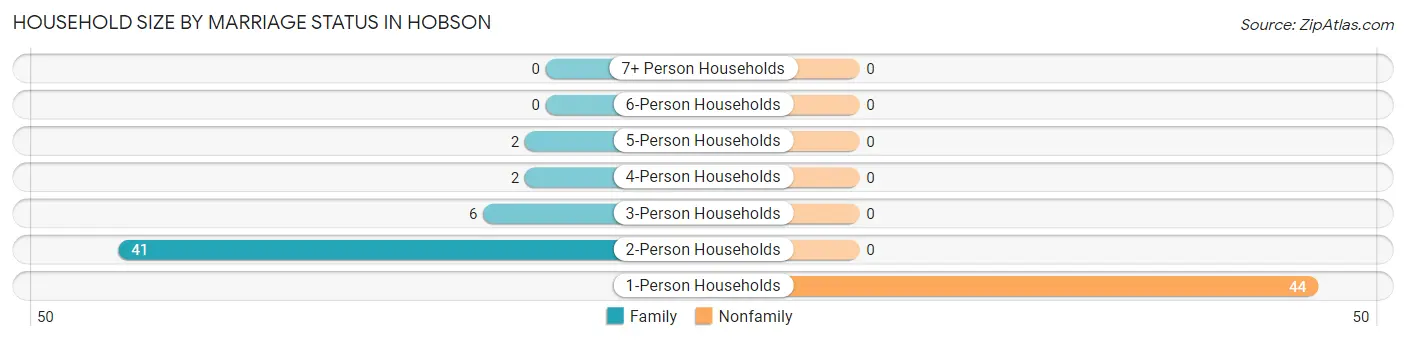
| Household Size | Family Households | Nonfamily Households |
| 1-Person Households | - | 44 (46.3%) |
| 2-Person Households | 41 (43.2%) | 0 (0.0%) |
| 3-Person Households | 6 (6.3%) | 0 (0.0%) |
| 4-Person Households | 2 (2.1%) | 0 (0.0%) |
| 5-Person Households | 2 (2.1%) | 0 (0.0%) |
| 6-Person Households | 0 (0.0%) | 0 (0.0%) |
| 7+ Person Households | 0 (0.0%) | 0 (0.0%) |
| Total | 51 (53.7%) | 44 (46.3%) |
Female Fertility in Hobson
Fertility by Age in Hobson
| Age Bracket | Women with Births | Births / 1,000 Women |
| 15 to 19 years | 0 (0.0%) | 0.0 |
| 20 to 34 years | 0 (0.0%) | 0.0 |
| 35 to 50 years | 0 (0.0%) | 0.0 |
| Total | 0 (0.0%) | 0.0 |
Fertility by Age by Marriage Status in Hobson
| Age Bracket | Married | Unmarried |
| 15 to 19 years | 0 (0.0%) | 0 (0.0%) |
| 20 to 34 years | 0 (0.0%) | 0 (0.0%) |
| 35 to 50 years | 0 (0.0%) | 0 (0.0%) |
| Total | 0 (0.0%) | 0 (0.0%) |
Fertility by Education in Hobson
| Educational Attainment | Women with Births | Births / 1,000 Women |
| Less than High School | 0 (0.0%) | 0.0 |
| High School Diploma | 0 (0.0%) | 0.0 |
| College or Associate's Degree | 0 (0.0%) | 0.0 |
| Bachelor's Degree | 0 (0.0%) | 0.0 |
| Graduate Degree | 0 (0.0%) | 0.0 |
| Total | 0 (0.0%) | 0.0 |
Fertility by Education by Marriage Status in Hobson
| Educational Attainment | Married | Unmarried |
| Less than High School | 0 (0.0%) | 0 (0.0%) |
| High School Diploma | 0 (0.0%) | 0 (0.0%) |
| College or Associate's Degree | 0 (0.0%) | 0 (0.0%) |
| Bachelor's Degree | 0 (0.0%) | 0 (0.0%) |
| Graduate Degree | 0 (0.0%) | 0 (0.0%) |
| Total | 0 (0.0%) | 0 (0.0%) |
Employment Characteristics in Hobson
Employment by Class of Employer in Hobson
Among the 65 employed individuals in Hobson, private company employees (22 | 33.9%), local government employees (20 | 30.8%), and self-employed (incorporated) (8 | 12.3%) make up the most common classes of employment.
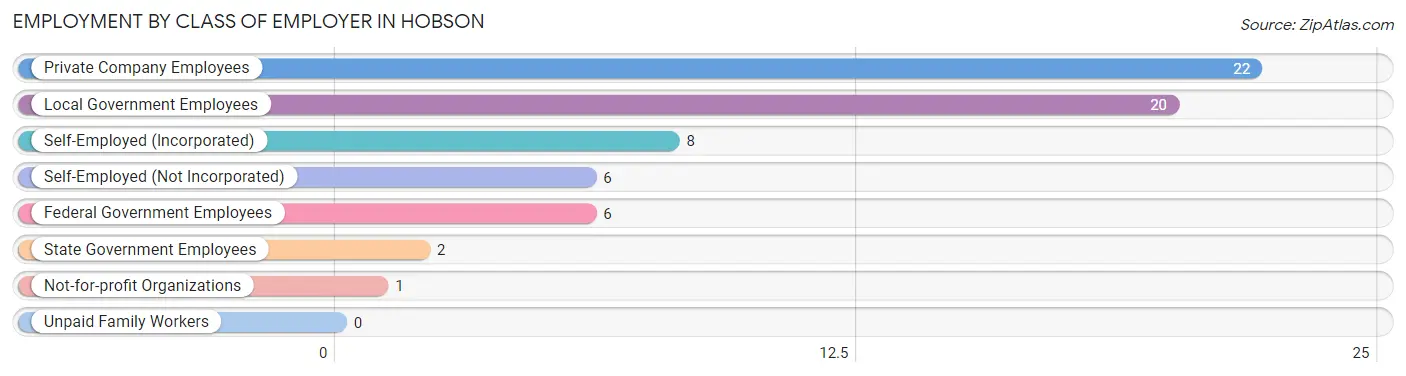
| Employer Class | # Employees | % Employees |
| Private Company Employees | 22 | 33.9% |
| Self-Employed (Incorporated) | 8 | 12.3% |
| Self-Employed (Not Incorporated) | 6 | 9.2% |
| Not-for-profit Organizations | 1 | 1.5% |
| Local Government Employees | 20 | 30.8% |
| State Government Employees | 2 | 3.1% |
| Federal Government Employees | 6 | 9.2% |
| Unpaid Family Workers | 0 | 0.0% |
| Total | 65 | 100.0% |
Employment Status by Age in Hobson
According to the labor force statistics for Hobson, out of the total population over 16 years of age (152), 52.6% or 80 individuals are in the labor force, with 17.5% or 14 of them unemployed. The age group with the highest labor force participation rate is 20 to 24 years, with 100.0% or 3 individuals in the labor force. Within the labor force, the 16 to 19 years age range has the highest percentage of unemployed individuals, with 100.0% or 3 of them being unemployed.
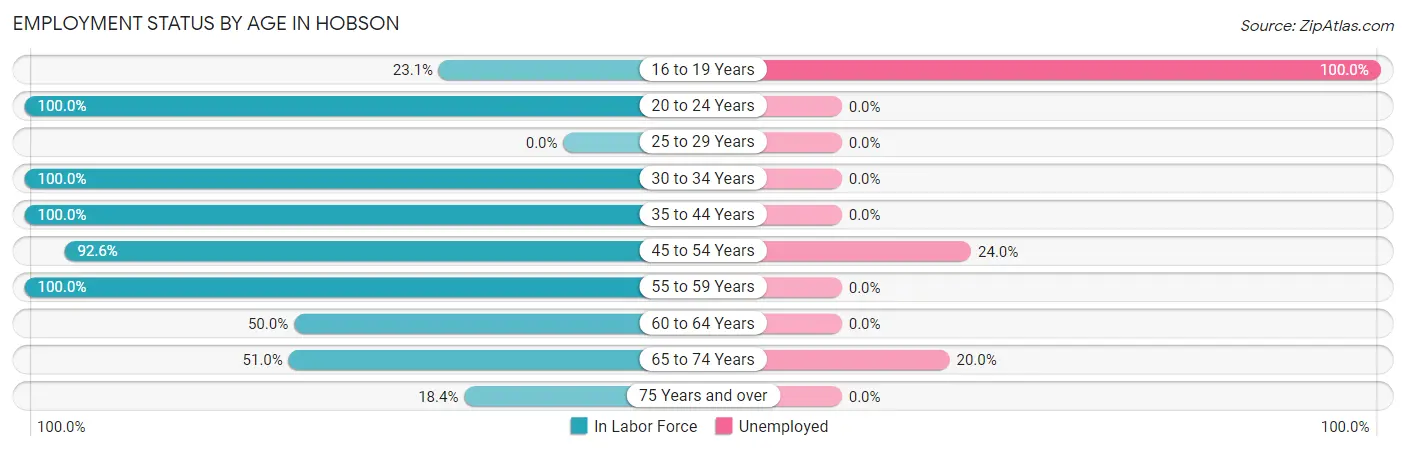
| Age Bracket | In Labor Force | Unemployed |
| 16 to 19 Years | 3 (23.1%) | 3 (100.0%) |
| 20 to 24 Years | 3 (100.0%) | 0 (0.0%) |
| 25 to 29 Years | 0 (0.0%) | 0 (0.0%) |
| 30 to 34 Years | 1 (100.0%) | 0 (0.0%) |
| 35 to 44 Years | 5 (100.0%) | 0 (0.0%) |
| 45 to 54 Years | 25 (92.6%) | 6 (24.0%) |
| 55 to 59 Years | 6 (100.0%) | 0 (0.0%) |
| 60 to 64 Years | 5 (50.0%) | 0 (0.0%) |
| 65 to 74 Years | 25 (51.0%) | 5 (20.0%) |
| 75 Years and over | 7 (18.4%) | 0 (0.0%) |
| Total | 80 (52.6%) | 14 (17.5%) |
Employment Status by Educational Attainment in Hobson
According to labor force statistics for Hobson, 85.7% of individuals (42) out of the total population between 25 and 64 years of age (49) are in the labor force, with 14.3% or 6 of them being unemployed. The group with the highest labor force participation rate are those with the educational attainment of less than high school, with 100.0% or 1 individuals in the labor force. Within the labor force, individuals with high school diploma education have the highest percentage of unemployment, with 35.3% or 6 of them being unemployed.
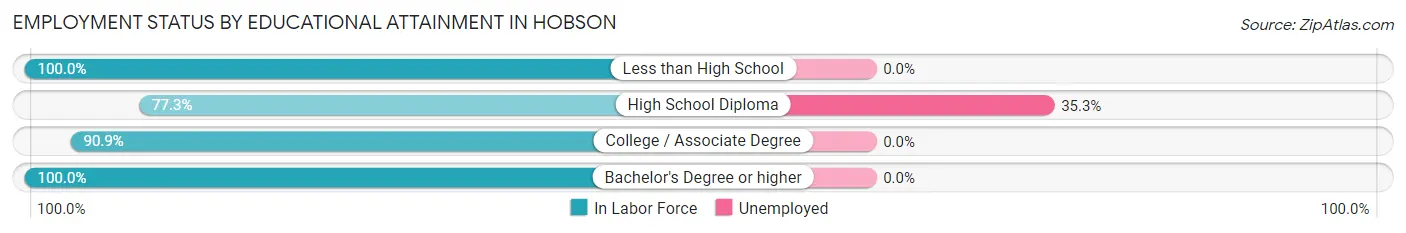
| Educational Attainment | In Labor Force | Unemployed |
| Less than High School | 1 (100.0%) | 0 (0.0%) |
| High School Diploma | 17 (77.3%) | 8 (35.3%) |
| College / Associate Degree | 20 (90.9%) | 0 (0.0%) |
| Bachelor's Degree or higher | 4 (100.0%) | 0 (0.0%) |
| Total | 42 (85.7%) | 7 (14.3%) |
Employment Occupations by Sex in Hobson
Management, Business, Science and Arts Occupations
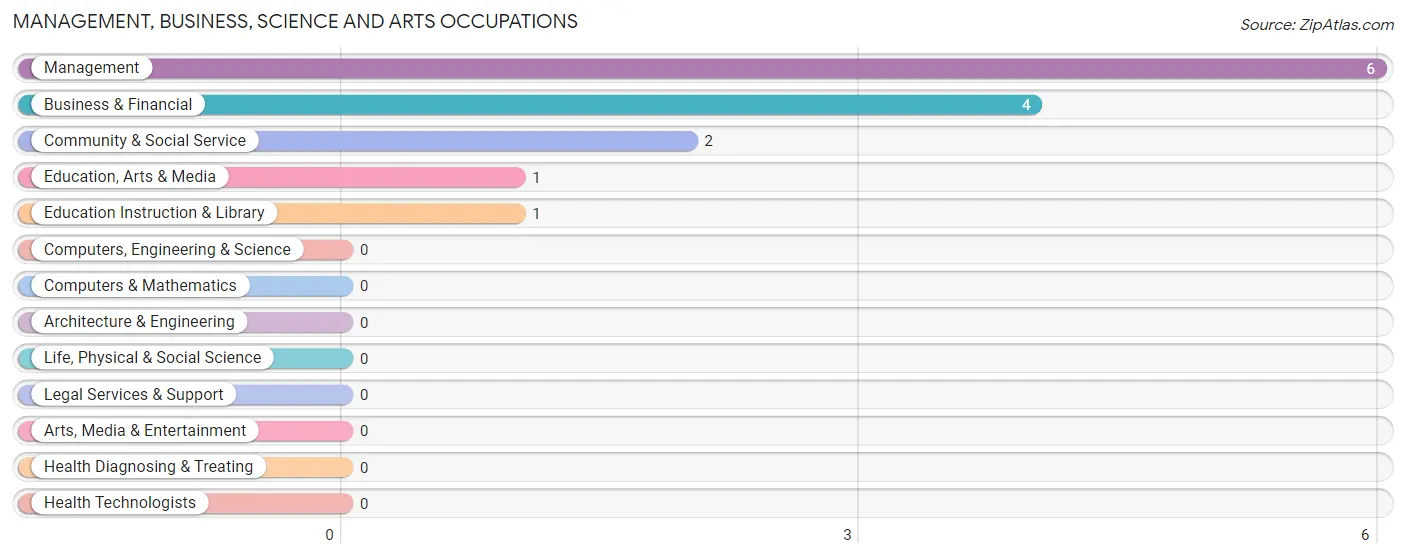
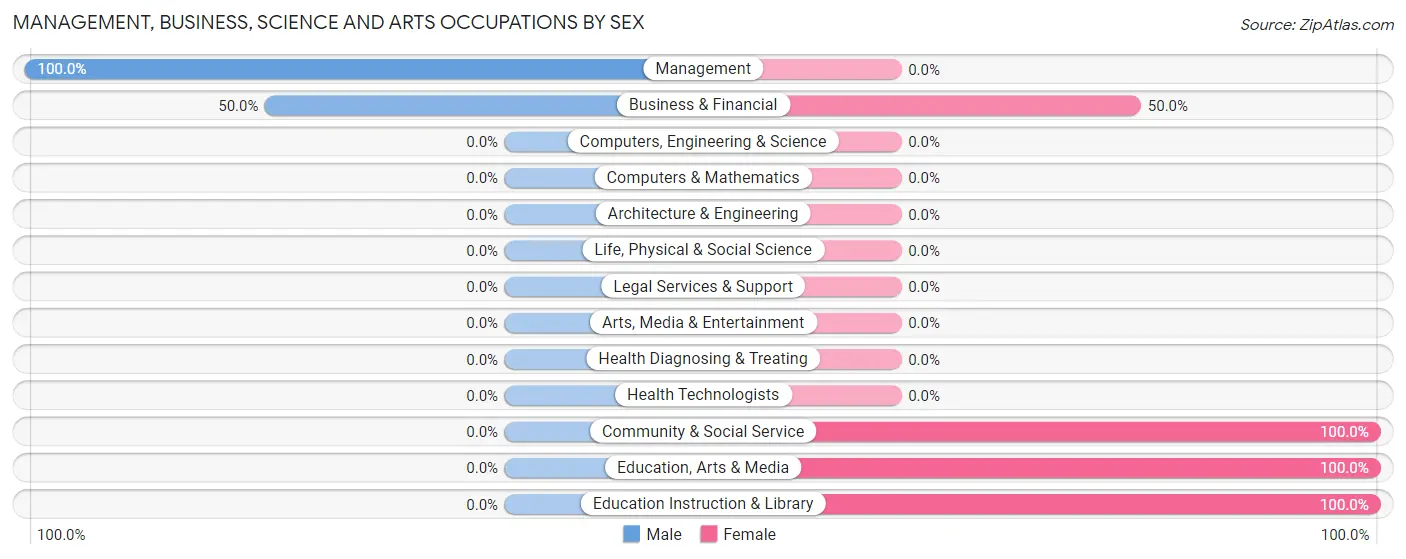
The most common Management, Business, Science and Arts occupations in Hobson are Management (6 | 9.1%), Business & Financial (4 | 6.1%), Community & Social Service (2 | 3.0%), Education, Arts & Media (1 | 1.5%), and Education Instruction & Library (1 | 1.5%).
Management, Business, Science and Arts Occupations by Sex
Within the Management, Business, Science and Arts occupations in Hobson, the most male-oriented occupations are Management (100.0%), and Business & Financial (50.0%), while the most female-oriented occupations are Community & Social Service (100.0%), Education, Arts & Media (100.0%), and Education Instruction & Library (100.0%).
| Occupation | Male | Female |
| Management | 6 (100.0%) | 0 (0.0%) |
| Business & Financial | 2 (50.0%) | 2 (50.0%) |
| Computers, Engineering & Science | 0 (0.0%) | 0 (0.0%) |
| Computers & Mathematics | 0 (0.0%) | 0 (0.0%) |
| Architecture & Engineering | 0 (0.0%) | 0 (0.0%) |
| Life, Physical & Social Science | 0 (0.0%) | 0 (0.0%) |
| Community & Social Service | 0 (0.0%) | 2 (100.0%) |
| Education, Arts & Media | 0 (0.0%) | 1 (100.0%) |
| Legal Services & Support | 0 (0.0%) | 0 (0.0%) |
| Education Instruction & Library | 0 (0.0%) | 1 (100.0%) |
| Arts, Media & Entertainment | 0 (0.0%) | 0 (0.0%) |
| Health Diagnosing & Treating | 0 (0.0%) | 0 (0.0%) |
| Health Technologists | 0 (0.0%) | 0 (0.0%) |
| Total (Category) | 8 (66.7%) | 4 (33.3%) |
| Total (Overall) | 39 (59.1%) | 27 (40.9%) |
Services Occupations
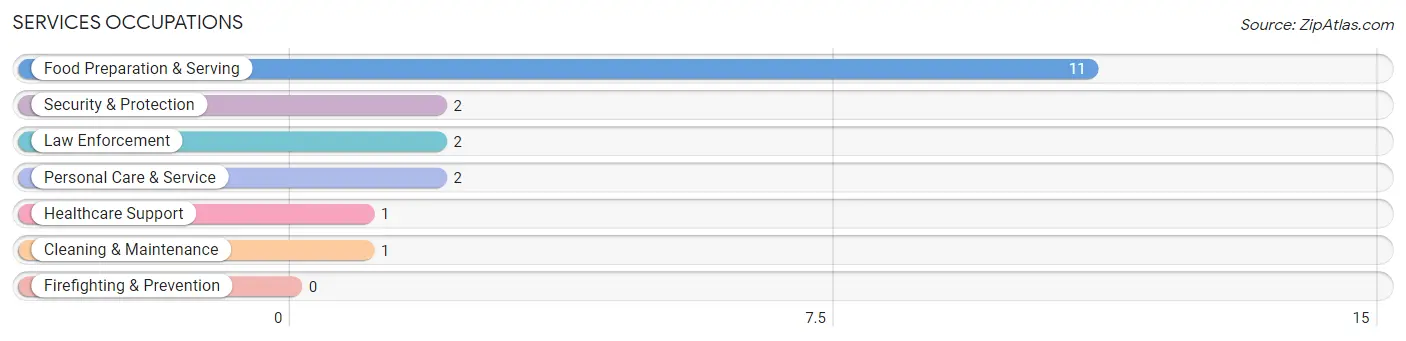
The most common Services occupations in Hobson are Food Preparation & Serving (11 | 16.7%), Security & Protection (2 | 3.0%), Law Enforcement (2 | 3.0%), Personal Care & Service (2 | 3.0%), and Healthcare Support (1 | 1.5%).
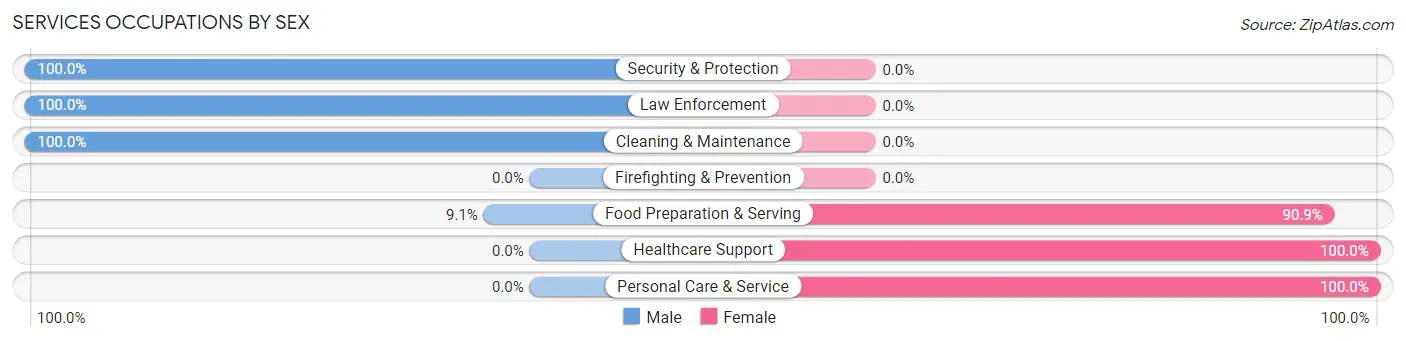
Services Occupations by Sex
Within the Services occupations in Hobson, the most male-oriented occupations are Security & Protection (100.0%), Law Enforcement (100.0%), and Cleaning & Maintenance (100.0%), while the most female-oriented occupations are Healthcare Support (100.0%), Personal Care & Service (100.0%), and Food Preparation & Serving (90.9%).
| Occupation | Male | Female |
| Healthcare Support | 0 (0.0%) | 1 (100.0%) |
| Security & Protection | 2 (100.0%) | 0 (0.0%) |
| Firefighting & Prevention | 0 (0.0%) | 0 (0.0%) |
| Law Enforcement | 2 (100.0%) | 0 (0.0%) |
| Food Preparation & Serving | 1 (9.1%) | 10 (90.9%) |
| Cleaning & Maintenance | 1 (100.0%) | 0 (0.0%) |
| Personal Care & Service | 0 (0.0%) | 2 (100.0%) |
| Total (Category) | 4 (23.5%) | 13 (76.5%) |
| Total (Overall) | 39 (59.1%) | 27 (40.9%) |
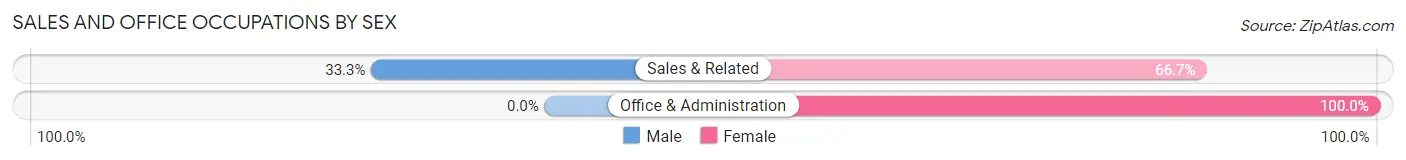
Sales and Office Occupations
The most common Sales and Office occupations in Hobson are Office & Administration (8 | 12.1%), and Sales & Related (3 | 4.5%).
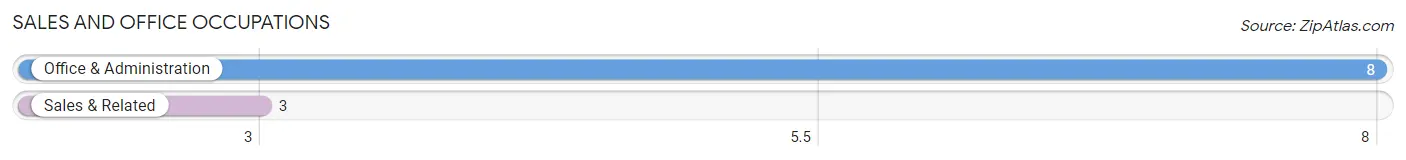
Sales and Office Occupations by Sex
| Occupation | Male | Female |
| Sales & Related | 1 (33.3%) | 2 (66.7%) |
| Office & Administration | 0 (0.0%) | 8 (100.0%) |
| Total (Category) | 1 (9.1%) | 10 (90.9%) |
| Total (Overall) | 39 (59.1%) | 27 (40.9%) |
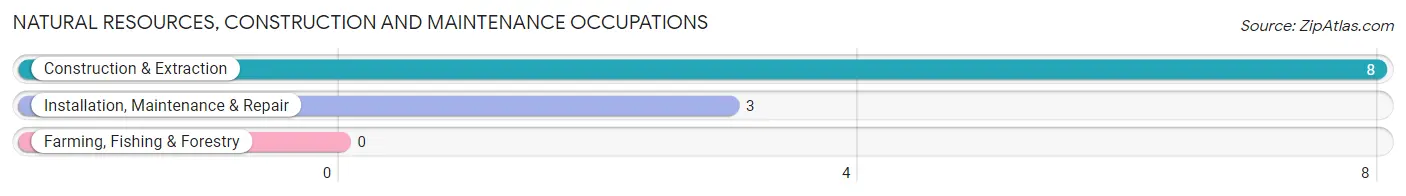
Natural Resources, Construction and Maintenance Occupations
The most common Natural Resources, Construction and Maintenance occupations in Hobson are Construction & Extraction (8 | 12.1%), and Installation, Maintenance & Repair (3 | 4.5%).
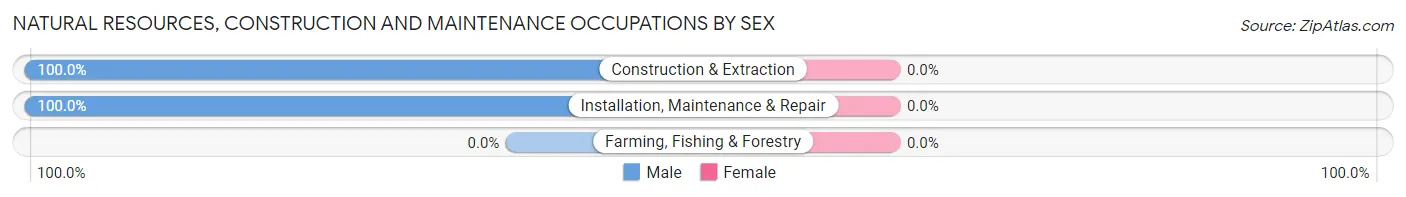
Natural Resources, Construction and Maintenance Occupations by Sex
| Occupation | Male | Female |
| Farming, Fishing & Forestry | 0 (0.0%) | 0 (0.0%) |
| Construction & Extraction | 8 (100.0%) | 0 (0.0%) |
| Installation, Maintenance & Repair | 3 (100.0%) | 0 (0.0%) |
| Total (Category) | 11 (100.0%) | 0 (0.0%) |
| Total (Overall) | 39 (59.1%) | 27 (40.9%) |
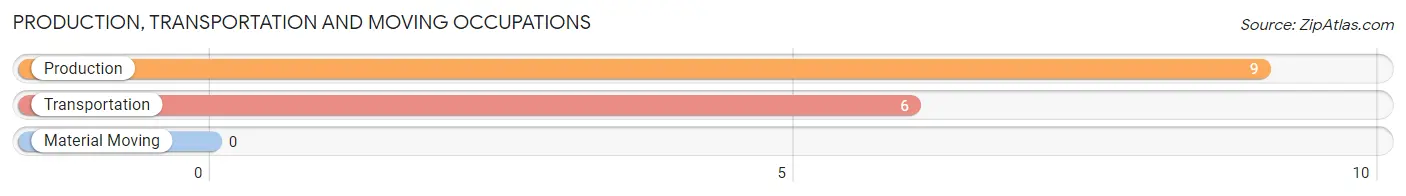
Production, Transportation and Moving Occupations
The most common Production, Transportation and Moving occupations in Hobson are Production (9 | 13.6%), and Transportation (6 | 9.1%).
Production, Transportation and Moving Occupations by Sex
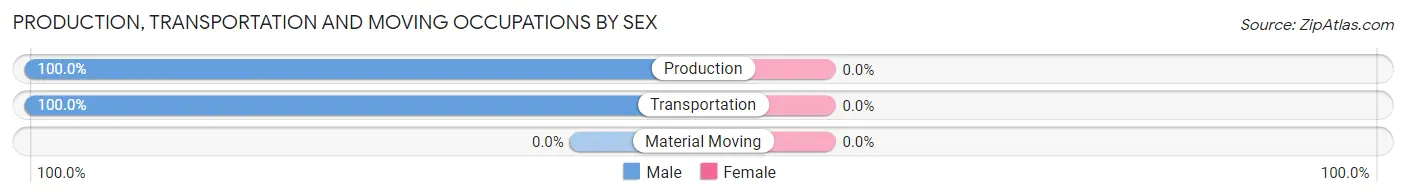
| Occupation | Male | Female |
| Production | 9 (100.0%) | 0 (0.0%) |
| Transportation | 6 (100.0%) | 0 (0.0%) |
| Material Moving | 0 (0.0%) | 0 (0.0%) |
| Total (Category) | 15 (100.0%) | 0 (0.0%) |
| Total (Overall) | 39 (59.1%) | 27 (40.9%) |
Employment Industries by Sex in Hobson
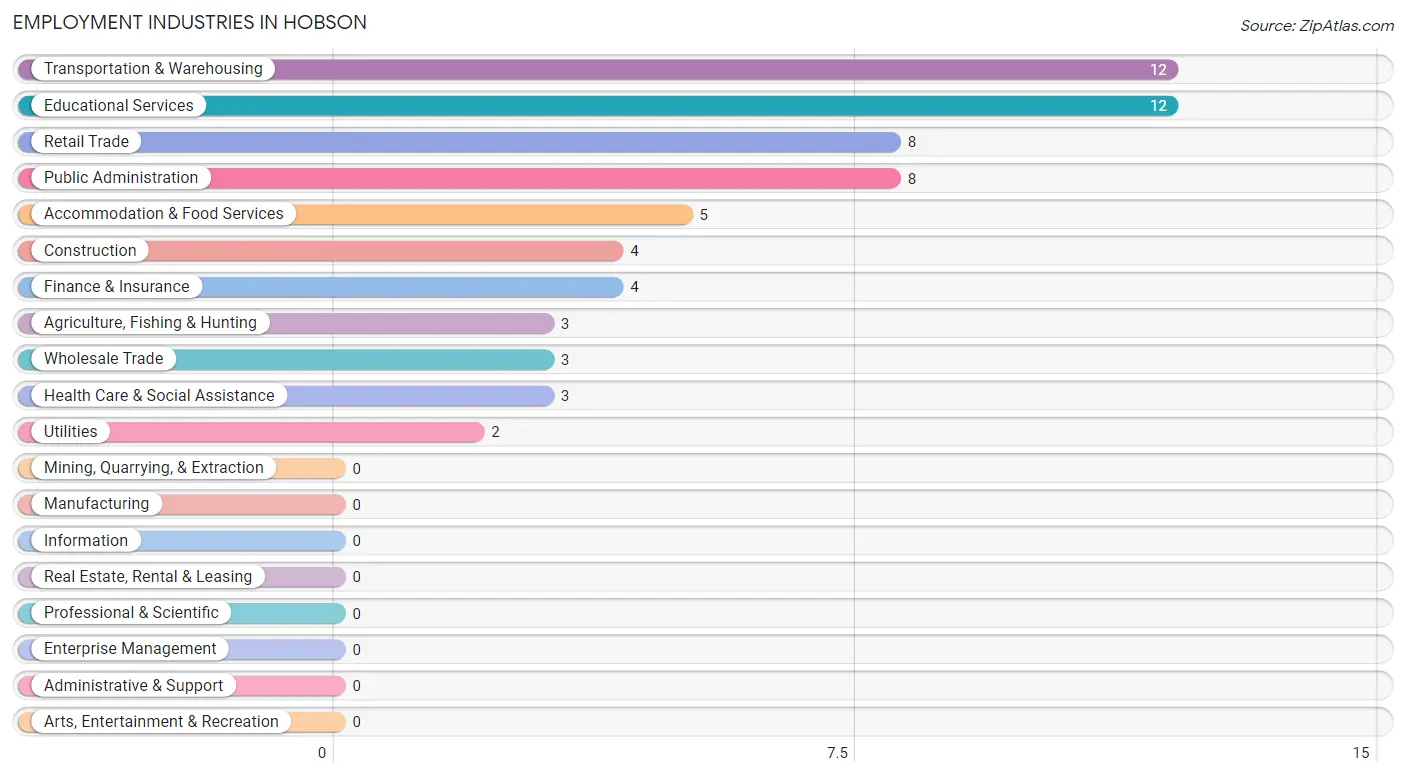
Employment Industries in Hobson
The major employment industries in Hobson include Transportation & Warehousing (12 | 18.2%), Educational Services (12 | 18.2%), Retail Trade (8 | 12.1%), Public Administration (8 | 12.1%), and Accommodation & Food Services (5 | 7.6%).
Employment Industries by Sex in Hobson
The Hobson industries that see more men than women are Agriculture, Fishing & Hunting (100.0%), Construction (100.0%), and Utilities (100.0%), whereas the industries that tend to have a higher number of women are Finance & Insurance (100.0%), Accommodation & Food Services (100.0%), and Wholesale Trade (66.7%).
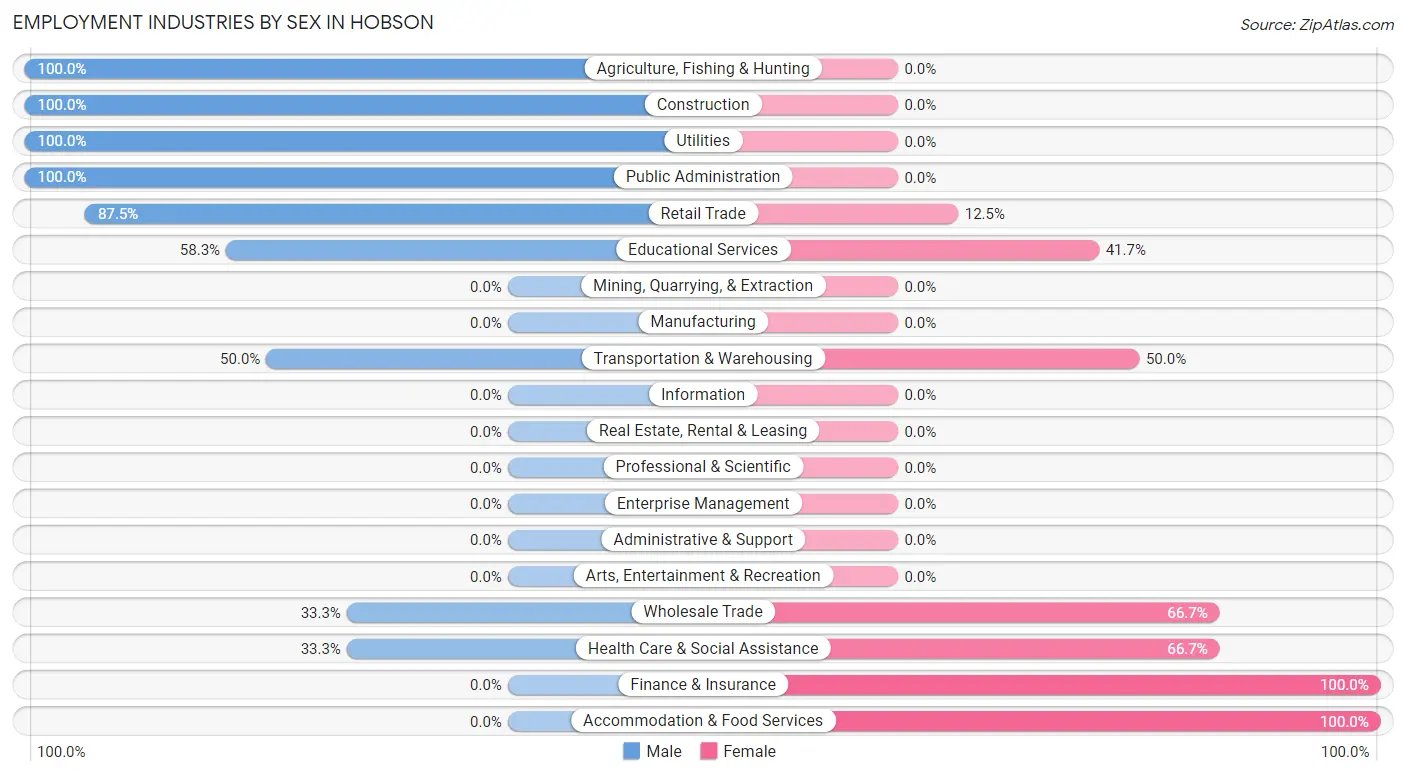
| Industry | Male | Female |
| Agriculture, Fishing & Hunting | 3 (100.0%) | 0 (0.0%) |
| Mining, Quarrying, & Extraction | 0 (0.0%) | 0 (0.0%) |
| Construction | 4 (100.0%) | 0 (0.0%) |
| Manufacturing | 0 (0.0%) | 0 (0.0%) |
| Wholesale Trade | 1 (33.3%) | 2 (66.7%) |
| Retail Trade | 7 (87.5%) | 1 (12.5%) |
| Transportation & Warehousing | 6 (50.0%) | 6 (50.0%) |
| Utilities | 2 (100.0%) | 0 (0.0%) |
| Information | 0 (0.0%) | 0 (0.0%) |
| Finance & Insurance | 0 (0.0%) | 4 (100.0%) |
| Real Estate, Rental & Leasing | 0 (0.0%) | 0 (0.0%) |
| Professional & Scientific | 0 (0.0%) | 0 (0.0%) |
| Enterprise Management | 0 (0.0%) | 0 (0.0%) |
| Administrative & Support | 0 (0.0%) | 0 (0.0%) |
| Educational Services | 7 (58.3%) | 5 (41.7%) |
| Health Care & Social Assistance | 1 (33.3%) | 2 (66.7%) |
| Arts, Entertainment & Recreation | 0 (0.0%) | 0 (0.0%) |
| Accommodation & Food Services | 0 (0.0%) | 5 (100.0%) |
| Public Administration | 8 (100.0%) | 0 (0.0%) |
| Total | 39 (59.1%) | 27 (40.9%) |
Education in Hobson
School Enrollment in Hobson
The most common levels of schooling among the 33 students in Hobson are high school (16 | 48.5%), college / undergraduate (9 | 27.3%), and elementary school (4 | 12.1%).
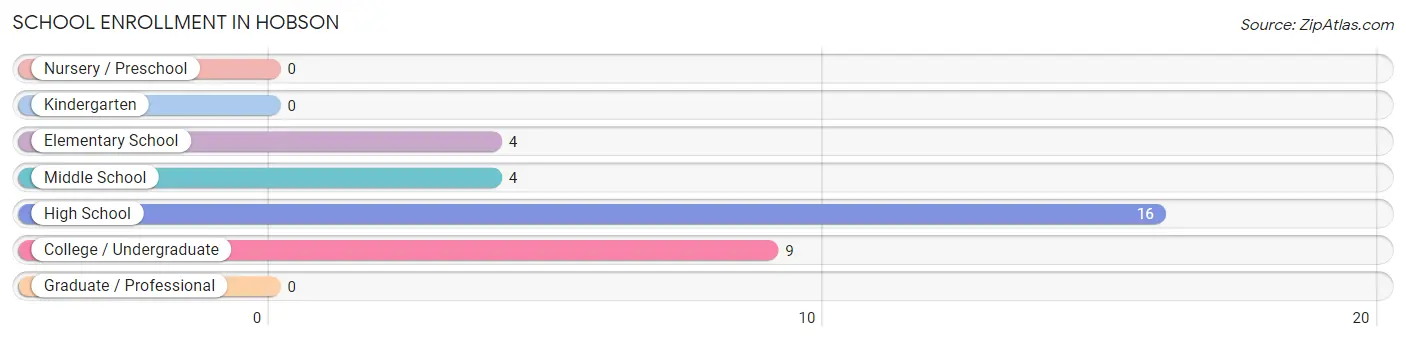
| School Level | # Students | % Students |
| Nursery / Preschool | 0 | 0.0% |
| Kindergarten | 0 | 0.0% |
| Elementary School | 4 | 12.1% |
| Middle School | 4 | 12.1% |
| High School | 16 | 48.5% |
| College / Undergraduate | 9 | 27.3% |
| Graduate / Professional | 0 | 0.0% |
| Total | 33 | 100.0% |
School Enrollment by Age by Funding Source in Hobson
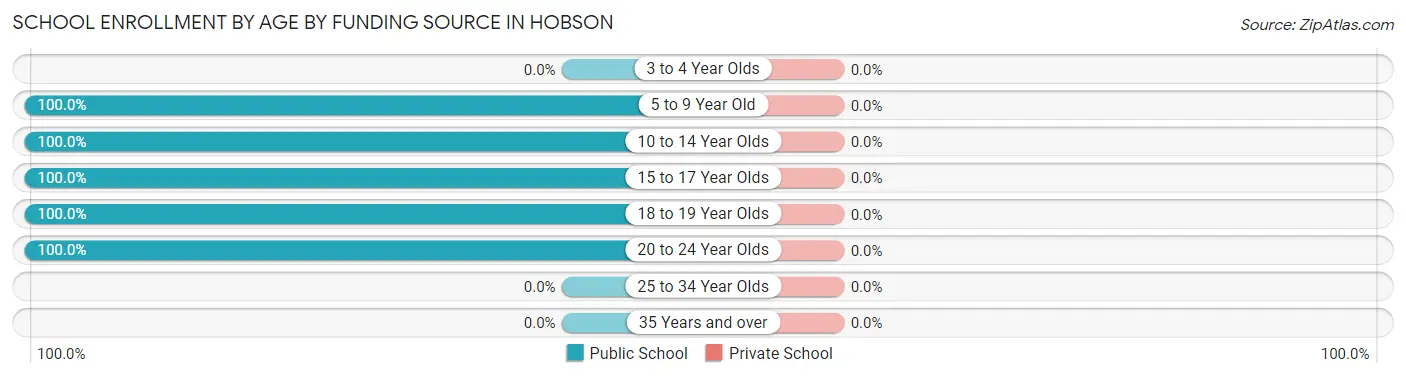
| Age Bracket | Public School | Private School |
| 3 to 4 Year Olds | 0 (0.0%) | 0 (0.0%) |
| 5 to 9 Year Old | 4 (100.0%) | 0 (0.0%) |
| 10 to 14 Year Olds | 9 (100.0%) | 0 (0.0%) |
| 15 to 17 Year Olds | 8 (100.0%) | 0 (0.0%) |
| 18 to 19 Year Olds | 9 (100.0%) | 0 (0.0%) |
| 20 to 24 Year Olds | 3 (100.0%) | 0 (0.0%) |
| 25 to 34 Year Olds | 0 (0.0%) | 0 (0.0%) |
| 35 Years and over | 0 (0.0%) | 0 (0.0%) |
| Total | 33 (100.0%) | 0 (0.0%) |
Educational Attainment by Field of Study in Hobson
Education (8 | 26.7%), business (7 | 23.3%), communications (5 | 16.7%), bio, nature & agricultural (4 | 13.3%), and science & technology (3 | 10.0%) are the most common fields of study among 30 individuals in Hobson who have obtained a bachelor's degree or higher.
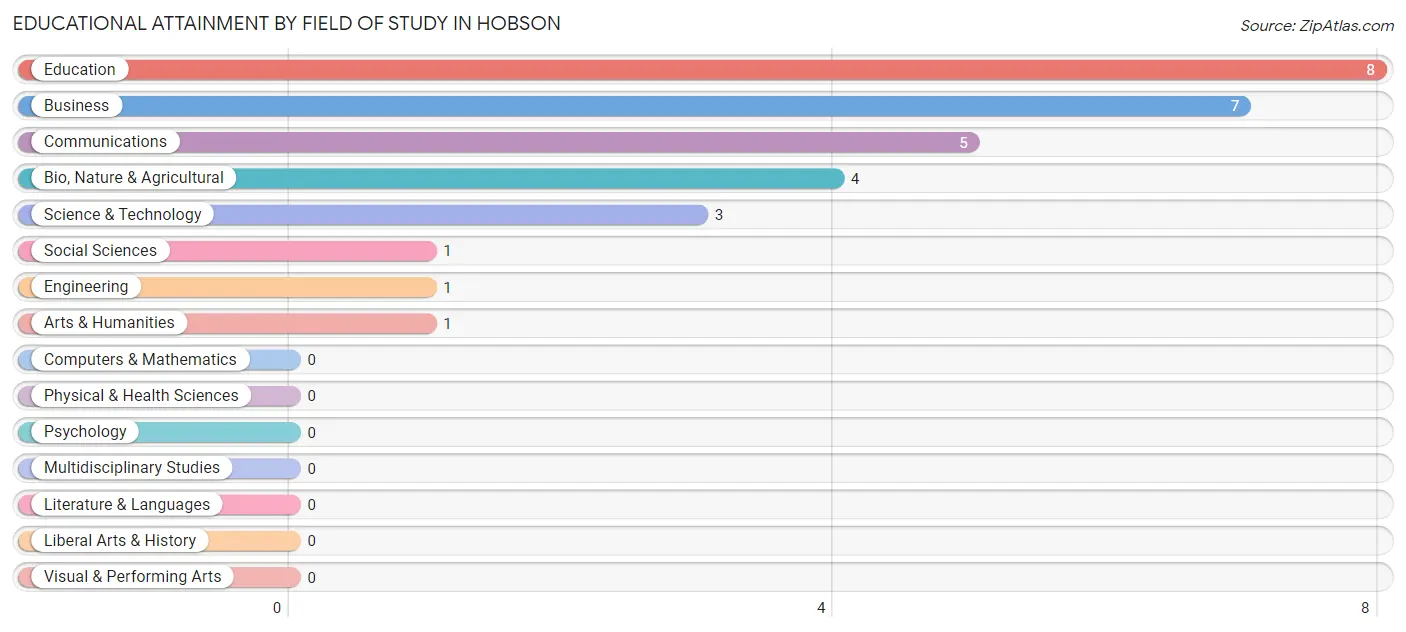
| Field of Study | # Graduates | % Graduates |
| Computers & Mathematics | 0 | 0.0% |
| Bio, Nature & Agricultural | 4 | 13.3% |
| Physical & Health Sciences | 0 | 0.0% |
| Psychology | 0 | 0.0% |
| Social Sciences | 1 | 3.3% |
| Engineering | 1 | 3.3% |
| Multidisciplinary Studies | 0 | 0.0% |
| Science & Technology | 3 | 10.0% |
| Business | 7 | 23.3% |
| Education | 8 | 26.7% |
| Literature & Languages | 0 | 0.0% |
| Liberal Arts & History | 0 | 0.0% |
| Visual & Performing Arts | 0 | 0.0% |
| Communications | 5 | 16.7% |
| Arts & Humanities | 1 | 3.3% |
| Total | 30 | 100.0% |
Transportation & Commute in Hobson
Vehicle Availability by Sex in Hobson
The most prevalent vehicle ownership categories in Hobson are males with 2 vehicles (16, accounting for 41.0%) and females with 2 vehicles (8, making up 61.5%).
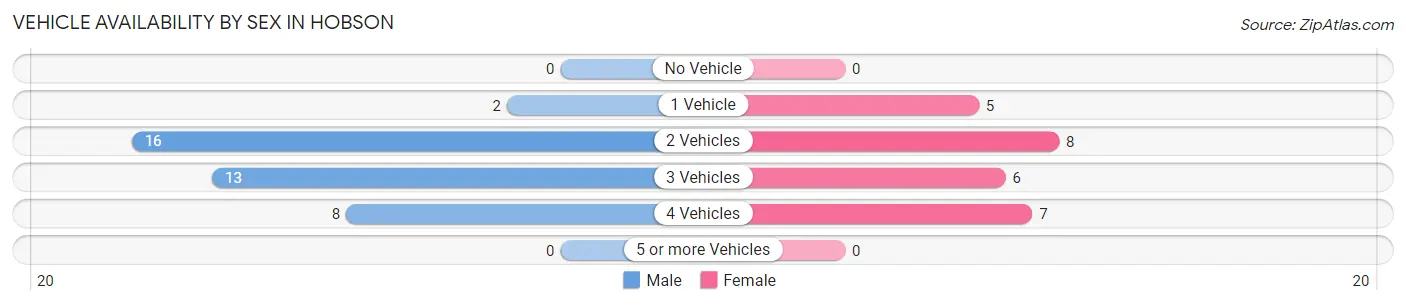
| Vehicles Available | Male | Female |
| No Vehicle | 0 (0.0%) | 0 (0.0%) |
| 1 Vehicle | 2 (5.1%) | 5 (19.2%) |
| 2 Vehicles | 16 (41.0%) | 8 (30.8%) |
| 3 Vehicles | 13 (33.3%) | 6 (23.1%) |
| 4 Vehicles | 8 (20.5%) | 7 (26.9%) |
| 5 or more Vehicles | 0 (0.0%) | 0 (0.0%) |
| Total | 39 (100.0%) | 26 (100.0%) |
Commute Time in Hobson
The most frequently occuring commute durations in Hobson are 5 to 9 minutes (29 commuters, 50.0%), less than 5 minutes (7 commuters, 12.1%), and 30 to 34 minutes (7 commuters, 12.1%).
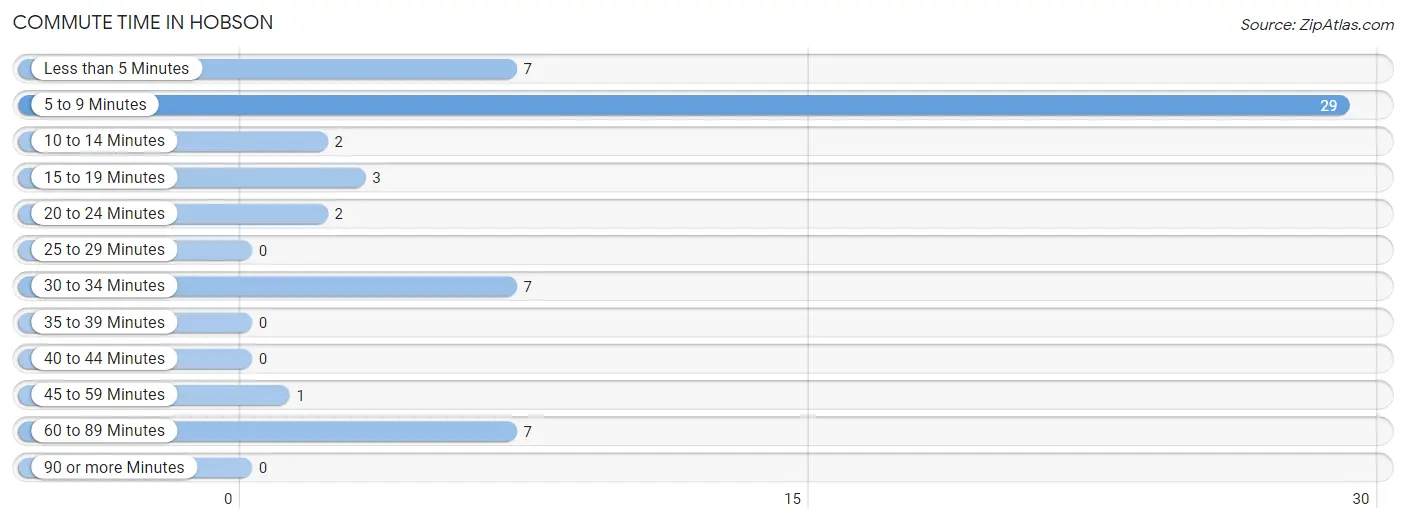
| Commute Time | # Commuters | % Commuters |
| Less than 5 Minutes | 7 | 12.1% |
| 5 to 9 Minutes | 29 | 50.0% |
| 10 to 14 Minutes | 2 | 3.5% |
| 15 to 19 Minutes | 3 | 5.2% |
| 20 to 24 Minutes | 2 | 3.5% |
| 25 to 29 Minutes | 0 | 0.0% |
| 30 to 34 Minutes | 7 | 12.1% |
| 35 to 39 Minutes | 0 | 0.0% |
| 40 to 44 Minutes | 0 | 0.0% |
| 45 to 59 Minutes | 1 | 1.7% |
| 60 to 89 Minutes | 7 | 12.1% |
| 90 or more Minutes | 0 | 0.0% |
Commute Time by Sex in Hobson
The most common commute times in Hobson are 5 to 9 minutes (17 commuters, 53.1%) for males and 5 to 9 minutes (12 commuters, 46.2%) for females.
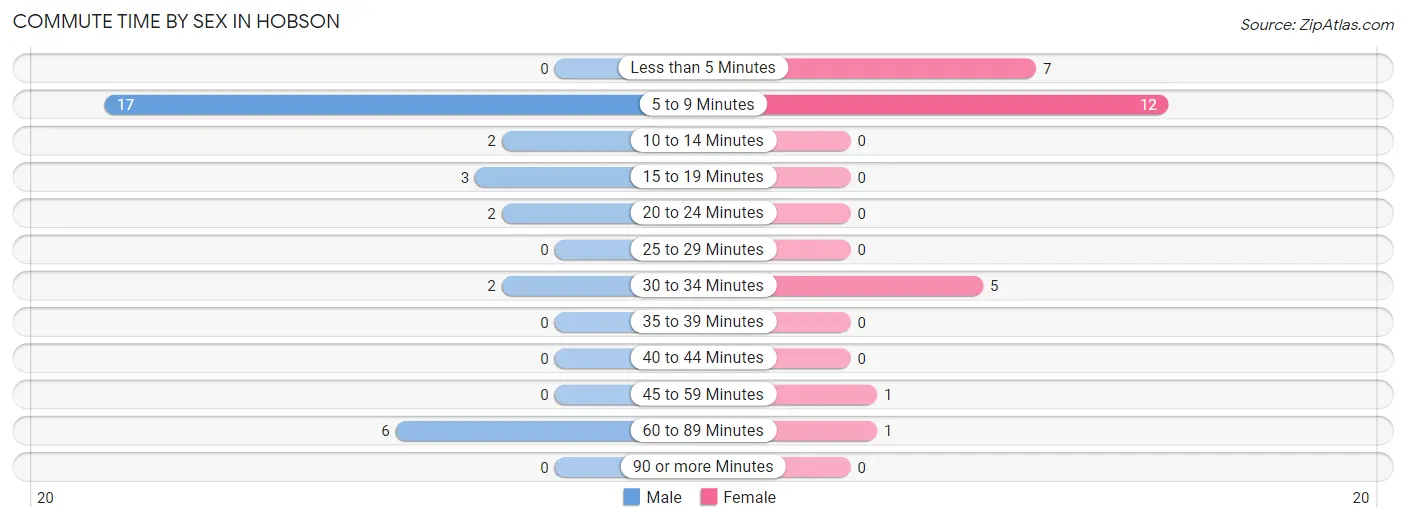
| Commute Time | Male | Female |
| Less than 5 Minutes | 0 (0.0%) | 7 (26.9%) |
| 5 to 9 Minutes | 17 (53.1%) | 12 (46.2%) |
| 10 to 14 Minutes | 2 (6.2%) | 0 (0.0%) |
| 15 to 19 Minutes | 3 (9.4%) | 0 (0.0%) |
| 20 to 24 Minutes | 2 (6.2%) | 0 (0.0%) |
| 25 to 29 Minutes | 0 (0.0%) | 0 (0.0%) |
| 30 to 34 Minutes | 2 (6.2%) | 5 (19.2%) |
| 35 to 39 Minutes | 0 (0.0%) | 0 (0.0%) |
| 40 to 44 Minutes | 0 (0.0%) | 0 (0.0%) |
| 45 to 59 Minutes | 0 (0.0%) | 1 (3.8%) |
| 60 to 89 Minutes | 6 (18.8%) | 1 (3.8%) |
| 90 or more Minutes | 0 (0.0%) | 0 (0.0%) |
Time of Departure to Work by Sex in Hobson
The most frequent times of departure to work in Hobson are 6:00 AM to 6:29 AM (9, 28.1%) for males and 8:00 AM to 8:29 AM (6, 23.1%) for females.
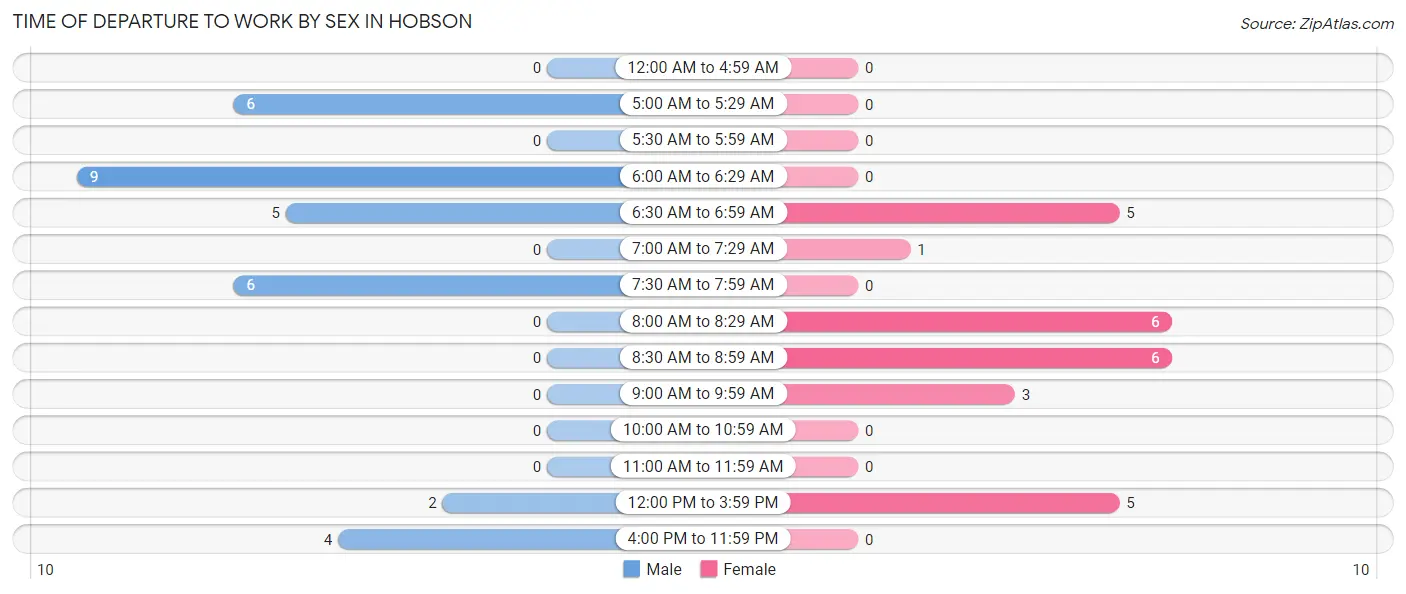
| Time of Departure | Male | Female |
| 12:00 AM to 4:59 AM | 0 (0.0%) | 0 (0.0%) |
| 5:00 AM to 5:29 AM | 6 (18.8%) | 0 (0.0%) |
| 5:30 AM to 5:59 AM | 0 (0.0%) | 0 (0.0%) |
| 6:00 AM to 6:29 AM | 9 (28.1%) | 0 (0.0%) |
| 6:30 AM to 6:59 AM | 5 (15.6%) | 5 (19.2%) |
| 7:00 AM to 7:29 AM | 0 (0.0%) | 1 (3.8%) |
| 7:30 AM to 7:59 AM | 6 (18.8%) | 0 (0.0%) |
| 8:00 AM to 8:29 AM | 0 (0.0%) | 6 (23.1%) |
| 8:30 AM to 8:59 AM | 0 (0.0%) | 6 (23.1%) |
| 9:00 AM to 9:59 AM | 0 (0.0%) | 3 (11.5%) |
| 10:00 AM to 10:59 AM | 0 (0.0%) | 0 (0.0%) |
| 11:00 AM to 11:59 AM | 0 (0.0%) | 0 (0.0%) |
| 12:00 PM to 3:59 PM | 2 (6.2%) | 5 (19.2%) |
| 4:00 PM to 11:59 PM | 4 (12.5%) | 0 (0.0%) |
| Total | 32 (100.0%) | 26 (100.0%) |
Housing Occupancy in Hobson
Occupancy by Ownership in Hobson
Of the total 95 dwellings in Hobson, owner-occupied units account for 81 (85.3%), while renter-occupied units make up 14 (14.7%).
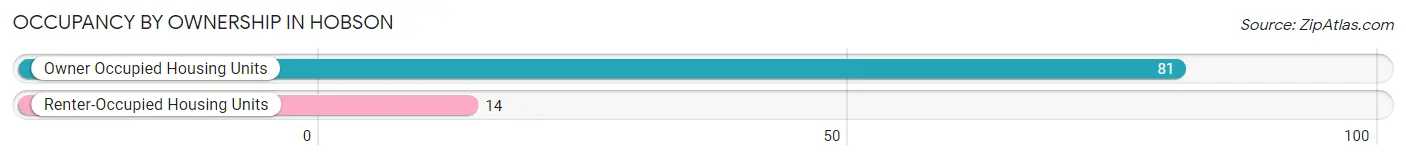
| Occupancy | # Housing Units | % Housing Units |
| Owner Occupied Housing Units | 81 | 85.3% |
| Renter-Occupied Housing Units | 14 | 14.7% |
| Total Occupied Housing Units | 95 | 100.0% |
Occupancy by Household Size in Hobson
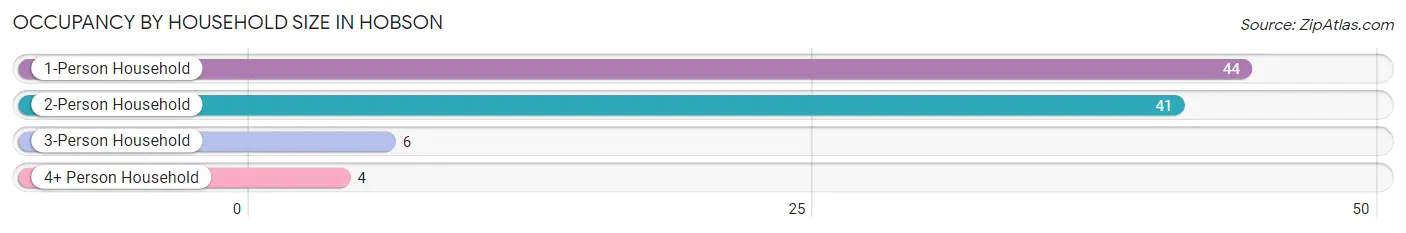
| Household Size | # Housing Units | % Housing Units |
| 1-Person Household | 44 | 46.3% |
| 2-Person Household | 41 | 43.2% |
| 3-Person Household | 6 | 6.3% |
| 4+ Person Household | 4 | 4.2% |
| Total Housing Units | 95 | 100.0% |
Occupancy by Ownership by Household Size in Hobson
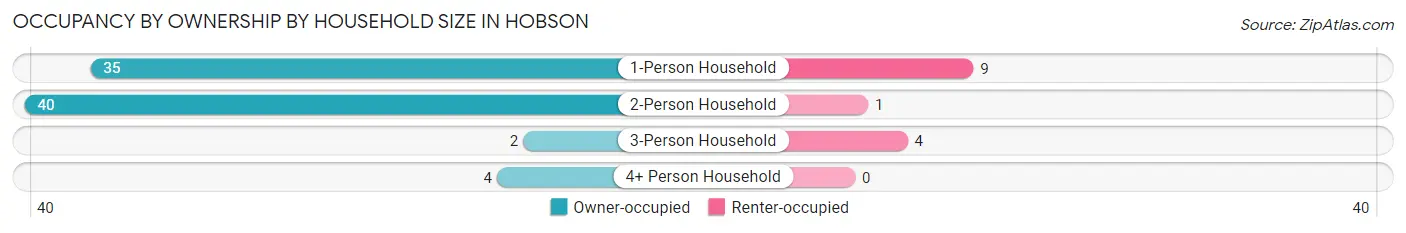
| Household Size | Owner-occupied | Renter-occupied |
| 1-Person Household | 35 (79.5%) | 9 (20.4%) |
| 2-Person Household | 40 (97.6%) | 1 (2.4%) |
| 3-Person Household | 2 (33.3%) | 4 (66.7%) |
| 4+ Person Household | 4 (100.0%) | 0 (0.0%) |
| Total Housing Units | 81 (85.3%) | 14 (14.7%) |
Occupancy by Educational Attainment in Hobson
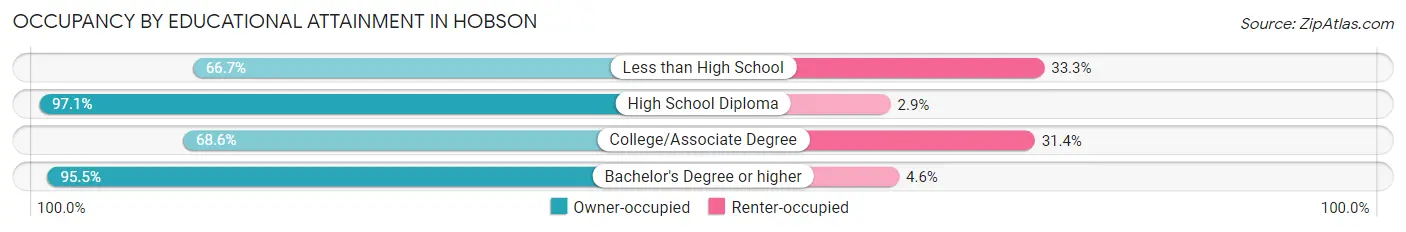
| Household Size | Owner-occupied | Renter-occupied |
| Less than High School | 2 (66.7%) | 1 (33.3%) |
| High School Diploma | 34 (97.1%) | 1 (2.9%) |
| College/Associate Degree | 24 (68.6%) | 11 (31.4%) |
| Bachelor's Degree or higher | 21 (95.5%) | 1 (4.5%) |
Occupancy by Age of Householder in Hobson
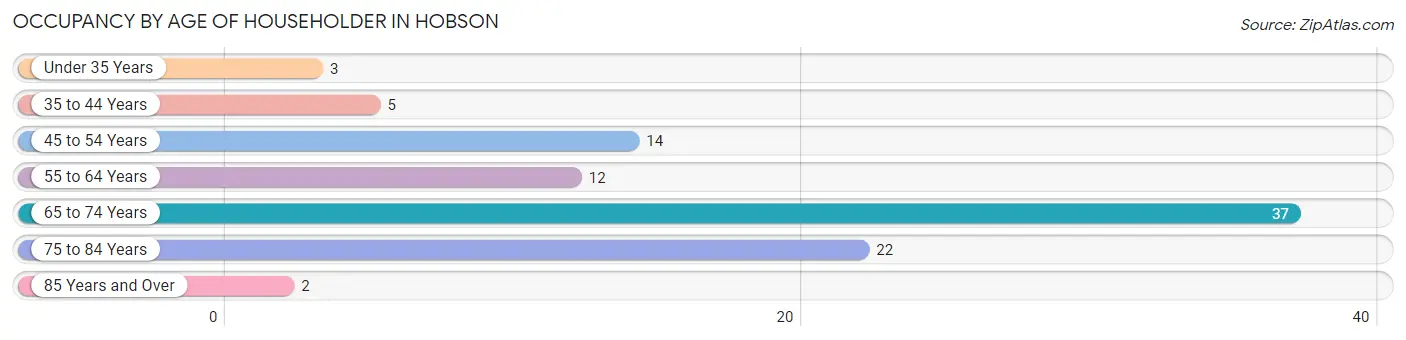
| Age Bracket | # Households | % Households |
| Under 35 Years | 3 | 3.2% |
| 35 to 44 Years | 5 | 5.3% |
| 45 to 54 Years | 14 | 14.7% |
| 55 to 64 Years | 12 | 12.6% |
| 65 to 74 Years | 37 | 39.0% |
| 75 to 84 Years | 22 | 23.2% |
| 85 Years and Over | 2 | 2.1% |
| Total | 95 | 100.0% |
Housing Finances in Hobson
Median Income by Occupancy in Hobson
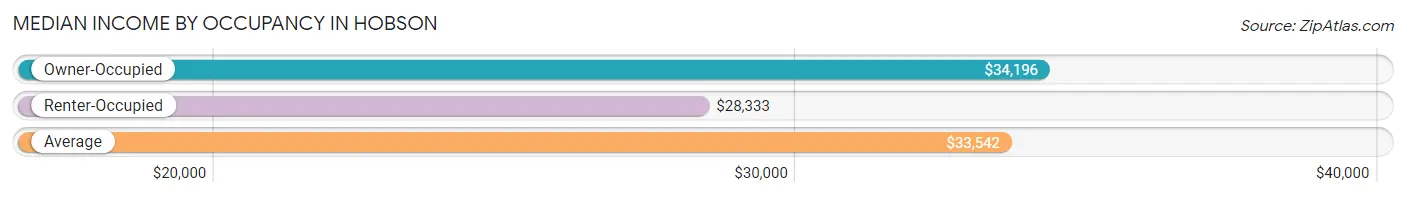
| Occupancy Type | # Households | Median Income |
| Owner-Occupied | 81 (85.3%) | $34,196 |
| Renter-Occupied | 14 (14.7%) | $28,333 |
| Average | 95 (100.0%) | $33,542 |
Occupancy by Householder Income Bracket in Hobson
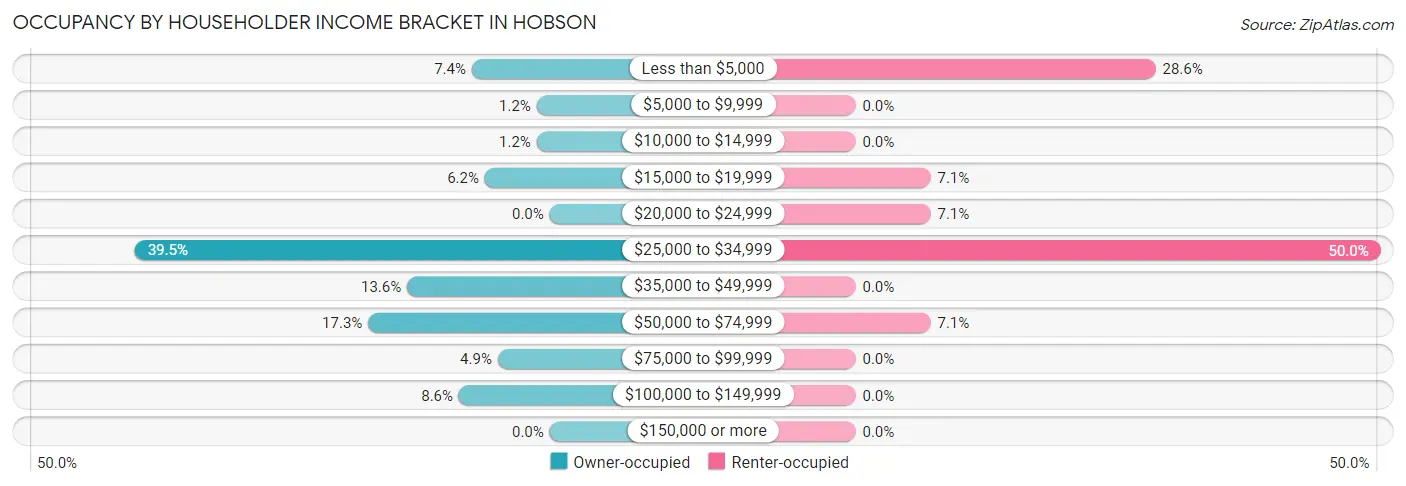
| Income Bracket | Owner-occupied | Renter-occupied |
| Less than $5,000 | 6 (7.4%) | 4 (28.6%) |
| $5,000 to $9,999 | 1 (1.2%) | 0 (0.0%) |
| $10,000 to $14,999 | 1 (1.2%) | 0 (0.0%) |
| $15,000 to $19,999 | 5 (6.2%) | 1 (7.1%) |
| $20,000 to $24,999 | 0 (0.0%) | 1 (7.1%) |
| $25,000 to $34,999 | 32 (39.5%) | 7 (50.0%) |
| $35,000 to $49,999 | 11 (13.6%) | 0 (0.0%) |
| $50,000 to $74,999 | 14 (17.3%) | 1 (7.1%) |
| $75,000 to $99,999 | 4 (4.9%) | 0 (0.0%) |
| $100,000 to $149,999 | 7 (8.6%) | 0 (0.0%) |
| $150,000 or more | 0 (0.0%) | 0 (0.0%) |
| Total | 81 (100.0%) | 14 (100.0%) |
Monthly Housing Cost Tiers in Hobson
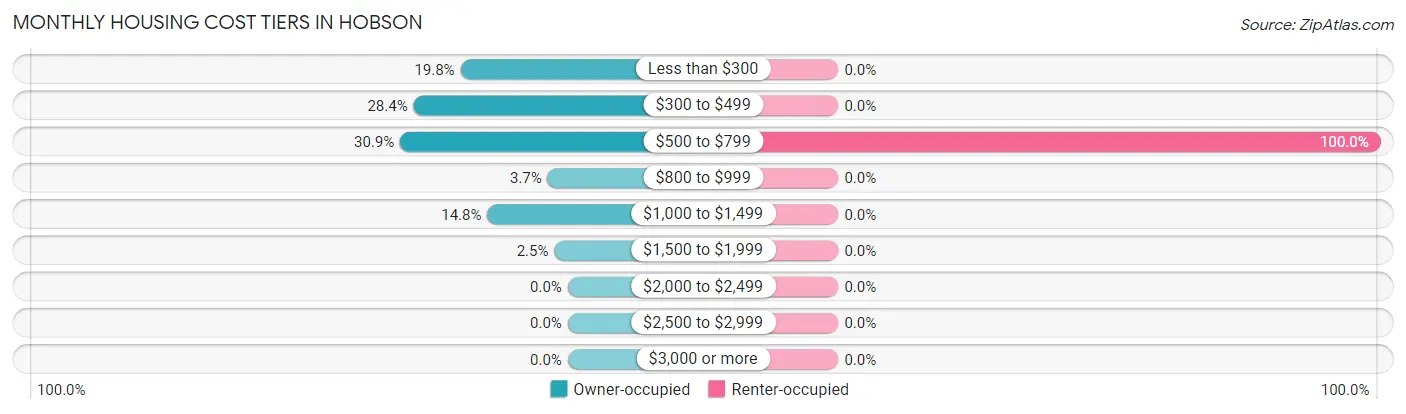
| Monthly Cost | Owner-occupied | Renter-occupied |
| Less than $300 | 16 (19.8%) | 0 (0.0%) |
| $300 to $499 | 23 (28.4%) | 0 (0.0%) |
| $500 to $799 | 25 (30.9%) | 14 (100.0%) |
| $800 to $999 | 3 (3.7%) | 0 (0.0%) |
| $1,000 to $1,499 | 12 (14.8%) | 0 (0.0%) |
| $1,500 to $1,999 | 2 (2.5%) | 0 (0.0%) |
| $2,000 to $2,499 | 0 (0.0%) | 0 (0.0%) |
| $2,500 to $2,999 | 0 (0.0%) | 0 (0.0%) |
| $3,000 or more | 0 (0.0%) | 0 (0.0%) |
| Total | 81 (100.0%) | 14 (100.0%) |
Physical Housing Characteristics in Hobson
Housing Structures in Hobson
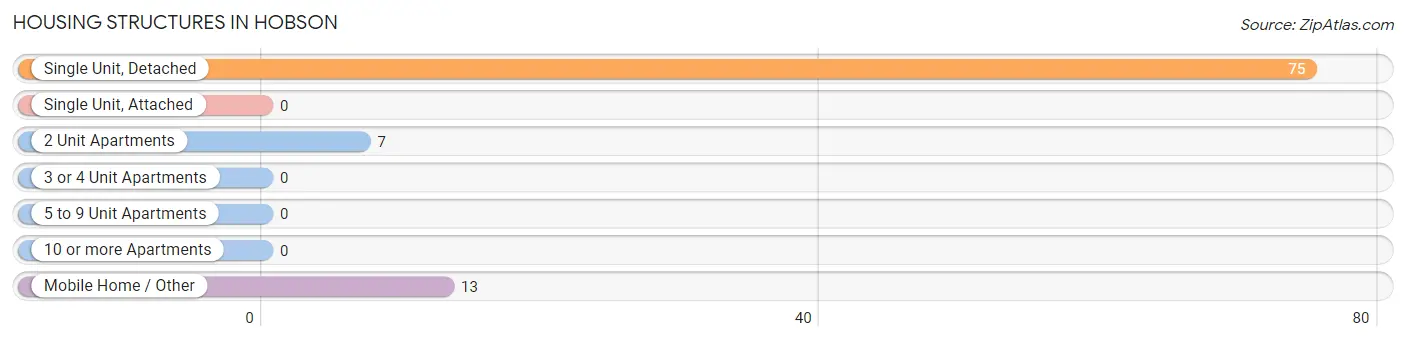
| Structure Type | # Housing Units | % Housing Units |
| Single Unit, Detached | 75 | 78.9% |
| Single Unit, Attached | 0 | 0.0% |
| 2 Unit Apartments | 7 | 7.4% |
| 3 or 4 Unit Apartments | 0 | 0.0% |
| 5 to 9 Unit Apartments | 0 | 0.0% |
| 10 or more Apartments | 0 | 0.0% |
| Mobile Home / Other | 13 | 13.7% |
| Total | 95 | 100.0% |
Housing Structures by Occupancy in Hobson
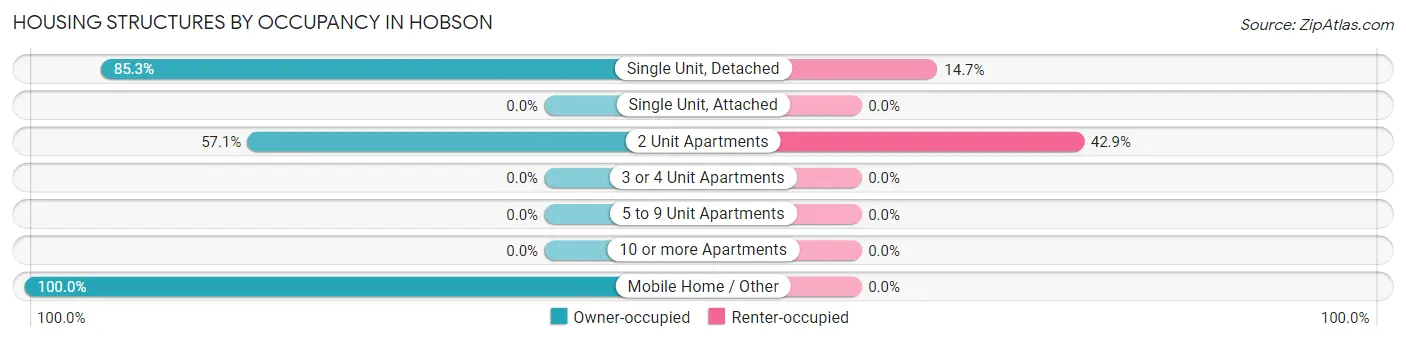
| Structure Type | Owner-occupied | Renter-occupied |
| Single Unit, Detached | 64 (85.3%) | 11 (14.7%) |
| Single Unit, Attached | 0 (0.0%) | 0 (0.0%) |
| 2 Unit Apartments | 4 (57.1%) | 3 (42.9%) |
| 3 or 4 Unit Apartments | 0 (0.0%) | 0 (0.0%) |
| 5 to 9 Unit Apartments | 0 (0.0%) | 0 (0.0%) |
| 10 or more Apartments | 0 (0.0%) | 0 (0.0%) |
| Mobile Home / Other | 13 (100.0%) | 0 (0.0%) |
| Total | 81 (85.3%) | 14 (14.7%) |
Housing Structures by Number of Rooms in Hobson
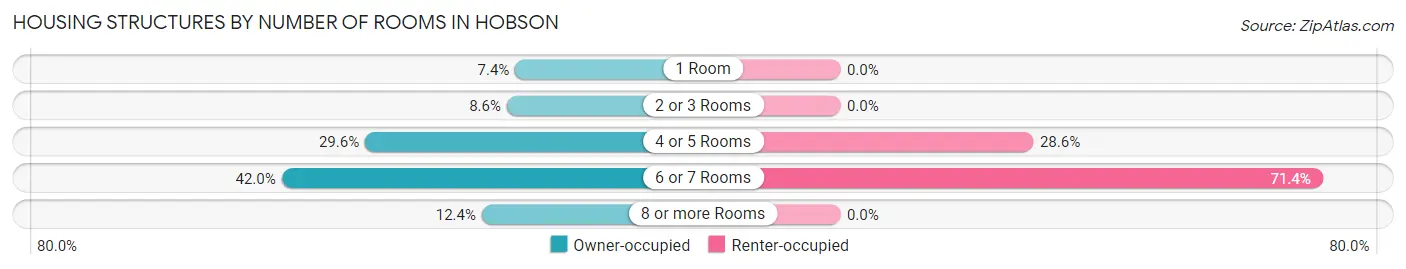
| Number of Rooms | Owner-occupied | Renter-occupied |
| 1 Room | 6 (7.4%) | 0 (0.0%) |
| 2 or 3 Rooms | 7 (8.6%) | 0 (0.0%) |
| 4 or 5 Rooms | 24 (29.6%) | 4 (28.6%) |
| 6 or 7 Rooms | 34 (42.0%) | 10 (71.4%) |
| 8 or more Rooms | 10 (12.3%) | 0 (0.0%) |
| Total | 81 (100.0%) | 14 (100.0%) |
Housing Structure by Heating Type in Hobson
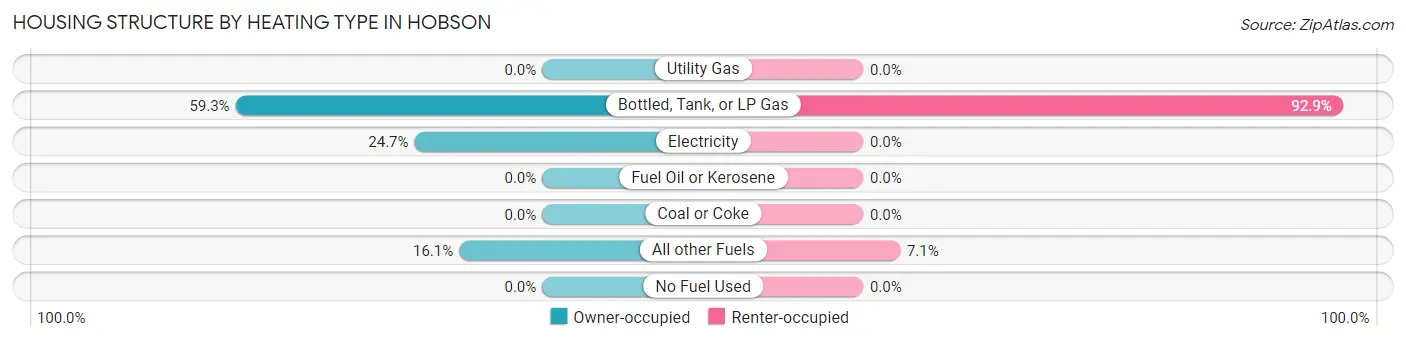
| Heating Type | Owner-occupied | Renter-occupied |
| Utility Gas | 0 (0.0%) | 0 (0.0%) |
| Bottled, Tank, or LP Gas | 48 (59.3%) | 13 (92.9%) |
| Electricity | 20 (24.7%) | 0 (0.0%) |
| Fuel Oil or Kerosene | 0 (0.0%) | 0 (0.0%) |
| Coal or Coke | 0 (0.0%) | 0 (0.0%) |
| All other Fuels | 13 (16.1%) | 1 (7.1%) |
| No Fuel Used | 0 (0.0%) | 0 (0.0%) |
| Total | 81 (100.0%) | 14 (100.0%) |
Household Vehicle Usage in Hobson
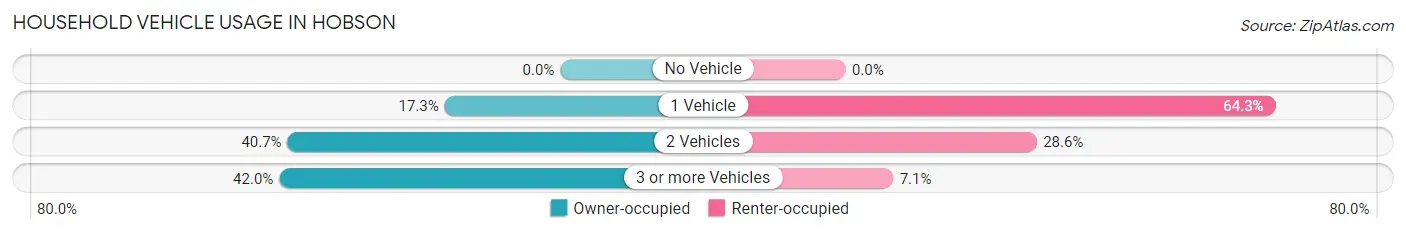
| Vehicles per Household | Owner-occupied | Renter-occupied |
| No Vehicle | 0 (0.0%) | 0 (0.0%) |
| 1 Vehicle | 14 (17.3%) | 9 (64.3%) |
| 2 Vehicles | 33 (40.7%) | 4 (28.6%) |
| 3 or more Vehicles | 34 (42.0%) | 1 (7.1%) |
| Total | 81 (100.0%) | 14 (100.0%) |
Real Estate & Mortgages in Hobson
Real Estate and Mortgage Overview in Hobson
| Characteristic | Without Mortgage | With Mortgage |
| Housing Units | 65 | 16 |
| Median Property Value | $123,800 | $0 |
| Median Household Income | $34,375 | $0 |
| Monthly Housing Costs | $381 | $0 |
| Real Estate Taxes | $1,132 | $1 |
Property Value by Mortgage Status in Hobson
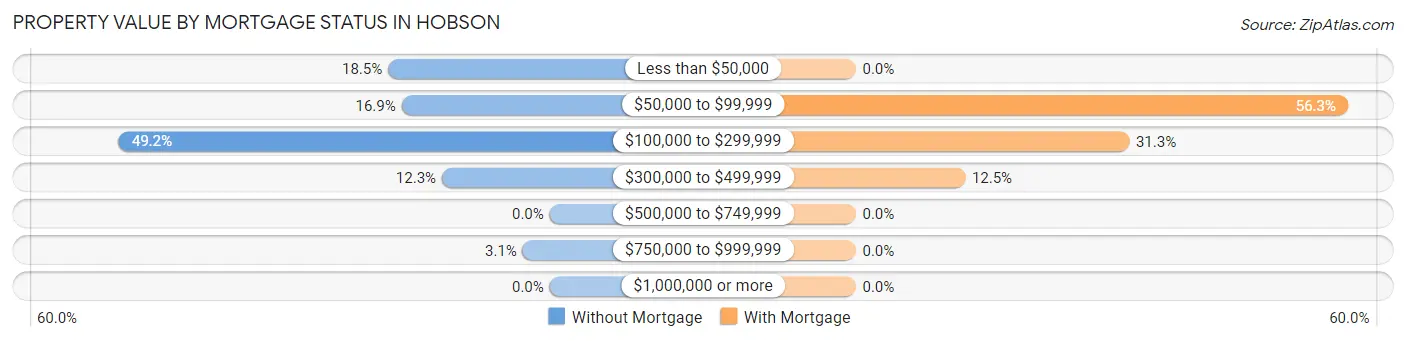
| Property Value | Without Mortgage | With Mortgage |
| Less than $50,000 | 12 (18.5%) | 0 (0.0%) |
| $50,000 to $99,999 | 11 (16.9%) | 9 (56.2%) |
| $100,000 to $299,999 | 32 (49.2%) | 5 (31.2%) |
| $300,000 to $499,999 | 8 (12.3%) | 2 (12.5%) |
| $500,000 to $749,999 | 0 (0.0%) | 0 (0.0%) |
| $750,000 to $999,999 | 2 (3.1%) | 0 (0.0%) |
| $1,000,000 or more | 0 (0.0%) | 0 (0.0%) |
| Total | 65 (100.0%) | 16 (100.0%) |
Household Income by Mortgage Status in Hobson
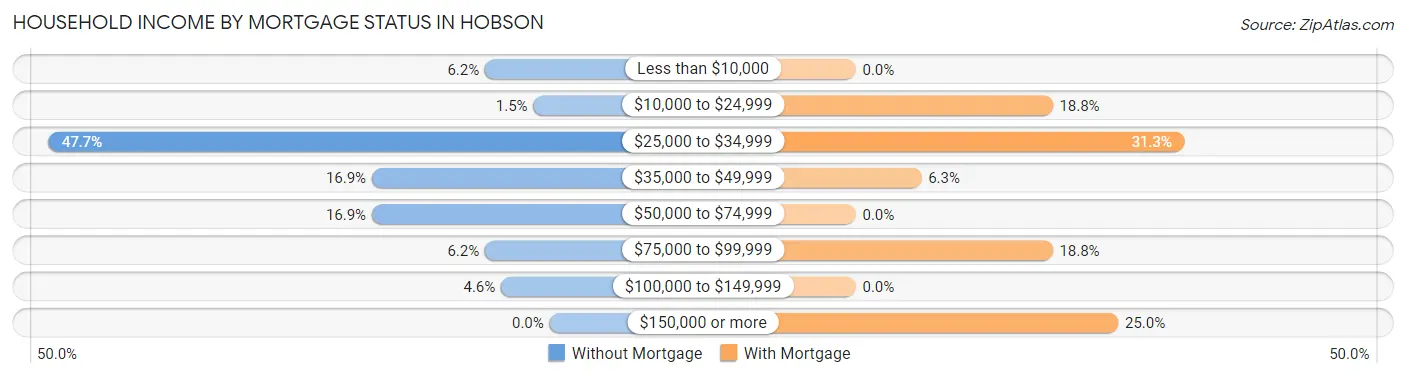
| Household Income | Without Mortgage | With Mortgage |
| Less than $10,000 | 4 (6.1%) | 0 (0.0%) |
| $10,000 to $24,999 | 1 (1.5%) | 3 (18.8%) |
| $25,000 to $34,999 | 31 (47.7%) | 5 (31.2%) |
| $35,000 to $49,999 | 11 (16.9%) | 1 (6.2%) |
| $50,000 to $74,999 | 11 (16.9%) | 0 (0.0%) |
| $75,000 to $99,999 | 4 (6.1%) | 3 (18.8%) |
| $100,000 to $149,999 | 3 (4.6%) | 0 (0.0%) |
| $150,000 or more | 0 (0.0%) | 4 (25.0%) |
| Total | 65 (100.0%) | 16 (100.0%) |
Property Value to Household Income Ratio in Hobson
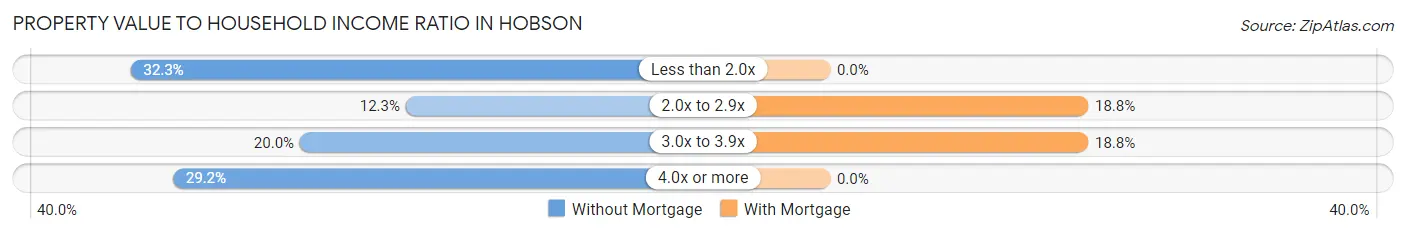
| Value-to-Income Ratio | Without Mortgage | With Mortgage |
| Less than 2.0x | 21 (32.3%) | 0 (0.0%) |
| 2.0x to 2.9x | 8 (12.3%) | 3 (18.8%) |
| 3.0x to 3.9x | 13 (20.0%) | 3 (18.8%) |
| 4.0x or more | 19 (29.2%) | 0 (0.0%) |
| Total | 65 (100.0%) | 16 (100.0%) |
Real Estate Taxes by Mortgage Status in Hobson
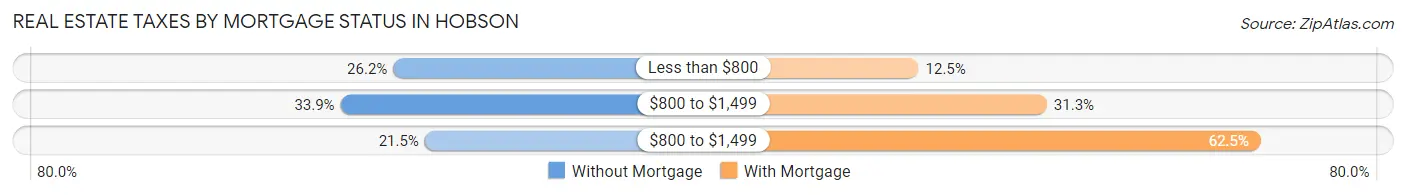
| Property Taxes | Without Mortgage | With Mortgage |
| Less than $800 | 17 (26.2%) | 2 (12.5%) |
| $800 to $1,499 | 22 (33.9%) | 5 (31.2%) |
| $800 to $1,499 | 14 (21.5%) | 10 (62.5%) |
| Total | 65 (100.0%) | 16 (100.0%) |
Health & Disability in Hobson
Health Insurance Coverage by Age in Hobson
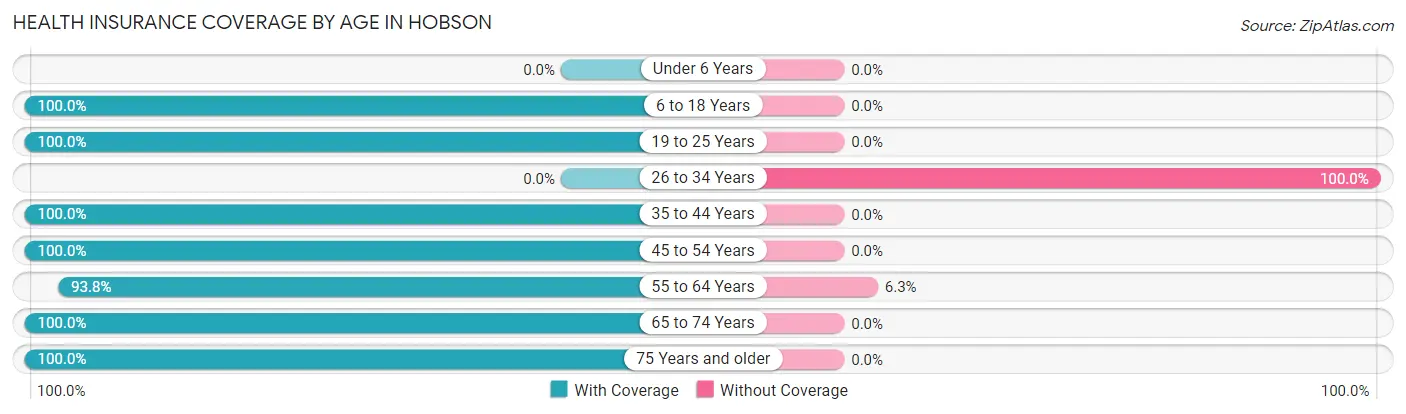
| Age Bracket | With Coverage | Without Coverage |
| Under 6 Years | 0 (0.0%) | 0 (0.0%) |
| 6 to 18 Years | 24 (100.0%) | 0 (0.0%) |
| 19 to 25 Years | 9 (100.0%) | 0 (0.0%) |
| 26 to 34 Years | 0 (0.0%) | 1 (100.0%) |
| 35 to 44 Years | 5 (100.0%) | 0 (0.0%) |
| 45 to 54 Years | 27 (100.0%) | 0 (0.0%) |
| 55 to 64 Years | 15 (93.8%) | 1 (6.2%) |
| 65 to 74 Years | 49 (100.0%) | 0 (0.0%) |
| 75 Years and older | 38 (100.0%) | 0 (0.0%) |
| Total | 167 (98.8%) | 2 (1.2%) |
Health Insurance Coverage by Citizenship Status in Hobson
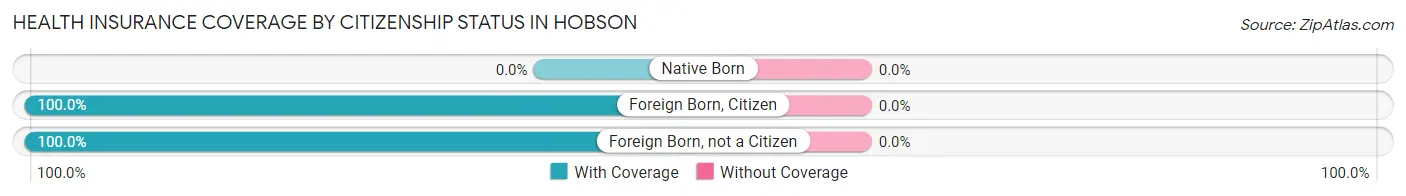
| Citizenship Status | With Coverage | Without Coverage |
| Native Born | 0 (0.0%) | 0 (0.0%) |
| Foreign Born, Citizen | 24 (100.0%) | 0 (0.0%) |
| Foreign Born, not a Citizen | 9 (100.0%) | 0 (0.0%) |
Health Insurance Coverage by Household Income in Hobson
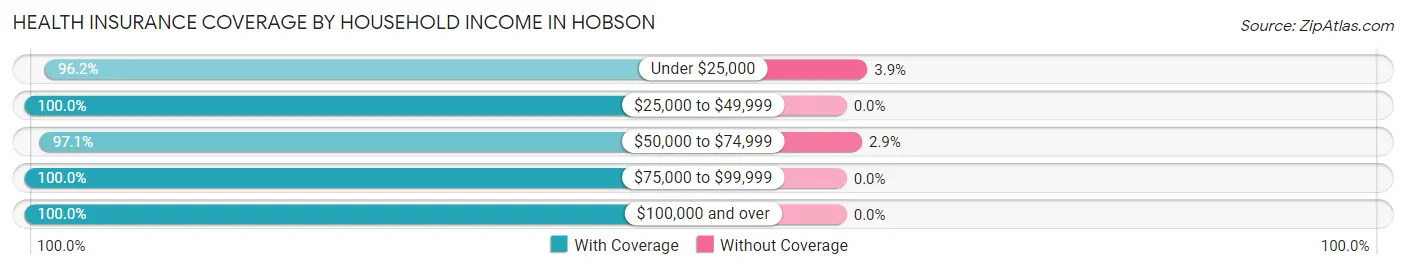
| Household Income | With Coverage | Without Coverage |
| Under $25,000 | 25 (96.2%) | 1 (3.8%) |
| $25,000 to $49,999 | 77 (100.0%) | 0 (0.0%) |
| $50,000 to $74,999 | 34 (97.1%) | 1 (2.9%) |
| $75,000 to $99,999 | 6 (100.0%) | 0 (0.0%) |
| $100,000 and over | 25 (100.0%) | 0 (0.0%) |
Public vs Private Health Insurance Coverage by Age in Hobson
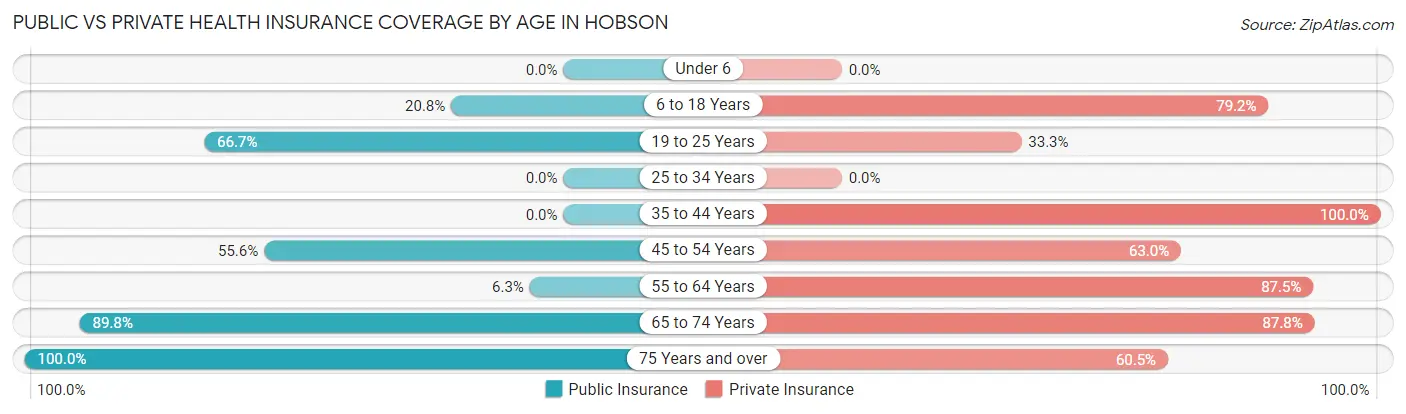
| Age Bracket | Public Insurance | Private Insurance |
| Under 6 | 0 (0.0%) | 0 (0.0%) |
| 6 to 18 Years | 5 (20.8%) | 19 (79.2%) |
| 19 to 25 Years | 6 (66.7%) | 3 (33.3%) |
| 25 to 34 Years | 0 (0.0%) | 0 (0.0%) |
| 35 to 44 Years | 0 (0.0%) | 5 (100.0%) |
| 45 to 54 Years | 15 (55.6%) | 17 (63.0%) |
| 55 to 64 Years | 1 (6.2%) | 14 (87.5%) |
| 65 to 74 Years | 44 (89.8%) | 43 (87.8%) |
| 75 Years and over | 38 (100.0%) | 23 (60.5%) |
| Total | 109 (64.5%) | 124 (73.4%) |
Disability Status by Sex by Age in Hobson
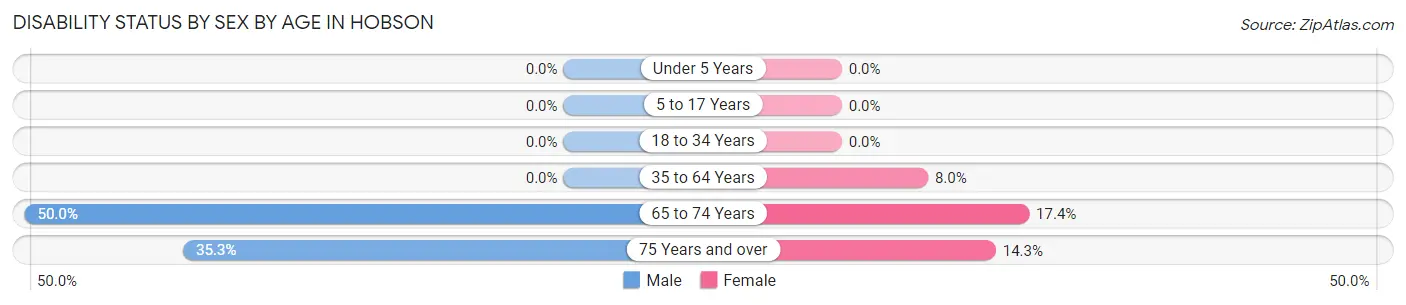
| Age Bracket | Male | Female |
| Under 5 Years | 0 (0.0%) | 0 (0.0%) |
| 5 to 17 Years | 0 (0.0%) | 0 (0.0%) |
| 18 to 34 Years | 0 (0.0%) | 0 (0.0%) |
| 35 to 64 Years | 0 (0.0%) | 2 (8.0%) |
| 65 to 74 Years | 13 (50.0%) | 4 (17.4%) |
| 75 Years and over | 6 (35.3%) | 3 (14.3%) |
Disability Class by Sex by Age in Hobson
Disability Class: Hearing Difficulty
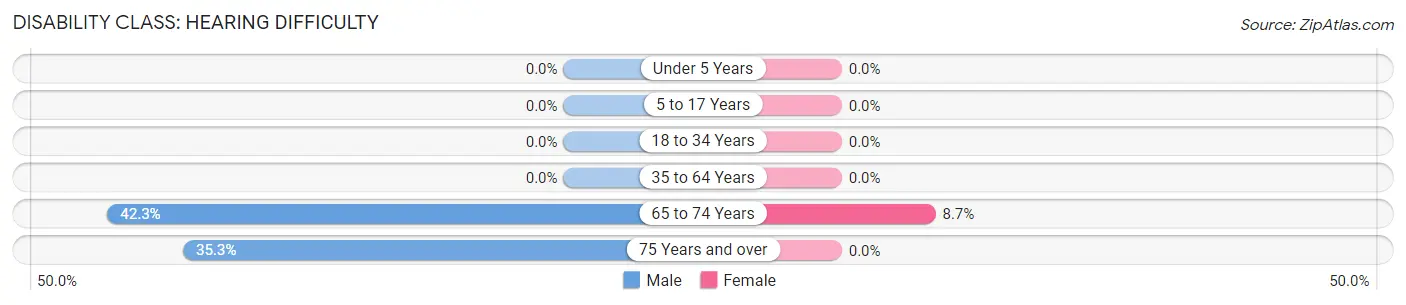
| Age Bracket | Male | Female |
| Under 5 Years | 0 (0.0%) | 0 (0.0%) |
| 5 to 17 Years | 0 (0.0%) | 0 (0.0%) |
| 18 to 34 Years | 0 (0.0%) | 0 (0.0%) |
| 35 to 64 Years | 0 (0.0%) | 0 (0.0%) |
| 65 to 74 Years | 11 (42.3%) | 2 (8.7%) |
| 75 Years and over | 6 (35.3%) | 0 (0.0%) |
Disability Class: Vision Difficulty
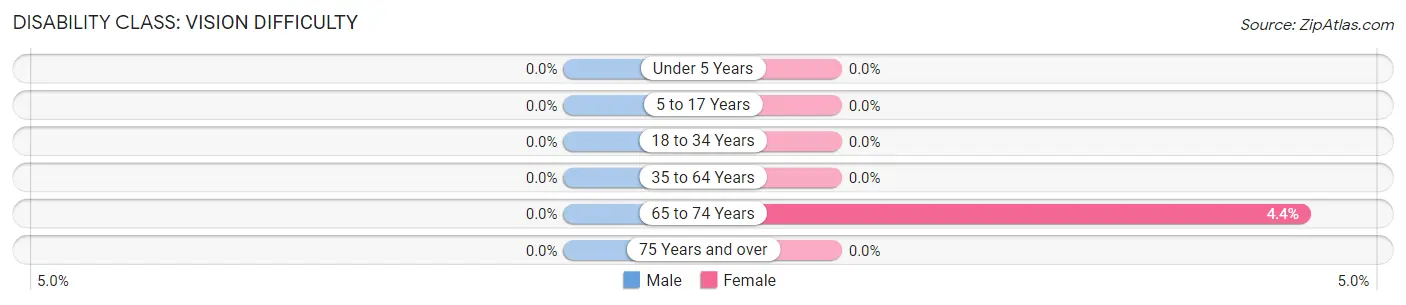
| Age Bracket | Male | Female |
| Under 5 Years | 0 (0.0%) | 0 (0.0%) |
| 5 to 17 Years | 0 (0.0%) | 0 (0.0%) |
| 18 to 34 Years | 0 (0.0%) | 0 (0.0%) |
| 35 to 64 Years | 0 (0.0%) | 0 (0.0%) |
| 65 to 74 Years | 0 (0.0%) | 1 (4.3%) |
| 75 Years and over | 0 (0.0%) | 0 (0.0%) |
Disability Class: Cognitive Difficulty
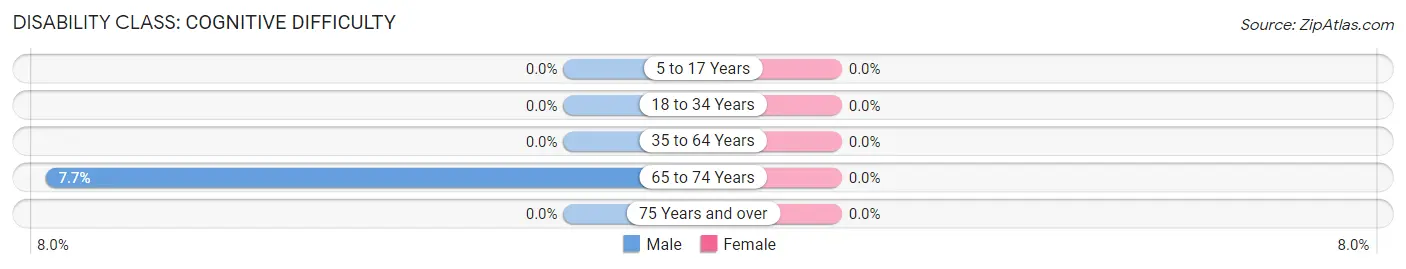
| Age Bracket | Male | Female |
| 5 to 17 Years | 0 (0.0%) | 0 (0.0%) |
| 18 to 34 Years | 0 (0.0%) | 0 (0.0%) |
| 35 to 64 Years | 0 (0.0%) | 0 (0.0%) |
| 65 to 74 Years | 2 (7.7%) | 0 (0.0%) |
| 75 Years and over | 0 (0.0%) | 0 (0.0%) |
Disability Class: Ambulatory Difficulty
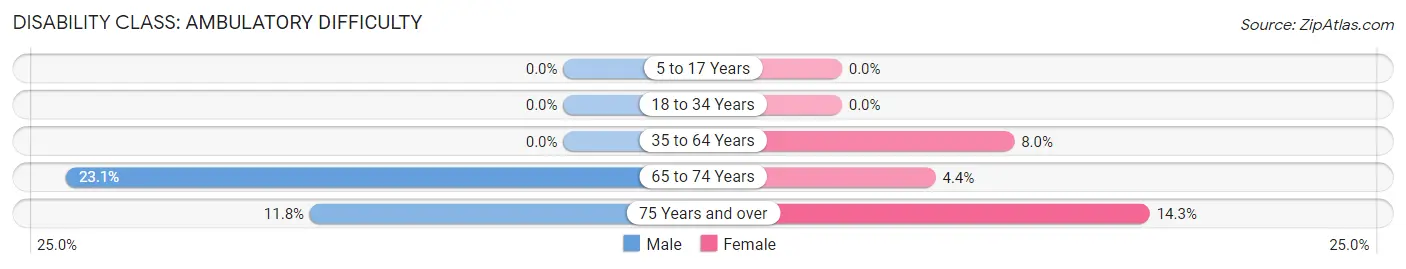
| Age Bracket | Male | Female |
| 5 to 17 Years | 0 (0.0%) | 0 (0.0%) |
| 18 to 34 Years | 0 (0.0%) | 0 (0.0%) |
| 35 to 64 Years | 0 (0.0%) | 2 (8.0%) |
| 65 to 74 Years | 6 (23.1%) | 1 (4.3%) |
| 75 Years and over | 2 (11.8%) | 3 (14.3%) |
Disability Class: Self-Care Difficulty
| Age Bracket | Male | Female |
| 5 to 17 Years | 0 (0.0%) | 0 (0.0%) |
| 18 to 34 Years | 0 (0.0%) | 0 (0.0%) |
| 35 to 64 Years | 0 (0.0%) | 0 (0.0%) |
| 65 to 74 Years | 0 (0.0%) | 0 (0.0%) |
| 75 Years and over | 0 (0.0%) | 0 (0.0%) |
Technology Access in Hobson
Computing Device Access in Hobson
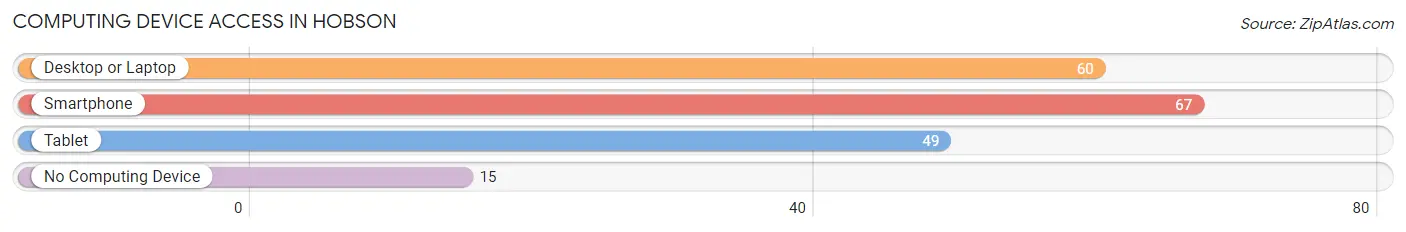
| Device Type | # Households | % Households |
| Desktop or Laptop | 60 | 63.2% |
| Smartphone | 67 | 70.5% |
| Tablet | 49 | 51.6% |
| No Computing Device | 15 | 15.8% |
| Total | 95 | 100.0% |
Internet Access in Hobson
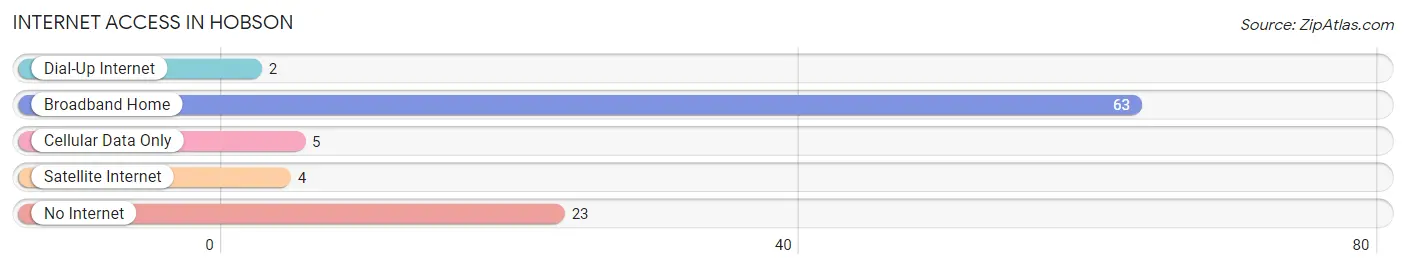
| Internet Type | # Households | % Households |
| Dial-Up Internet | 2 | 2.1% |
| Broadband Home | 63 | 66.3% |
| Cellular Data Only | 5 | 5.3% |
| Satellite Internet | 4 | 4.2% |
| No Internet | 23 | 24.2% |
| Total | 95 | 100.0% |
Hobson Summary
Hobson is a small town located in the state of Montana, in the United States. It is situated in the north-central part of the state, in Judith Basin County. The town has a population of approximately 500 people, and is located on the banks of the Judith River.
History
Hobson was founded in 1882 by a group of homesteaders who were looking for a place to settle. The town was named after a local rancher, John Hobson, who had a large ranch in the area. The town was originally a farming and ranching community, and the first settlers were mostly of German and Scandinavian descent.
In the early 1900s, the town began to grow and develop. The railroad came to town in 1906, and the town was incorporated in 1909. The railroad brought new businesses and industries to the area, and the town began to grow and prosper.
Geography
Hobson is located in the north-central part of Montana, in Judith Basin County. The town is situated on the banks of the Judith River, and is surrounded by rolling hills and prairies. The town is located at an elevation of 3,400 feet, and has a total area of 0.7 square miles.
The climate in Hobson is semi-arid, with hot summers and cold winters. The average annual temperature is around 50 degrees Fahrenheit, and the average annual precipitation is around 12 inches.
Economy
The economy of Hobson is largely based on agriculture and ranching. The town is home to several large ranches, and the surrounding area is used for cattle and sheep grazing. The town also has a few small businesses, including a grocery store, a hardware store, and a few restaurants.
The town is also home to a few small manufacturing companies, which produce a variety of products, including furniture, clothing, and electronics. The town also has a few small tourist attractions, including a museum and a few historic sites.
Demographics
As of the 2010 census, the population of Hobson was 498 people. The racial makeup of the town was 97.2% White, 0.2% African American, 0.4% Native American, 0.2% Asian, 0.2% from other races, and 1.9% from two or more races. Hispanic or Latino of any race were 1.2% of the population.
The median income for a household in Hobson was $37,500, and the median income for a family was $41,250. The per capita income for the town was $17,845. About 11.2% of families and 13.2% of the population were below the poverty line, including 16.7% of those under age 18 and 8.3% of those age 65 or over.
Hobson is a small town with a rich history and a strong sense of community. The town is home to a variety of businesses and industries, and the surrounding area is used for cattle and sheep grazing. The town has a population of approximately 500 people, and is located on the banks of the Judith River. The town is a great place to live, work, and raise a family.
Common Questions
What is Per Capita Income in Hobson?
Per Capita income in Hobson is $22,753.
What is the Median Family Income in Hobson?
Median Family Income in Hobson is $43,125.
What is the Median Household income in Hobson?
Median Household Income in Hobson is $33,542.
What is Income or Wage Gap in Hobson?
Income or Wage Gap in Hobson is 11.4%.
Women in Hobson earn 88.6 cents for every dollar earned by a man.
What is Inequality or Gini Index in Hobson?
Inequality or Gini Index in Hobson is 0.37.
What is the Total Population of Hobson?
Total Population of Hobson is 169.
What is the Total Male Population of Hobson?
Total Male Population of Hobson is 77.
What is the Total Female Population of Hobson?
Total Female Population of Hobson is 92.
What is the Ratio of Males per 100 Females in Hobson?
There are 83.70 Males per 100 Females in Hobson.
What is the Ratio of Females per 100 Males in Hobson?
There are 119.48 Females per 100 Males in Hobson.
What is the Median Population Age in Hobson?
Median Population Age in Hobson is 65.4 Years.
What is the Average Family Size in Hobson
Average Family Size in Hobson is 2.5 People.
What is the Average Household Size in Hobson
Average Household Size in Hobson is 1.8 People.
How Large is the Labor Force in Hobson?
There are 80 People in the Labor Forcein in Hobson.
What is the Percentage of People in the Labor Force in Hobson?
52.6% of People are in the Labor Force in Hobson.
What is the Unemployment Rate in Hobson?
Unemployment Rate in Hobson is 17.5%.