Sheridan, MT Map & Demographics
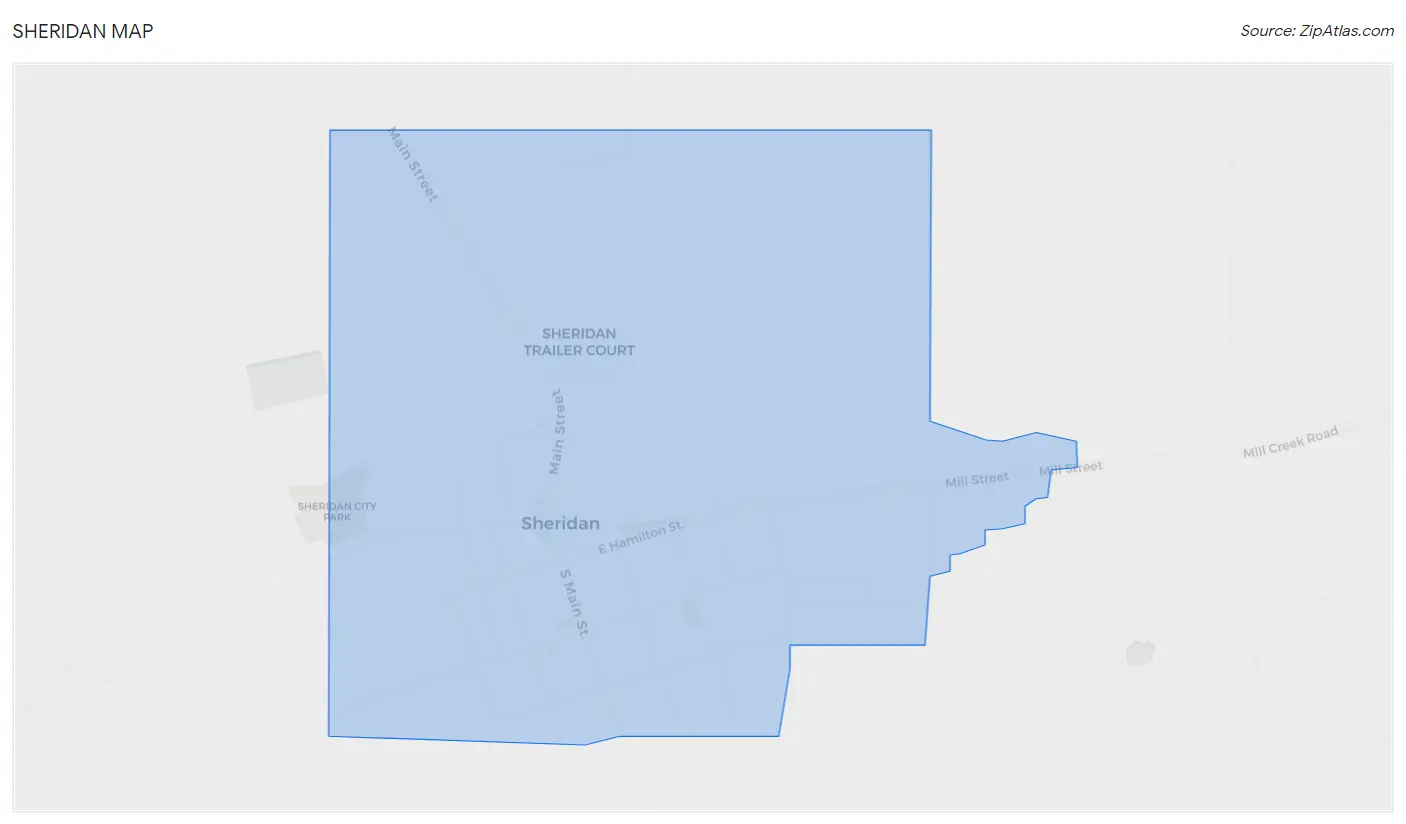
Sheridan Map
Sheridan Overview
$37,291
PER CAPITA INCOME
$81,573
AVG FAMILY INCOME
$80,444
AVG HOUSEHOLD INCOME
77.1%
WAGE / INCOME GAP [ % ]
22.9¢/ $1
WAGE / INCOME GAP [ $ ]
0.35
INEQUALITY / GINI INDEX
867
TOTAL POPULATION
352
MALE POPULATION
515
FEMALE POPULATION
68.35
MALES / 100 FEMALES
146.31
FEMALES / 100 MALES
54.8
MEDIAN AGE
3.5
AVG FAMILY SIZE
2.3
AVG HOUSEHOLD SIZE
447
LABOR FORCE [ PEOPLE ]
57.6%
PERCENT IN LABOR FORCE
2.5%
UNEMPLOYMENT RATE
Sheridan Zip Codes
Sheridan Area Codes
Income in Sheridan
Income Overview in Sheridan
Per Capita Income in Sheridan is $37,291, while median incomes of families and households are $81,573 and $80,444 respectively.
| Characteristic | Number | Measure |
| Per Capita Income | 867 | $37,291 |
| Median Family Income | 179 | $81,573 |
| Mean Family Income | 179 | $86,151 |
| Median Household Income | 369 | $80,444 |
| Mean Household Income | 369 | $73,596 |
| Income Deficit | 179 | $0 |
| Wage / Income Gap (%) | 867 | 77.08% |
| Wage / Income Gap ($) | 867 | 22.92¢ per $1 |
| Gini / Inequality Index | 867 | 0.35 |
Earnings by Sex in Sheridan
Average Earnings in Sheridan are $28,611, $55,913 for men and $12,813 for women, a difference of 77.1%.
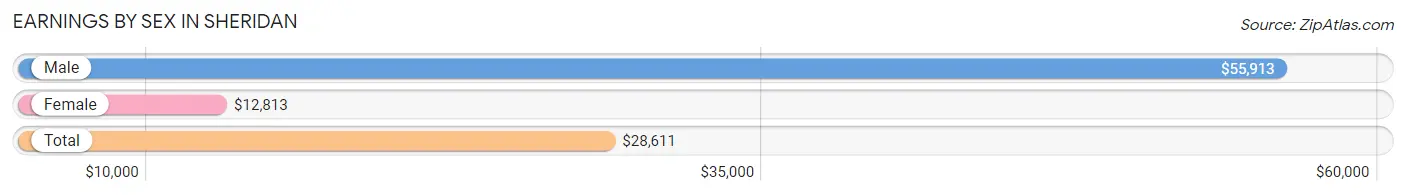
| Sex | Number | Average Earnings |
| Male | 199 (41.3%) | $55,913 |
| Female | 283 (58.7%) | $12,813 |
| Total | 482 (100.0%) | $28,611 |
Earnings by Sex by Income Bracket in Sheridan
The most common earnings brackets in Sheridan are $65,000 to $74,999 for men (38 | 19.1%) and $30,000 to $34,999 for women (68 | 24.0%).
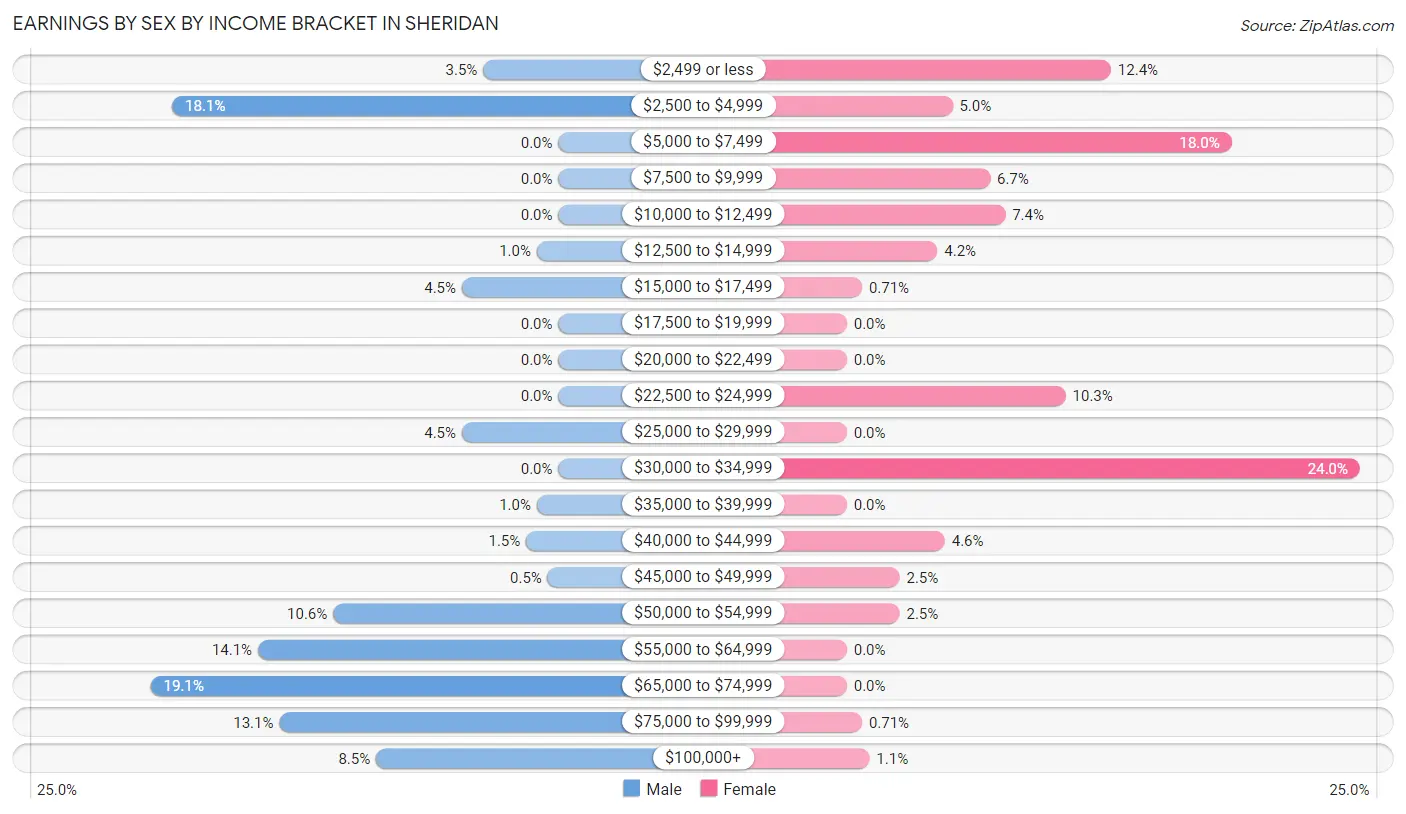
| Income | Male | Female |
| $2,499 or less | 7 (3.5%) | 35 (12.4%) |
| $2,500 to $4,999 | 36 (18.1%) | 14 (5.0%) |
| $5,000 to $7,499 | 0 (0.0%) | 51 (18.0%) |
| $7,500 to $9,999 | 0 (0.0%) | 19 (6.7%) |
| $10,000 to $12,499 | 0 (0.0%) | 21 (7.4%) |
| $12,500 to $14,999 | 2 (1.0%) | 12 (4.2%) |
| $15,000 to $17,499 | 9 (4.5%) | 2 (0.7%) |
| $17,500 to $19,999 | 0 (0.0%) | 0 (0.0%) |
| $20,000 to $22,499 | 0 (0.0%) | 0 (0.0%) |
| $22,500 to $24,999 | 0 (0.0%) | 29 (10.2%) |
| $25,000 to $29,999 | 9 (4.5%) | 0 (0.0%) |
| $30,000 to $34,999 | 0 (0.0%) | 68 (24.0%) |
| $35,000 to $39,999 | 2 (1.0%) | 0 (0.0%) |
| $40,000 to $44,999 | 3 (1.5%) | 13 (4.6%) |
| $45,000 to $49,999 | 1 (0.5%) | 7 (2.5%) |
| $50,000 to $54,999 | 21 (10.5%) | 7 (2.5%) |
| $55,000 to $64,999 | 28 (14.1%) | 0 (0.0%) |
| $65,000 to $74,999 | 38 (19.1%) | 0 (0.0%) |
| $75,000 to $99,999 | 26 (13.1%) | 2 (0.7%) |
| $100,000+ | 17 (8.5%) | 3 (1.1%) |
| Total | 199 (100.0%) | 283 (100.0%) |
Earnings by Sex by Educational Attainment in Sheridan
Average earnings in Sheridan are $57,356 for men and $24,871 for women, a difference of 56.6%. Men with an educational attainment of graduate degree enjoy the highest average annual earnings of $91,719, while those with college or associate's degree education earn the least with $54,762. Women with an educational attainment of high school diploma earn the most with the average annual earnings of $30,901, while those with high school diploma education have the smallest earnings of $30,901.
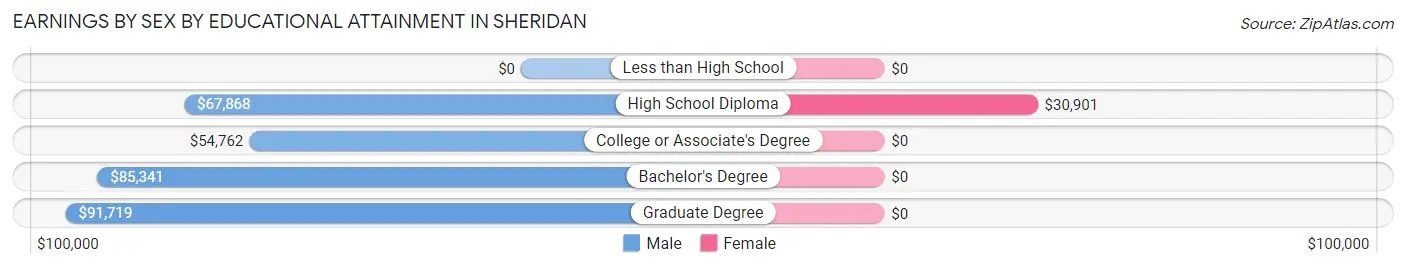
| Educational Attainment | Male Income | Female Income |
| Less than High School | - | - |
| High School Diploma | $67,868 | $30,901 |
| College or Associate's Degree | $54,762 | $0 |
| Bachelor's Degree | $85,341 | $0 |
| Graduate Degree | $91,719 | $0 |
| Total | $57,356 | $24,871 |
Family Income in Sheridan
Family Income Brackets in Sheridan
According to the Sheridan family income data, there are 82 families falling into the $75,000 to $99,999 income range, which is the most common income bracket and makes up 45.8% of all families.
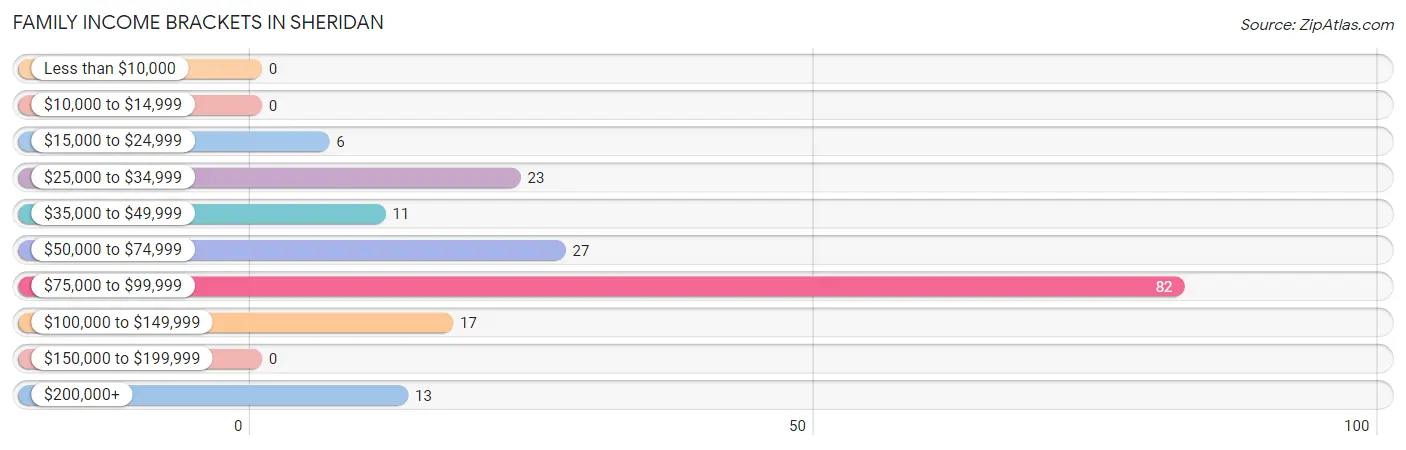
| Income Bracket | # Families | % Families |
| Less than $10,000 | 0 | 0.0% |
| $10,000 to $14,999 | 0 | 0.0% |
| $15,000 to $24,999 | 6 | 3.4% |
| $25,000 to $34,999 | 23 | 12.8% |
| $35,000 to $49,999 | 11 | 6.1% |
| $50,000 to $74,999 | 27 | 15.1% |
| $75,000 to $99,999 | 82 | 45.8% |
| $100,000 to $149,999 | 17 | 9.5% |
| $150,000 to $199,999 | 0 | 0.0% |
| $200,000+ | 13 | 7.3% |
Family Income by Famaliy Size in Sheridan
4-person families (11 | 6.1%) account for the highest median family income in Sheridan with $116,875 per family, while 2-person families (132 | 73.7%) have the highest median income of $40,686 per family member.
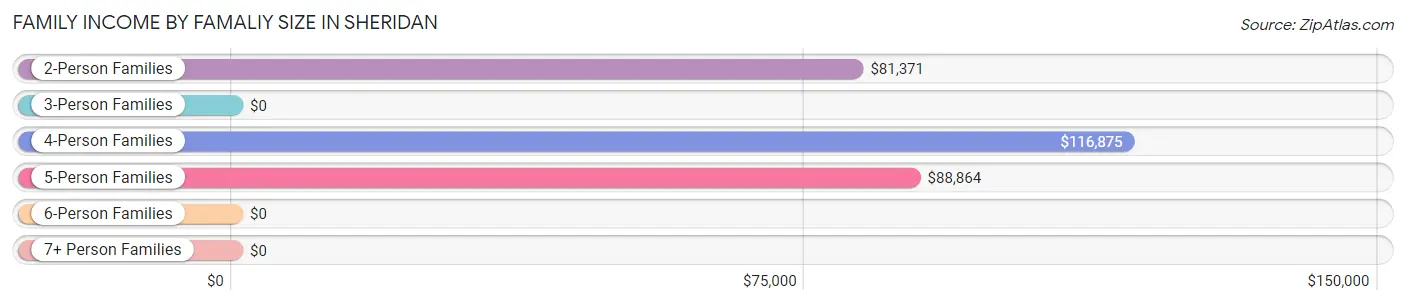
| Income Bracket | # Families | Median Income |
| 2-Person Families | 132 (73.7%) | $81,371 |
| 3-Person Families | 17 (9.5%) | $0 |
| 4-Person Families | 11 (6.1%) | $116,875 |
| 5-Person Families | 14 (7.8%) | $88,864 |
| 6-Person Families | 0 (0.0%) | $0 |
| 7+ Person Families | 5 (2.8%) | $0 |
| Total | 179 (100.0%) | $81,573 |
Family Income by Number of Earners in Sheridan
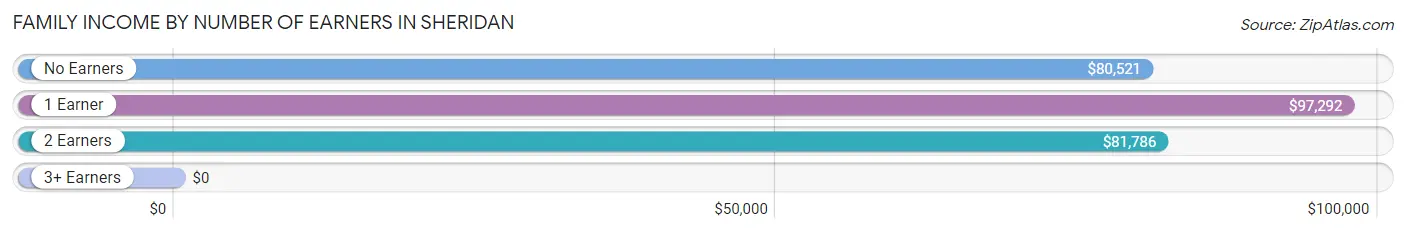
| Number of Earners | # Families | Median Income |
| No Earners | 54 (30.2%) | $80,521 |
| 1 Earner | 19 (10.6%) | $97,292 |
| 2 Earners | 98 (54.7%) | $81,786 |
| 3+ Earners | 8 (4.5%) | $0 |
| Total | 179 (100.0%) | $81,573 |
Household Income in Sheridan
Household Income Brackets in Sheridan
With 149 households falling in the category, the $75,000 to $99,999 income range is the most frequent in Sheridan, accounting for 40.4% of all households. In contrast, only 4 households (1.1%) fall into the $10,000 to $14,999 income bracket, making it the least populous group.
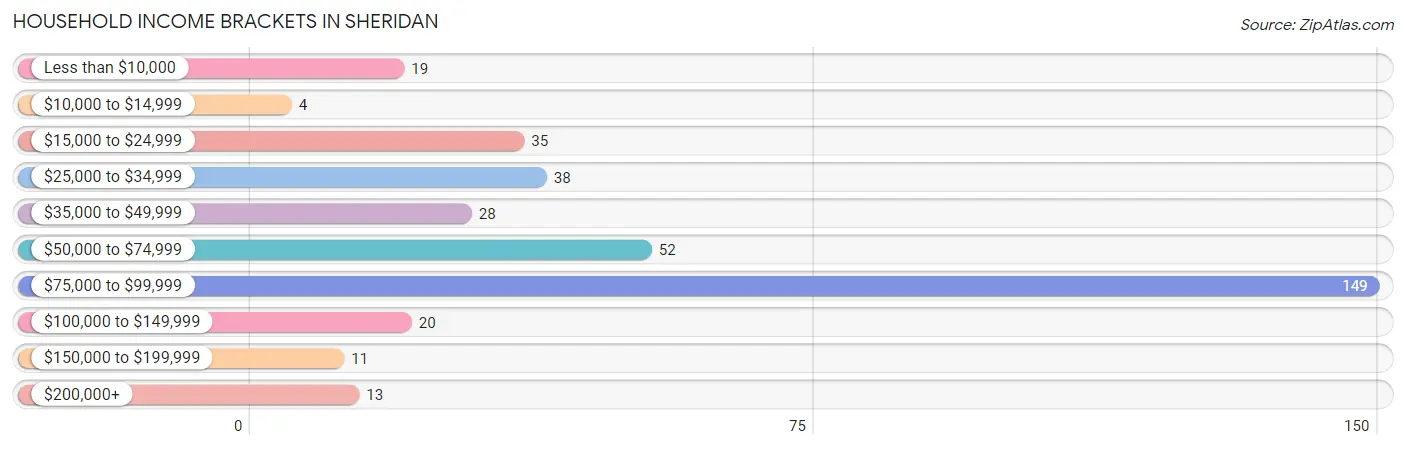
| Income Bracket | # Households | % Households |
| Less than $10,000 | 19 | 5.1% |
| $10,000 to $14,999 | 4 | 1.1% |
| $15,000 to $24,999 | 35 | 9.5% |
| $25,000 to $34,999 | 38 | 10.3% |
| $35,000 to $49,999 | 28 | 7.6% |
| $50,000 to $74,999 | 52 | 14.1% |
| $75,000 to $99,999 | 149 | 40.4% |
| $100,000 to $149,999 | 20 | 5.4% |
| $150,000 to $199,999 | 11 | 3.0% |
| $200,000+ | 13 | 3.5% |
Household Income by Householder Age in Sheridan
The median household income in Sheridan is $80,444, with the highest median household income of $89,659 found in the 25 to 44 years age bracket for the primary householder. A total of 31 households (8.4%) fall into this category. Meanwhile, the 15 to 24 years age bracket for the primary householder has the lowest median household income of $0, with 5 households (1.4%) in this group.
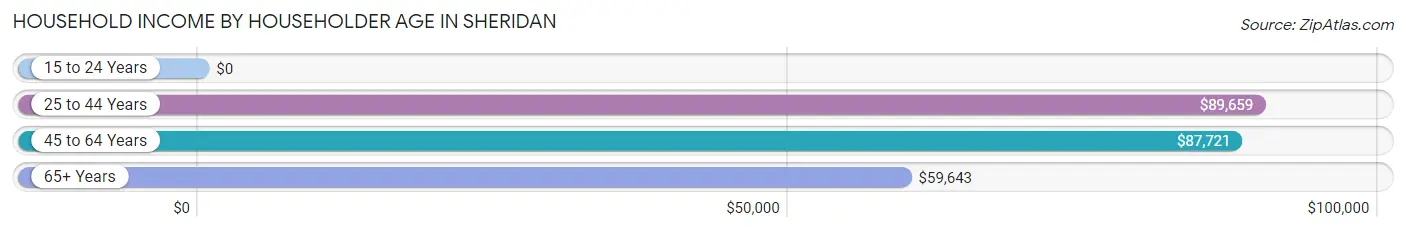
| Income Bracket | # Households | Median Income |
| 15 to 24 Years | 5 (1.4%) | $0 |
| 25 to 44 Years | 31 (8.4%) | $89,659 |
| 45 to 64 Years | 137 (37.1%) | $87,721 |
| 65+ Years | 196 (53.1%) | $59,643 |
| Total | 369 (100.0%) | $80,444 |
Poverty in Sheridan
Income Below Poverty by Sex and Age in Sheridan
With 4.0% poverty level for males and 6.8% for females among the residents of Sheridan, 75 year old and over males and 18 to 24 year old females are the most vulnerable to poverty, with 4 males (12.5%) and 19 females (25.7%) in their respective age groups living below the poverty level.
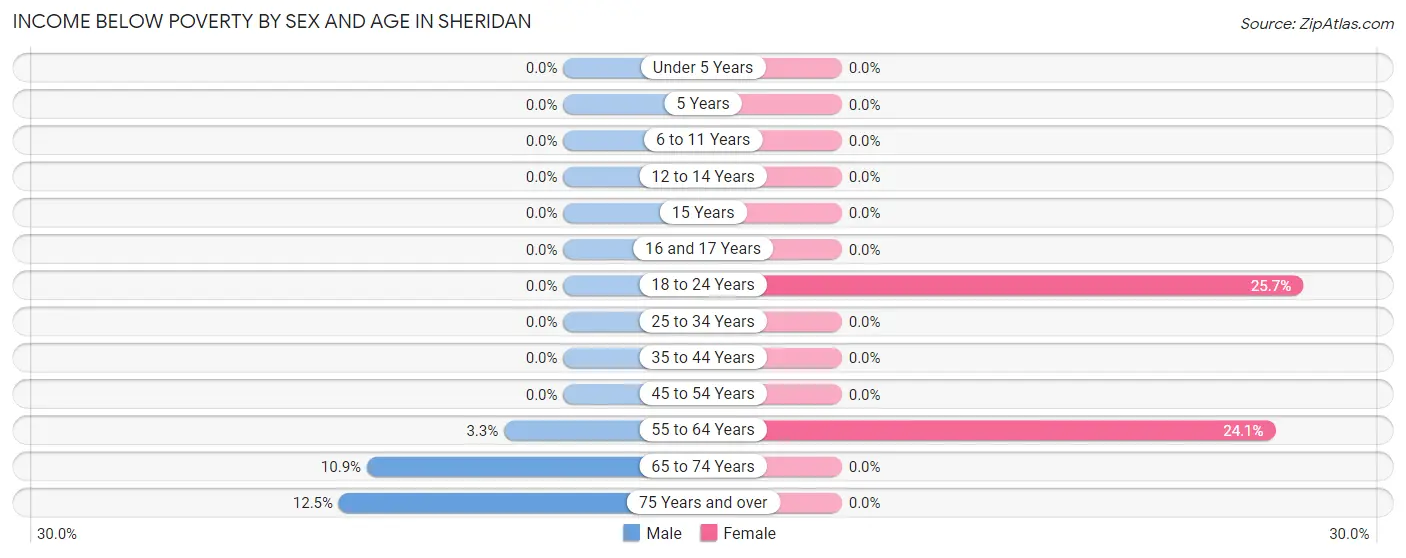
| Age Bracket | Male | Female |
| Under 5 Years | 0 (0.0%) | 0 (0.0%) |
| 5 Years | 0 (0.0%) | 0 (0.0%) |
| 6 to 11 Years | 0 (0.0%) | 0 (0.0%) |
| 12 to 14 Years | 0 (0.0%) | 0 (0.0%) |
| 15 Years | 0 (0.0%) | 0 (0.0%) |
| 16 and 17 Years | 0 (0.0%) | 0 (0.0%) |
| 18 to 24 Years | 0 (0.0%) | 19 (25.7%) |
| 25 to 34 Years | 0 (0.0%) | 0 (0.0%) |
| 35 to 44 Years | 0 (0.0%) | 0 (0.0%) |
| 45 to 54 Years | 0 (0.0%) | 0 (0.0%) |
| 55 to 64 Years | 3 (3.3%) | 14 (24.1%) |
| 65 to 74 Years | 7 (10.9%) | 0 (0.0%) |
| 75 Years and over | 4 (12.5%) | 0 (0.0%) |
| Total | 14 (4.0%) | 33 (6.8%) |
Income Above Poverty by Sex and Age in Sheridan
According to the poverty statistics in Sheridan, males aged under 5 years and females aged under 5 years are the age groups that are most secure financially, with 100.0% of males and 100.0% of females in these age groups living above the poverty line.
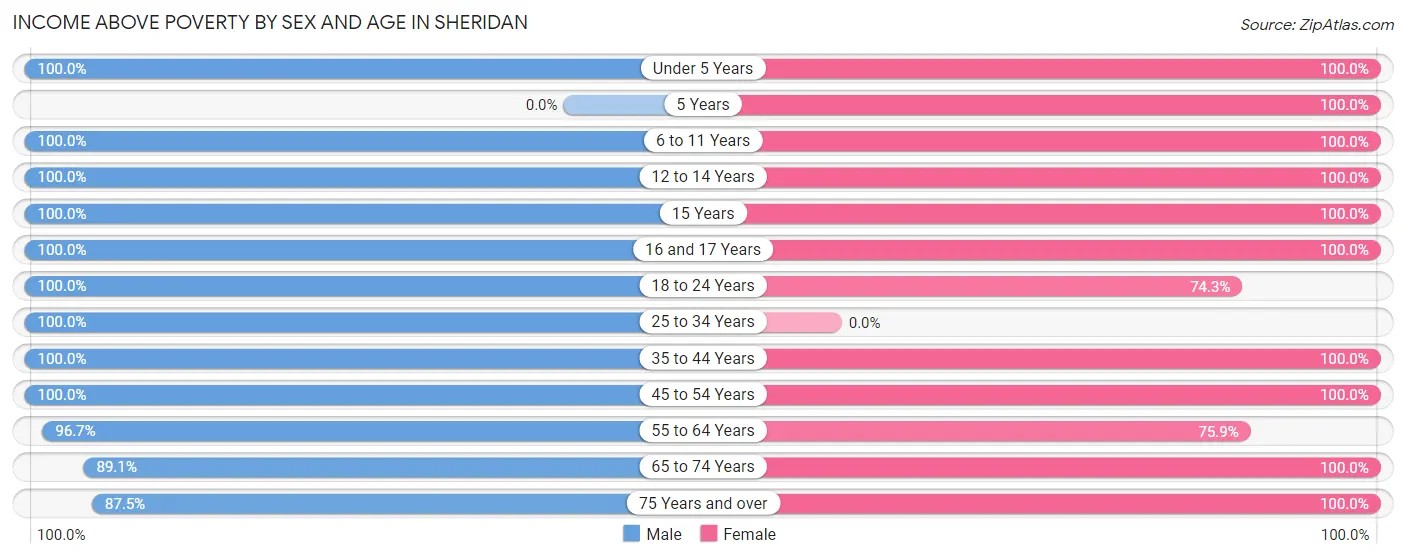
| Age Bracket | Male | Female |
| Under 5 Years | 30 (100.0%) | 5 (100.0%) |
| 5 Years | 0 (0.0%) | 15 (100.0%) |
| 6 to 11 Years | 6 (100.0%) | 4 (100.0%) |
| 12 to 14 Years | 13 (100.0%) | 11 (100.0%) |
| 15 Years | 2 (100.0%) | 5 (100.0%) |
| 16 and 17 Years | 6 (100.0%) | 8 (100.0%) |
| 18 to 24 Years | 26 (100.0%) | 55 (74.3%) |
| 25 to 34 Years | 11 (100.0%) | 0 (0.0%) |
| 35 to 44 Years | 44 (100.0%) | 22 (100.0%) |
| 45 to 54 Years | 27 (100.0%) | 122 (100.0%) |
| 55 to 64 Years | 88 (96.7%) | 44 (75.9%) |
| 65 to 74 Years | 57 (89.1%) | 65 (100.0%) |
| 75 Years and over | 28 (87.5%) | 94 (100.0%) |
| Total | 338 (96.0%) | 450 (93.2%) |
Income Below Poverty Among Married-Couple Families in Sheridan
The poverty statistics for married-couple families in Sheridan show that 1.8% or 3 of the total 170 families live below the poverty line. Families with no children have the highest poverty rate of 2.1%, comprising of 3 families. On the other hand, families with 1 or 2 children have the lowest poverty rate of 0.0%, which includes 0 families.
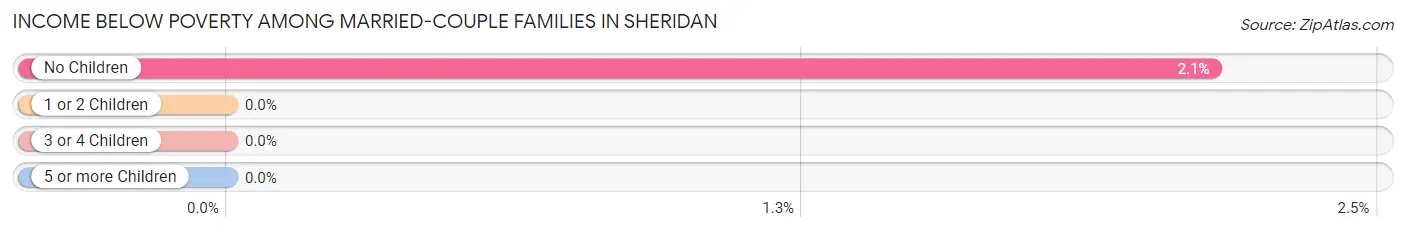
| Children | Above Poverty | Below Poverty |
| No Children | 137 (97.9%) | 3 (2.1%) |
| 1 or 2 Children | 11 (100.0%) | 0 (0.0%) |
| 3 or 4 Children | 14 (100.0%) | 0 (0.0%) |
| 5 or more Children | 5 (100.0%) | 0 (0.0%) |
| Total | 167 (98.2%) | 3 (1.8%) |
Income Below Poverty Among Single-Parent Households in Sheridan
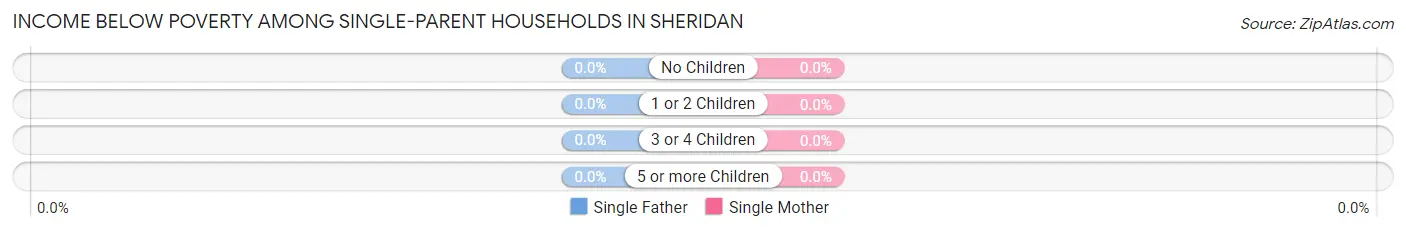
| Children | Single Father | Single Mother |
| No Children | 0 (0.0%) | 0 (0.0%) |
| 1 or 2 Children | 0 (0.0%) | 0 (0.0%) |
| 3 or 4 Children | 0 (0.0%) | 0 (0.0%) |
| 5 or more Children | 0 (0.0%) | 0 (0.0%) |
| Total | 0 (0.0%) | 0 (0.0%) |
Income Below Poverty Among Married-Couple vs Single-Parent Households in Sheridan
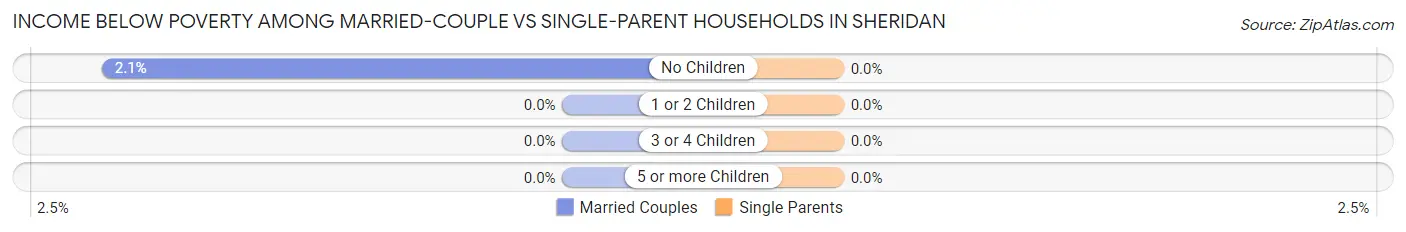
| Children | Married-Couple Families | Single-Parent Households |
| No Children | 3 (2.1%) | 0 (0.0%) |
| 1 or 2 Children | 0 (0.0%) | 0 (0.0%) |
| 3 or 4 Children | 0 (0.0%) | 0 (0.0%) |
| 5 or more Children | 0 (0.0%) | 0 (0.0%) |
| Total | 3 (1.8%) | 0 (0.0%) |
Race in Sheridan
The most populous races in Sheridan are White / Caucasian (833 | 96.1%), Two or more Races (31 | 3.6%), and Hispanic or Latino (24 | 2.8%).
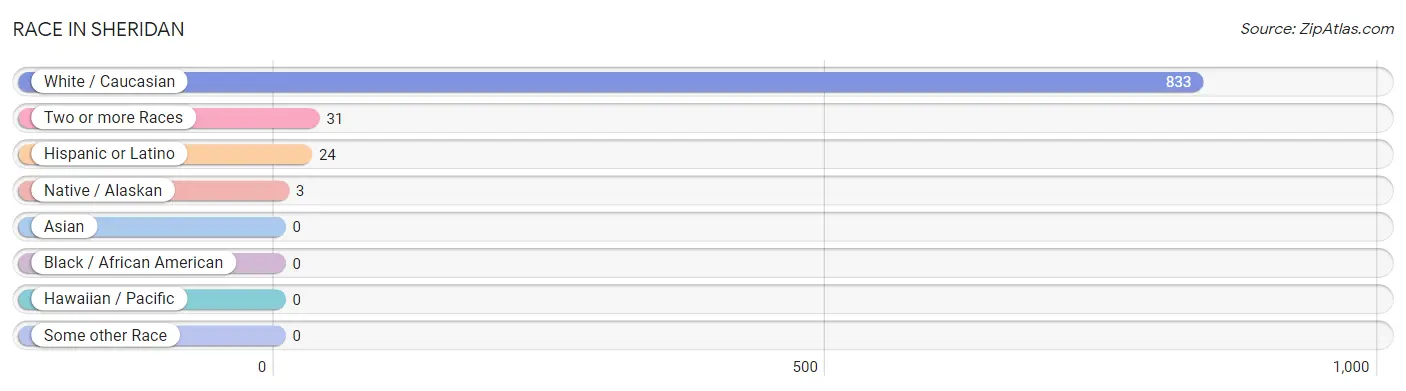
| Race | # Population | % Population |
| Asian | 0 | 0.0% |
| Black / African American | 0 | 0.0% |
| Hawaiian / Pacific | 0 | 0.0% |
| Hispanic or Latino | 24 | 2.8% |
| Native / Alaskan | 3 | 0.4% |
| White / Caucasian | 833 | 96.1% |
| Two or more Races | 31 | 3.6% |
| Some other Race | 0 | 0.0% |
| Total | 867 | 100.0% |
Ancestry in Sheridan
The most populous ancestries reported in Sheridan are German (242 | 27.9%), Irish (203 | 23.4%), English (191 | 22.0%), Norwegian (173 | 20.0%), and French (51 | 5.9%), together accounting for 99.2% of all Sheridan residents.
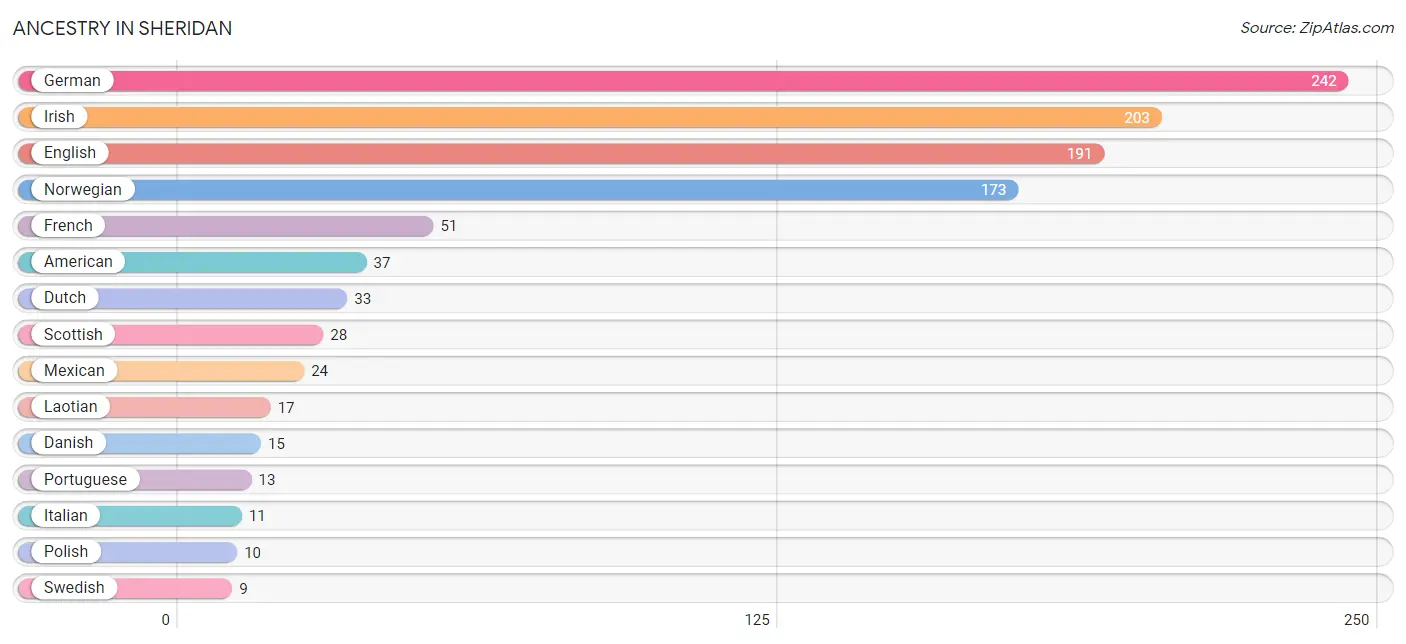
| Ancestry | # Population | % Population |
| American | 37 | 4.3% |
| Chippewa | 6 | 0.7% |
| Danish | 15 | 1.7% |
| Dutch | 33 | 3.8% |
| Eastern European | 7 | 0.8% |
| English | 191 | 22.0% |
| European | 8 | 0.9% |
| French | 51 | 5.9% |
| French Canadian | 5 | 0.6% |
| German | 242 | 27.9% |
| Irish | 203 | 23.4% |
| Italian | 11 | 1.3% |
| Laotian | 17 | 2.0% |
| Mexican | 24 | 2.8% |
| Norwegian | 173 | 20.0% |
| Polish | 10 | 1.1% |
| Portuguese | 13 | 1.5% |
| Scandinavian | 8 | 0.9% |
| Scotch-Irish | 6 | 0.7% |
| Scottish | 28 | 3.2% |
| Swedish | 9 | 1.0% |
| Welsh | 1 | 0.1% | View All 22 Rows |
Immigrants in Sheridan
The most numerous immigrant groups reported in Sheridan came from Europe (17 | 2.0%), Netherlands (17 | 2.0%), and Western Europe (17 | 2.0%), together accounting for 5.9% of all Sheridan residents.
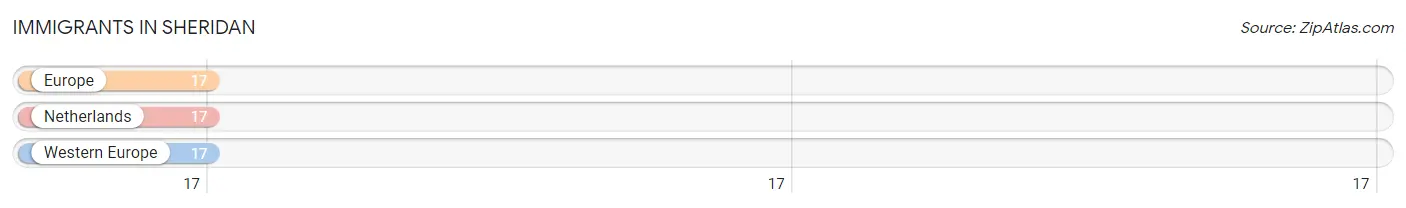
| Immigration Origin | # Population | % Population |
| Europe | 17 | 2.0% |
| Netherlands | 17 | 2.0% |
| Western Europe | 17 | 2.0% | View All 3 Rows |
Sex and Age in Sheridan
Sex and Age in Sheridan
The most populous age groups in Sheridan are 60 to 64 Years (62 | 17.6%) for men and 45 to 49 Years (93 | 18.1%) for women.
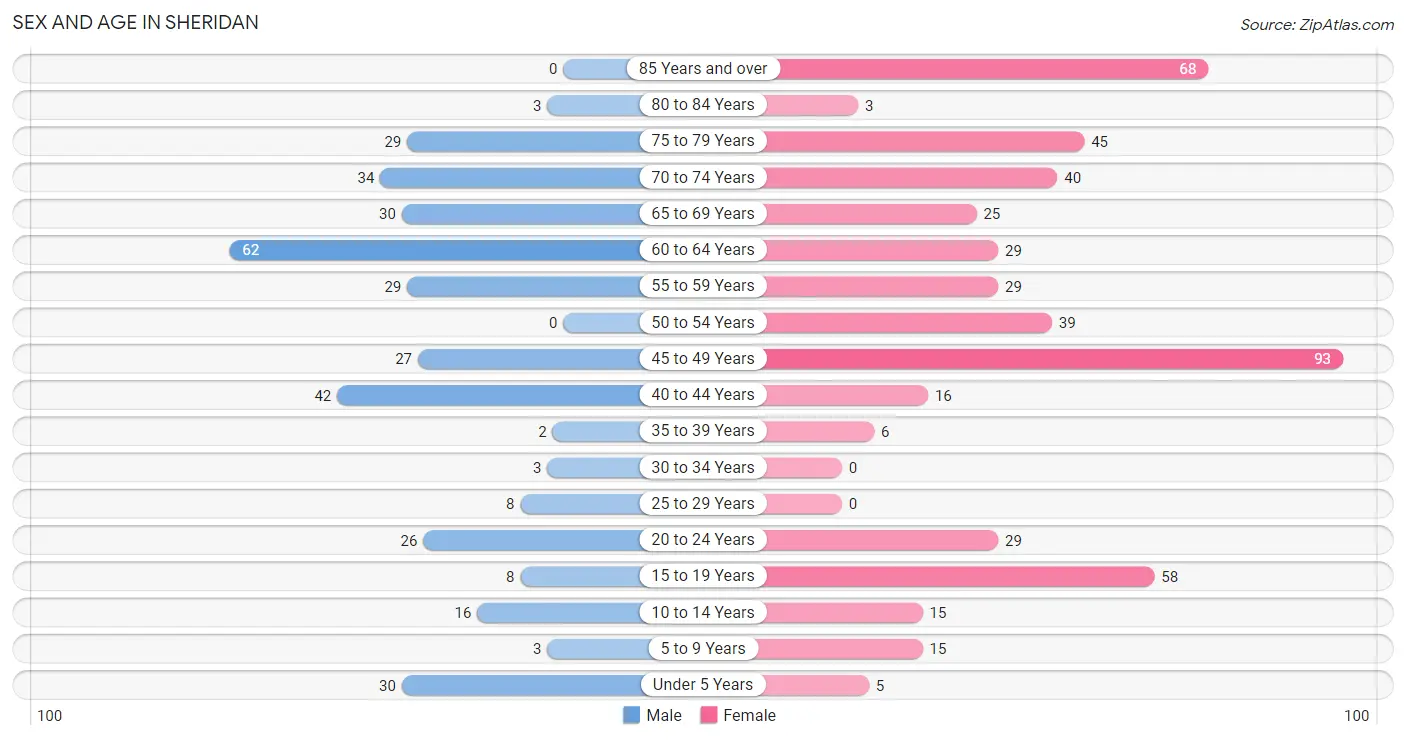
| Age Bracket | Male | Female |
| Under 5 Years | 30 (8.5%) | 5 (1.0%) |
| 5 to 9 Years | 3 (0.9%) | 15 (2.9%) |
| 10 to 14 Years | 16 (4.5%) | 15 (2.9%) |
| 15 to 19 Years | 8 (2.3%) | 58 (11.3%) |
| 20 to 24 Years | 26 (7.4%) | 29 (5.6%) |
| 25 to 29 Years | 8 (2.3%) | 0 (0.0%) |
| 30 to 34 Years | 3 (0.9%) | 0 (0.0%) |
| 35 to 39 Years | 2 (0.6%) | 6 (1.2%) |
| 40 to 44 Years | 42 (11.9%) | 16 (3.1%) |
| 45 to 49 Years | 27 (7.7%) | 93 (18.1%) |
| 50 to 54 Years | 0 (0.0%) | 39 (7.6%) |
| 55 to 59 Years | 29 (8.2%) | 29 (5.6%) |
| 60 to 64 Years | 62 (17.6%) | 29 (5.6%) |
| 65 to 69 Years | 30 (8.5%) | 25 (4.9%) |
| 70 to 74 Years | 34 (9.7%) | 40 (7.8%) |
| 75 to 79 Years | 29 (8.2%) | 45 (8.7%) |
| 80 to 84 Years | 3 (0.9%) | 3 (0.6%) |
| 85 Years and over | 0 (0.0%) | 68 (13.2%) |
| Total | 352 (100.0%) | 515 (100.0%) |
Families and Households in Sheridan
Median Family Size in Sheridan
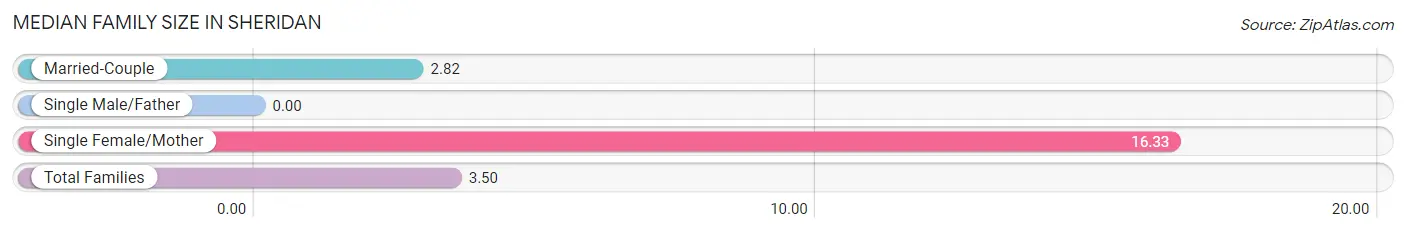
| Family Type | # Families | Family Size |
| Married-Couple | 170 (95.0%) | 2.82 |
| Single Male/Father | 0 (0.0%) | - |
| Single Female/Mother | 9 (5.0%) | 16.33 |
| Total Families | 179 (100.0%) | 3.50 |
Median Household Size in Sheridan
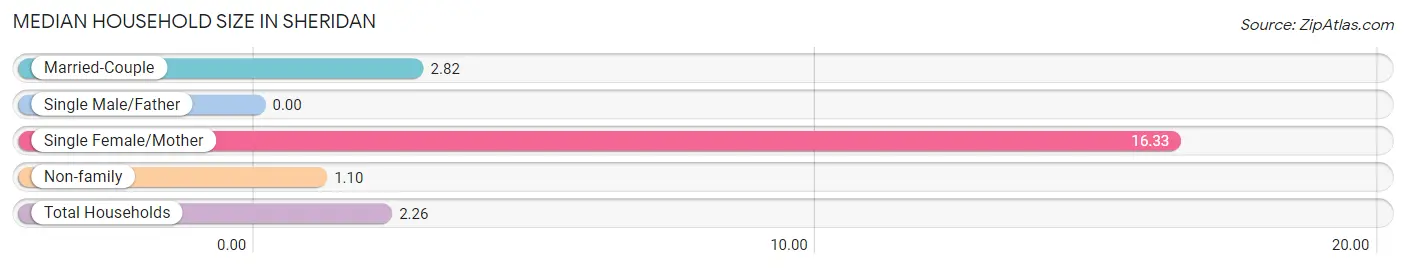
| Household Type | # Households | Household Size |
| Married-Couple | 170 (46.1%) | 2.82 |
| Single Male/Father | 0 (0.0%) | - |
| Single Female/Mother | 9 (2.4%) | 16.33 |
| Non-family | 190 (51.5%) | 1.10 |
| Total Households | 369 (100.0%) | 2.26 |
Household Size by Marriage Status in Sheridan
Out of a total of 369 households in Sheridan, 179 (48.5%) are family households, while 190 (51.5%) are nonfamily households. The most numerous type of family households are 2-person households, comprising 132, and the most common type of nonfamily households are 1-person households, comprising 185.
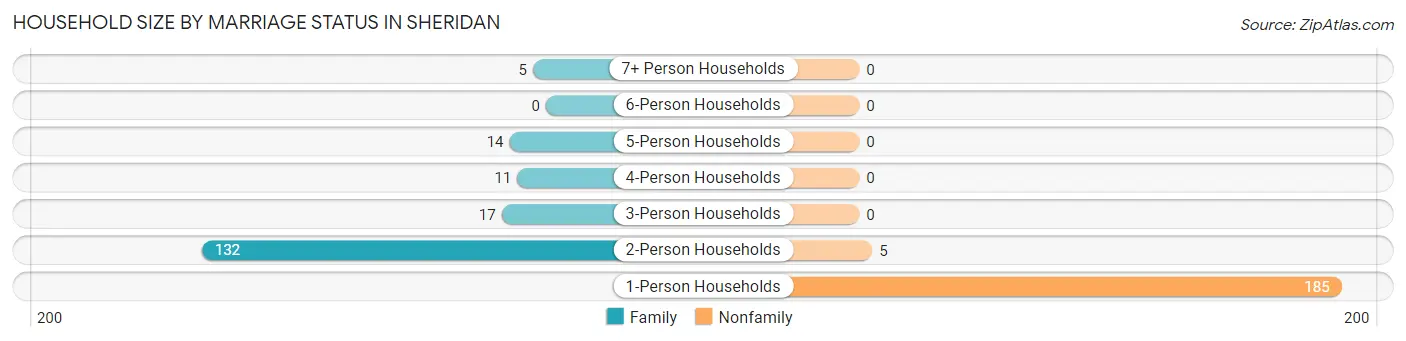
| Household Size | Family Households | Nonfamily Households |
| 1-Person Households | - | 185 (50.1%) |
| 2-Person Households | 132 (35.8%) | 5 (1.4%) |
| 3-Person Households | 17 (4.6%) | 0 (0.0%) |
| 4-Person Households | 11 (3.0%) | 0 (0.0%) |
| 5-Person Households | 14 (3.8%) | 0 (0.0%) |
| 6-Person Households | 0 (0.0%) | 0 (0.0%) |
| 7+ Person Households | 5 (1.4%) | 0 (0.0%) |
| Total | 179 (48.5%) | 190 (51.5%) |
Female Fertility in Sheridan
Fertility by Age in Sheridan
Average fertility rate in Sheridan is 330.0 births per 1,000 women. Women in the age bracket of 35 to 50 years have the highest fertility rate with 578.0 births per 1,000 women. Women in the age bracket of 35 to 50 years acount for 100.0% of all women with births.
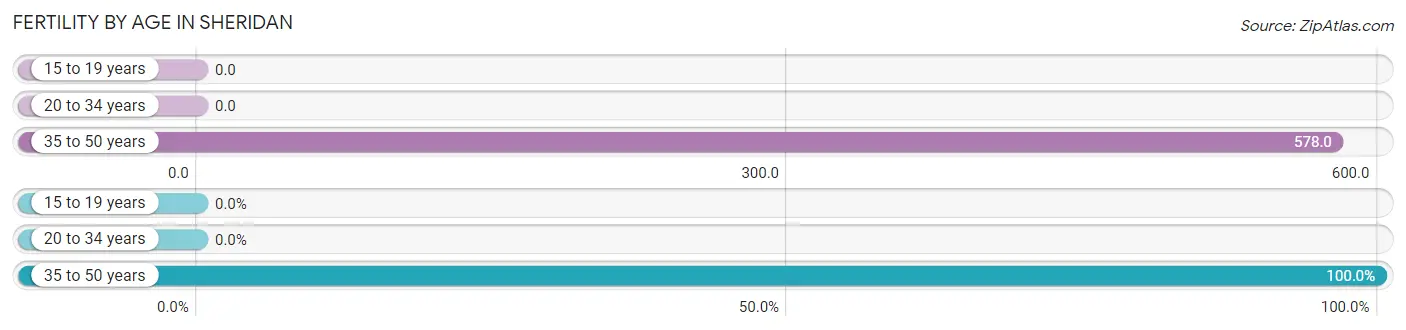
| Age Bracket | Women with Births | Births / 1,000 Women |
| 15 to 19 years | 0 (0.0%) | 0.0 |
| 20 to 34 years | 0 (0.0%) | 0.0 |
| 35 to 50 years | 67 (100.0%) | 578.0 |
| Total | 67 (100.0%) | 330.0 |
Fertility by Age by Marriage Status in Sheridan
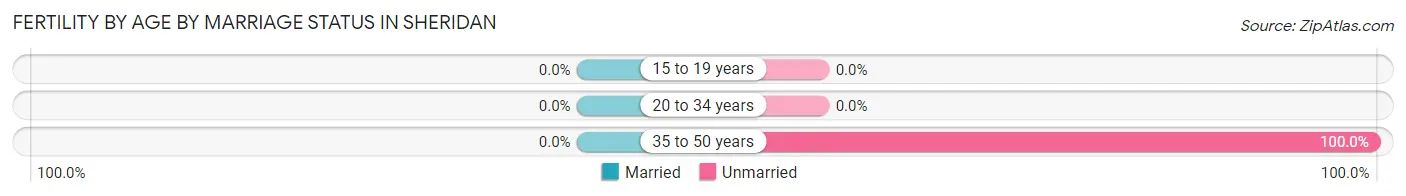
| Age Bracket | Married | Unmarried |
| 15 to 19 years | 0 (0.0%) | 0 (0.0%) |
| 20 to 34 years | 0 (0.0%) | 0 (0.0%) |
| 35 to 50 years | 0 (0.0%) | 67 (100.0%) |
| Total | 0 (0.0%) | 67 (100.0%) |
Fertility by Education in Sheridan
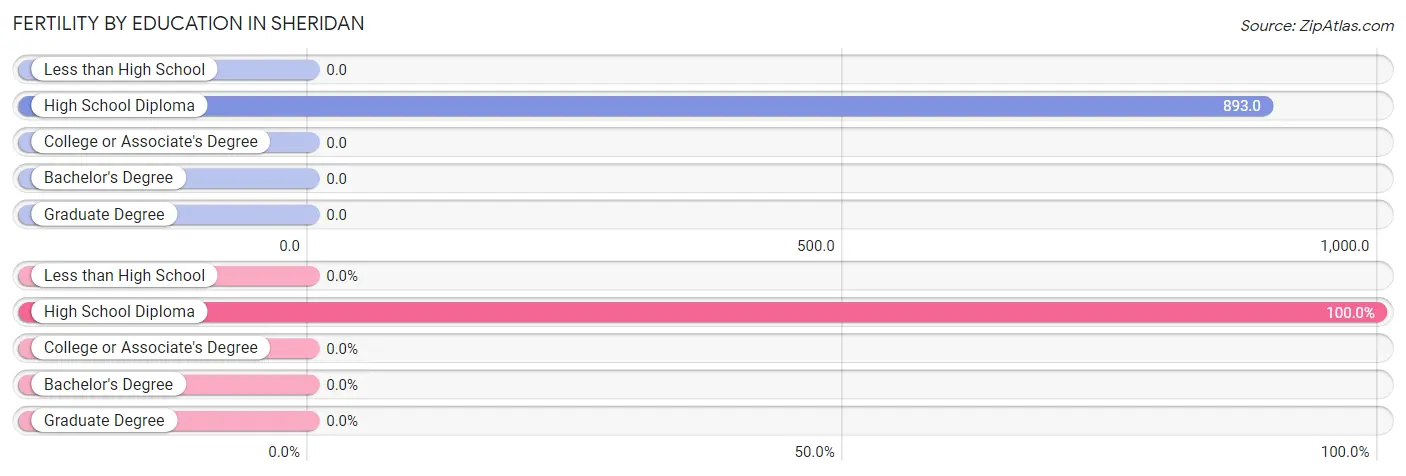
| Educational Attainment | Women with Births | Births / 1,000 Women |
| Less than High School | 0 (0.0%) | 0.0 |
| High School Diploma | 67 (100.0%) | 893.0 |
| College or Associate's Degree | 0 (0.0%) | 0.0 |
| Bachelor's Degree | 0 (0.0%) | 0.0 |
| Graduate Degree | 0 (0.0%) | 0.0 |
| Total | 67 (100.0%) | 330.0 |
Fertility by Education by Marriage Status in Sheridan
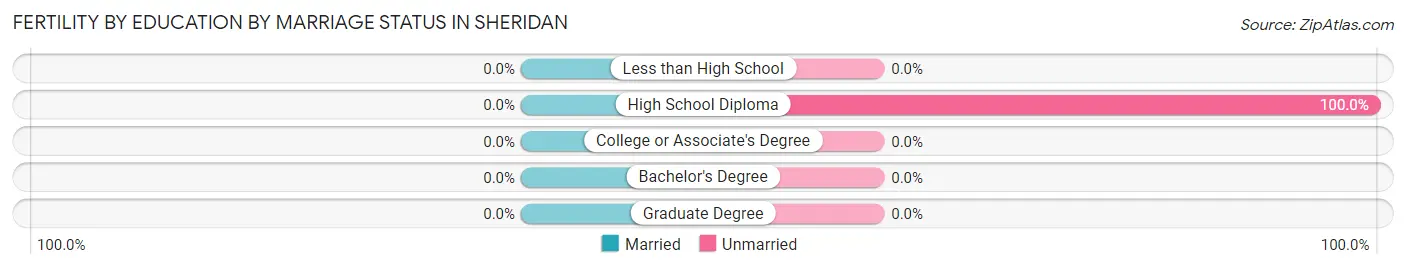
| Educational Attainment | Married | Unmarried |
| Less than High School | 0 (0.0%) | 0 (0.0%) |
| High School Diploma | 0 (0.0%) | 67 (100.0%) |
| College or Associate's Degree | 0 (0.0%) | 0 (0.0%) |
| Bachelor's Degree | 0 (0.0%) | 0 (0.0%) |
| Graduate Degree | 0 (0.0%) | 0 (0.0%) |
| Total | 0 (0.0%) | 67 (100.0%) |
Employment Characteristics in Sheridan
Employment by Class of Employer in Sheridan
Among the 436 employed individuals in Sheridan, private company employees (315 | 72.3%), local government employees (51 | 11.7%), and not-for-profit organizations (28 | 6.4%) make up the most common classes of employment.
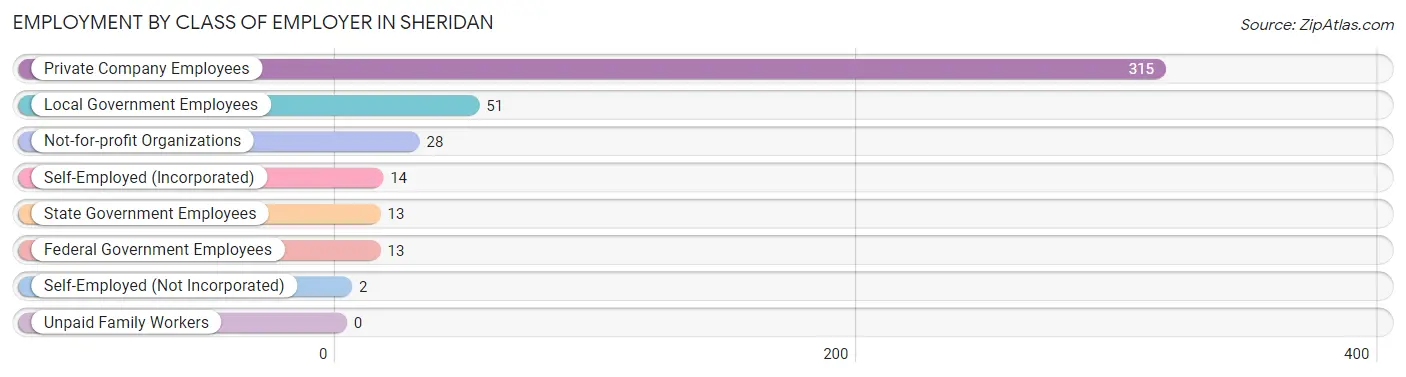
| Employer Class | # Employees | % Employees |
| Private Company Employees | 315 | 72.3% |
| Self-Employed (Incorporated) | 14 | 3.2% |
| Self-Employed (Not Incorporated) | 2 | 0.5% |
| Not-for-profit Organizations | 28 | 6.4% |
| Local Government Employees | 51 | 11.7% |
| State Government Employees | 13 | 3.0% |
| Federal Government Employees | 13 | 3.0% |
| Unpaid Family Workers | 0 | 0.0% |
| Total | 436 | 100.0% |
Employment Status by Age in Sheridan
According to the labor force statistics for Sheridan, out of the total population over 16 years of age (776), 57.6% or 447 individuals are in the labor force, with 2.5% or 11 of them unemployed. The age group with the highest labor force participation rate is 20 to 24 years, with 100.0% or 55 individuals in the labor force. Within the labor force, the 60 to 64 years age range has the highest percentage of unemployed individuals, with 18.3% or 11 of them being unemployed.
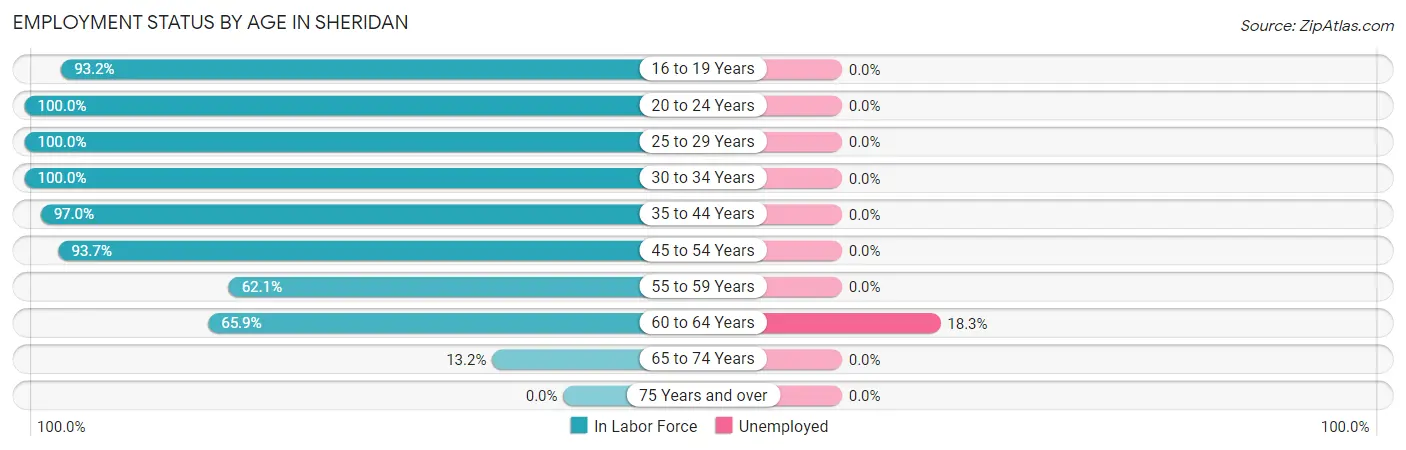
| Age Bracket | In Labor Force | Unemployed |
| 16 to 19 Years | 55 (93.2%) | 0 (0.0%) |
| 20 to 24 Years | 55 (100.0%) | 0 (0.0%) |
| 25 to 29 Years | 8 (100.0%) | 0 (0.0%) |
| 30 to 34 Years | 3 (100.0%) | 0 (0.0%) |
| 35 to 44 Years | 64 (97.0%) | 0 (0.0%) |
| 45 to 54 Years | 149 (93.7%) | 0 (0.0%) |
| 55 to 59 Years | 36 (62.1%) | 0 (0.0%) |
| 60 to 64 Years | 60 (65.9%) | 11 (18.3%) |
| 65 to 74 Years | 17 (13.2%) | 0 (0.0%) |
| 75 Years and over | 0 (0.0%) | 0 (0.0%) |
| Total | 447 (57.6%) | 11 (2.5%) |
Employment Status by Educational Attainment in Sheridan
According to labor force statistics for Sheridan, 83.1% of individuals (320) out of the total population between 25 and 64 years of age (385) are in the labor force, with 3.4% or 11 of them being unemployed. The group with the highest labor force participation rate are those with the educational attainment of high school diploma, with 96.1% or 172 individuals in the labor force. Within the labor force, individuals with college / associate degree education have the highest percentage of unemployment, with 11.8% or 11 of them being unemployed.
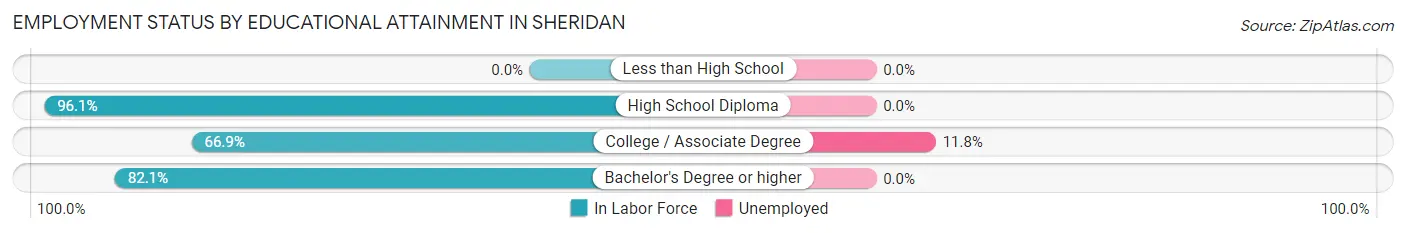
| Educational Attainment | In Labor Force | Unemployed |
| Less than High School | 0 (0.0%) | 0 (0.0%) |
| High School Diploma | 172 (96.1%) | 0 (0.0%) |
| College / Associate Degree | 93 (66.9%) | 16 (11.8%) |
| Bachelor's Degree or higher | 55 (82.1%) | 0 (0.0%) |
| Total | 320 (83.1%) | 13 (3.4%) |
Employment Occupations by Sex in Sheridan
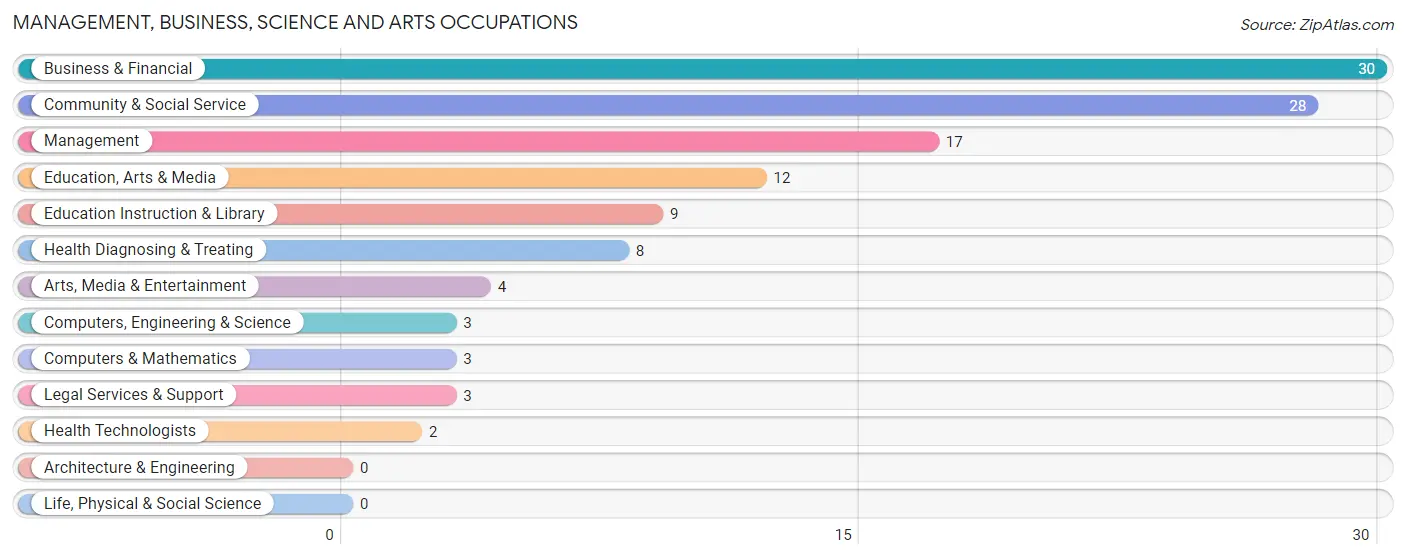
Management, Business, Science and Arts Occupations
The most common Management, Business, Science and Arts occupations in Sheridan are Business & Financial (30 | 6.9%), Community & Social Service (28 | 6.4%), Management (17 | 3.9%), Education, Arts & Media (12 | 2.8%), and Education Instruction & Library (9 | 2.1%).
Management, Business, Science and Arts Occupations by Sex
Within the Management, Business, Science and Arts occupations in Sheridan, the most male-oriented occupations are Management (100.0%), Computers, Engineering & Science (100.0%), and Computers & Mathematics (100.0%), while the most female-oriented occupations are Education Instruction & Library (100.0%), Health Diagnosing & Treating (100.0%), and Health Technologists (100.0%).
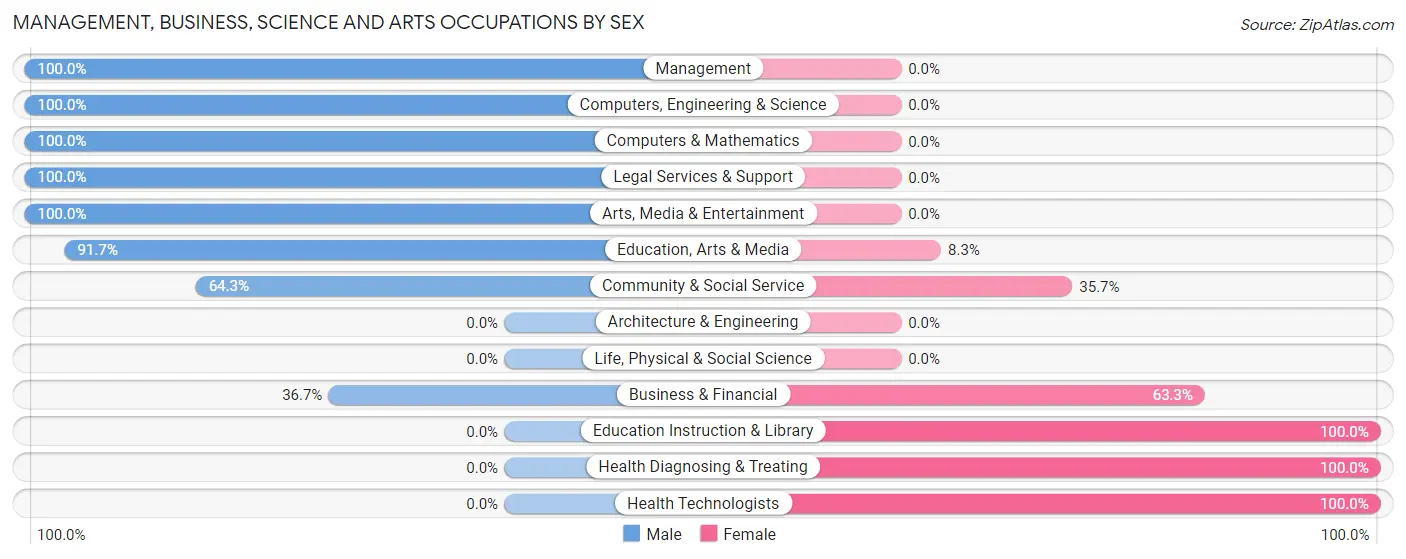
| Occupation | Male | Female |
| Management | 17 (100.0%) | 0 (0.0%) |
| Business & Financial | 11 (36.7%) | 19 (63.3%) |
| Computers, Engineering & Science | 3 (100.0%) | 0 (0.0%) |
| Computers & Mathematics | 3 (100.0%) | 0 (0.0%) |
| Architecture & Engineering | 0 (0.0%) | 0 (0.0%) |
| Life, Physical & Social Science | 0 (0.0%) | 0 (0.0%) |
| Community & Social Service | 18 (64.3%) | 10 (35.7%) |
| Education, Arts & Media | 11 (91.7%) | 1 (8.3%) |
| Legal Services & Support | 3 (100.0%) | 0 (0.0%) |
| Education Instruction & Library | 0 (0.0%) | 9 (100.0%) |
| Arts, Media & Entertainment | 4 (100.0%) | 0 (0.0%) |
| Health Diagnosing & Treating | 0 (0.0%) | 8 (100.0%) |
| Health Technologists | 0 (0.0%) | 2 (100.0%) |
| Total (Category) | 49 (57.0%) | 37 (43.0%) |
| Total (Overall) | 181 (41.5%) | 255 (58.5%) |
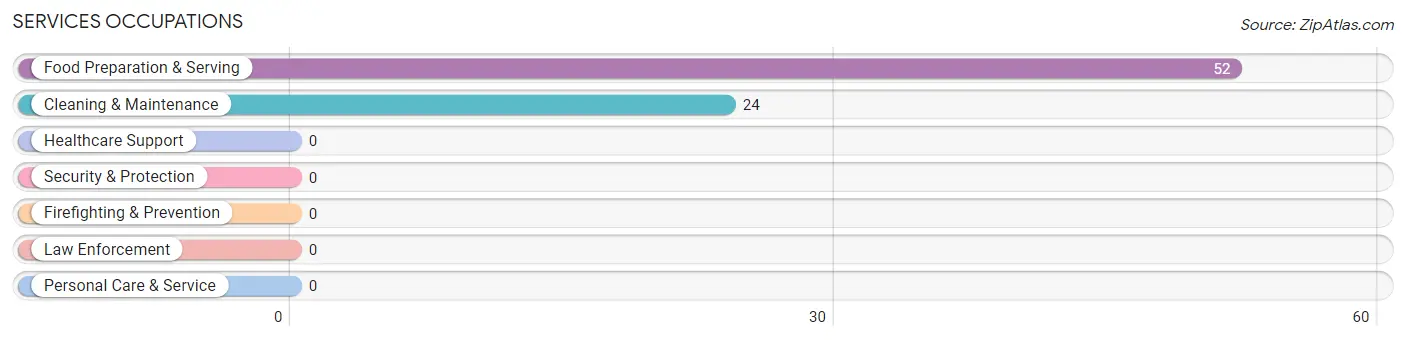
Services Occupations
The most common Services occupations in Sheridan are Food Preparation & Serving (52 | 11.9%), and Cleaning & Maintenance (24 | 5.5%).
Services Occupations by Sex
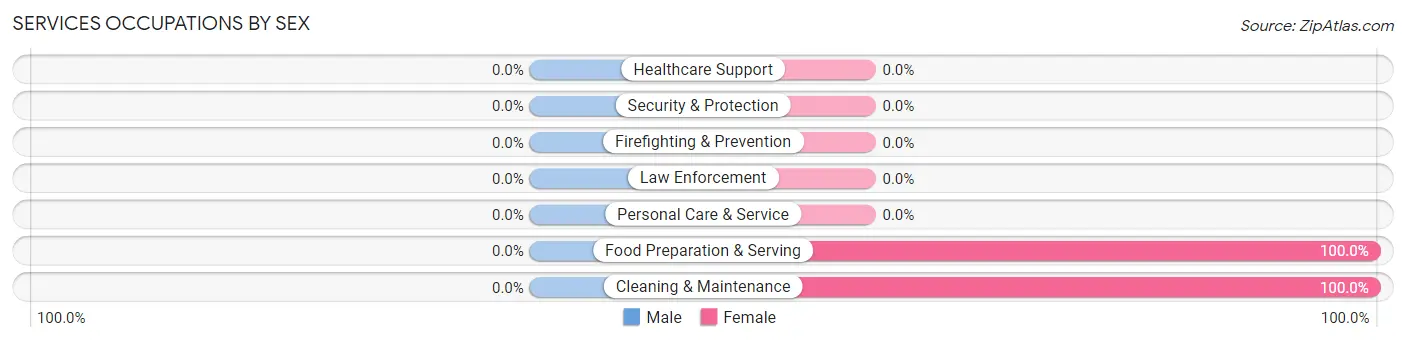
| Occupation | Male | Female |
| Healthcare Support | 0 (0.0%) | 0 (0.0%) |
| Security & Protection | 0 (0.0%) | 0 (0.0%) |
| Firefighting & Prevention | 0 (0.0%) | 0 (0.0%) |
| Law Enforcement | 0 (0.0%) | 0 (0.0%) |
| Food Preparation & Serving | 0 (0.0%) | 52 (100.0%) |
| Cleaning & Maintenance | 0 (0.0%) | 24 (100.0%) |
| Personal Care & Service | 0 (0.0%) | 0 (0.0%) |
| Total (Category) | 0 (0.0%) | 76 (100.0%) |
| Total (Overall) | 181 (41.5%) | 255 (58.5%) |
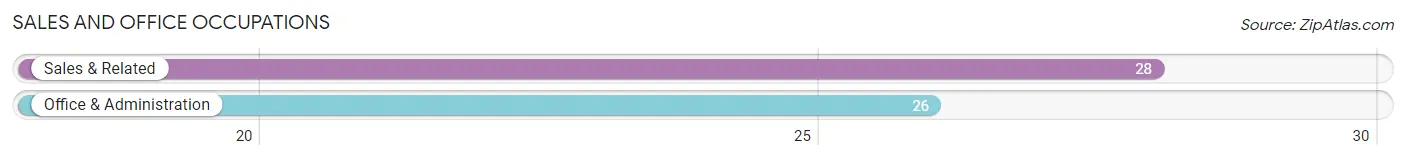
Sales and Office Occupations
The most common Sales and Office occupations in Sheridan are Sales & Related (28 | 6.4%), and Office & Administration (26 | 6.0%).
Sales and Office Occupations by Sex
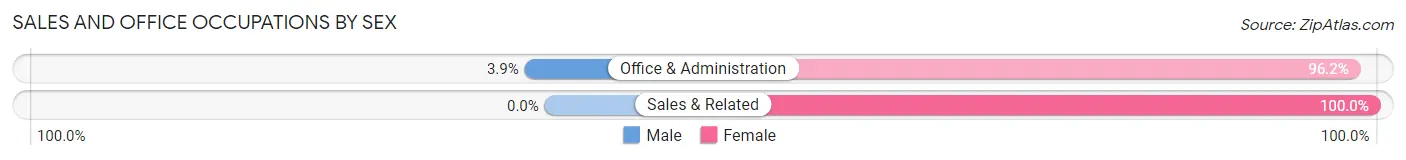
| Occupation | Male | Female |
| Sales & Related | 0 (0.0%) | 28 (100.0%) |
| Office & Administration | 1 (3.8%) | 25 (96.2%) |
| Total (Category) | 1 (1.8%) | 53 (98.2%) |
| Total (Overall) | 181 (41.5%) | 255 (58.5%) |
Natural Resources, Construction and Maintenance Occupations
The most common Natural Resources, Construction and Maintenance occupations in Sheridan are Construction & Extraction (90 | 20.6%), Farming, Fishing & Forestry (7 | 1.6%), and Installation, Maintenance & Repair (4 | 0.9%).
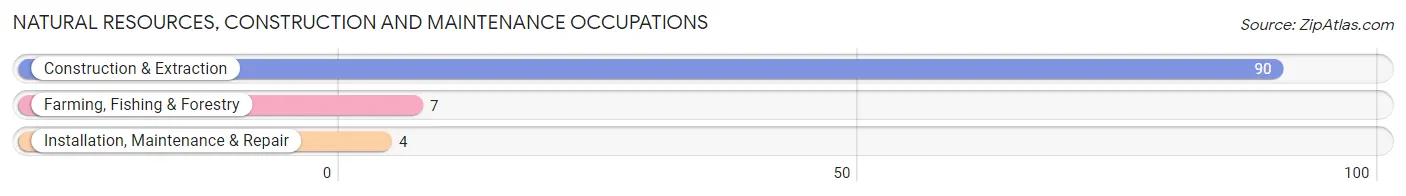
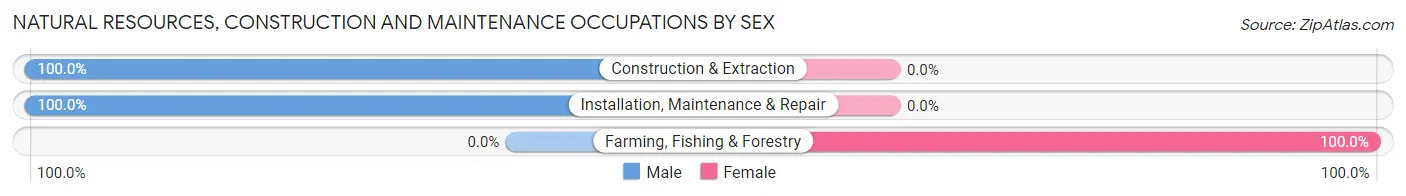
Natural Resources, Construction and Maintenance Occupations by Sex
| Occupation | Male | Female |
| Farming, Fishing & Forestry | 0 (0.0%) | 7 (100.0%) |
| Construction & Extraction | 90 (100.0%) | 0 (0.0%) |
| Installation, Maintenance & Repair | 4 (100.0%) | 0 (0.0%) |
| Total (Category) | 94 (93.1%) | 7 (6.9%) |
| Total (Overall) | 181 (41.5%) | 255 (58.5%) |
Production, Transportation and Moving Occupations
The most common Production, Transportation and Moving occupations in Sheridan are Production (93 | 21.3%), and Transportation (26 | 6.0%).
Production, Transportation and Moving Occupations by Sex
| Occupation | Male | Female |
| Production | 11 (11.8%) | 82 (88.2%) |
| Transportation | 26 (100.0%) | 0 (0.0%) |
| Material Moving | 0 (0.0%) | 0 (0.0%) |
| Total (Category) | 37 (31.1%) | 82 (68.9%) |
| Total (Overall) | 181 (41.5%) | 255 (58.5%) |
Employment Industries by Sex in Sheridan
Employment Industries in Sheridan
The major employment industries in Sheridan include Construction (97 | 22.3%), Retail Trade (75 | 17.2%), Manufacturing (72 | 16.5%), Accommodation & Food Services (51 | 11.7%), and Public Administration (51 | 11.7%).
Employment Industries by Sex in Sheridan
The Sheridan industries that see more men than women are Mining, Quarrying, & Extraction (100.0%), Information (100.0%), and Construction (88.7%), whereas the industries that tend to have a higher number of women are Transportation & Warehousing (100.0%), Professional & Scientific (100.0%), and Administrative & Support (100.0%).
| Industry | Male | Female |
| Agriculture, Fishing & Hunting | 11 (47.8%) | 12 (52.2%) |
| Mining, Quarrying, & Extraction | 3 (100.0%) | 0 (0.0%) |
| Construction | 86 (88.7%) | 11 (11.3%) |
| Manufacturing | 2 (2.8%) | 70 (97.2%) |
| Wholesale Trade | 0 (0.0%) | 0 (0.0%) |
| Retail Trade | 35 (46.7%) | 40 (53.3%) |
| Transportation & Warehousing | 0 (0.0%) | 1 (100.0%) |
| Utilities | 0 (0.0%) | 0 (0.0%) |
| Information | 2 (100.0%) | 0 (0.0%) |
| Finance & Insurance | 0 (0.0%) | 0 (0.0%) |
| Real Estate, Rental & Leasing | 0 (0.0%) | 0 (0.0%) |
| Professional & Scientific | 0 (0.0%) | 2 (100.0%) |
| Enterprise Management | 0 (0.0%) | 0 (0.0%) |
| Administrative & Support | 0 (0.0%) | 8 (100.0%) |
| Educational Services | 2 (14.3%) | 12 (85.7%) |
| Health Care & Social Assistance | 11 (32.4%) | 23 (67.6%) |
| Arts, Entertainment & Recreation | 0 (0.0%) | 0 (0.0%) |
| Accommodation & Food Services | 0 (0.0%) | 51 (100.0%) |
| Public Administration | 26 (51.0%) | 25 (49.0%) |
| Total | 181 (41.5%) | 255 (58.5%) |
Education in Sheridan
School Enrollment in Sheridan
The most common levels of schooling among the 151 students in Sheridan are high school (66 | 43.7%), college / undergraduate (40 | 26.5%), and middle school (28 | 18.5%).
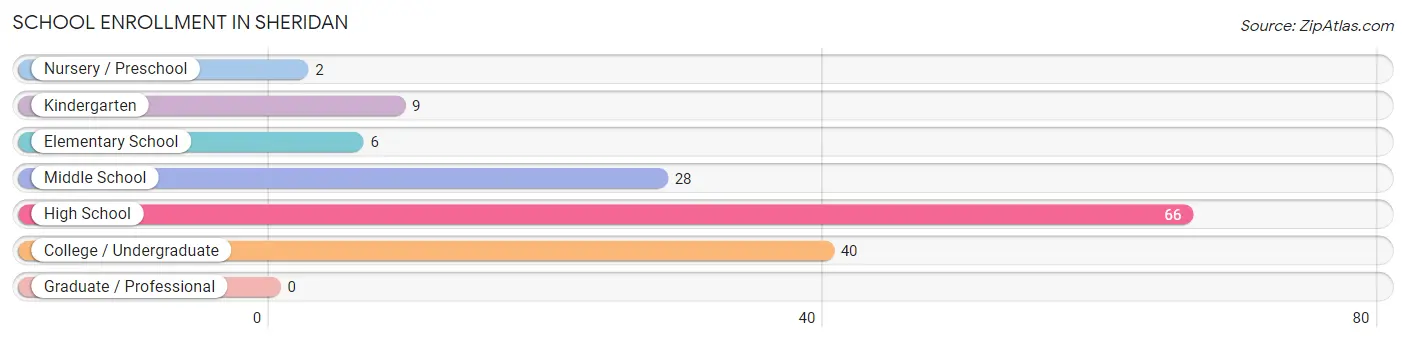
| School Level | # Students | % Students |
| Nursery / Preschool | 2 | 1.3% |
| Kindergarten | 9 | 6.0% |
| Elementary School | 6 | 4.0% |
| Middle School | 28 | 18.5% |
| High School | 66 | 43.7% |
| College / Undergraduate | 40 | 26.5% |
| Graduate / Professional | 0 | 0.0% |
| Total | 151 | 100.0% |
School Enrollment by Age by Funding Source in Sheridan
Out of a total of 151 students who are enrolled in schools in Sheridan, 6 (4.0%) attend a private institution, while the remaining 145 (96.0%) are enrolled in public schools. The age group of 5 to 9 year old has the highest likelihood of being enrolled in private schools, with 2 (14.3% in the age bracket) enrolled. Conversely, the age group of 18 to 19 year olds has the lowest likelihood of being enrolled in a private school, with 45 (100.0% in the age bracket) attending a public institution.
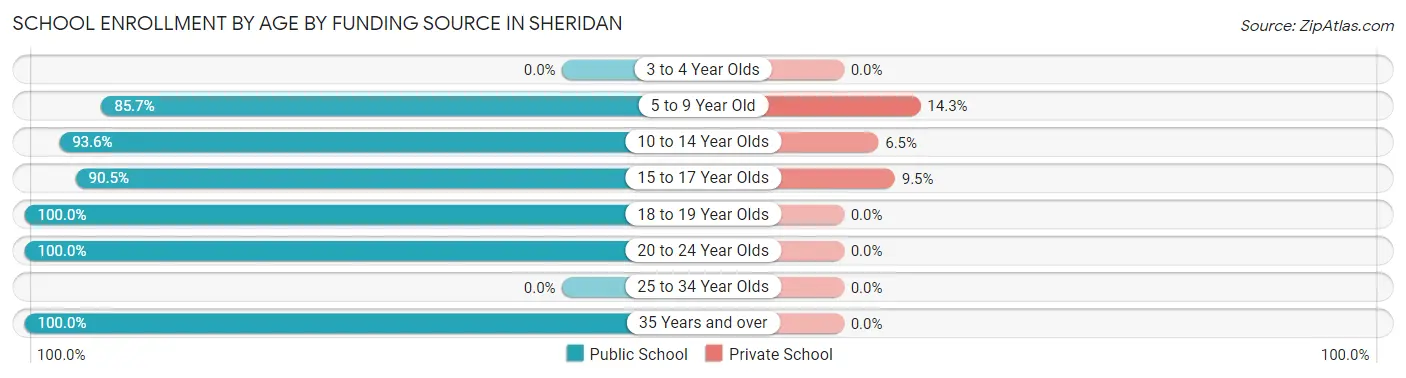
| Age Bracket | Public School | Private School |
| 3 to 4 Year Olds | 0 (0.0%) | 0 (0.0%) |
| 5 to 9 Year Old | 12 (85.7%) | 2 (14.3%) |
| 10 to 14 Year Olds | 29 (93.5%) | 2 (6.5%) |
| 15 to 17 Year Olds | 19 (90.5%) | 2 (9.5%) |
| 18 to 19 Year Olds | 45 (100.0%) | 0 (0.0%) |
| 20 to 24 Year Olds | 26 (100.0%) | 0 (0.0%) |
| 25 to 34 Year Olds | 0 (0.0%) | 0 (0.0%) |
| 35 Years and over | 14 (100.0%) | 0 (0.0%) |
| Total | 145 (96.0%) | 6 (4.0%) |
Educational Attainment by Field of Study in Sheridan
Education (68 | 37.8%), science & technology (39 | 21.7%), visual & performing arts (28 | 15.6%), liberal arts & history (14 | 7.8%), and arts & humanities (12 | 6.7%) are the most common fields of study among 180 individuals in Sheridan who have obtained a bachelor's degree or higher.
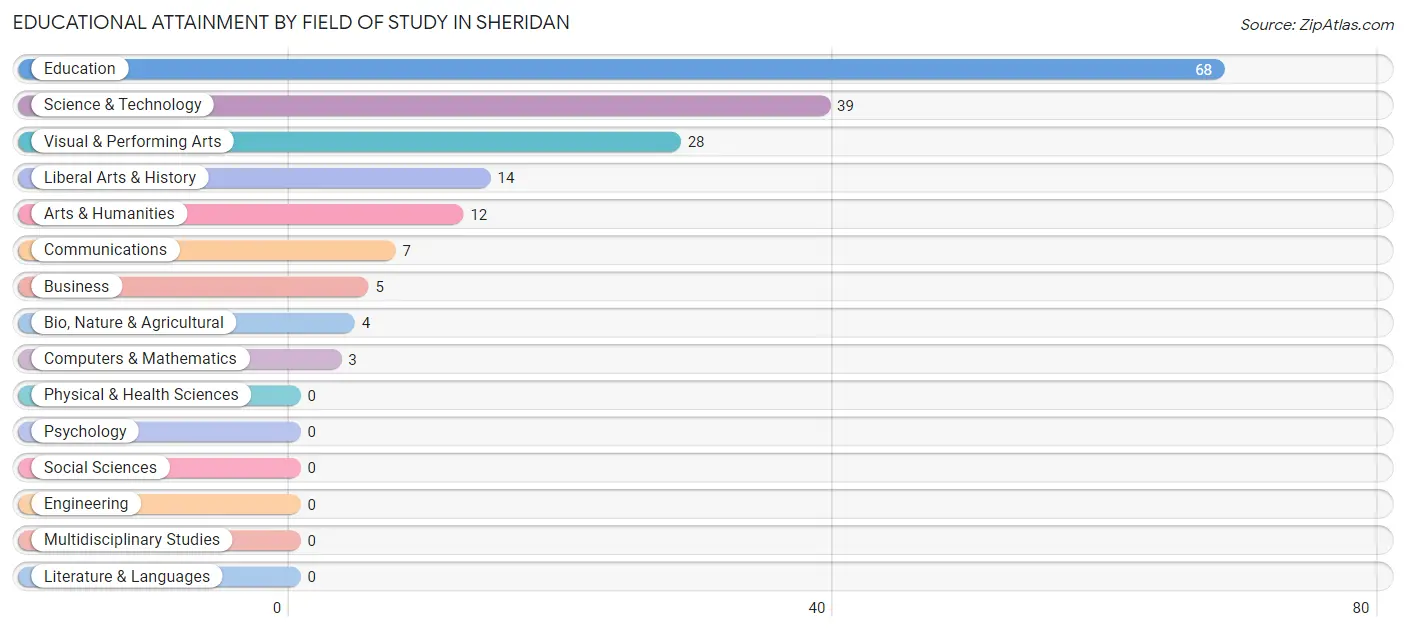
| Field of Study | # Graduates | % Graduates |
| Computers & Mathematics | 3 | 1.7% |
| Bio, Nature & Agricultural | 4 | 2.2% |
| Physical & Health Sciences | 0 | 0.0% |
| Psychology | 0 | 0.0% |
| Social Sciences | 0 | 0.0% |
| Engineering | 0 | 0.0% |
| Multidisciplinary Studies | 0 | 0.0% |
| Science & Technology | 39 | 21.7% |
| Business | 5 | 2.8% |
| Education | 68 | 37.8% |
| Literature & Languages | 0 | 0.0% |
| Liberal Arts & History | 14 | 7.8% |
| Visual & Performing Arts | 28 | 15.6% |
| Communications | 7 | 3.9% |
| Arts & Humanities | 12 | 6.7% |
| Total | 180 | 100.0% |
Transportation & Commute in Sheridan
Vehicle Availability by Sex in Sheridan
The most prevalent vehicle ownership categories in Sheridan are males with 3 vehicles (54, accounting for 29.8%) and females with 3 vehicles (167, making up 21.2%).
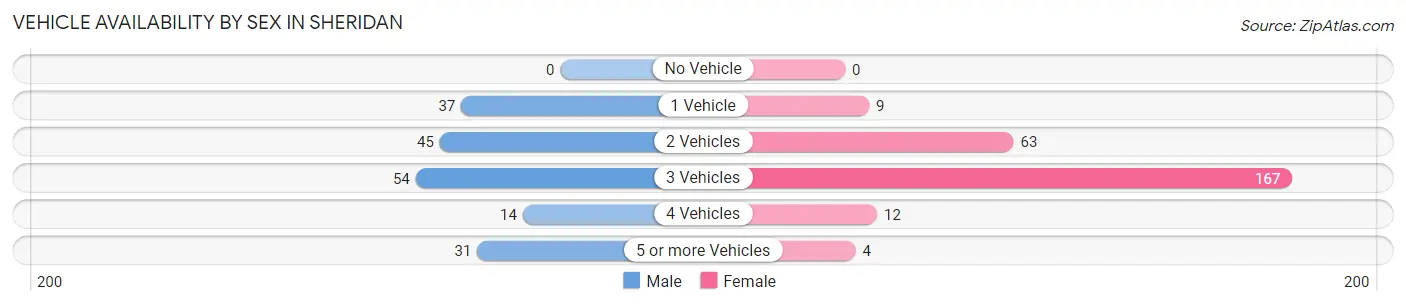
| Vehicles Available | Male | Female |
| No Vehicle | 0 (0.0%) | 0 (0.0%) |
| 1 Vehicle | 37 (20.4%) | 9 (3.5%) |
| 2 Vehicles | 45 (24.9%) | 63 (24.7%) |
| 3 Vehicles | 54 (29.8%) | 167 (65.5%) |
| 4 Vehicles | 14 (7.7%) | 12 (4.7%) |
| 5 or more Vehicles | 31 (17.1%) | 4 (1.6%) |
| Total | 181 (100.0%) | 255 (100.0%) |
Commute Time in Sheridan
The most frequently occuring commute durations in Sheridan are 10 to 14 minutes (127 commuters, 29.4%), 15 to 19 minutes (94 commuters, 21.8%), and 5 to 9 minutes (67 commuters, 15.5%).
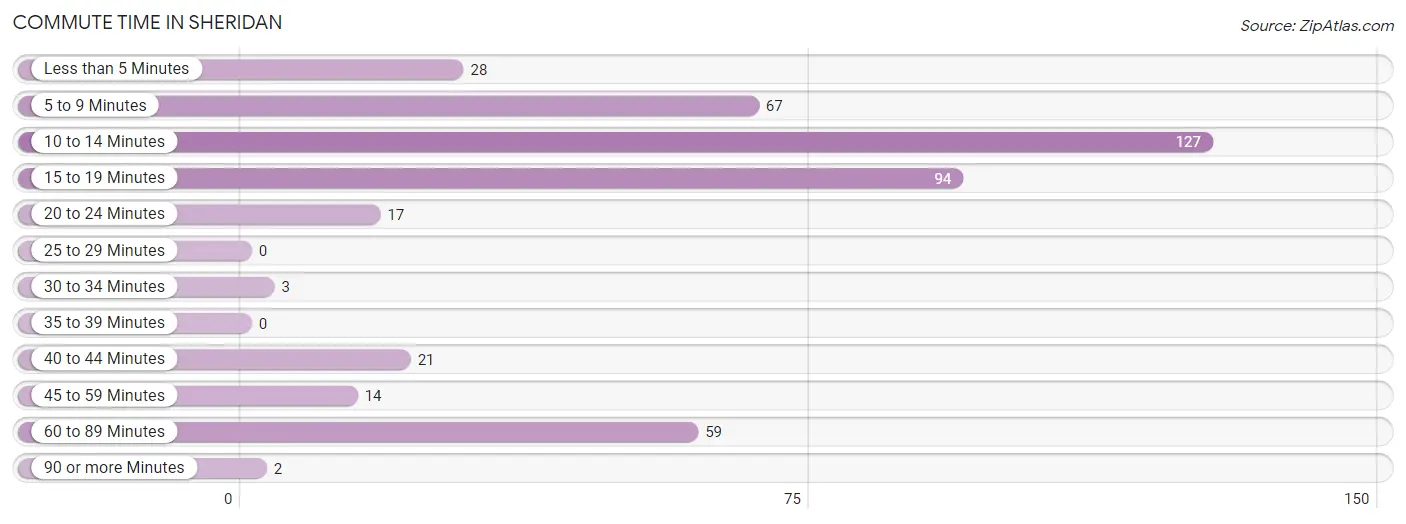
| Commute Time | # Commuters | % Commuters |
| Less than 5 Minutes | 28 | 6.5% |
| 5 to 9 Minutes | 67 | 15.5% |
| 10 to 14 Minutes | 127 | 29.4% |
| 15 to 19 Minutes | 94 | 21.8% |
| 20 to 24 Minutes | 17 | 3.9% |
| 25 to 29 Minutes | 0 | 0.0% |
| 30 to 34 Minutes | 3 | 0.7% |
| 35 to 39 Minutes | 0 | 0.0% |
| 40 to 44 Minutes | 21 | 4.9% |
| 45 to 59 Minutes | 14 | 3.2% |
| 60 to 89 Minutes | 59 | 13.7% |
| 90 or more Minutes | 2 | 0.5% |
Commute Time by Sex in Sheridan
The most common commute times in Sheridan are 60 to 89 minutes (59 commuters, 32.8%) for males and 10 to 14 minutes (92 commuters, 36.5%) for females.
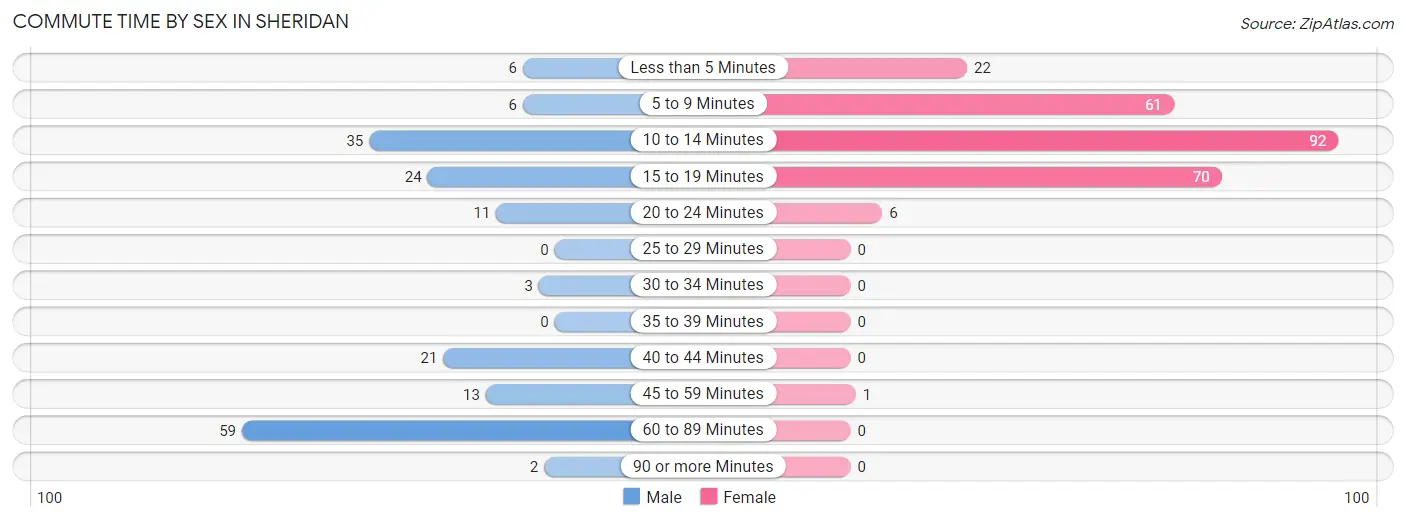
| Commute Time | Male | Female |
| Less than 5 Minutes | 6 (3.3%) | 22 (8.7%) |
| 5 to 9 Minutes | 6 (3.3%) | 61 (24.2%) |
| 10 to 14 Minutes | 35 (19.4%) | 92 (36.5%) |
| 15 to 19 Minutes | 24 (13.3%) | 70 (27.8%) |
| 20 to 24 Minutes | 11 (6.1%) | 6 (2.4%) |
| 25 to 29 Minutes | 0 (0.0%) | 0 (0.0%) |
| 30 to 34 Minutes | 3 (1.7%) | 0 (0.0%) |
| 35 to 39 Minutes | 0 (0.0%) | 0 (0.0%) |
| 40 to 44 Minutes | 21 (11.7%) | 0 (0.0%) |
| 45 to 59 Minutes | 13 (7.2%) | 1 (0.4%) |
| 60 to 89 Minutes | 59 (32.8%) | 0 (0.0%) |
| 90 or more Minutes | 2 (1.1%) | 0 (0.0%) |
Time of Departure to Work by Sex in Sheridan
The most frequent times of departure to work in Sheridan are 6:30 AM to 6:59 AM (51, 28.3%) for males and 5:30 AM to 5:59 AM (117, 46.4%) for females.
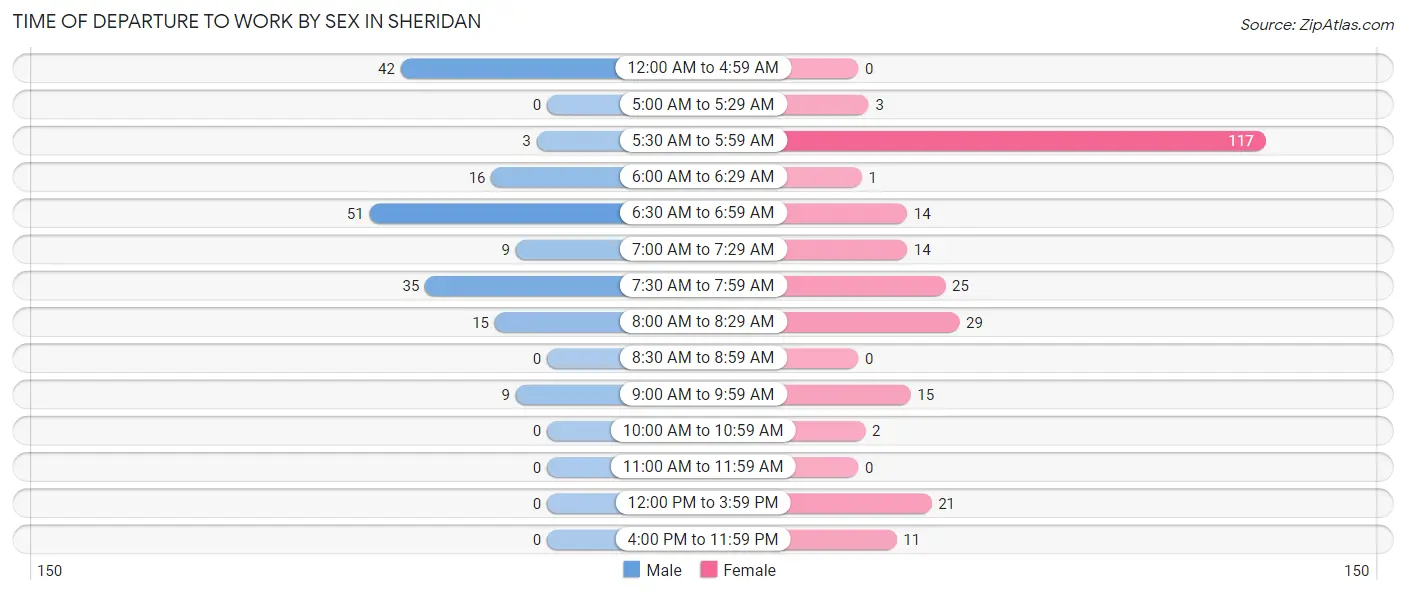
| Time of Departure | Male | Female |
| 12:00 AM to 4:59 AM | 42 (23.3%) | 0 (0.0%) |
| 5:00 AM to 5:29 AM | 0 (0.0%) | 3 (1.2%) |
| 5:30 AM to 5:59 AM | 3 (1.7%) | 117 (46.4%) |
| 6:00 AM to 6:29 AM | 16 (8.9%) | 1 (0.4%) |
| 6:30 AM to 6:59 AM | 51 (28.3%) | 14 (5.6%) |
| 7:00 AM to 7:29 AM | 9 (5.0%) | 14 (5.6%) |
| 7:30 AM to 7:59 AM | 35 (19.4%) | 25 (9.9%) |
| 8:00 AM to 8:29 AM | 15 (8.3%) | 29 (11.5%) |
| 8:30 AM to 8:59 AM | 0 (0.0%) | 0 (0.0%) |
| 9:00 AM to 9:59 AM | 9 (5.0%) | 15 (5.9%) |
| 10:00 AM to 10:59 AM | 0 (0.0%) | 2 (0.8%) |
| 11:00 AM to 11:59 AM | 0 (0.0%) | 0 (0.0%) |
| 12:00 PM to 3:59 PM | 0 (0.0%) | 21 (8.3%) |
| 4:00 PM to 11:59 PM | 0 (0.0%) | 11 (4.4%) |
| Total | 180 (100.0%) | 252 (100.0%) |
Housing Occupancy in Sheridan
Occupancy by Ownership in Sheridan
Of the total 369 dwellings in Sheridan, owner-occupied units account for 319 (86.5%), while renter-occupied units make up 50 (13.6%).
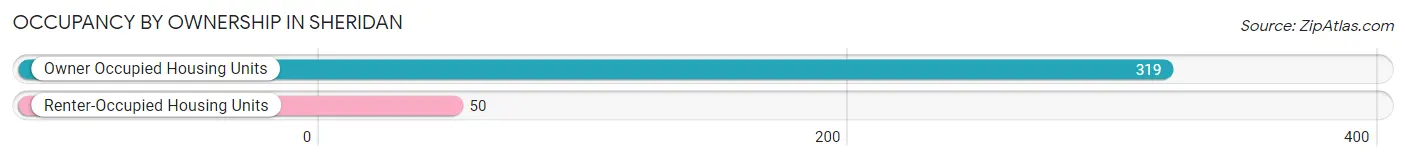
| Occupancy | # Housing Units | % Housing Units |
| Owner Occupied Housing Units | 319 | 86.5% |
| Renter-Occupied Housing Units | 50 | 13.6% |
| Total Occupied Housing Units | 369 | 100.0% |
Occupancy by Household Size in Sheridan
| Household Size | # Housing Units | % Housing Units |
| 1-Person Household | 185 | 50.1% |
| 2-Person Household | 137 | 37.1% |
| 3-Person Household | 17 | 4.6% |
| 4+ Person Household | 30 | 8.1% |
| Total Housing Units | 369 | 100.0% |
Occupancy by Ownership by Household Size in Sheridan
| Household Size | Owner-occupied | Renter-occupied |
| 1-Person Household | 143 (77.3%) | 42 (22.7%) |
| 2-Person Household | 132 (96.4%) | 5 (3.6%) |
| 3-Person Household | 17 (100.0%) | 0 (0.0%) |
| 4+ Person Household | 27 (90.0%) | 3 (10.0%) |
| Total Housing Units | 319 (86.5%) | 50 (13.6%) |
Occupancy by Educational Attainment in Sheridan
| Household Size | Owner-occupied | Renter-occupied |
| Less than High School | 16 (80.0%) | 4 (20.0%) |
| High School Diploma | 76 (89.4%) | 9 (10.6%) |
| College/Associate Degree | 95 (83.3%) | 19 (16.7%) |
| Bachelor's Degree or higher | 132 (88.0%) | 18 (12.0%) |
Occupancy by Age of Householder in Sheridan
| Age Bracket | # Households | % Households |
| Under 35 Years | 16 | 4.3% |
| 35 to 44 Years | 20 | 5.4% |
| 45 to 54 Years | 24 | 6.5% |
| 55 to 64 Years | 113 | 30.6% |
| 65 to 74 Years | 90 | 24.4% |
| 75 to 84 Years | 54 | 14.6% |
| 85 Years and Over | 52 | 14.1% |
| Total | 369 | 100.0% |
Housing Finances in Sheridan
Median Income by Occupancy in Sheridan
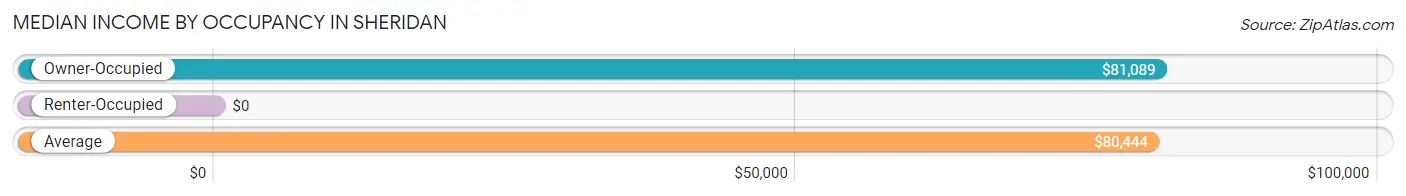
| Occupancy Type | # Households | Median Income |
| Owner-Occupied | 319 (86.5%) | $81,089 |
| Renter-Occupied | 50 (13.6%) | $0 |
| Average | 369 (100.0%) | $80,444 |
Occupancy by Householder Income Bracket in Sheridan
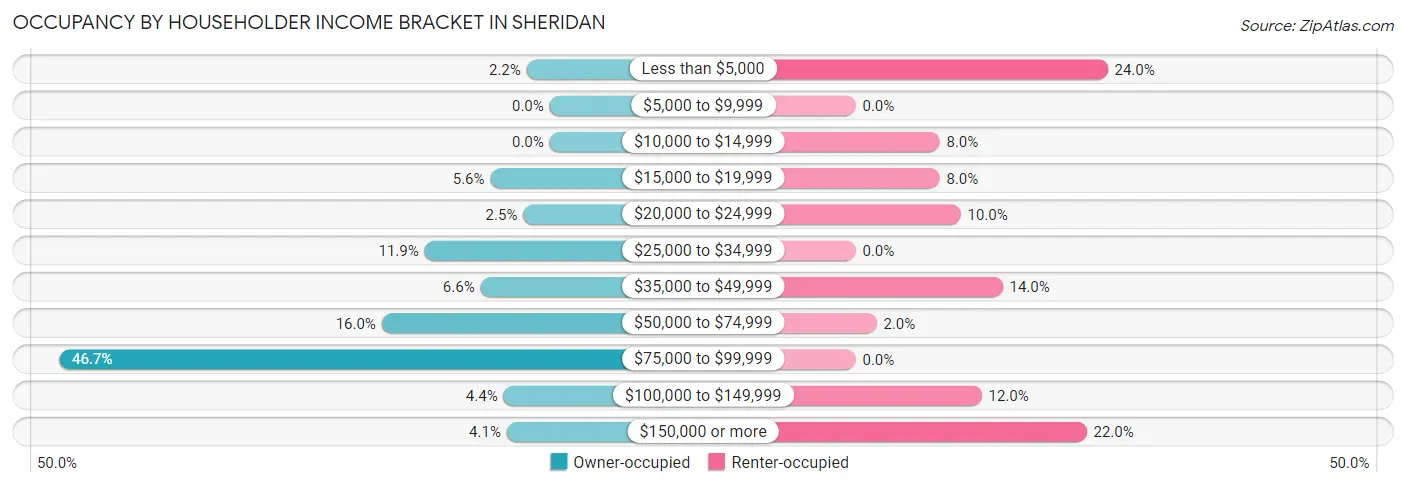
| Income Bracket | Owner-occupied | Renter-occupied |
| Less than $5,000 | 7 (2.2%) | 12 (24.0%) |
| $5,000 to $9,999 | 0 (0.0%) | 0 (0.0%) |
| $10,000 to $14,999 | 0 (0.0%) | 4 (8.0%) |
| $15,000 to $19,999 | 18 (5.6%) | 4 (8.0%) |
| $20,000 to $24,999 | 8 (2.5%) | 5 (10.0%) |
| $25,000 to $34,999 | 38 (11.9%) | 0 (0.0%) |
| $35,000 to $49,999 | 21 (6.6%) | 7 (14.0%) |
| $50,000 to $74,999 | 51 (16.0%) | 1 (2.0%) |
| $75,000 to $99,999 | 149 (46.7%) | 0 (0.0%) |
| $100,000 to $149,999 | 14 (4.4%) | 6 (12.0%) |
| $150,000 or more | 13 (4.1%) | 11 (22.0%) |
| Total | 319 (100.0%) | 50 (100.0%) |
Monthly Housing Cost Tiers in Sheridan
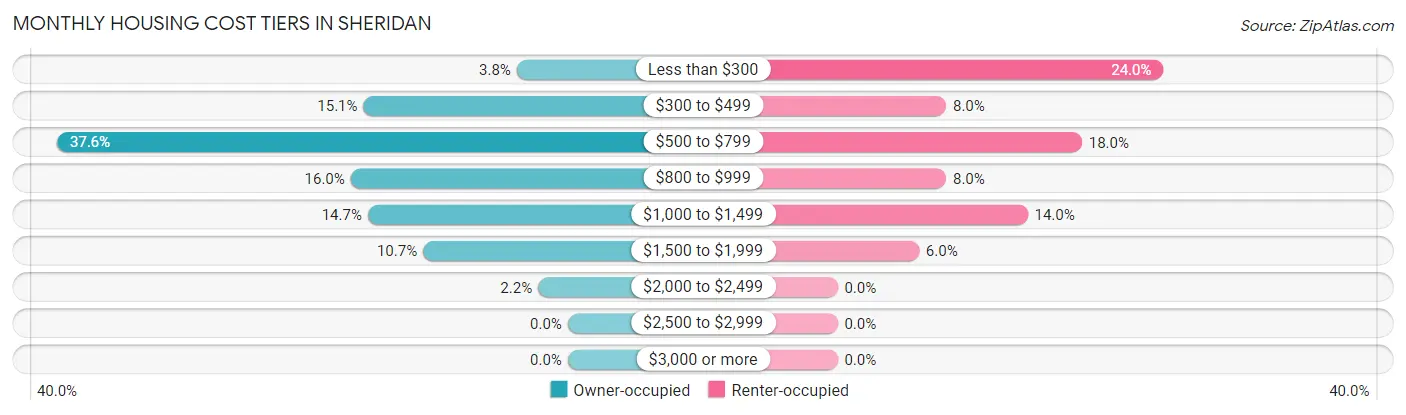
| Monthly Cost | Owner-occupied | Renter-occupied |
| Less than $300 | 12 (3.8%) | 12 (24.0%) |
| $300 to $499 | 48 (15.0%) | 4 (8.0%) |
| $500 to $799 | 120 (37.6%) | 9 (18.0%) |
| $800 to $999 | 51 (16.0%) | 4 (8.0%) |
| $1,000 to $1,499 | 47 (14.7%) | 7 (14.0%) |
| $1,500 to $1,999 | 34 (10.7%) | 3 (6.0%) |
| $2,000 to $2,499 | 7 (2.2%) | 0 (0.0%) |
| $2,500 to $2,999 | 0 (0.0%) | 0 (0.0%) |
| $3,000 or more | 0 (0.0%) | 0 (0.0%) |
| Total | 319 (100.0%) | 50 (100.0%) |
Physical Housing Characteristics in Sheridan
Housing Structures in Sheridan
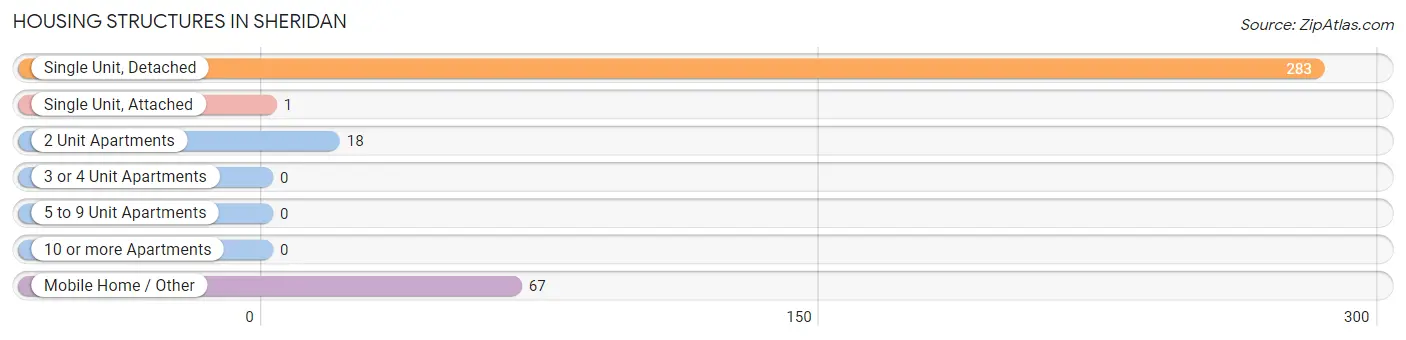
| Structure Type | # Housing Units | % Housing Units |
| Single Unit, Detached | 283 | 76.7% |
| Single Unit, Attached | 1 | 0.3% |
| 2 Unit Apartments | 18 | 4.9% |
| 3 or 4 Unit Apartments | 0 | 0.0% |
| 5 to 9 Unit Apartments | 0 | 0.0% |
| 10 or more Apartments | 0 | 0.0% |
| Mobile Home / Other | 67 | 18.2% |
| Total | 369 | 100.0% |
Housing Structures by Occupancy in Sheridan
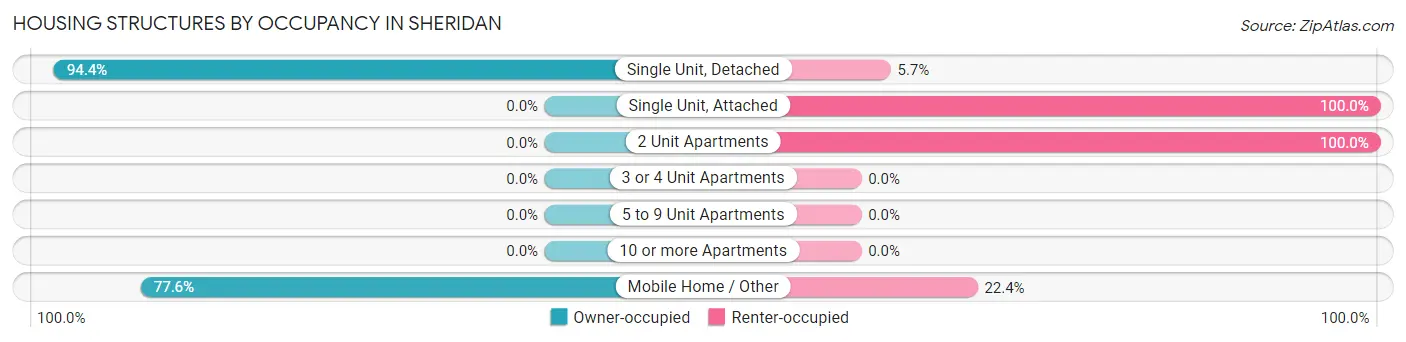
| Structure Type | Owner-occupied | Renter-occupied |
| Single Unit, Detached | 267 (94.4%) | 16 (5.7%) |
| Single Unit, Attached | 0 (0.0%) | 1 (100.0%) |
| 2 Unit Apartments | 0 (0.0%) | 18 (100.0%) |
| 3 or 4 Unit Apartments | 0 (0.0%) | 0 (0.0%) |
| 5 to 9 Unit Apartments | 0 (0.0%) | 0 (0.0%) |
| 10 or more Apartments | 0 (0.0%) | 0 (0.0%) |
| Mobile Home / Other | 52 (77.6%) | 15 (22.4%) |
| Total | 319 (86.5%) | 50 (13.6%) |
Housing Structures by Number of Rooms in Sheridan
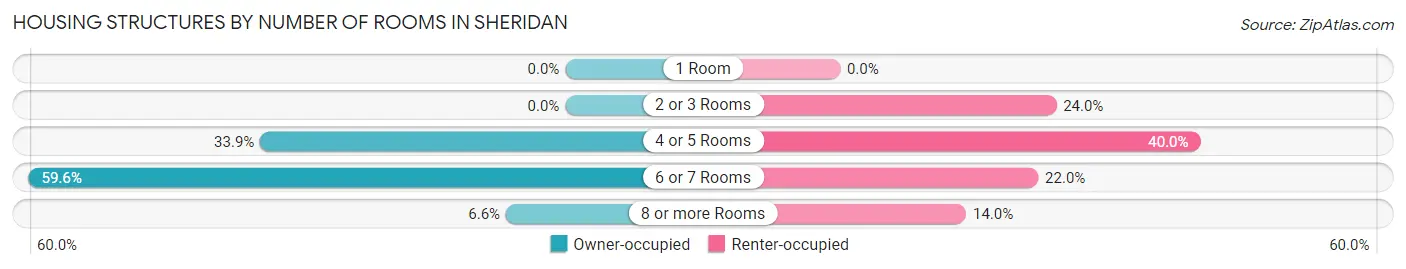
| Number of Rooms | Owner-occupied | Renter-occupied |
| 1 Room | 0 (0.0%) | 0 (0.0%) |
| 2 or 3 Rooms | 0 (0.0%) | 12 (24.0%) |
| 4 or 5 Rooms | 108 (33.9%) | 20 (40.0%) |
| 6 or 7 Rooms | 190 (59.6%) | 11 (22.0%) |
| 8 or more Rooms | 21 (6.6%) | 7 (14.0%) |
| Total | 319 (100.0%) | 50 (100.0%) |
Housing Structure by Heating Type in Sheridan
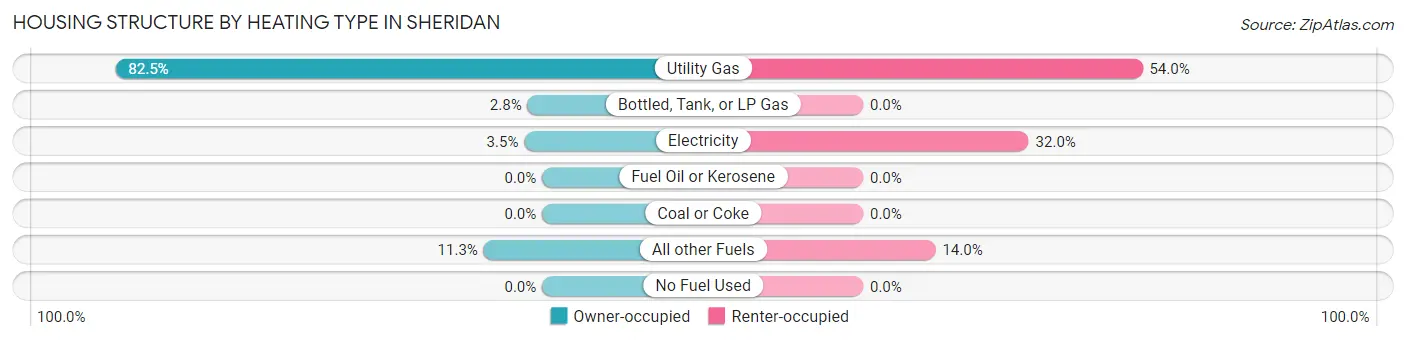
| Heating Type | Owner-occupied | Renter-occupied |
| Utility Gas | 263 (82.5%) | 27 (54.0%) |
| Bottled, Tank, or LP Gas | 9 (2.8%) | 0 (0.0%) |
| Electricity | 11 (3.5%) | 16 (32.0%) |
| Fuel Oil or Kerosene | 0 (0.0%) | 0 (0.0%) |
| Coal or Coke | 0 (0.0%) | 0 (0.0%) |
| All other Fuels | 36 (11.3%) | 7 (14.0%) |
| No Fuel Used | 0 (0.0%) | 0 (0.0%) |
| Total | 319 (100.0%) | 50 (100.0%) |
Household Vehicle Usage in Sheridan
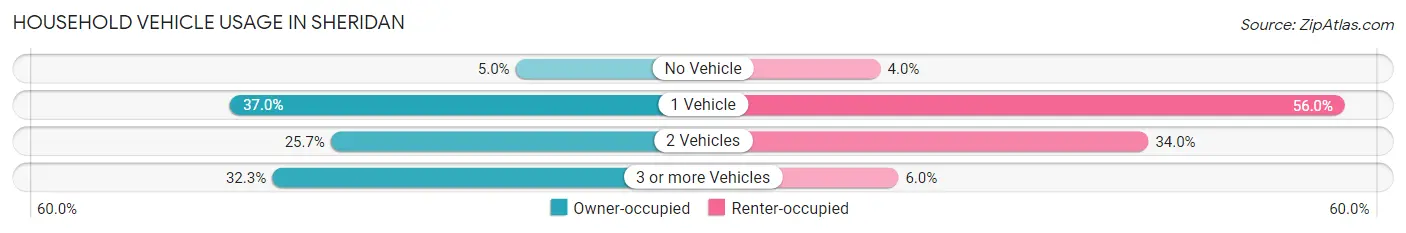
| Vehicles per Household | Owner-occupied | Renter-occupied |
| No Vehicle | 16 (5.0%) | 2 (4.0%) |
| 1 Vehicle | 118 (37.0%) | 28 (56.0%) |
| 2 Vehicles | 82 (25.7%) | 17 (34.0%) |
| 3 or more Vehicles | 103 (32.3%) | 3 (6.0%) |
| Total | 319 (100.0%) | 50 (100.0%) |
Real Estate & Mortgages in Sheridan
Real Estate and Mortgage Overview in Sheridan
| Characteristic | Without Mortgage | With Mortgage |
| Housing Units | 173 | 146 |
| Median Property Value | $333,100 | $207,700 |
| Median Household Income | $72,344 | $13 |
| Monthly Housing Costs | $558 | $0 |
| Real Estate Taxes | $2,092 | $0 |
Property Value by Mortgage Status in Sheridan
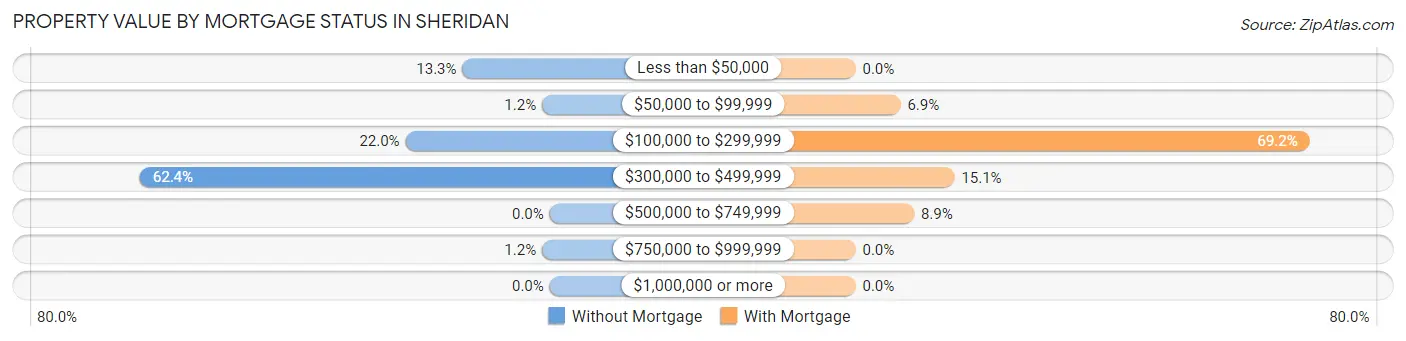
| Property Value | Without Mortgage | With Mortgage |
| Less than $50,000 | 23 (13.3%) | 0 (0.0%) |
| $50,000 to $99,999 | 2 (1.2%) | 10 (6.9%) |
| $100,000 to $299,999 | 38 (22.0%) | 101 (69.2%) |
| $300,000 to $499,999 | 108 (62.4%) | 22 (15.1%) |
| $500,000 to $749,999 | 0 (0.0%) | 13 (8.9%) |
| $750,000 to $999,999 | 2 (1.2%) | 0 (0.0%) |
| $1,000,000 or more | 0 (0.0%) | 0 (0.0%) |
| Total | 173 (100.0%) | 146 (100.0%) |
Household Income by Mortgage Status in Sheridan
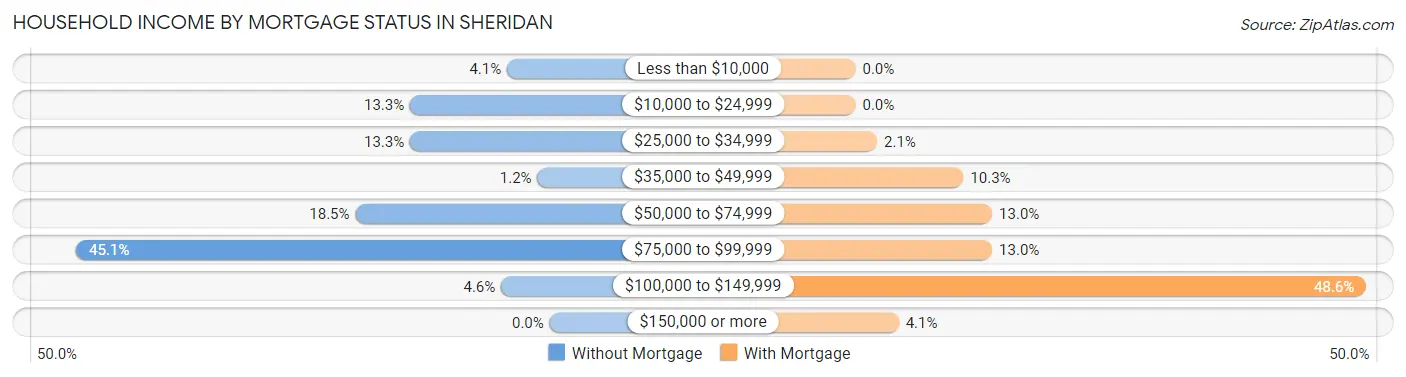
| Household Income | Without Mortgage | With Mortgage |
| Less than $10,000 | 7 (4.1%) | 0 (0.0%) |
| $10,000 to $24,999 | 23 (13.3%) | 0 (0.0%) |
| $25,000 to $34,999 | 23 (13.3%) | 3 (2.1%) |
| $35,000 to $49,999 | 2 (1.2%) | 15 (10.3%) |
| $50,000 to $74,999 | 32 (18.5%) | 19 (13.0%) |
| $75,000 to $99,999 | 78 (45.1%) | 19 (13.0%) |
| $100,000 to $149,999 | 8 (4.6%) | 71 (48.6%) |
| $150,000 or more | 0 (0.0%) | 6 (4.1%) |
| Total | 173 (100.0%) | 146 (100.0%) |
Property Value to Household Income Ratio in Sheridan
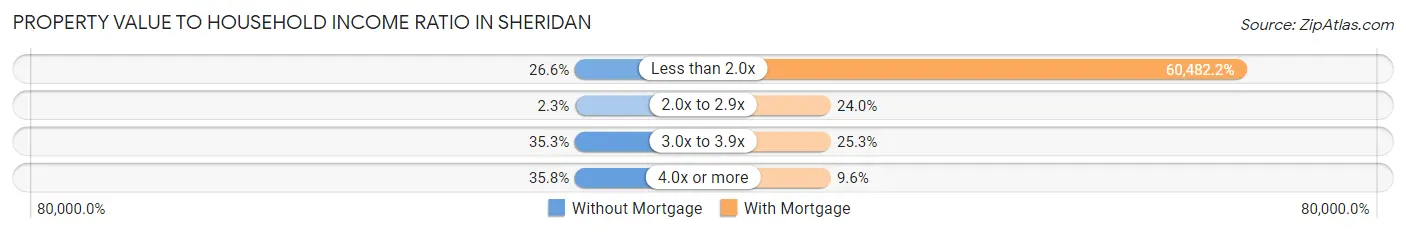
| Value-to-Income Ratio | Without Mortgage | With Mortgage |
| Less than 2.0x | 46 (26.6%) | 88,304 (60,482.2%) |
| 2.0x to 2.9x | 4 (2.3%) | 35 (24.0%) |
| 3.0x to 3.9x | 61 (35.3%) | 37 (25.3%) |
| 4.0x or more | 62 (35.8%) | 14 (9.6%) |
| Total | 173 (100.0%) | 146 (100.0%) |
Real Estate Taxes by Mortgage Status in Sheridan
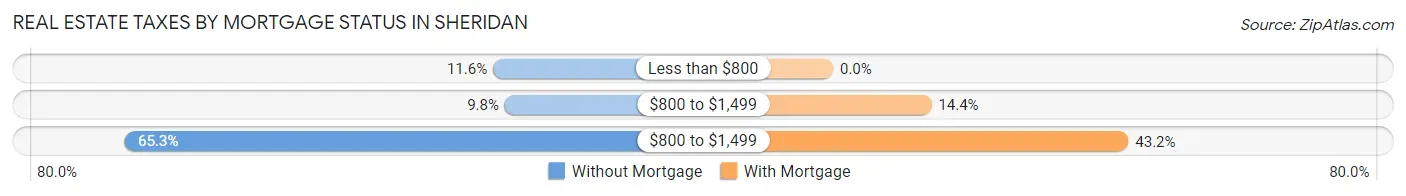
| Property Taxes | Without Mortgage | With Mortgage |
| Less than $800 | 20 (11.6%) | 0 (0.0%) |
| $800 to $1,499 | 17 (9.8%) | 21 (14.4%) |
| $800 to $1,499 | 113 (65.3%) | 63 (43.1%) |
| Total | 173 (100.0%) | 146 (100.0%) |
Health & Disability in Sheridan
Health Insurance Coverage by Age in Sheridan
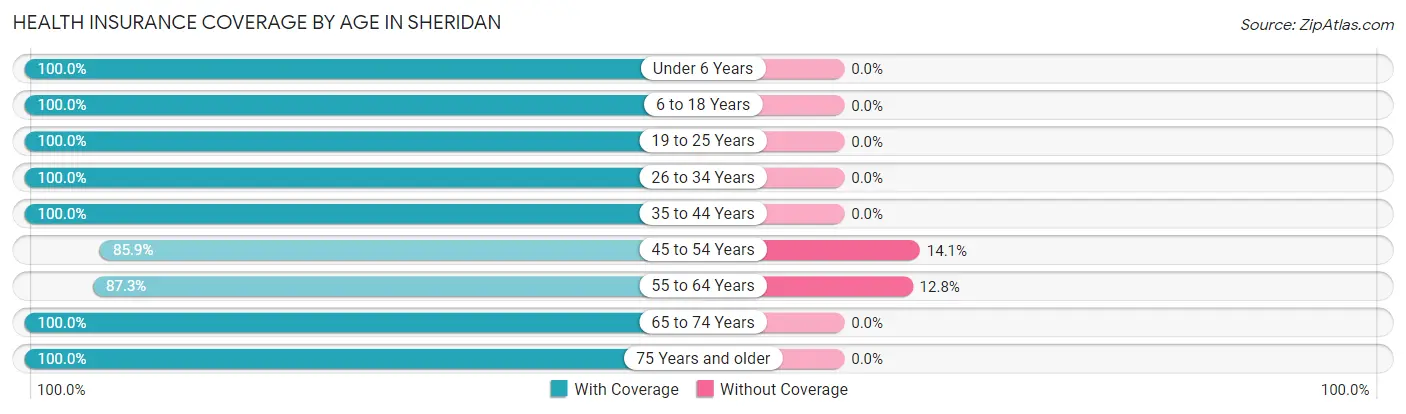
| Age Bracket | With Coverage | Without Coverage |
| Under 6 Years | 50 (100.0%) | 0 (0.0%) |
| 6 to 18 Years | 100 (100.0%) | 0 (0.0%) |
| 19 to 25 Years | 55 (100.0%) | 0 (0.0%) |
| 26 to 34 Years | 11 (100.0%) | 0 (0.0%) |
| 35 to 44 Years | 66 (100.0%) | 0 (0.0%) |
| 45 to 54 Years | 128 (85.9%) | 21 (14.1%) |
| 55 to 64 Years | 130 (87.3%) | 19 (12.8%) |
| 65 to 74 Years | 129 (100.0%) | 0 (0.0%) |
| 75 Years and older | 126 (100.0%) | 0 (0.0%) |
| Total | 795 (95.2%) | 40 (4.8%) |
Health Insurance Coverage by Citizenship Status in Sheridan
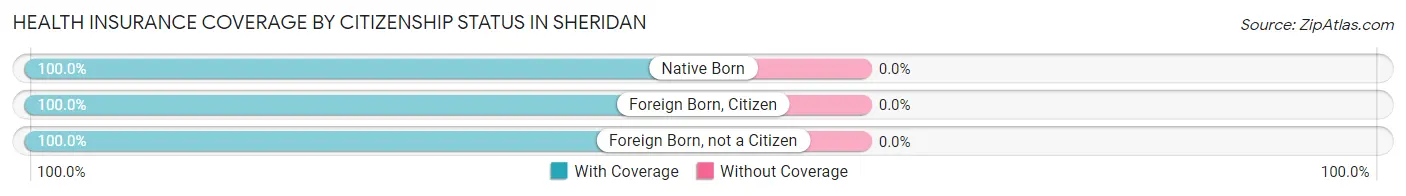
| Citizenship Status | With Coverage | Without Coverage |
| Native Born | 50 (100.0%) | 0 (0.0%) |
| Foreign Born, Citizen | 100 (100.0%) | 0 (0.0%) |
| Foreign Born, not a Citizen | 55 (100.0%) | 0 (0.0%) |
Health Insurance Coverage by Household Income in Sheridan
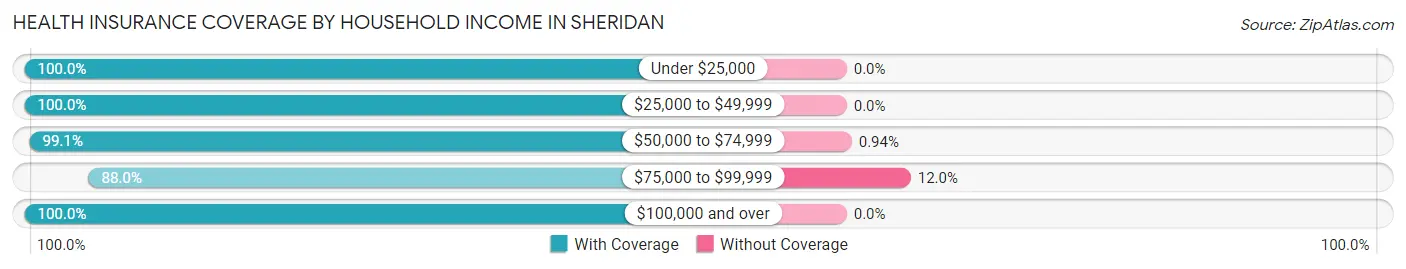
| Household Income | With Coverage | Without Coverage |
| Under $25,000 | 82 (100.0%) | 0 (0.0%) |
| $25,000 to $49,999 | 116 (100.0%) | 0 (0.0%) |
| $50,000 to $74,999 | 211 (99.1%) | 2 (0.9%) |
| $75,000 to $99,999 | 279 (88.0%) | 38 (12.0%) |
| $100,000 and over | 107 (100.0%) | 0 (0.0%) |
Public vs Private Health Insurance Coverage by Age in Sheridan
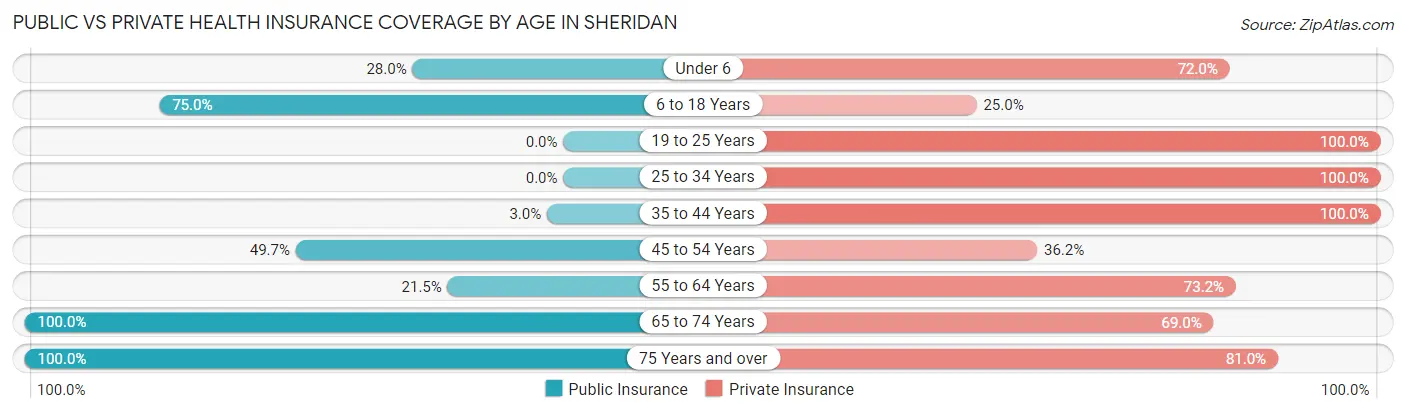
| Age Bracket | Public Insurance | Private Insurance |
| Under 6 | 14 (28.0%) | 36 (72.0%) |
| 6 to 18 Years | 75 (75.0%) | 25 (25.0%) |
| 19 to 25 Years | 0 (0.0%) | 55 (100.0%) |
| 25 to 34 Years | 0 (0.0%) | 11 (100.0%) |
| 35 to 44 Years | 2 (3.0%) | 66 (100.0%) |
| 45 to 54 Years | 74 (49.7%) | 54 (36.2%) |
| 55 to 64 Years | 32 (21.5%) | 109 (73.2%) |
| 65 to 74 Years | 129 (100.0%) | 89 (69.0%) |
| 75 Years and over | 126 (100.0%) | 102 (80.9%) |
| Total | 452 (54.1%) | 547 (65.5%) |
Disability Status by Sex by Age in Sheridan
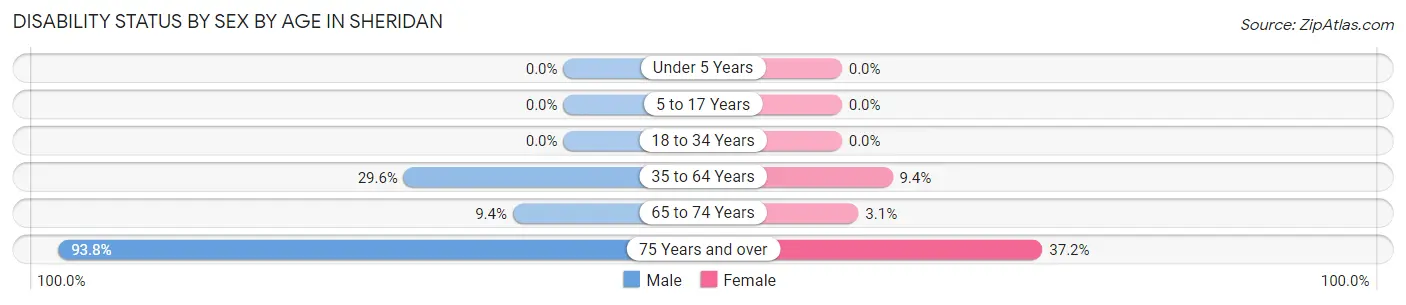
| Age Bracket | Male | Female |
| Under 5 Years | 0 (0.0%) | 0 (0.0%) |
| 5 to 17 Years | 0 (0.0%) | 0 (0.0%) |
| 18 to 34 Years | 0 (0.0%) | 0 (0.0%) |
| 35 to 64 Years | 48 (29.6%) | 19 (9.4%) |
| 65 to 74 Years | 6 (9.4%) | 2 (3.1%) |
| 75 Years and over | 30 (93.8%) | 35 (37.2%) |
Disability Class by Sex by Age in Sheridan
Disability Class: Hearing Difficulty
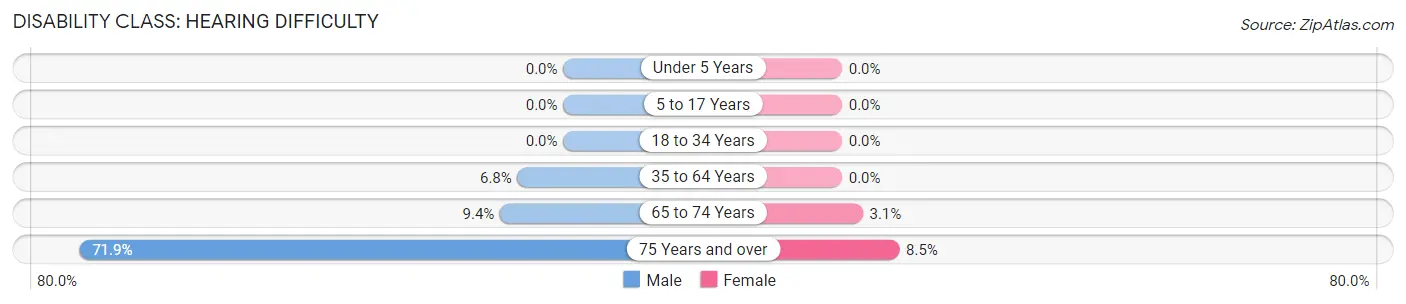
| Age Bracket | Male | Female |
| Under 5 Years | 0 (0.0%) | 0 (0.0%) |
| 5 to 17 Years | 0 (0.0%) | 0 (0.0%) |
| 18 to 34 Years | 0 (0.0%) | 0 (0.0%) |
| 35 to 64 Years | 11 (6.8%) | 0 (0.0%) |
| 65 to 74 Years | 6 (9.4%) | 2 (3.1%) |
| 75 Years and over | 23 (71.9%) | 8 (8.5%) |
Disability Class: Vision Difficulty
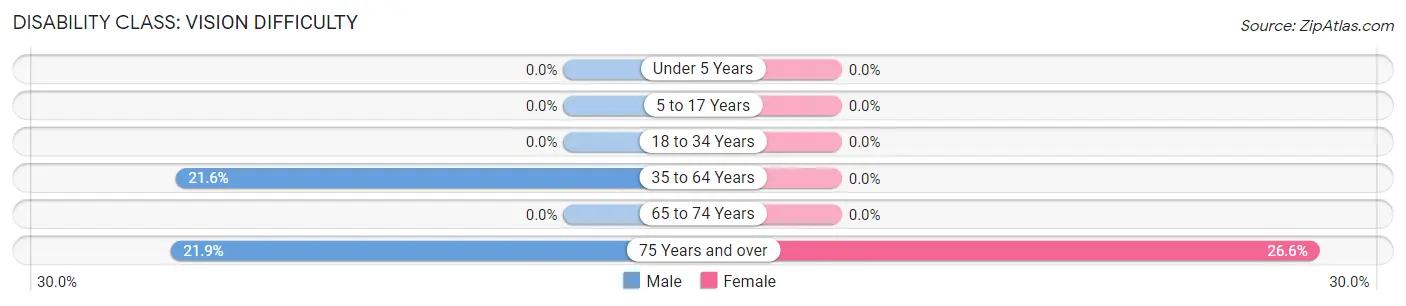
| Age Bracket | Male | Female |
| Under 5 Years | 0 (0.0%) | 0 (0.0%) |
| 5 to 17 Years | 0 (0.0%) | 0 (0.0%) |
| 18 to 34 Years | 0 (0.0%) | 0 (0.0%) |
| 35 to 64 Years | 35 (21.6%) | 0 (0.0%) |
| 65 to 74 Years | 0 (0.0%) | 0 (0.0%) |
| 75 Years and over | 7 (21.9%) | 25 (26.6%) |
Disability Class: Cognitive Difficulty
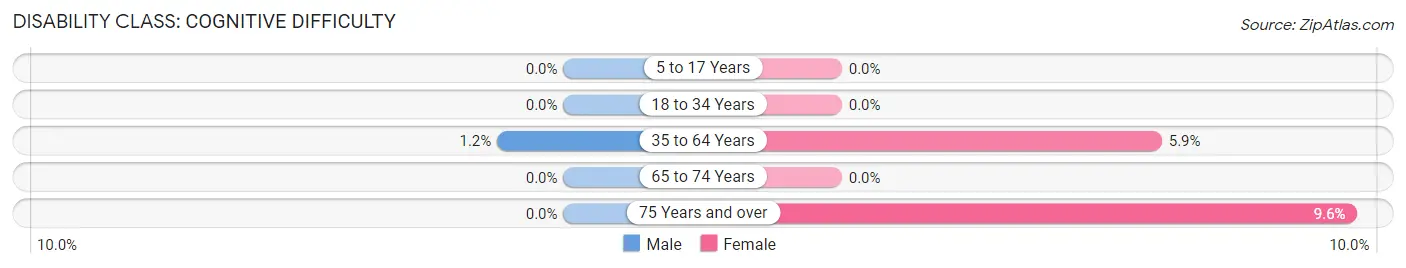
| Age Bracket | Male | Female |
| 5 to 17 Years | 0 (0.0%) | 0 (0.0%) |
| 18 to 34 Years | 0 (0.0%) | 0 (0.0%) |
| 35 to 64 Years | 2 (1.2%) | 12 (5.9%) |
| 65 to 74 Years | 0 (0.0%) | 0 (0.0%) |
| 75 Years and over | 0 (0.0%) | 9 (9.6%) |
Disability Class: Ambulatory Difficulty
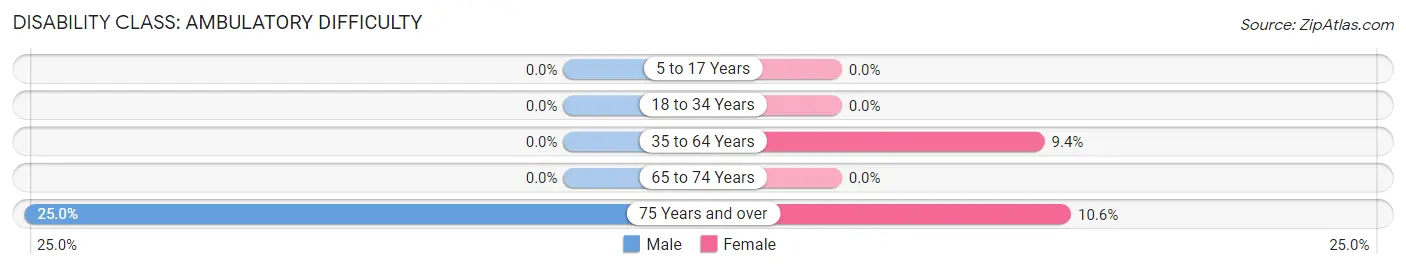
| Age Bracket | Male | Female |
| 5 to 17 Years | 0 (0.0%) | 0 (0.0%) |
| 18 to 34 Years | 0 (0.0%) | 0 (0.0%) |
| 35 to 64 Years | 0 (0.0%) | 19 (9.4%) |
| 65 to 74 Years | 0 (0.0%) | 0 (0.0%) |
| 75 Years and over | 8 (25.0%) | 10 (10.6%) |
Disability Class: Self-Care Difficulty
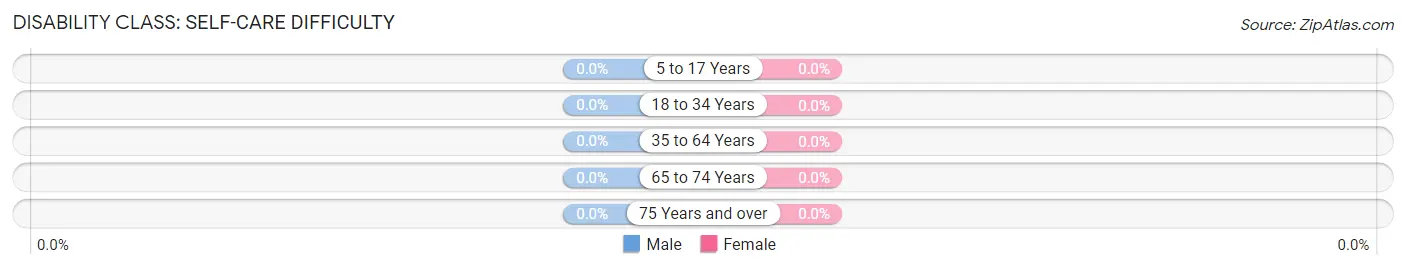
| Age Bracket | Male | Female |
| 5 to 17 Years | 0 (0.0%) | 0 (0.0%) |
| 18 to 34 Years | 0 (0.0%) | 0 (0.0%) |
| 35 to 64 Years | 0 (0.0%) | 0 (0.0%) |
| 65 to 74 Years | 0 (0.0%) | 0 (0.0%) |
| 75 Years and over | 0 (0.0%) | 0 (0.0%) |
Technology Access in Sheridan
Computing Device Access in Sheridan
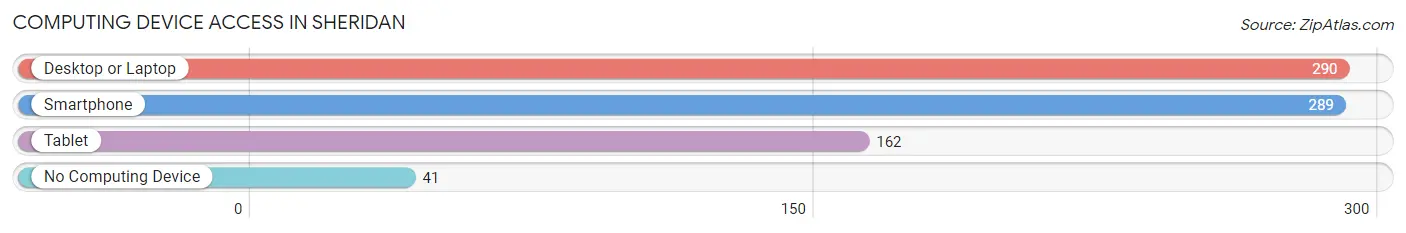
| Device Type | # Households | % Households |
| Desktop or Laptop | 290 | 78.6% |
| Smartphone | 289 | 78.3% |
| Tablet | 162 | 43.9% |
| No Computing Device | 41 | 11.1% |
| Total | 369 | 100.0% |
Internet Access in Sheridan
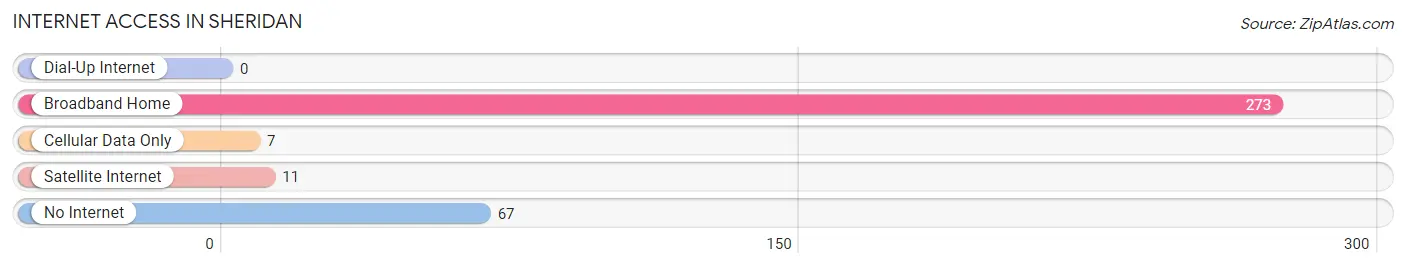
| Internet Type | # Households | % Households |
| Dial-Up Internet | 0 | 0.0% |
| Broadband Home | 273 | 74.0% |
| Cellular Data Only | 7 | 1.9% |
| Satellite Internet | 11 | 3.0% |
| No Internet | 67 | 18.2% |
| Total | 369 | 100.0% |
Sheridan Summary
Sheridan, Montana is a small town located in the western part of the state, near the Idaho border. It is situated in the Bitterroot Valley, a region of the Rocky Mountains known for its scenic beauty and outdoor recreation opportunities. The town has a population of just over 1,000 people and is the county seat of Ravalli County.
History
Sheridan was founded in 1883 by a group of settlers from the Midwest. The town was named after General Philip Sheridan, a Civil War hero. The settlers were attracted to the area by the abundance of natural resources, including timber, minerals, and water. The town quickly grew and by the early 1900s, it had become a bustling center of commerce and industry.
The town was home to several sawmills, a flour mill, a brickyard, and a number of other businesses. The railroad also played an important role in the town’s development, as it provided a means of transporting goods and people to and from the area.
Geography
Sheridan is located in the Bitterroot Valley, a region of the Rocky Mountains. The town is situated at an elevation of 3,400 feet and is surrounded by mountains and forests. The Bitterroot River runs through the town, providing a source of water for the area.
The climate in Sheridan is generally mild, with warm summers and cold winters. The average annual temperature is around 50 degrees Fahrenheit. The area receives an average of 20 inches of precipitation each year, mostly in the form of snow.
Economy
The economy of Sheridan is largely based on agriculture and tourism. The town is home to several farms, which produce a variety of crops, including wheat, barley, hay, and potatoes. The area is also known for its cattle and sheep ranches.
Tourism is an important part of the local economy. The town is a popular destination for outdoor recreation, such as fishing, hunting, camping, and hiking. The nearby Bitterroot National Forest provides a variety of recreational opportunities, including camping, hiking, and horseback riding.
Demographics
As of the 2010 census, the population of Sheridan was 1,037. The racial makeup of the town was 95.3% White, 0.3% African American, 0.7% Native American, 0.2% Asian, 0.1% Pacific Islander, and 2.4% from other races. The median household income was $37,917, and the median family income was $45,625.
The town is served by the Sheridan School District, which includes an elementary school, a middle school, and a high school. The town also has a public library and a number of churches.
Sheridan is a small town with a rich history and a vibrant economy. The town is surrounded by natural beauty and offers a variety of recreational activities. The town is also home to a diverse population, making it a great place to live and work.
Common Questions
What is Per Capita Income in Sheridan?
Per Capita income in Sheridan is $37,291.
What is the Median Family Income in Sheridan?
Median Family Income in Sheridan is $81,573.
What is the Median Household income in Sheridan?
Median Household Income in Sheridan is $80,444.
What is Income or Wage Gap in Sheridan?
Income or Wage Gap in Sheridan is 77.1%.
Women in Sheridan earn 22.9 cents for every dollar earned by a man.
What is Inequality or Gini Index in Sheridan?
Inequality or Gini Index in Sheridan is 0.35.
What is the Total Population of Sheridan?
Total Population of Sheridan is 867.
What is the Total Male Population of Sheridan?
Total Male Population of Sheridan is 352.
What is the Total Female Population of Sheridan?
Total Female Population of Sheridan is 515.
What is the Ratio of Males per 100 Females in Sheridan?
There are 68.35 Males per 100 Females in Sheridan.
What is the Ratio of Females per 100 Males in Sheridan?
There are 146.31 Females per 100 Males in Sheridan.
What is the Median Population Age in Sheridan?
Median Population Age in Sheridan is 54.8 Years.
What is the Average Family Size in Sheridan
Average Family Size in Sheridan is 3.5 People.
What is the Average Household Size in Sheridan
Average Household Size in Sheridan is 2.3 People.
How Large is the Labor Force in Sheridan?
There are 447 People in the Labor Forcein in Sheridan.
What is the Percentage of People in the Labor Force in Sheridan?
57.6% of People are in the Labor Force in Sheridan.
What is the Unemployment Rate in Sheridan?
Unemployment Rate in Sheridan is 2.5%.