Pablo, MT Map & Demographics
Pablo Map
Pablo Overview
$17,661
PER CAPITA INCOME
$36,500
AVG FAMILY INCOME
$35,395
AVG HOUSEHOLD INCOME
32.8%
WAGE / INCOME GAP [ % ]
67.2¢/ $1
WAGE / INCOME GAP [ $ ]
0.53
INEQUALITY / GINI INDEX
1,799
TOTAL POPULATION
900
MALE POPULATION
899
FEMALE POPULATION
100.11
MALES / 100 FEMALES
99.89
FEMALES / 100 MALES
28.1
MEDIAN AGE
3.2
AVG FAMILY SIZE
2.7
AVG HOUSEHOLD SIZE
679
LABOR FORCE [ PEOPLE ]
53.2%
PERCENT IN LABOR FORCE
8.2%
UNEMPLOYMENT RATE
Pablo Zip Codes
Pablo Area Codes
Income in Pablo
Income Overview in Pablo
Per Capita Income in Pablo is $17,661, while median incomes of families and households are $36,500 and $35,395 respectively.
| Characteristic | Number | Measure |
| Per Capita Income | 1,799 | $17,661 |
| Median Family Income | 418 | $36,500 |
| Mean Family Income | 418 | $42,431 |
| Median Household Income | 652 | $35,395 |
| Mean Household Income | 652 | $45,031 |
| Income Deficit | 418 | $0 |
| Wage / Income Gap (%) | 1,799 | 32.76% |
| Wage / Income Gap ($) | 1,799 | 67.24¢ per $1 |
| Gini / Inequality Index | 1,799 | 0.53 |
Earnings by Sex in Pablo
Average Earnings in Pablo are $24,637, $21,813 for men and $32,440 for women, a difference of 32.8%.
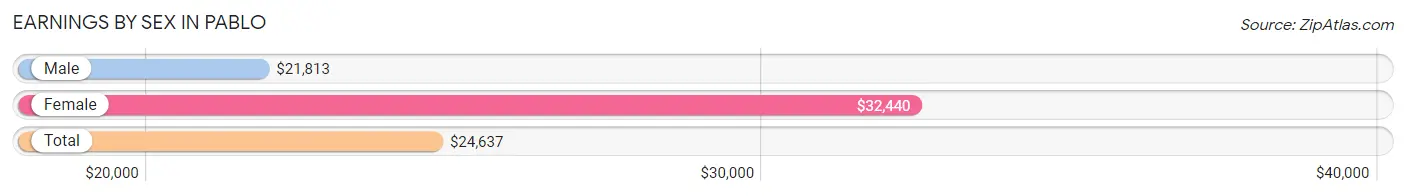
| Sex | Number | Average Earnings |
| Male | 401 (51.8%) | $21,813 |
| Female | 373 (48.2%) | $32,440 |
| Total | 774 (100.0%) | $24,637 |
Earnings by Sex by Income Bracket in Pablo
The most common earnings brackets in Pablo are $12,500 to $14,999 for men (43 | 10.7%) and $30,000 to $34,999 for women (94 | 25.2%).
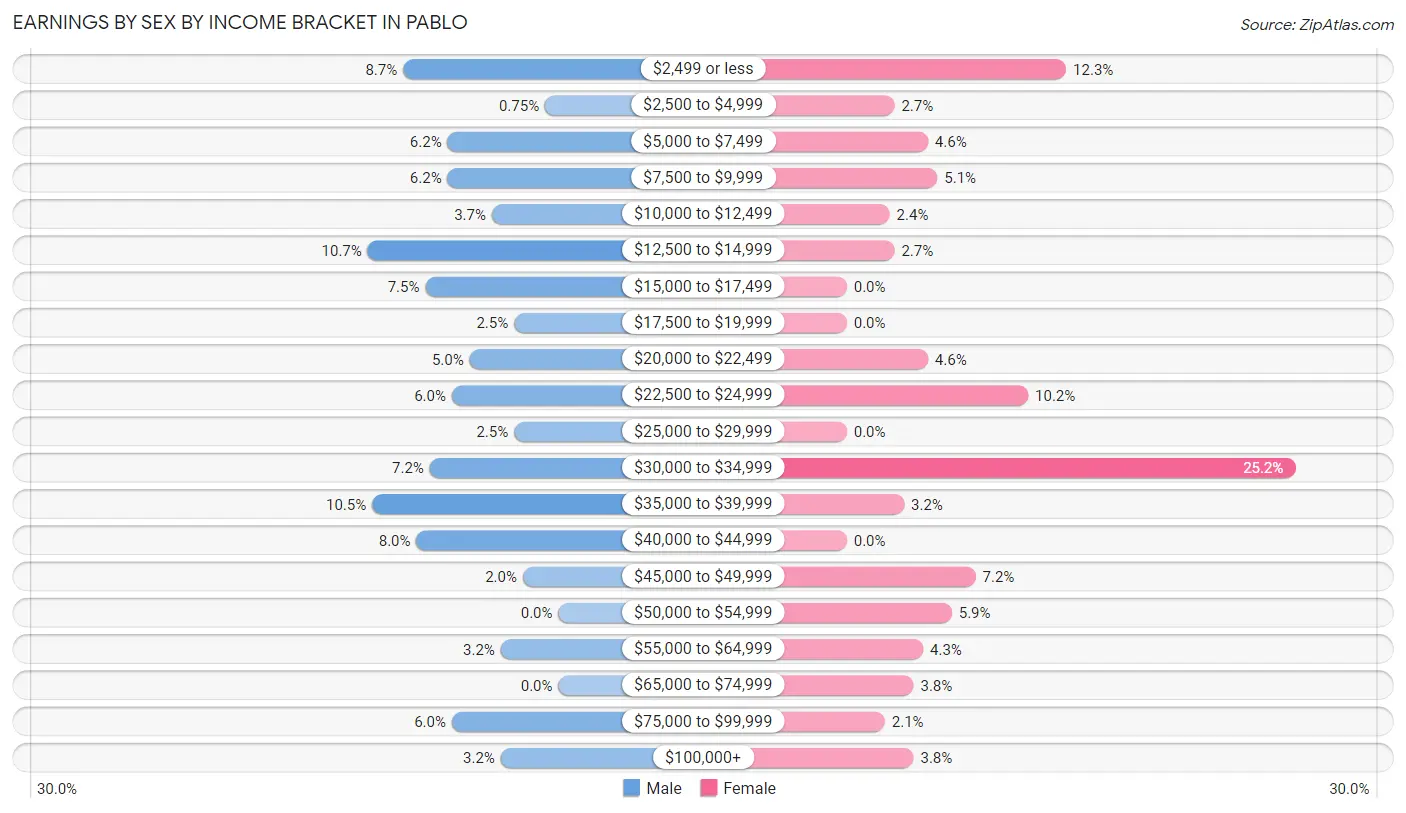
| Income | Male | Female |
| $2,499 or less | 35 (8.7%) | 46 (12.3%) |
| $2,500 to $4,999 | 3 (0.7%) | 10 (2.7%) |
| $5,000 to $7,499 | 25 (6.2%) | 17 (4.6%) |
| $7,500 to $9,999 | 25 (6.2%) | 19 (5.1%) |
| $10,000 to $12,499 | 15 (3.7%) | 9 (2.4%) |
| $12,500 to $14,999 | 43 (10.7%) | 10 (2.7%) |
| $15,000 to $17,499 | 30 (7.5%) | 0 (0.0%) |
| $17,500 to $19,999 | 10 (2.5%) | 0 (0.0%) |
| $20,000 to $22,499 | 20 (5.0%) | 17 (4.6%) |
| $22,500 to $24,999 | 24 (6.0%) | 38 (10.2%) |
| $25,000 to $29,999 | 10 (2.5%) | 0 (0.0%) |
| $30,000 to $34,999 | 29 (7.2%) | 94 (25.2%) |
| $35,000 to $39,999 | 42 (10.5%) | 12 (3.2%) |
| $40,000 to $44,999 | 32 (8.0%) | 0 (0.0%) |
| $45,000 to $49,999 | 8 (2.0%) | 27 (7.2%) |
| $50,000 to $54,999 | 0 (0.0%) | 22 (5.9%) |
| $55,000 to $64,999 | 13 (3.2%) | 16 (4.3%) |
| $65,000 to $74,999 | 0 (0.0%) | 14 (3.7%) |
| $75,000 to $99,999 | 24 (6.0%) | 8 (2.1%) |
| $100,000+ | 13 (3.2%) | 14 (3.7%) |
| Total | 401 (100.0%) | 373 (100.0%) |
Earnings by Sex by Educational Attainment in Pablo
Average earnings in Pablo are $34,519 for men and $33,545 for women, a difference of 2.8%. Men with an educational attainment of high school diploma enjoy the highest average annual earnings of $39,034, while those with college or associate's degree education earn the least with $28,125. Women with an educational attainment of bachelor's degree earn the most with the average annual earnings of $38,542, while those with college or associate's degree education have the smallest earnings of $24,342.
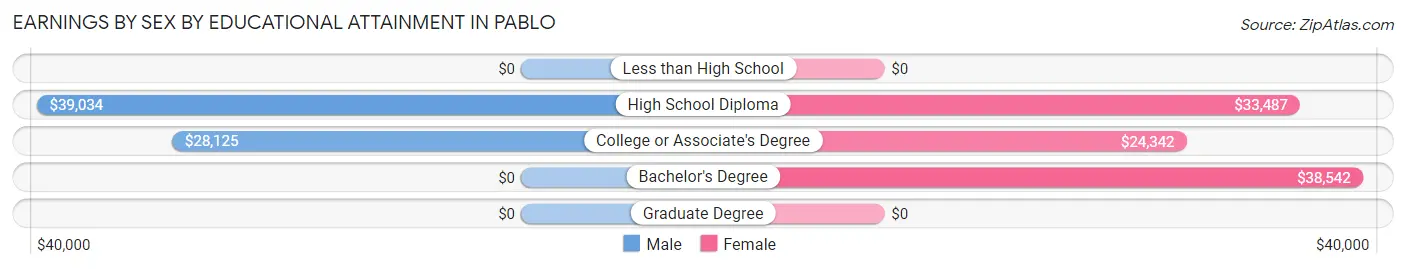
| Educational Attainment | Male Income | Female Income |
| Less than High School | - | - |
| High School Diploma | $39,034 | $33,487 |
| College or Associate's Degree | $28,125 | $24,342 |
| Bachelor's Degree | - | - |
| Graduate Degree | - | - |
| Total | $34,519 | $33,545 |
Family Income in Pablo
Family Income Brackets in Pablo
According to the Pablo family income data, there are 99 families falling into the less than $10,000 income range, which is the most common income bracket and makes up 23.7% of all families.
| Income Bracket | # Families | % Families |
| Less than $10,000 | 99 | 23.7% |
| $10,000 to $14,999 | 19 | 4.5% |
| $15,000 to $24,999 | 28 | 6.7% |
| $25,000 to $34,999 | 57 | 13.6% |
| $35,000 to $49,999 | 51 | 12.2% |
| $50,000 to $74,999 | 84 | 20.1% |
| $75,000 to $99,999 | 47 | 11.2% |
| $100,000 to $149,999 | 33 | 7.9% |
| $150,000 to $199,999 | 0 | 0.0% |
| $200,000+ | 0 | 0.0% |
Family Income by Famaliy Size in Pablo
2-person families (179 | 42.8%) account for the highest median family income in Pablo with $51,023 per family, while 2-person families (179 | 42.8%) have the highest median income of $25,512 per family member.
| Income Bracket | # Families | Median Income |
| 2-Person Families | 179 (42.8%) | $51,023 |
| 3-Person Families | 159 (38.0%) | $0 |
| 4-Person Families | 13 (3.1%) | $0 |
| 5-Person Families | 43 (10.3%) | $23,698 |
| 6-Person Families | 9 (2.1%) | $0 |
| 7+ Person Families | 15 (3.6%) | $0 |
| Total | 418 (100.0%) | $36,500 |
Family Income by Number of Earners in Pablo
| Number of Earners | # Families | Median Income |
| No Earners | 121 (28.9%) | $2,499 |
| 1 Earner | 173 (41.4%) | $35,125 |
| 2 Earners | 101 (24.2%) | $74,306 |
| 3+ Earners | 23 (5.5%) | $0 |
| Total | 418 (100.0%) | $36,500 |
Household Income in Pablo
Household Income Brackets in Pablo
With 149 households falling in the category, the less than $10,000 income range is the most frequent in Pablo, accounting for 22.9% of all households.
| Income Bracket | # Households | % Households |
| Less than $10,000 | 149 | 22.9% |
| $10,000 to $14,999 | 37 | 5.7% |
| $15,000 to $24,999 | 86 | 13.2% |
| $25,000 to $34,999 | 51 | 7.8% |
| $35,000 to $49,999 | 112 | 17.2% |
| $50,000 to $74,999 | 101 | 15.5% |
| $75,000 to $99,999 | 47 | 7.2% |
| $100,000 to $149,999 | 55 | 8.4% |
| $150,000 to $199,999 | 0 | 0.0% |
| $200,000+ | 14 | 2.1% |
Household Income by Householder Age in Pablo
The median household income in Pablo is $35,395, with the highest median household income of $38,720 found in the 25 to 44 years age bracket for the primary householder. A total of 248 households (38.0%) fall into this category. Meanwhile, the 15 to 24 years age bracket for the primary householder has the lowest median household income of $0, with 49 households (7.5%) in this group.
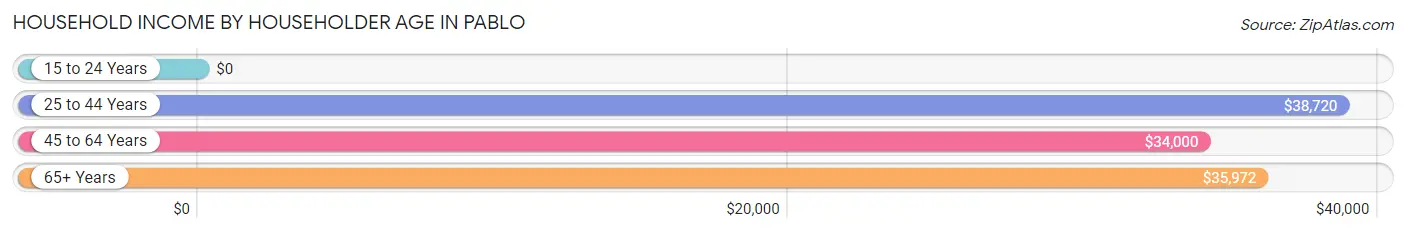
| Income Bracket | # Households | Median Income |
| 15 to 24 Years | 49 (7.5%) | $0 |
| 25 to 44 Years | 248 (38.0%) | $38,720 |
| 45 to 64 Years | 178 (27.3%) | $34,000 |
| 65+ Years | 177 (27.2%) | $35,972 |
| Total | 652 (100.0%) | $35,395 |
Poverty in Pablo
Income Below Poverty by Sex and Age in Pablo
With 39.9% poverty level for males and 38.0% for females among the residents of Pablo, 15 year old males and 6 to 11 year old females are the most vulnerable to poverty, with 29 males (100.0%) and 77 females (63.6%) in their respective age groups living below the poverty level.
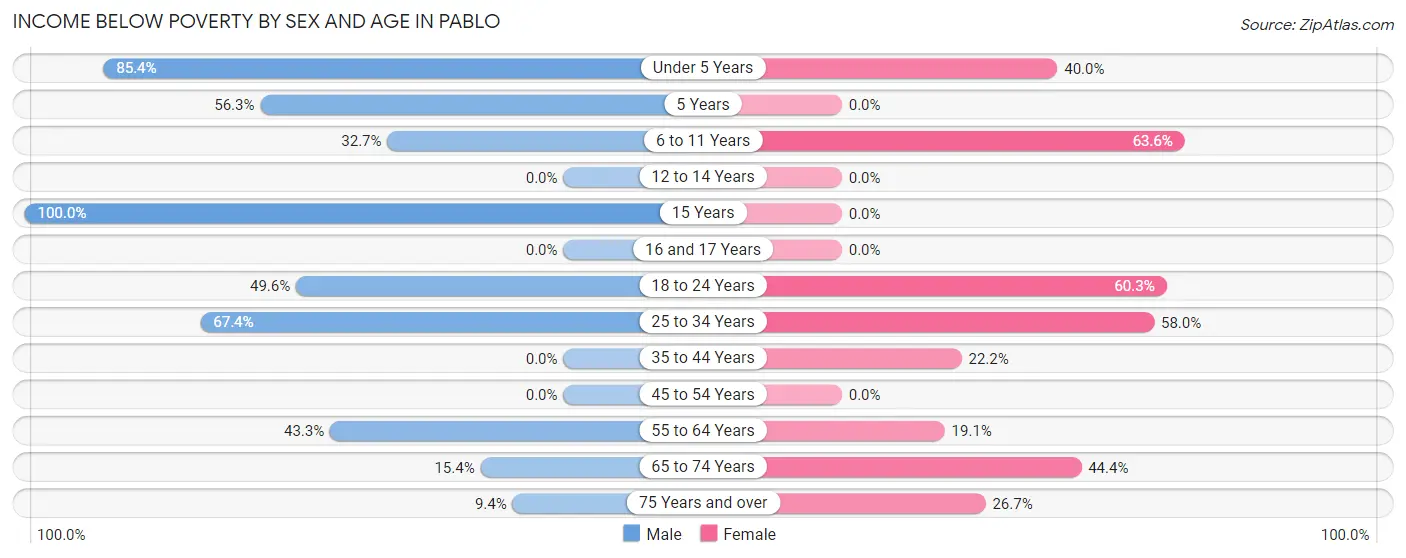
| Age Bracket | Male | Female |
| Under 5 Years | 70 (85.4%) | 40 (40.0%) |
| 5 Years | 18 (56.2%) | 0 (0.0%) |
| 6 to 11 Years | 33 (32.7%) | 77 (63.6%) |
| 12 to 14 Years | 0 (0.0%) | 0 (0.0%) |
| 15 Years | 29 (100.0%) | 0 (0.0%) |
| 16 and 17 Years | 0 (0.0%) | 0 (0.0%) |
| 18 to 24 Years | 65 (49.6%) | 47 (60.3%) |
| 25 to 34 Years | 64 (67.4%) | 91 (58.0%) |
| 35 to 44 Years | 0 (0.0%) | 28 (22.2%) |
| 45 to 54 Years | 0 (0.0%) | 0 (0.0%) |
| 55 to 64 Years | 42 (43.3%) | 21 (19.1%) |
| 65 to 74 Years | 14 (15.4%) | 12 (44.4%) |
| 75 Years and over | 5 (9.4%) | 20 (26.7%) |
| Total | 340 (39.9%) | 336 (38.0%) |
Income Above Poverty by Sex and Age in Pablo
According to the poverty statistics in Pablo, males aged 12 to 14 years and females aged 12 to 14 years are the age groups that are most secure financially, with 100.0% of males and 100.0% of females in these age groups living above the poverty line.
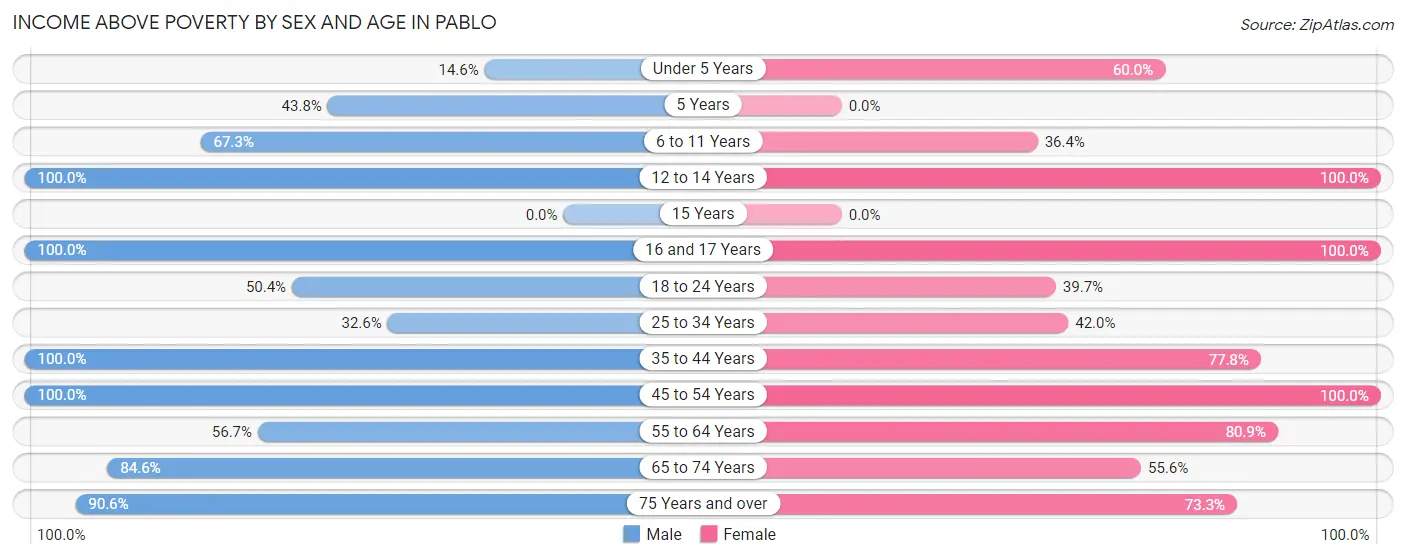
| Age Bracket | Male | Female |
| Under 5 Years | 12 (14.6%) | 60 (60.0%) |
| 5 Years | 14 (43.8%) | 0 (0.0%) |
| 6 to 11 Years | 68 (67.3%) | 44 (36.4%) |
| 12 to 14 Years | 9 (100.0%) | 29 (100.0%) |
| 15 Years | 0 (0.0%) | 0 (0.0%) |
| 16 and 17 Years | 9 (100.0%) | 26 (100.0%) |
| 18 to 24 Years | 66 (50.4%) | 31 (39.7%) |
| 25 to 34 Years | 31 (32.6%) | 66 (42.0%) |
| 35 to 44 Years | 78 (100.0%) | 98 (77.8%) |
| 45 to 54 Years | 46 (100.0%) | 36 (100.0%) |
| 55 to 64 Years | 55 (56.7%) | 89 (80.9%) |
| 65 to 74 Years | 77 (84.6%) | 15 (55.6%) |
| 75 Years and over | 48 (90.6%) | 55 (73.3%) |
| Total | 513 (60.1%) | 549 (62.0%) |
Income Below Poverty Among Married-Couple Families in Pablo
The poverty statistics for married-couple families in Pablo show that 19.6% or 30 of the total 153 families live below the poverty line. Families with 1 or 2 children have the highest poverty rate of 44.7%, comprising of 21 families. On the other hand, families with no children have the lowest poverty rate of 8.5%, which includes 9 families.
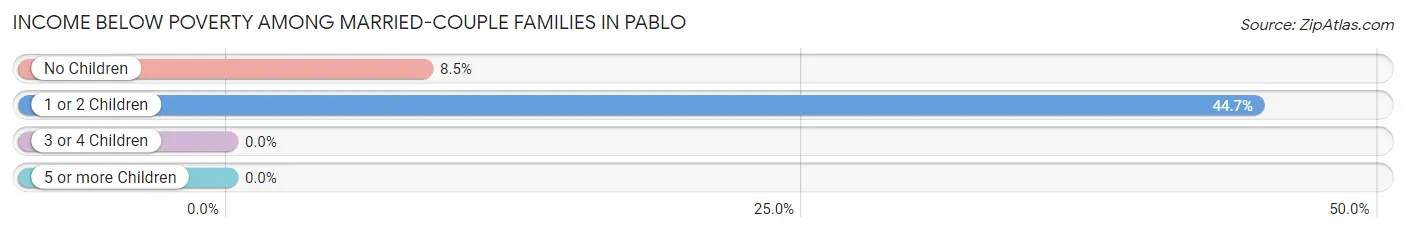
| Children | Above Poverty | Below Poverty |
| No Children | 97 (91.5%) | 9 (8.5%) |
| 1 or 2 Children | 26 (55.3%) | 21 (44.7%) |
| 3 or 4 Children | 0 (0.0%) | 0 (0.0%) |
| 5 or more Children | 0 (0.0%) | 0 (0.0%) |
| Total | 123 (80.4%) | 30 (19.6%) |
Income Below Poverty Among Single-Parent Households in Pablo
According to the poverty data in Pablo, 18.6% or 13 single-father households and 52.8% or 103 single-mother households are living below the poverty line. Among single-father households, those with 5 or more children have the highest poverty rate, with 4 households (100.0%) experiencing poverty. Likewise, among single-mother households, those with no children have the highest poverty rate, with 12 households (100.0%) falling below the poverty line.
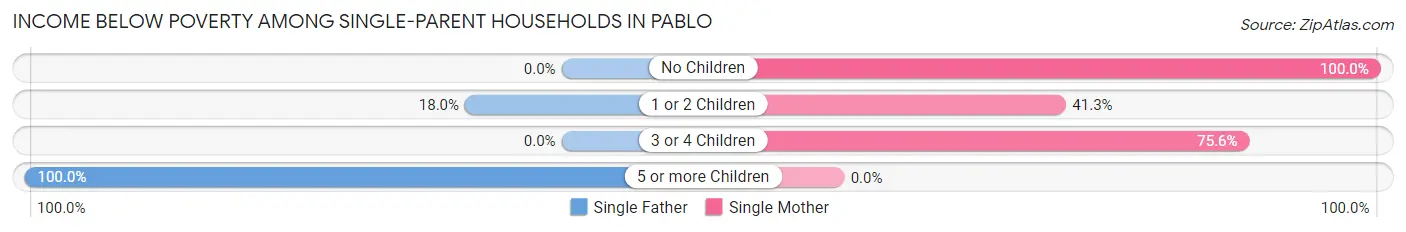
| Children | Single Father | Single Mother |
| No Children | 0 (0.0%) | 12 (100.0%) |
| 1 or 2 Children | 9 (18.0%) | 57 (41.3%) |
| 3 or 4 Children | 0 (0.0%) | 34 (75.6%) |
| 5 or more Children | 4 (100.0%) | 0 (0.0%) |
| Total | 13 (18.6%) | 103 (52.8%) |
Income Below Poverty Among Married-Couple vs Single-Parent Households in Pablo
The poverty data for Pablo shows that 30 of the married-couple family households (19.6%) and 116 of the single-parent households (43.8%) are living below the poverty level. Within the married-couple family households, those with 1 or 2 children have the highest poverty rate, with 21 households (44.7%) falling below the poverty line. Among the single-parent households, those with 5 or more children have the highest poverty rate, with 4 household (100.0%) living below poverty.
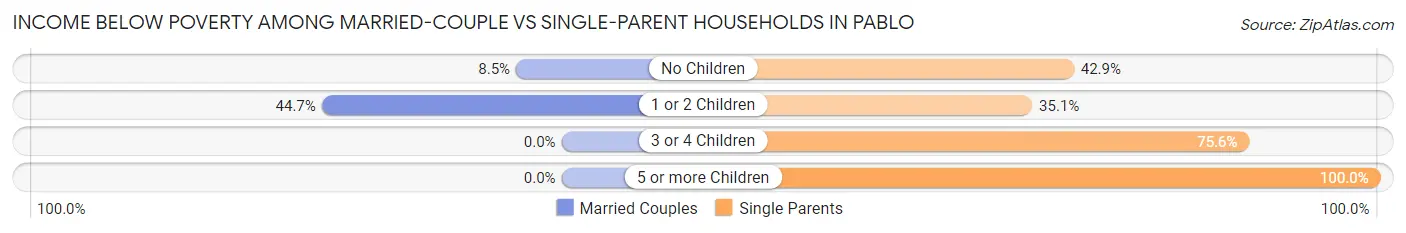
| Children | Married-Couple Families | Single-Parent Households |
| No Children | 9 (8.5%) | 12 (42.9%) |
| 1 or 2 Children | 21 (44.7%) | 66 (35.1%) |
| 3 or 4 Children | 0 (0.0%) | 34 (75.6%) |
| 5 or more Children | 0 (0.0%) | 4 (100.0%) |
| Total | 30 (19.6%) | 116 (43.8%) |
Race in Pablo
The most populous races in Pablo are Native / Alaskan (779 | 43.3%), White / Caucasian (753 | 41.9%), and Two or more Races (237 | 13.2%).
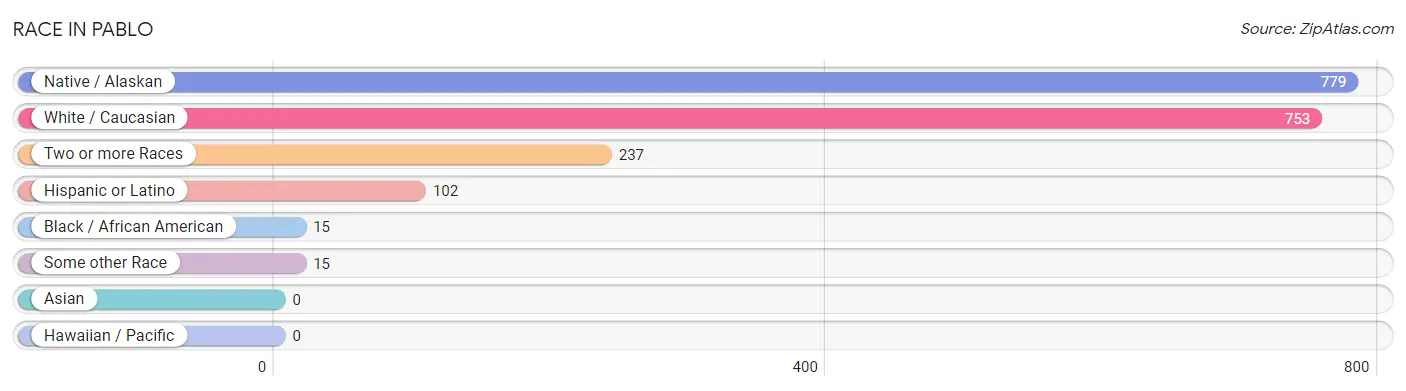
| Race | # Population | % Population |
| Asian | 0 | 0.0% |
| Black / African American | 15 | 0.8% |
| Hawaiian / Pacific | 0 | 0.0% |
| Hispanic or Latino | 102 | 5.7% |
| Native / Alaskan | 779 | 43.3% |
| White / Caucasian | 753 | 41.9% |
| Two or more Races | 237 | 13.2% |
| Some other Race | 15 | 0.8% |
| Total | 1,799 | 100.0% |
Ancestry in Pablo
The most populous ancestries reported in Pablo are German (325 | 18.1%), Blackfeet (152 | 8.5%), English (135 | 7.5%), American (127 | 7.1%), and Norwegian (109 | 6.1%), together accounting for 47.1% of all Pablo residents.
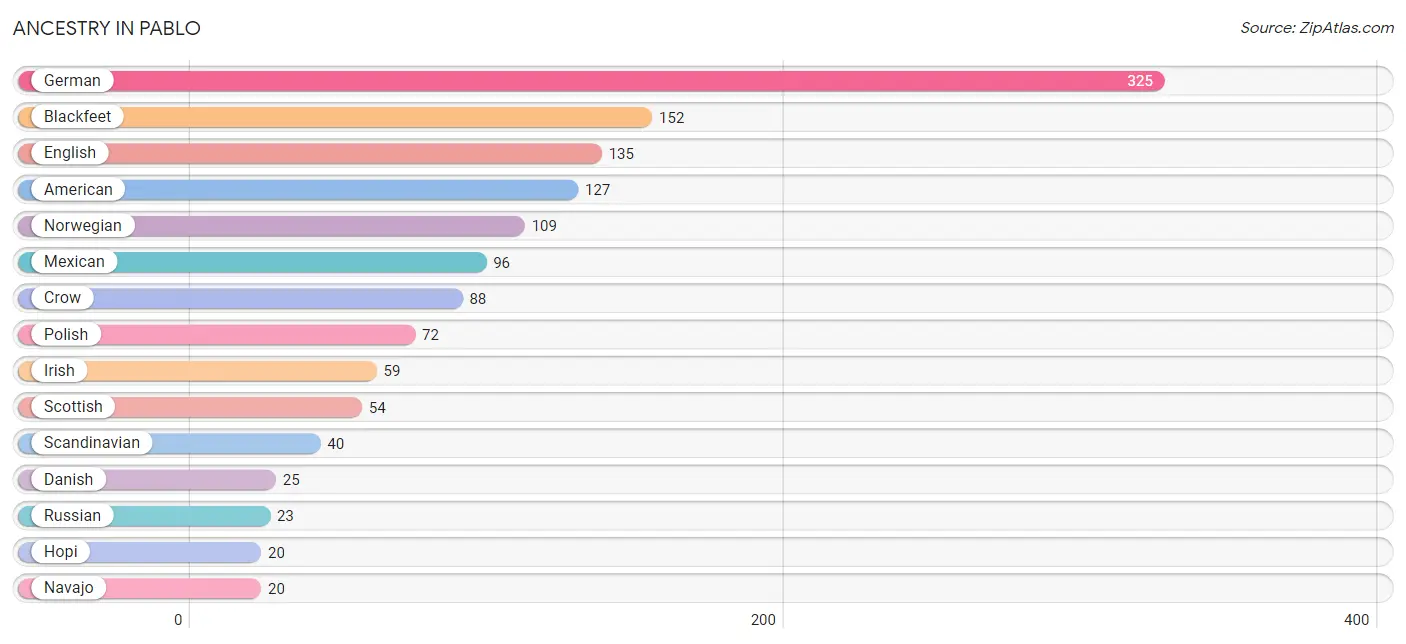
| Ancestry | # Population | % Population |
| African | 18 | 1.0% |
| American | 127 | 7.1% |
| Arapaho | 2 | 0.1% |
| Blackfeet | 152 | 8.5% |
| Canadian | 3 | 0.2% |
| Cherokee | 2 | 0.1% |
| Chippewa | 13 | 0.7% |
| Colville | 1 | 0.1% |
| Crow | 88 | 4.9% |
| Czech | 10 | 0.6% |
| Danish | 25 | 1.4% |
| Dutch | 19 | 1.1% |
| English | 135 | 7.5% |
| European | 16 | 0.9% |
| French | 9 | 0.5% |
| French Canadian | 9 | 0.5% |
| German | 325 | 18.1% |
| Hopi | 20 | 1.1% |
| Irish | 59 | 3.3% |
| Italian | 6 | 0.3% |
| Jamaican | 6 | 0.3% |
| Japanese | 6 | 0.3% |
| Mexican | 96 | 5.3% |
| Navajo | 20 | 1.1% |
| Norwegian | 109 | 6.1% |
| Polish | 72 | 4.0% |
| Pueblo | 20 | 1.1% |
| Puerto Rican | 6 | 0.3% |
| Russian | 23 | 1.3% |
| Scandinavian | 40 | 2.2% |
| Scotch-Irish | 10 | 0.6% |
| Scottish | 54 | 3.0% |
| Sioux | 8 | 0.4% |
| Subsaharan African | 18 | 1.0% |
| Swedish | 11 | 0.6% |
| Swiss | 9 | 0.5% |
| Thai | 2 | 0.1% |
| Tongan | 6 | 0.3% |
| Tsimshian | 3 | 0.2% | View All 39 Rows |
Immigrants in Pablo
The most numerous immigrant groups reported in Pablo came from Australia (9 | 0.5%), Europe (9 | 0.5%), Germany (9 | 0.5%), Oceania (9 | 0.5%), and Western Europe (9 | 0.5%), together accounting for 2.5% of all Pablo residents.
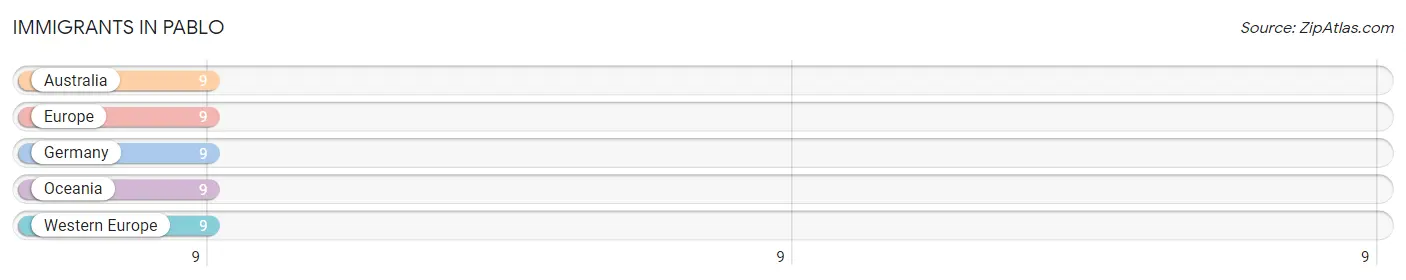
| Immigration Origin | # Population | % Population |
| Australia | 9 | 0.5% |
| Europe | 9 | 0.5% |
| Germany | 9 | 0.5% |
| Oceania | 9 | 0.5% |
| Western Europe | 9 | 0.5% | View All 5 Rows |
Sex and Age in Pablo
Sex and Age in Pablo
The most populous age groups in Pablo are 5 to 9 Years (117 | 13.0%) for men and Under 5 Years (100 | 11.1%) for women.
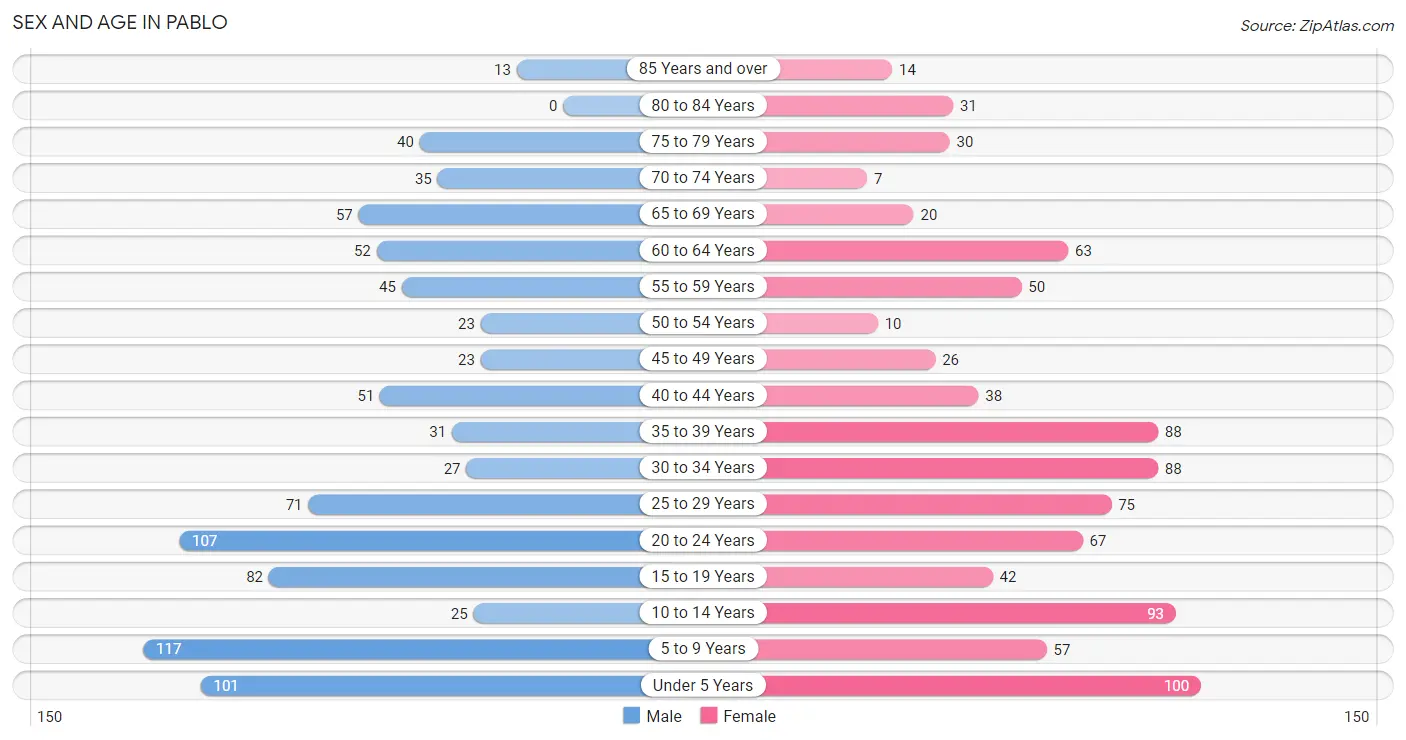
| Age Bracket | Male | Female |
| Under 5 Years | 101 (11.2%) | 100 (11.1%) |
| 5 to 9 Years | 117 (13.0%) | 57 (6.3%) |
| 10 to 14 Years | 25 (2.8%) | 93 (10.3%) |
| 15 to 19 Years | 82 (9.1%) | 42 (4.7%) |
| 20 to 24 Years | 107 (11.9%) | 67 (7.4%) |
| 25 to 29 Years | 71 (7.9%) | 75 (8.3%) |
| 30 to 34 Years | 27 (3.0%) | 88 (9.8%) |
| 35 to 39 Years | 31 (3.4%) | 88 (9.8%) |
| 40 to 44 Years | 51 (5.7%) | 38 (4.2%) |
| 45 to 49 Years | 23 (2.6%) | 26 (2.9%) |
| 50 to 54 Years | 23 (2.6%) | 10 (1.1%) |
| 55 to 59 Years | 45 (5.0%) | 50 (5.6%) |
| 60 to 64 Years | 52 (5.8%) | 63 (7.0%) |
| 65 to 69 Years | 57 (6.3%) | 20 (2.2%) |
| 70 to 74 Years | 35 (3.9%) | 7 (0.8%) |
| 75 to 79 Years | 40 (4.4%) | 30 (3.3%) |
| 80 to 84 Years | 0 (0.0%) | 31 (3.5%) |
| 85 Years and over | 13 (1.4%) | 14 (1.6%) |
| Total | 900 (100.0%) | 899 (100.0%) |
Families and Households in Pablo
Median Family Size in Pablo
The median family size in Pablo is 3.20 persons per family, with single male/father families (70 | 16.8%) accounting for the largest median family size of 4.26 persons per family. On the other hand, married-couple families (153 | 36.6%) represent the smallest median family size with 2.70 persons per family.
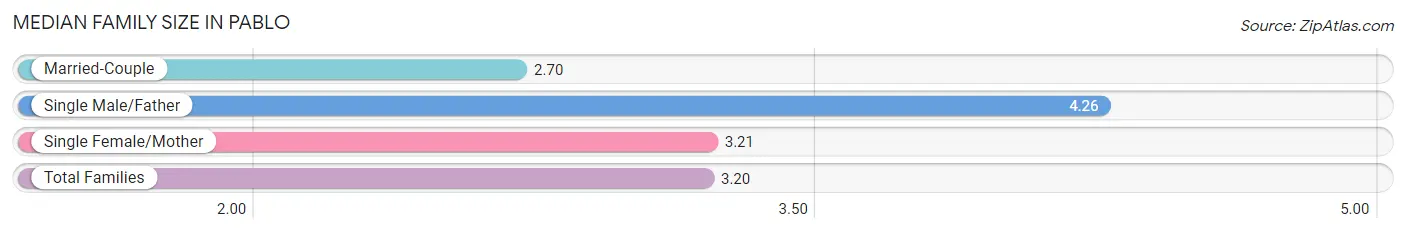
| Family Type | # Families | Family Size |
| Married-Couple | 153 (36.6%) | 2.70 |
| Single Male/Father | 70 (16.8%) | 4.26 |
| Single Female/Mother | 195 (46.7%) | 3.21 |
| Total Families | 418 (100.0%) | 3.20 |
Median Household Size in Pablo
The median household size in Pablo is 2.68 persons per household, with single male/father households (70 | 10.7%) accounting for the largest median household size of 5.14 persons per household. non-family households (234 | 35.9%) represent the smallest median household size with 1.35 persons per household.
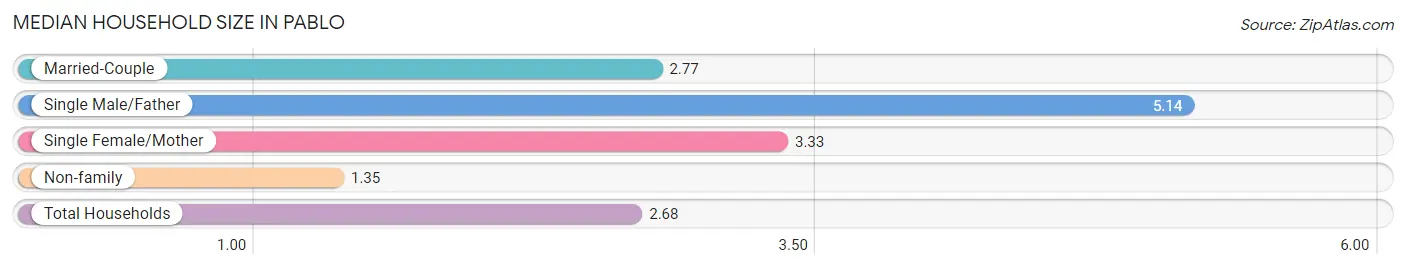
| Household Type | # Households | Household Size |
| Married-Couple | 153 (23.5%) | 2.77 |
| Single Male/Father | 70 (10.7%) | 5.14 |
| Single Female/Mother | 195 (29.9%) | 3.33 |
| Non-family | 234 (35.9%) | 1.35 |
| Total Households | 652 (100.0%) | 2.68 |
Household Size by Marriage Status in Pablo
Out of a total of 652 households in Pablo, 418 (64.1%) are family households, while 234 (35.9%) are nonfamily households. The most numerous type of family households are 3-person households, comprising 181, and the most common type of nonfamily households are 1-person households, comprising 192.
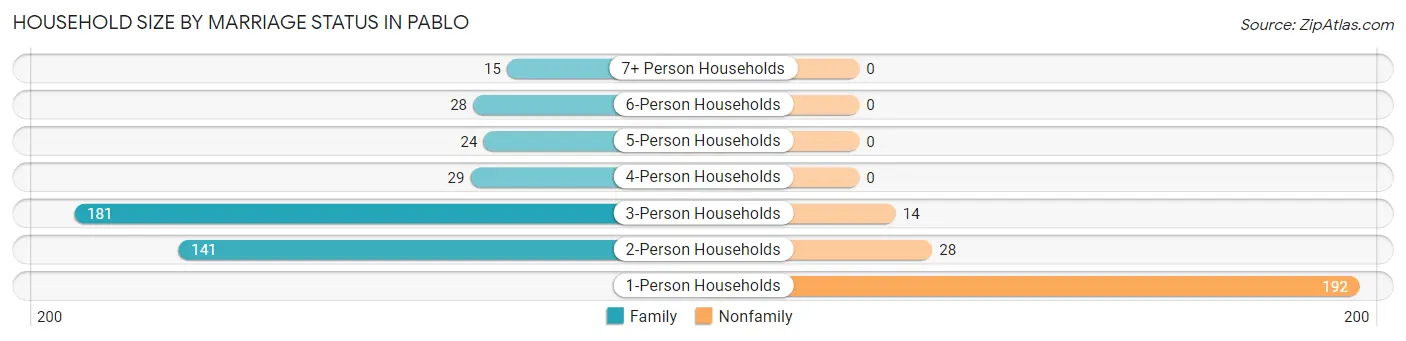
| Household Size | Family Households | Nonfamily Households |
| 1-Person Households | - | 192 (29.4%) |
| 2-Person Households | 141 (21.6%) | 28 (4.3%) |
| 3-Person Households | 181 (27.8%) | 14 (2.1%) |
| 4-Person Households | 29 (4.4%) | 0 (0.0%) |
| 5-Person Households | 24 (3.7%) | 0 (0.0%) |
| 6-Person Households | 28 (4.3%) | 0 (0.0%) |
| 7+ Person Households | 15 (2.3%) | 0 (0.0%) |
| Total | 418 (64.1%) | 234 (35.9%) |
Female Fertility in Pablo
Fertility by Age in Pablo
Average fertility rate in Pablo is 113.0 births per 1,000 women. Women in the age bracket of 20 to 34 years have the highest fertility rate with 209.0 births per 1,000 women. Women in the age bracket of 20 to 34 years acount for 100.0% of all women with births.
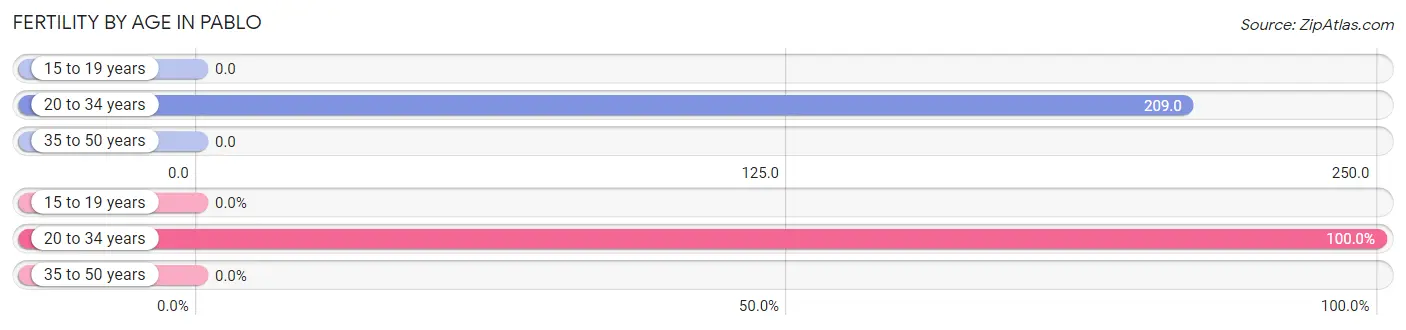
| Age Bracket | Women with Births | Births / 1,000 Women |
| 15 to 19 years | 0 (0.0%) | 0.0 |
| 20 to 34 years | 48 (100.0%) | 209.0 |
| 35 to 50 years | 0 (0.0%) | 0.0 |
| Total | 48 (100.0%) | 113.0 |
Fertility by Age by Marriage Status in Pablo
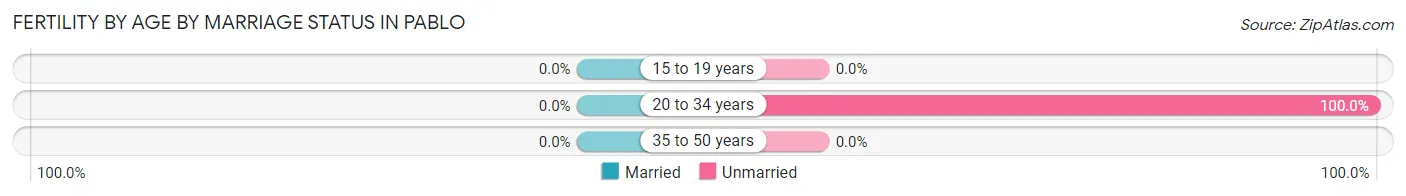
| Age Bracket | Married | Unmarried |
| 15 to 19 years | 0 (0.0%) | 0 (0.0%) |
| 20 to 34 years | 0 (0.0%) | 48 (100.0%) |
| 35 to 50 years | 0 (0.0%) | 0 (0.0%) |
| Total | 0 (0.0%) | 48 (100.0%) |
Fertility by Education in Pablo
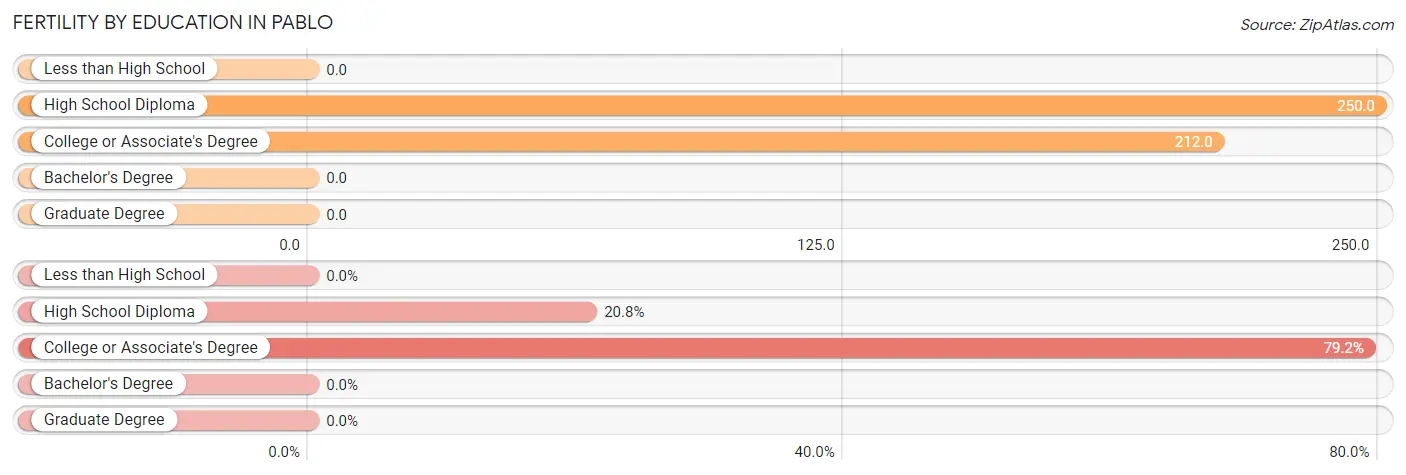
| Educational Attainment | Women with Births | Births / 1,000 Women |
| Less than High School | 0 (0.0%) | 0.0 |
| High School Diploma | 10 (20.8%) | 250.0 |
| College or Associate's Degree | 38 (79.2%) | 212.0 |
| Bachelor's Degree | 0 (0.0%) | 0.0 |
| Graduate Degree | 0 (0.0%) | 0.0 |
| Total | 48 (100.0%) | 113.0 |
Fertility by Education by Marriage Status in Pablo
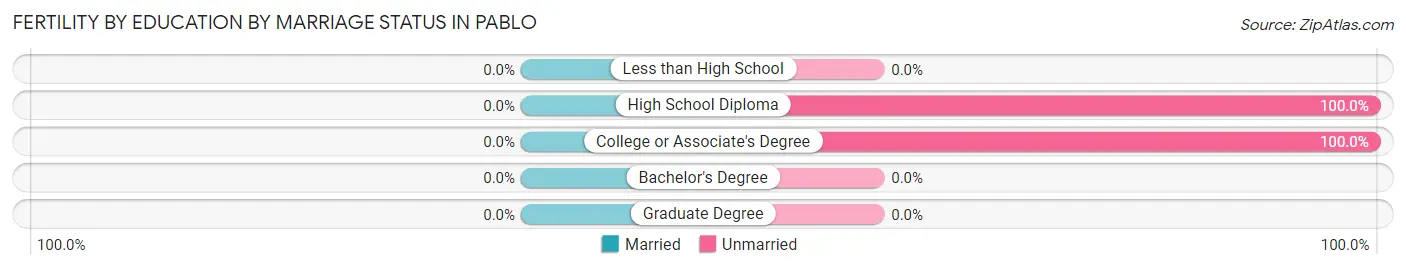
| Educational Attainment | Married | Unmarried |
| Less than High School | 0 (0.0%) | 0 (0.0%) |
| High School Diploma | 0 (0.0%) | 10 (100.0%) |
| College or Associate's Degree | 0 (0.0%) | 38 (100.0%) |
| Bachelor's Degree | 0 (0.0%) | 0 (0.0%) |
| Graduate Degree | 0 (0.0%) | 0 (0.0%) |
| Total | 0 (0.0%) | 48 (100.0%) |
Employment Characteristics in Pablo
Employment by Class of Employer in Pablo
Among the 604 employed individuals in Pablo, private company employees (302 | 50.0%), local government employees (110 | 18.2%), and not-for-profit organizations (75 | 12.4%) make up the most common classes of employment.
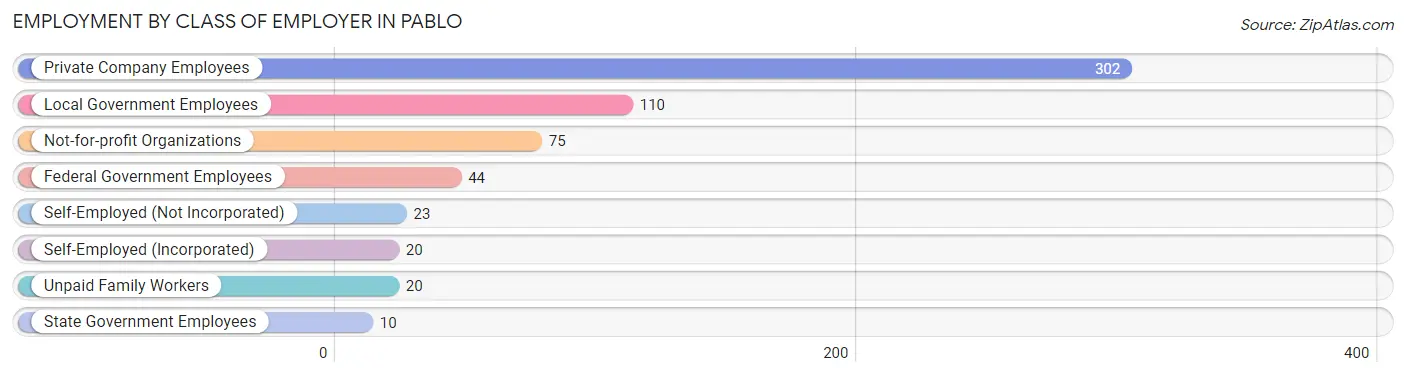
| Employer Class | # Employees | % Employees |
| Private Company Employees | 302 | 50.0% |
| Self-Employed (Incorporated) | 20 | 3.3% |
| Self-Employed (Not Incorporated) | 23 | 3.8% |
| Not-for-profit Organizations | 75 | 12.4% |
| Local Government Employees | 110 | 18.2% |
| State Government Employees | 10 | 1.7% |
| Federal Government Employees | 44 | 7.3% |
| Unpaid Family Workers | 20 | 3.3% |
| Total | 604 | 100.0% |
Employment Status by Age in Pablo
According to the labor force statistics for Pablo, out of the total population over 16 years of age (1,277), 53.2% or 679 individuals are in the labor force, with 8.2% or 56 of them unemployed. The age group with the highest labor force participation rate is 45 to 54 years, with 84.1% or 69 individuals in the labor force. Within the labor force, the 65 to 74 years age range has the highest percentage of unemployed individuals, with 39.4% or 13 of them being unemployed.
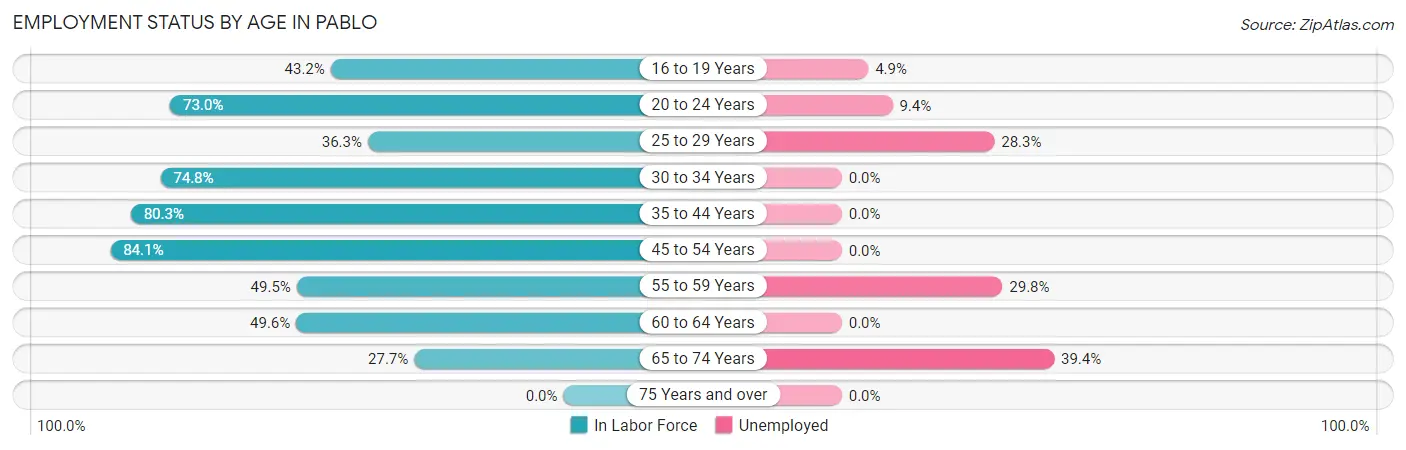
| Age Bracket | In Labor Force | Unemployed |
| 16 to 19 Years | 41 (43.2%) | 2 (4.9%) |
| 20 to 24 Years | 127 (73.0%) | 12 (9.4%) |
| 25 to 29 Years | 53 (36.3%) | 15 (28.3%) |
| 30 to 34 Years | 86 (74.8%) | 0 (0.0%) |
| 35 to 44 Years | 167 (80.3%) | 0 (0.0%) |
| 45 to 54 Years | 69 (84.1%) | 0 (0.0%) |
| 55 to 59 Years | 47 (49.5%) | 14 (29.8%) |
| 60 to 64 Years | 57 (49.6%) | 0 (0.0%) |
| 65 to 74 Years | 33 (27.7%) | 13 (39.4%) |
| 75 Years and over | 0 (0.0%) | 0 (0.0%) |
| Total | 679 (53.2%) | 56 (8.2%) |
Employment Status by Educational Attainment in Pablo
According to labor force statistics for Pablo, 62.9% of individuals (479) out of the total population between 25 and 64 years of age (761) are in the labor force, with 6.1% or 29 of them being unemployed. The group with the highest labor force participation rate are those with the educational attainment of bachelor's degree or higher, with 94.5% or 156 individuals in the labor force. Within the labor force, individuals with high school diploma education have the highest percentage of unemployment, with 10.9% or 14 of them being unemployed.
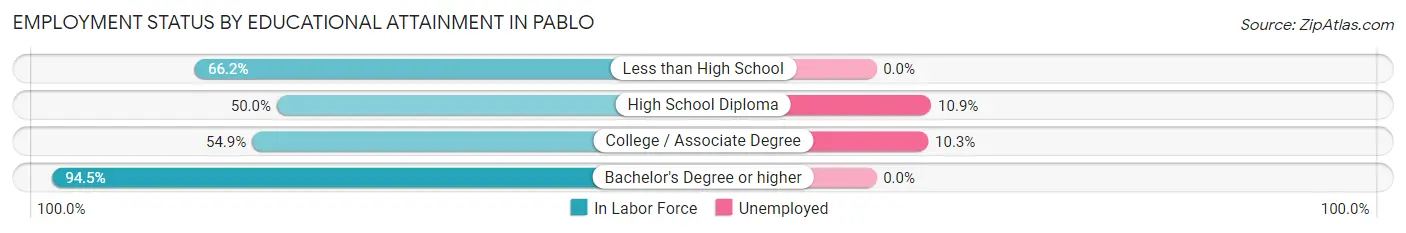
| Educational Attainment | In Labor Force | Unemployed |
| Less than High School | 49 (66.2%) | 0 (0.0%) |
| High School Diploma | 129 (50.0%) | 28 (10.9%) |
| College / Associate Degree | 145 (54.9%) | 27 (10.3%) |
| Bachelor's Degree or higher | 156 (94.5%) | 0 (0.0%) |
| Total | 479 (62.9%) | 46 (6.1%) |
Employment Occupations by Sex in Pablo
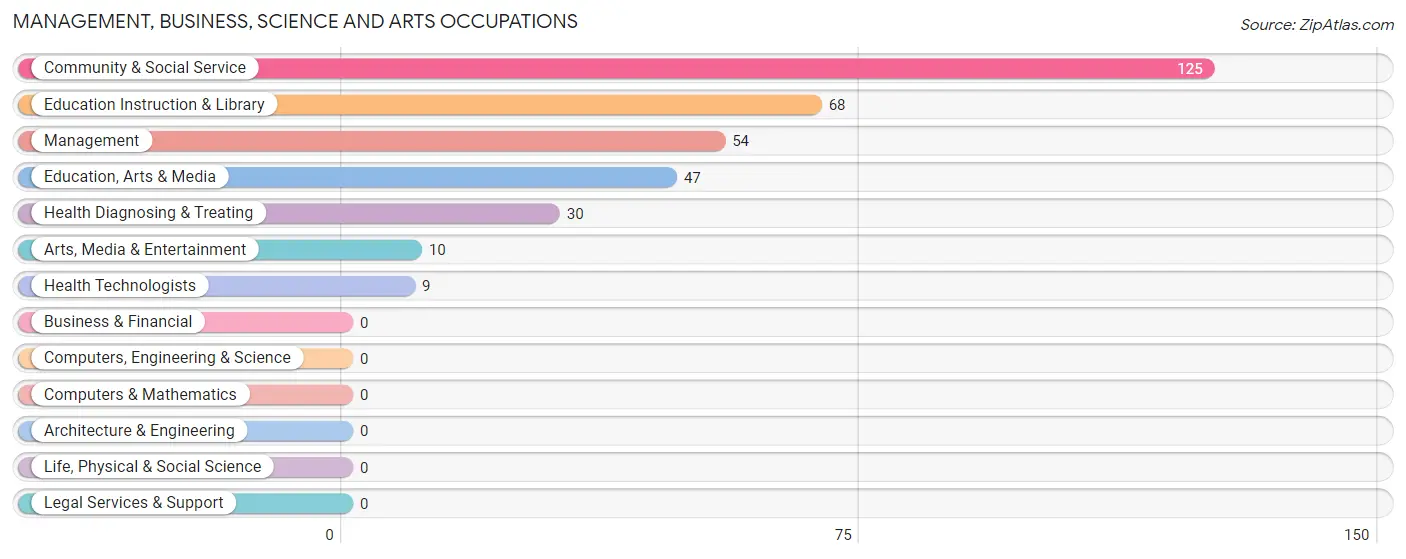
Management, Business, Science and Arts Occupations
The most common Management, Business, Science and Arts occupations in Pablo are Community & Social Service (125 | 20.0%), Education Instruction & Library (68 | 10.9%), Management (54 | 8.6%), Education, Arts & Media (47 | 7.5%), and Health Diagnosing & Treating (30 | 4.8%).
Management, Business, Science and Arts Occupations by Sex
Within the Management, Business, Science and Arts occupations in Pablo, the most male-oriented occupations are Arts, Media & Entertainment (100.0%), Management (24.1%), and Community & Social Service (8.0%), while the most female-oriented occupations are Education, Arts & Media (100.0%), Education Instruction & Library (100.0%), and Health Diagnosing & Treating (100.0%).
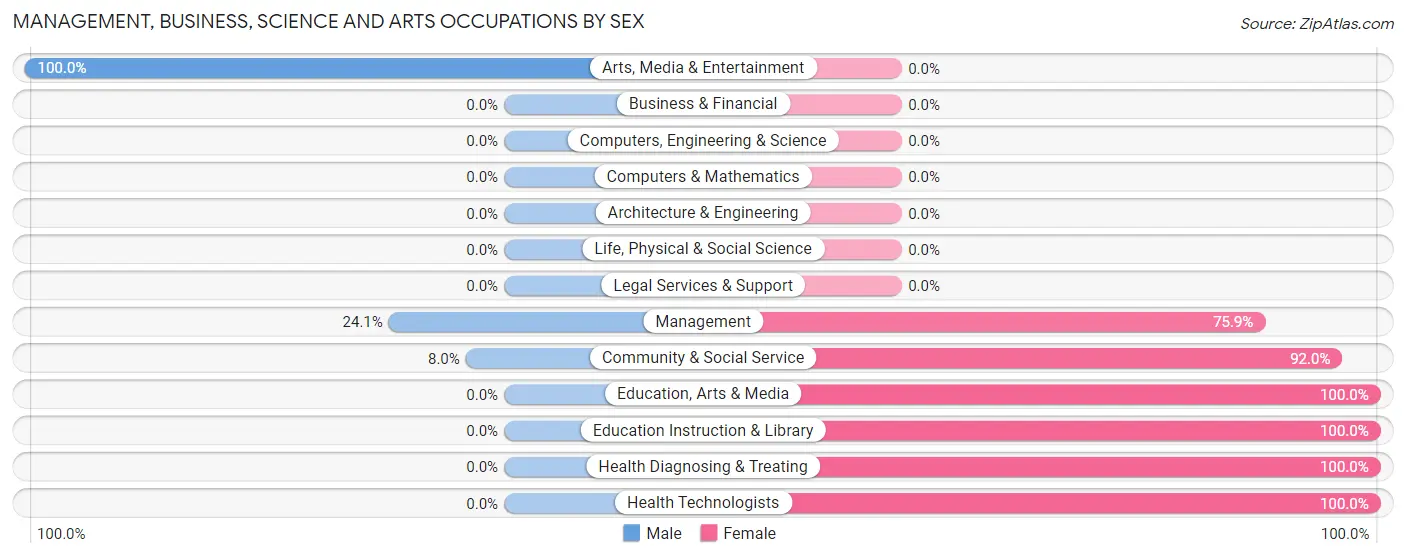
| Occupation | Male | Female |
| Management | 13 (24.1%) | 41 (75.9%) |
| Business & Financial | 0 (0.0%) | 0 (0.0%) |
| Computers, Engineering & Science | 0 (0.0%) | 0 (0.0%) |
| Computers & Mathematics | 0 (0.0%) | 0 (0.0%) |
| Architecture & Engineering | 0 (0.0%) | 0 (0.0%) |
| Life, Physical & Social Science | 0 (0.0%) | 0 (0.0%) |
| Community & Social Service | 10 (8.0%) | 115 (92.0%) |
| Education, Arts & Media | 0 (0.0%) | 47 (100.0%) |
| Legal Services & Support | 0 (0.0%) | 0 (0.0%) |
| Education Instruction & Library | 0 (0.0%) | 68 (100.0%) |
| Arts, Media & Entertainment | 10 (100.0%) | 0 (0.0%) |
| Health Diagnosing & Treating | 0 (0.0%) | 30 (100.0%) |
| Health Technologists | 0 (0.0%) | 9 (100.0%) |
| Total (Category) | 23 (11.0%) | 186 (89.0%) |
| Total (Overall) | 297 (47.6%) | 327 (52.4%) |
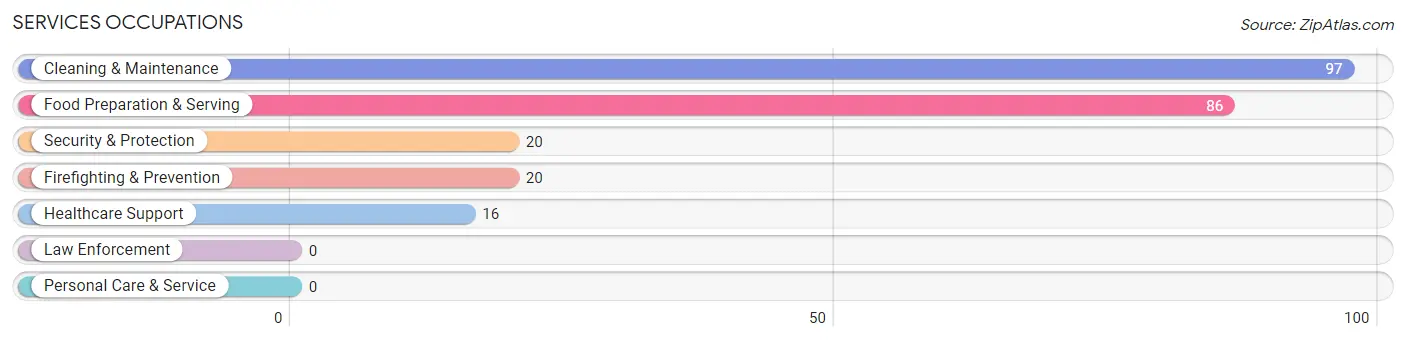
Services Occupations
The most common Services occupations in Pablo are Cleaning & Maintenance (97 | 15.5%), Food Preparation & Serving (86 | 13.8%), Security & Protection (20 | 3.2%), Firefighting & Prevention (20 | 3.2%), and Healthcare Support (16 | 2.6%).
Services Occupations by Sex
Within the Services occupations in Pablo, the most male-oriented occupations are Security & Protection (100.0%), Firefighting & Prevention (100.0%), and Cleaning & Maintenance (72.2%), while the most female-oriented occupations are Healthcare Support (50.0%), Food Preparation & Serving (37.2%), and Cleaning & Maintenance (27.8%).
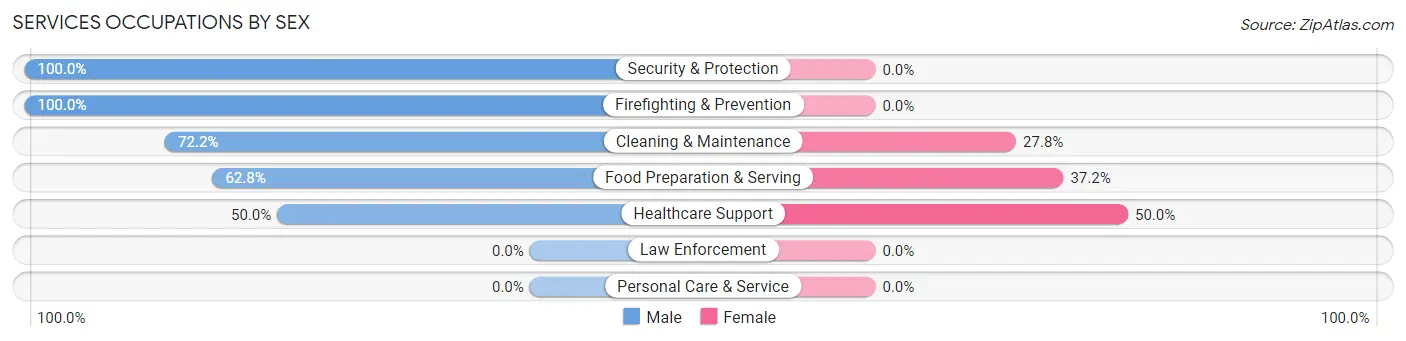
| Occupation | Male | Female |
| Healthcare Support | 8 (50.0%) | 8 (50.0%) |
| Security & Protection | 20 (100.0%) | 0 (0.0%) |
| Firefighting & Prevention | 20 (100.0%) | 0 (0.0%) |
| Law Enforcement | 0 (0.0%) | 0 (0.0%) |
| Food Preparation & Serving | 54 (62.8%) | 32 (37.2%) |
| Cleaning & Maintenance | 70 (72.2%) | 27 (27.8%) |
| Personal Care & Service | 0 (0.0%) | 0 (0.0%) |
| Total (Category) | 152 (69.4%) | 67 (30.6%) |
| Total (Overall) | 297 (47.6%) | 327 (52.4%) |
Sales and Office Occupations
The most common Sales and Office occupations in Pablo are Office & Administration (94 | 15.1%), and Sales & Related (10 | 1.6%).
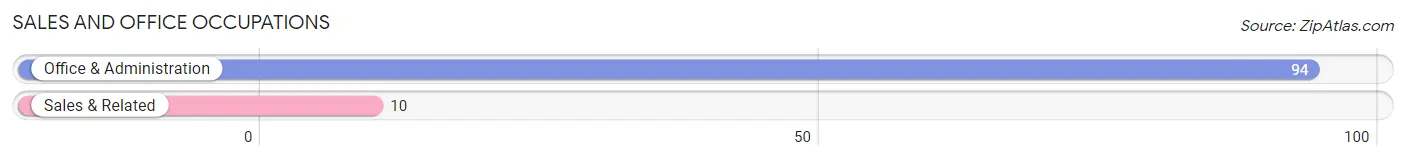
Sales and Office Occupations by Sex

| Occupation | Male | Female |
| Sales & Related | 0 (0.0%) | 10 (100.0%) |
| Office & Administration | 30 (31.9%) | 64 (68.1%) |
| Total (Category) | 30 (28.8%) | 74 (71.2%) |
| Total (Overall) | 297 (47.6%) | 327 (52.4%) |
Natural Resources, Construction and Maintenance Occupations
The most common Natural Resources, Construction and Maintenance occupations in Pablo are Installation, Maintenance & Repair (12 | 1.9%), and Construction & Extraction (11 | 1.8%).
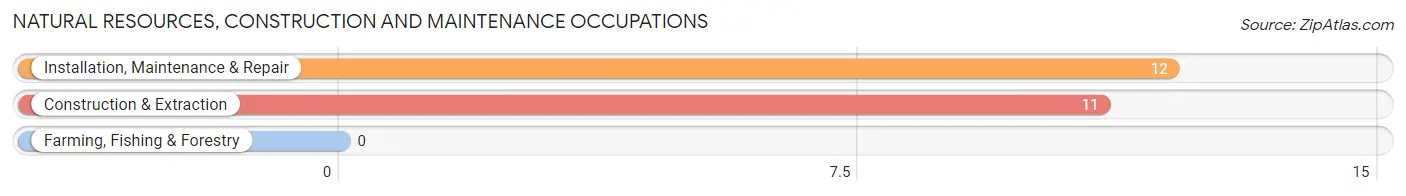
Natural Resources, Construction and Maintenance Occupations by Sex
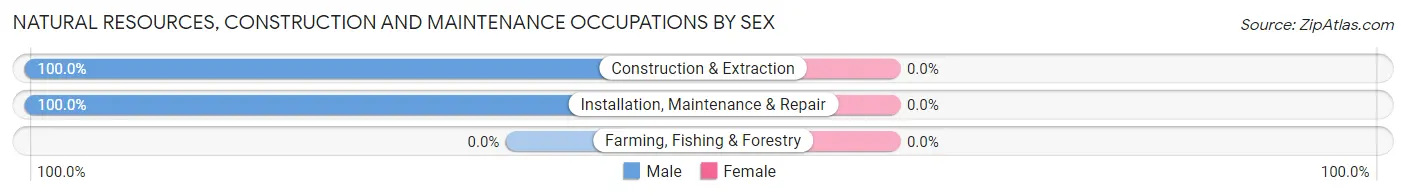
| Occupation | Male | Female |
| Farming, Fishing & Forestry | 0 (0.0%) | 0 (0.0%) |
| Construction & Extraction | 11 (100.0%) | 0 (0.0%) |
| Installation, Maintenance & Repair | 12 (100.0%) | 0 (0.0%) |
| Total (Category) | 23 (100.0%) | 0 (0.0%) |
| Total (Overall) | 297 (47.6%) | 327 (52.4%) |
Production, Transportation and Moving Occupations
The most common Production, Transportation and Moving occupations in Pablo are Production (53 | 8.5%), and Transportation (16 | 2.6%).
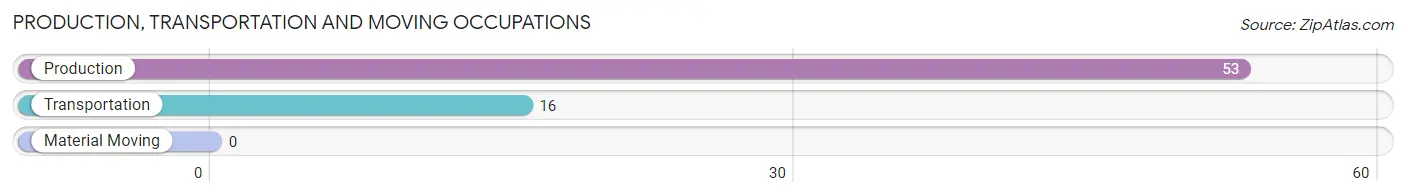
Production, Transportation and Moving Occupations by Sex
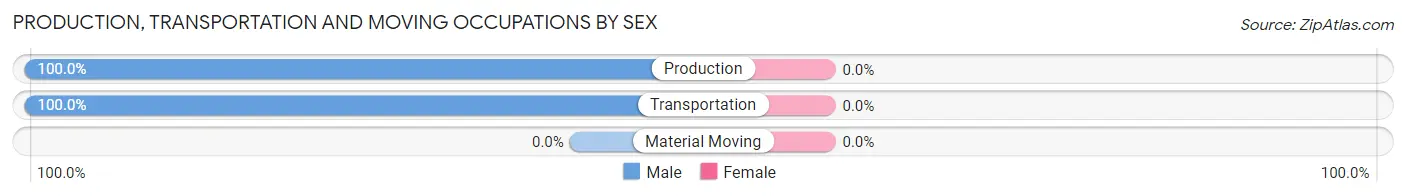
| Occupation | Male | Female |
| Production | 53 (100.0%) | 0 (0.0%) |
| Transportation | 16 (100.0%) | 0 (0.0%) |
| Material Moving | 0 (0.0%) | 0 (0.0%) |
| Total (Category) | 69 (100.0%) | 0 (0.0%) |
| Total (Overall) | 297 (47.6%) | 327 (52.4%) |
Employment Industries by Sex in Pablo
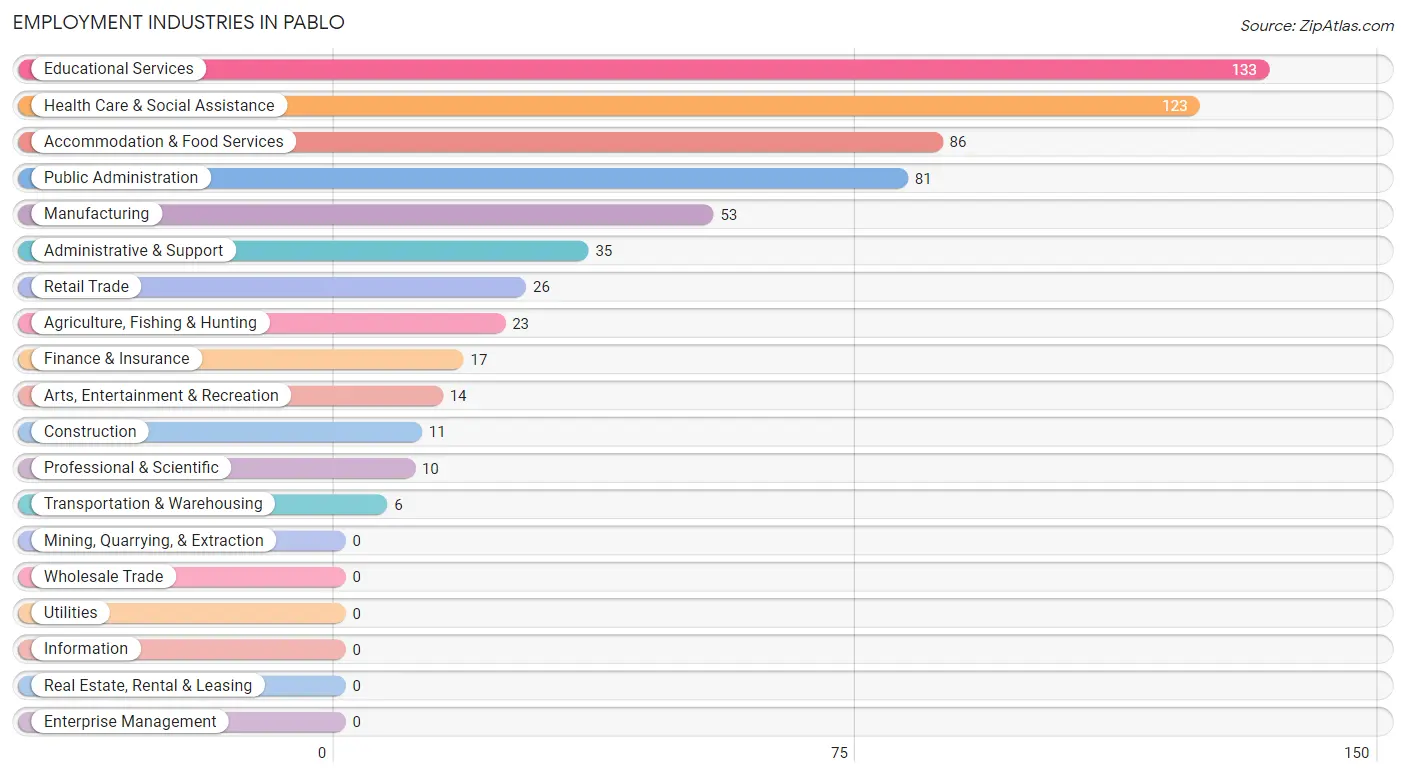
Employment Industries in Pablo
The major employment industries in Pablo include Educational Services (133 | 21.3%), Health Care & Social Assistance (123 | 19.7%), Accommodation & Food Services (86 | 13.8%), Public Administration (81 | 13.0%), and Manufacturing (53 | 8.5%).
Employment Industries by Sex in Pablo
The Pablo industries that see more men than women are Agriculture, Fishing & Hunting (100.0%), Construction (100.0%), and Manufacturing (100.0%), whereas the industries that tend to have a higher number of women are Finance & Insurance (100.0%), Arts, Entertainment & Recreation (100.0%), and Public Administration (79.0%).
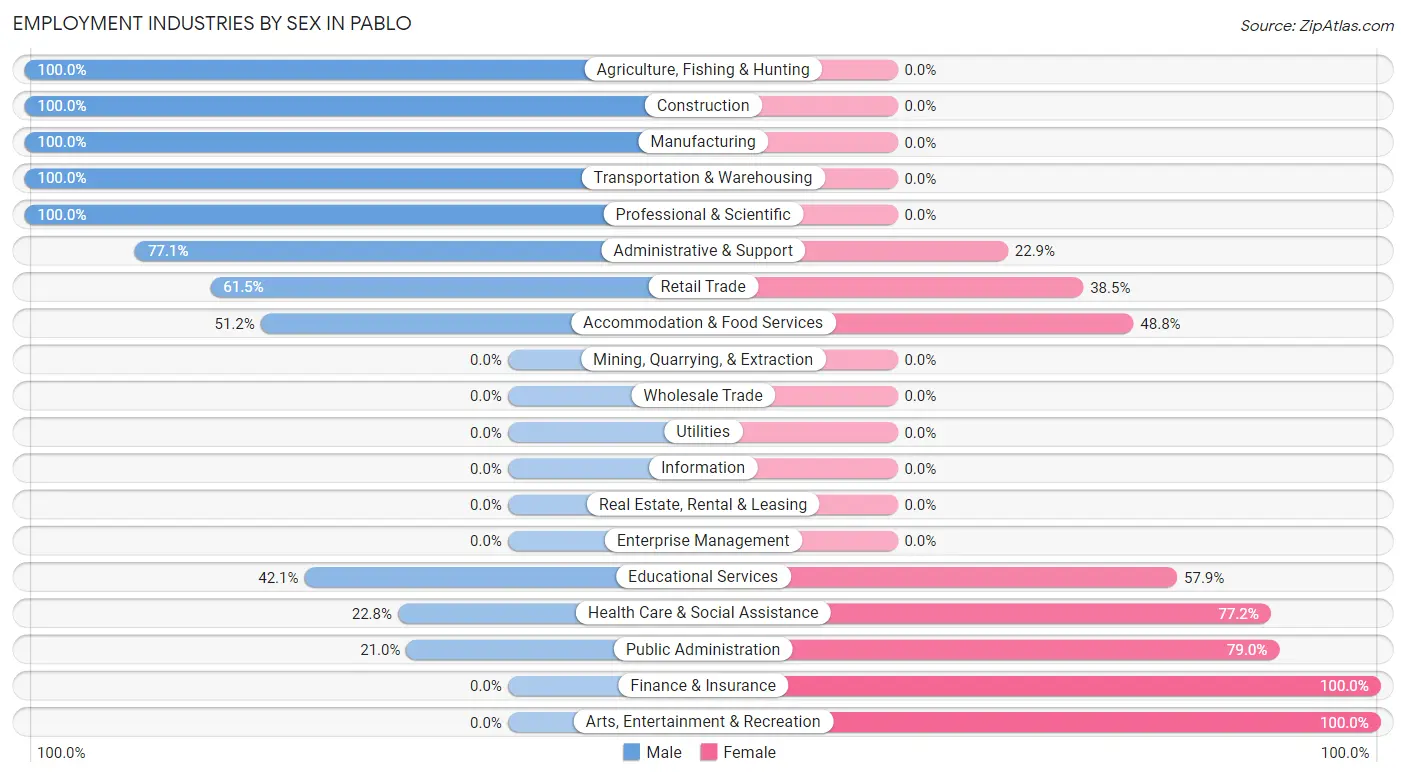
| Industry | Male | Female |
| Agriculture, Fishing & Hunting | 23 (100.0%) | 0 (0.0%) |
| Mining, Quarrying, & Extraction | 0 (0.0%) | 0 (0.0%) |
| Construction | 11 (100.0%) | 0 (0.0%) |
| Manufacturing | 53 (100.0%) | 0 (0.0%) |
| Wholesale Trade | 0 (0.0%) | 0 (0.0%) |
| Retail Trade | 16 (61.5%) | 10 (38.5%) |
| Transportation & Warehousing | 6 (100.0%) | 0 (0.0%) |
| Utilities | 0 (0.0%) | 0 (0.0%) |
| Information | 0 (0.0%) | 0 (0.0%) |
| Finance & Insurance | 0 (0.0%) | 17 (100.0%) |
| Real Estate, Rental & Leasing | 0 (0.0%) | 0 (0.0%) |
| Professional & Scientific | 10 (100.0%) | 0 (0.0%) |
| Enterprise Management | 0 (0.0%) | 0 (0.0%) |
| Administrative & Support | 27 (77.1%) | 8 (22.9%) |
| Educational Services | 56 (42.1%) | 77 (57.9%) |
| Health Care & Social Assistance | 28 (22.8%) | 95 (77.2%) |
| Arts, Entertainment & Recreation | 0 (0.0%) | 14 (100.0%) |
| Accommodation & Food Services | 44 (51.2%) | 42 (48.8%) |
| Public Administration | 17 (21.0%) | 64 (79.0%) |
| Total | 297 (47.6%) | 327 (52.4%) |
Education in Pablo
School Enrollment in Pablo
The most common levels of schooling among the 584 students in Pablo are college / undergraduate (183 | 31.3%), middle school (97 | 16.6%), and elementary school (93 | 15.9%).
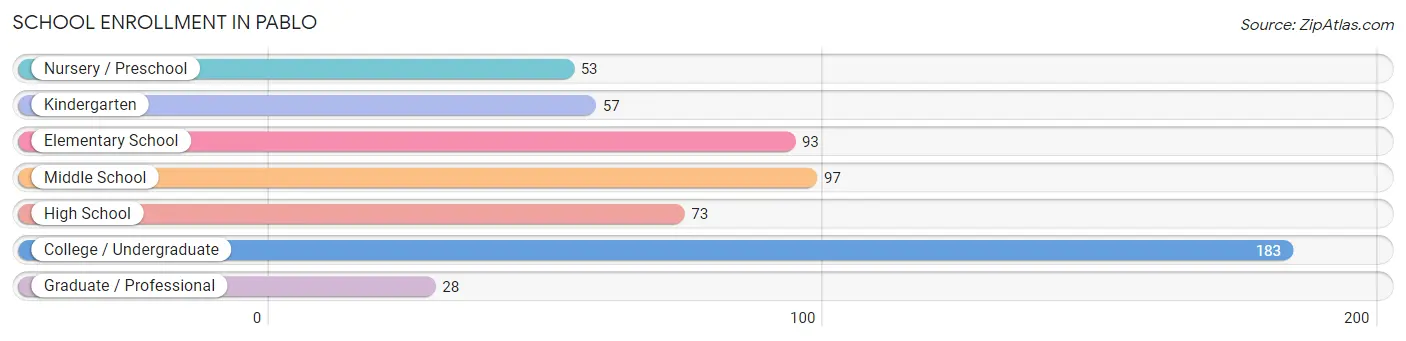
| School Level | # Students | % Students |
| Nursery / Preschool | 53 | 9.1% |
| Kindergarten | 57 | 9.8% |
| Elementary School | 93 | 15.9% |
| Middle School | 97 | 16.6% |
| High School | 73 | 12.5% |
| College / Undergraduate | 183 | 31.3% |
| Graduate / Professional | 28 | 4.8% |
| Total | 584 | 100.0% |
School Enrollment by Age by Funding Source in Pablo
Out of a total of 584 students who are enrolled in schools in Pablo, 149 (25.5%) attend a private institution, while the remaining 435 (74.5%) are enrolled in public schools. The age group of 35 years and over has the highest likelihood of being enrolled in private schools, with 24 (57.1% in the age bracket) enrolled. Conversely, the age group of 3 to 4 year olds has the lowest likelihood of being enrolled in a private school, with 35 (100.0% in the age bracket) attending a public institution.
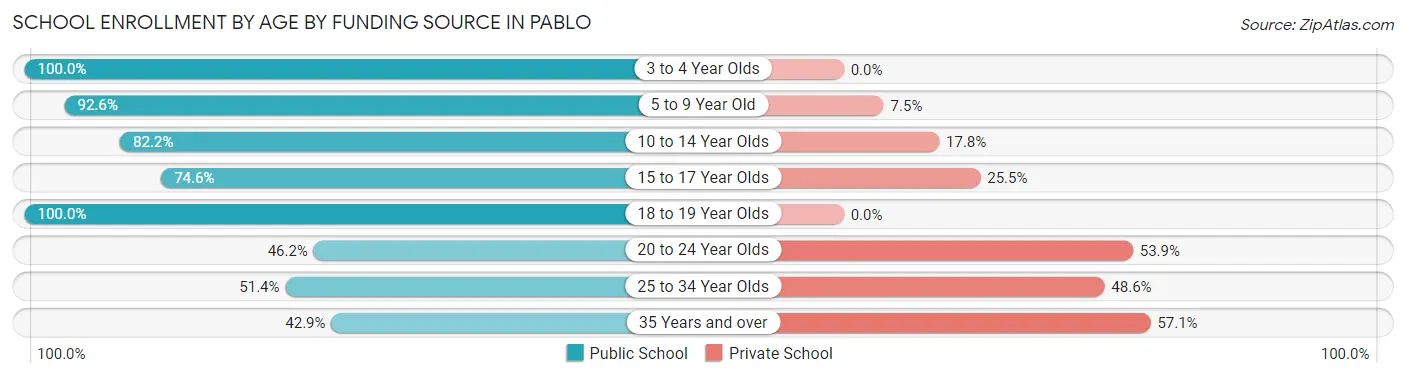
| Age Bracket | Public School | Private School |
| 3 to 4 Year Olds | 35 (100.0%) | 0 (0.0%) |
| 5 to 9 Year Old | 149 (92.5%) | 12 (7.4%) |
| 10 to 14 Year Olds | 74 (82.2%) | 16 (17.8%) |
| 15 to 17 Year Olds | 41 (74.6%) | 14 (25.5%) |
| 18 to 19 Year Olds | 40 (100.0%) | 0 (0.0%) |
| 20 to 24 Year Olds | 42 (46.2%) | 49 (53.8%) |
| 25 to 34 Year Olds | 36 (51.4%) | 34 (48.6%) |
| 35 Years and over | 18 (42.9%) | 24 (57.1%) |
| Total | 435 (74.5%) | 149 (25.5%) |
Educational Attainment by Field of Study in Pablo
Education (62 | 27.6%), psychology (37 | 16.4%), business (36 | 16.0%), arts & humanities (30 | 13.3%), and science & technology (27 | 12.0%) are the most common fields of study among 225 individuals in Pablo who have obtained a bachelor's degree or higher.
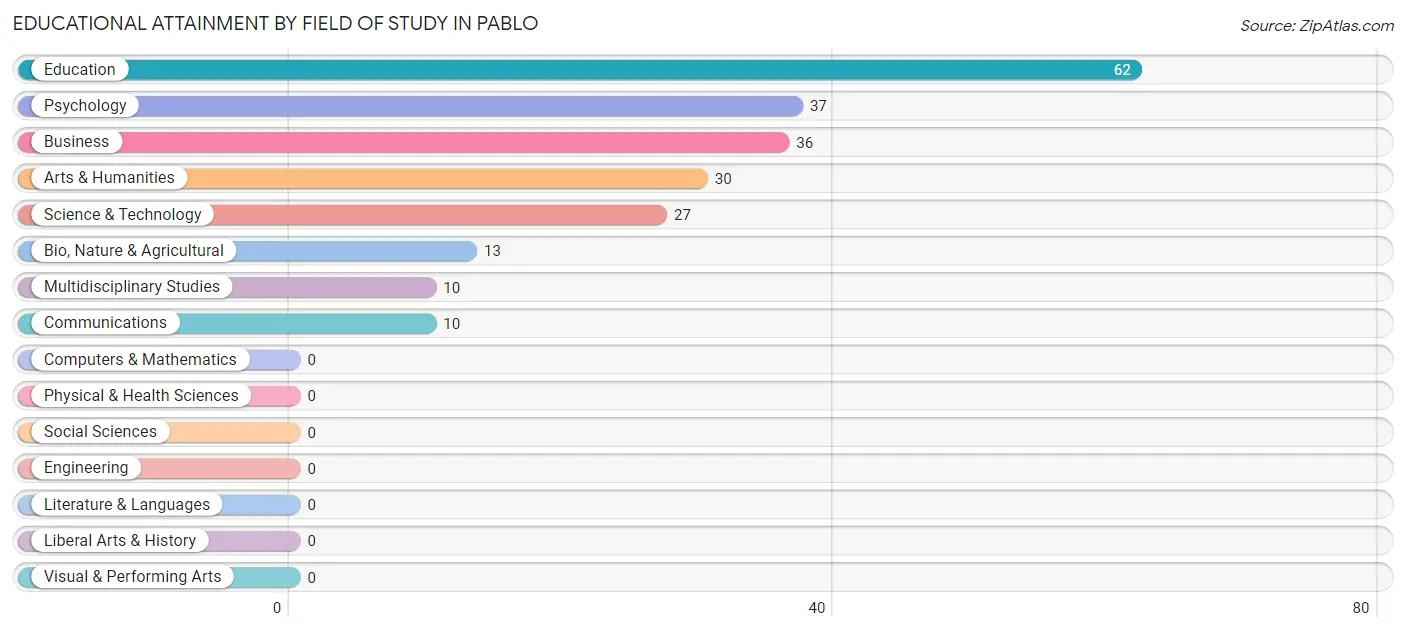
| Field of Study | # Graduates | % Graduates |
| Computers & Mathematics | 0 | 0.0% |
| Bio, Nature & Agricultural | 13 | 5.8% |
| Physical & Health Sciences | 0 | 0.0% |
| Psychology | 37 | 16.4% |
| Social Sciences | 0 | 0.0% |
| Engineering | 0 | 0.0% |
| Multidisciplinary Studies | 10 | 4.4% |
| Science & Technology | 27 | 12.0% |
| Business | 36 | 16.0% |
| Education | 62 | 27.6% |
| Literature & Languages | 0 | 0.0% |
| Liberal Arts & History | 0 | 0.0% |
| Visual & Performing Arts | 0 | 0.0% |
| Communications | 10 | 4.4% |
| Arts & Humanities | 30 | 13.3% |
| Total | 225 | 100.0% |
Transportation & Commute in Pablo
Vehicle Availability by Sex in Pablo
The most prevalent vehicle ownership categories in Pablo are males with 2 vehicles (103, accounting for 36.3%) and females with 2 vehicles (149, making up 32.4%).
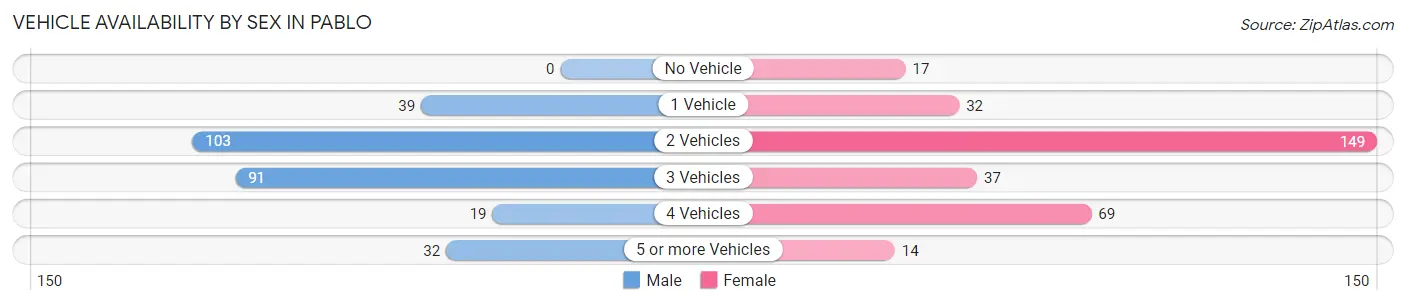
| Vehicles Available | Male | Female |
| No Vehicle | 0 (0.0%) | 17 (5.3%) |
| 1 Vehicle | 39 (13.7%) | 32 (10.1%) |
| 2 Vehicles | 103 (36.3%) | 149 (46.9%) |
| 3 Vehicles | 91 (32.0%) | 37 (11.6%) |
| 4 Vehicles | 19 (6.7%) | 69 (21.7%) |
| 5 or more Vehicles | 32 (11.3%) | 14 (4.4%) |
| Total | 284 (100.0%) | 318 (100.0%) |
Commute Time in Pablo
The most frequently occuring commute durations in Pablo are 10 to 14 minutes (167 commuters, 29.1%), 5 to 9 minutes (114 commuters, 19.9%), and less than 5 minutes (102 commuters, 17.8%).
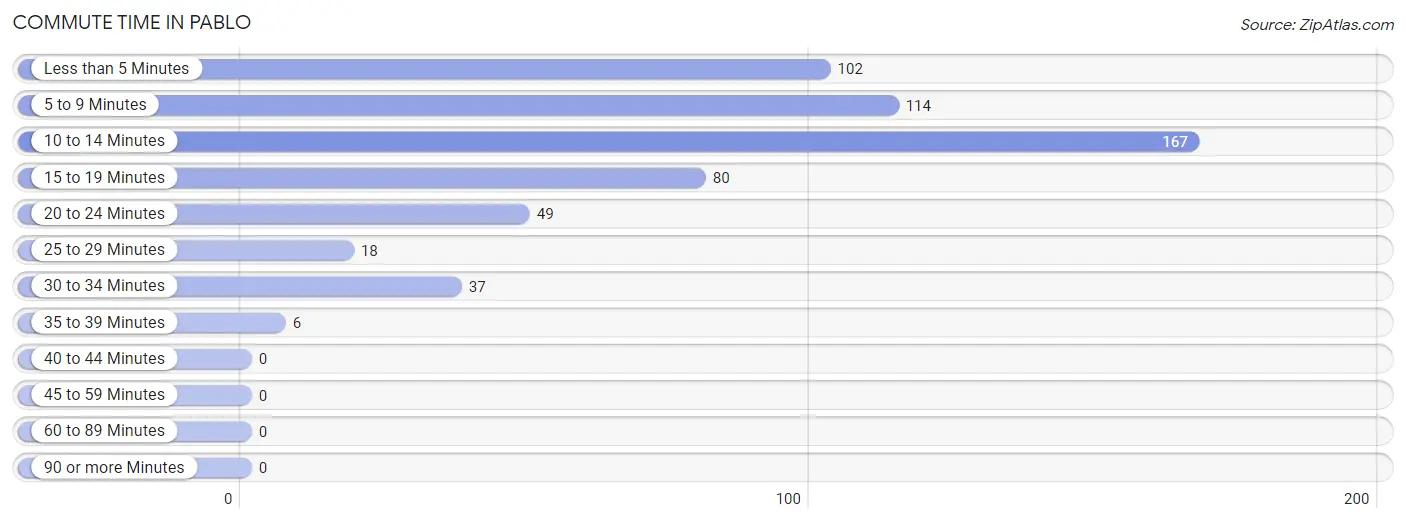
| Commute Time | # Commuters | % Commuters |
| Less than 5 Minutes | 102 | 17.8% |
| 5 to 9 Minutes | 114 | 19.9% |
| 10 to 14 Minutes | 167 | 29.1% |
| 15 to 19 Minutes | 80 | 14.0% |
| 20 to 24 Minutes | 49 | 8.6% |
| 25 to 29 Minutes | 18 | 3.1% |
| 30 to 34 Minutes | 37 | 6.5% |
| 35 to 39 Minutes | 6 | 1.1% |
| 40 to 44 Minutes | 0 | 0.0% |
| 45 to 59 Minutes | 0 | 0.0% |
| 60 to 89 Minutes | 0 | 0.0% |
| 90 or more Minutes | 0 | 0.0% |
Commute Time by Sex in Pablo
The most common commute times in Pablo are 10 to 14 minutes (85 commuters, 32.3%) for males and 10 to 14 minutes (82 commuters, 26.5%) for females.
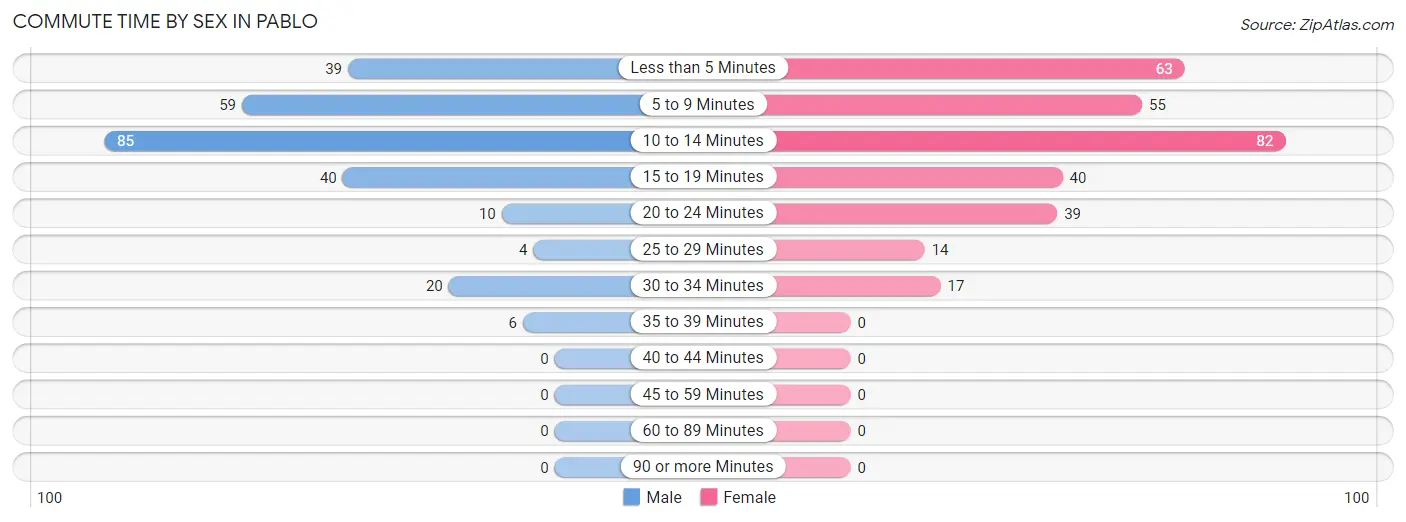
| Commute Time | Male | Female |
| Less than 5 Minutes | 39 (14.8%) | 63 (20.3%) |
| 5 to 9 Minutes | 59 (22.4%) | 55 (17.7%) |
| 10 to 14 Minutes | 85 (32.3%) | 82 (26.5%) |
| 15 to 19 Minutes | 40 (15.2%) | 40 (12.9%) |
| 20 to 24 Minutes | 10 (3.8%) | 39 (12.6%) |
| 25 to 29 Minutes | 4 (1.5%) | 14 (4.5%) |
| 30 to 34 Minutes | 20 (7.6%) | 17 (5.5%) |
| 35 to 39 Minutes | 6 (2.3%) | 0 (0.0%) |
| 40 to 44 Minutes | 0 (0.0%) | 0 (0.0%) |
| 45 to 59 Minutes | 0 (0.0%) | 0 (0.0%) |
| 60 to 89 Minutes | 0 (0.0%) | 0 (0.0%) |
| 90 or more Minutes | 0 (0.0%) | 0 (0.0%) |
Time of Departure to Work by Sex in Pablo
The most frequent times of departure to work in Pablo are 4:00 PM to 11:59 PM (84, 31.9%) for males and 6:30 AM to 6:59 AM (105, 33.9%) for females.
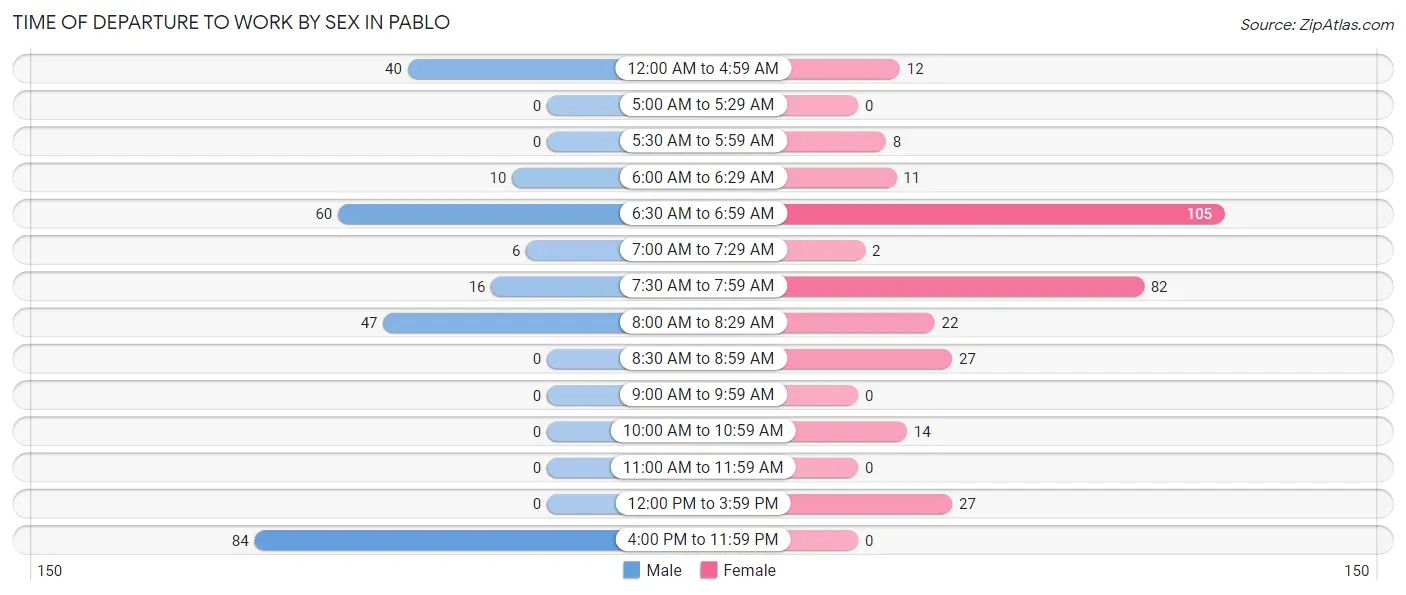
| Time of Departure | Male | Female |
| 12:00 AM to 4:59 AM | 40 (15.2%) | 12 (3.9%) |
| 5:00 AM to 5:29 AM | 0 (0.0%) | 0 (0.0%) |
| 5:30 AM to 5:59 AM | 0 (0.0%) | 8 (2.6%) |
| 6:00 AM to 6:29 AM | 10 (3.8%) | 11 (3.5%) |
| 6:30 AM to 6:59 AM | 60 (22.8%) | 105 (33.9%) |
| 7:00 AM to 7:29 AM | 6 (2.3%) | 2 (0.6%) |
| 7:30 AM to 7:59 AM | 16 (6.1%) | 82 (26.5%) |
| 8:00 AM to 8:29 AM | 47 (17.9%) | 22 (7.1%) |
| 8:30 AM to 8:59 AM | 0 (0.0%) | 27 (8.7%) |
| 9:00 AM to 9:59 AM | 0 (0.0%) | 0 (0.0%) |
| 10:00 AM to 10:59 AM | 0 (0.0%) | 14 (4.5%) |
| 11:00 AM to 11:59 AM | 0 (0.0%) | 0 (0.0%) |
| 12:00 PM to 3:59 PM | 0 (0.0%) | 27 (8.7%) |
| 4:00 PM to 11:59 PM | 84 (31.9%) | 0 (0.0%) |
| Total | 263 (100.0%) | 310 (100.0%) |
Housing Occupancy in Pablo
Occupancy by Ownership in Pablo
Of the total 652 dwellings in Pablo, owner-occupied units account for 436 (66.9%), while renter-occupied units make up 216 (33.1%).
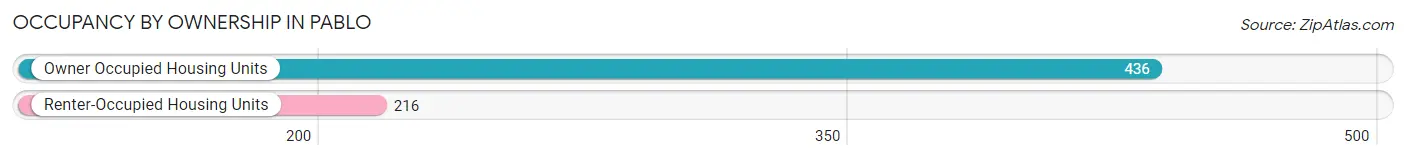
| Occupancy | # Housing Units | % Housing Units |
| Owner Occupied Housing Units | 436 | 66.9% |
| Renter-Occupied Housing Units | 216 | 33.1% |
| Total Occupied Housing Units | 652 | 100.0% |
Occupancy by Household Size in Pablo
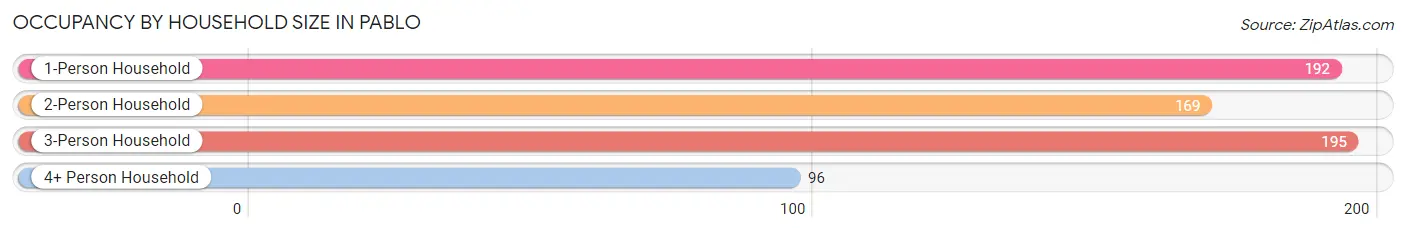
| Household Size | # Housing Units | % Housing Units |
| 1-Person Household | 192 | 29.4% |
| 2-Person Household | 169 | 25.9% |
| 3-Person Household | 195 | 29.9% |
| 4+ Person Household | 96 | 14.7% |
| Total Housing Units | 652 | 100.0% |
Occupancy by Ownership by Household Size in Pablo
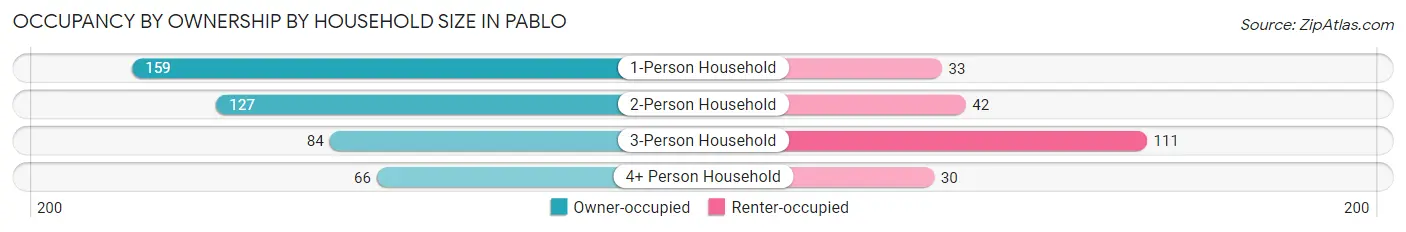
| Household Size | Owner-occupied | Renter-occupied |
| 1-Person Household | 159 (82.8%) | 33 (17.2%) |
| 2-Person Household | 127 (75.1%) | 42 (24.8%) |
| 3-Person Household | 84 (43.1%) | 111 (56.9%) |
| 4+ Person Household | 66 (68.8%) | 30 (31.2%) |
| Total Housing Units | 436 (66.9%) | 216 (33.1%) |
Occupancy by Educational Attainment in Pablo
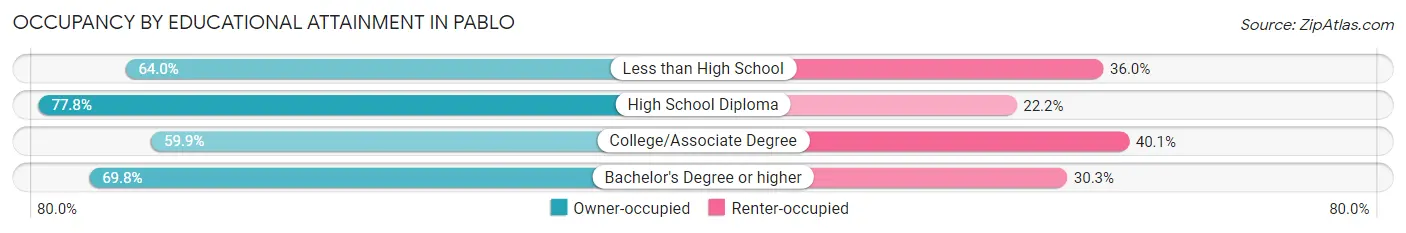
| Household Size | Owner-occupied | Renter-occupied |
| Less than High School | 48 (64.0%) | 27 (36.0%) |
| High School Diploma | 133 (77.8%) | 38 (22.2%) |
| College/Associate Degree | 172 (59.9%) | 115 (40.1%) |
| Bachelor's Degree or higher | 83 (69.8%) | 36 (30.2%) |
Occupancy by Age of Householder in Pablo
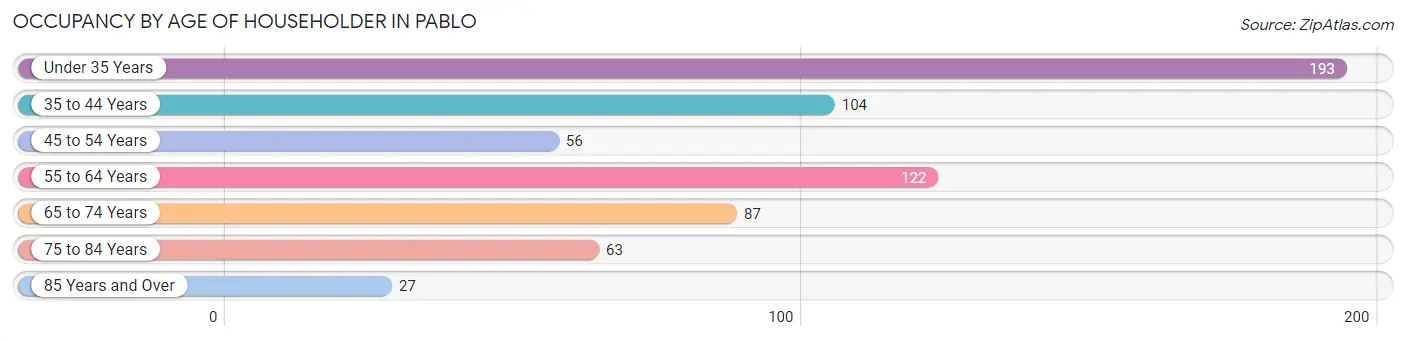
| Age Bracket | # Households | % Households |
| Under 35 Years | 193 | 29.6% |
| 35 to 44 Years | 104 | 16.0% |
| 45 to 54 Years | 56 | 8.6% |
| 55 to 64 Years | 122 | 18.7% |
| 65 to 74 Years | 87 | 13.3% |
| 75 to 84 Years | 63 | 9.7% |
| 85 Years and Over | 27 | 4.1% |
| Total | 652 | 100.0% |
Housing Finances in Pablo
Median Income by Occupancy in Pablo
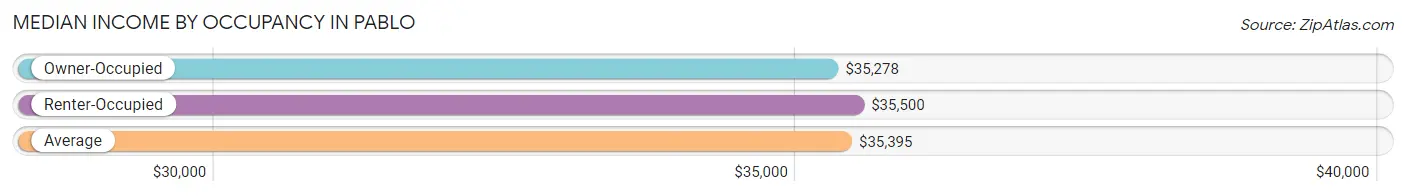
| Occupancy Type | # Households | Median Income |
| Owner-Occupied | 436 (66.9%) | $35,278 |
| Renter-Occupied | 216 (33.1%) | $35,500 |
| Average | 652 (100.0%) | $35,395 |
Occupancy by Householder Income Bracket in Pablo
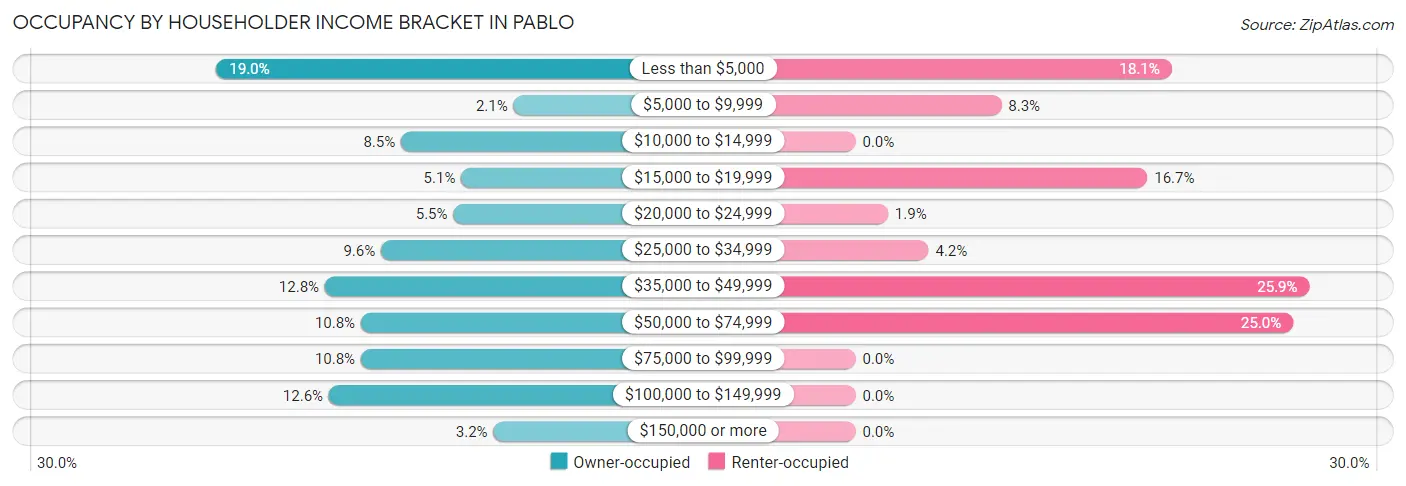
| Income Bracket | Owner-occupied | Renter-occupied |
| Less than $5,000 | 83 (19.0%) | 39 (18.1%) |
| $5,000 to $9,999 | 9 (2.1%) | 18 (8.3%) |
| $10,000 to $14,999 | 37 (8.5%) | 0 (0.0%) |
| $15,000 to $19,999 | 22 (5.1%) | 36 (16.7%) |
| $20,000 to $24,999 | 24 (5.5%) | 4 (1.8%) |
| $25,000 to $34,999 | 42 (9.6%) | 9 (4.2%) |
| $35,000 to $49,999 | 56 (12.8%) | 56 (25.9%) |
| $50,000 to $74,999 | 47 (10.8%) | 54 (25.0%) |
| $75,000 to $99,999 | 47 (10.8%) | 0 (0.0%) |
| $100,000 to $149,999 | 55 (12.6%) | 0 (0.0%) |
| $150,000 or more | 14 (3.2%) | 0 (0.0%) |
| Total | 436 (100.0%) | 216 (100.0%) |
Monthly Housing Cost Tiers in Pablo
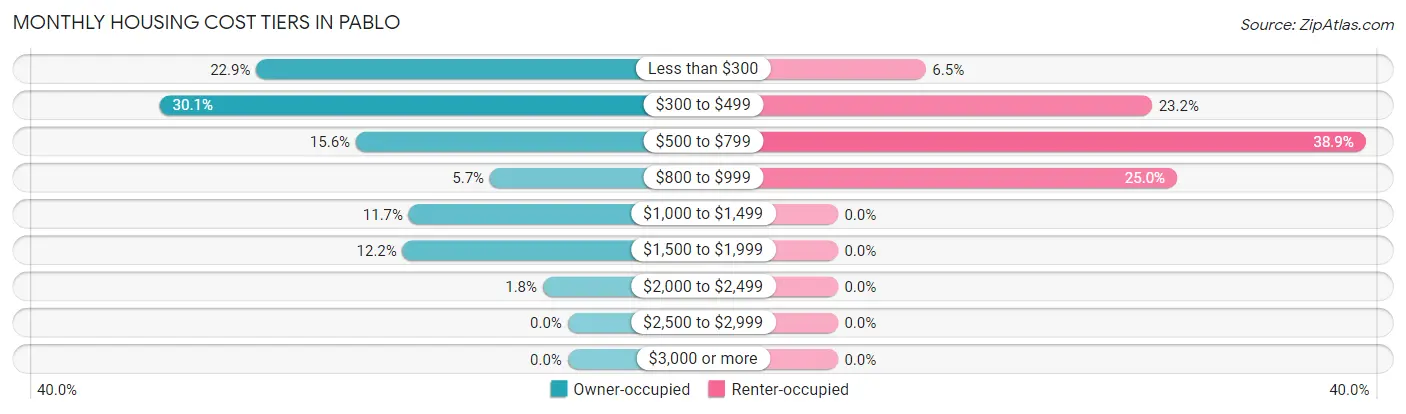
| Monthly Cost | Owner-occupied | Renter-occupied |
| Less than $300 | 100 (22.9%) | 14 (6.5%) |
| $300 to $499 | 131 (30.0%) | 50 (23.2%) |
| $500 to $799 | 68 (15.6%) | 84 (38.9%) |
| $800 to $999 | 25 (5.7%) | 54 (25.0%) |
| $1,000 to $1,499 | 51 (11.7%) | 0 (0.0%) |
| $1,500 to $1,999 | 53 (12.2%) | 0 (0.0%) |
| $2,000 to $2,499 | 8 (1.8%) | 0 (0.0%) |
| $2,500 to $2,999 | 0 (0.0%) | 0 (0.0%) |
| $3,000 or more | 0 (0.0%) | 0 (0.0%) |
| Total | 436 (100.0%) | 216 (100.0%) |
Physical Housing Characteristics in Pablo
Housing Structures in Pablo
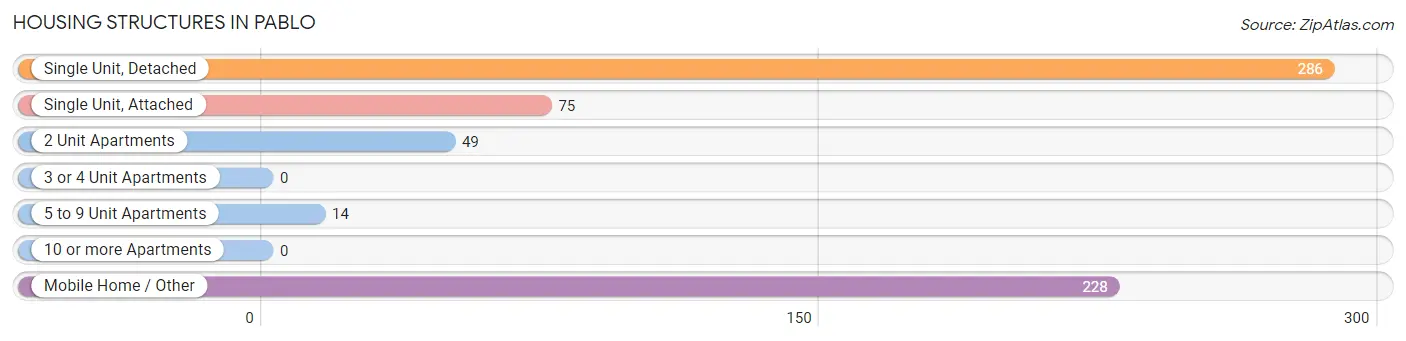
| Structure Type | # Housing Units | % Housing Units |
| Single Unit, Detached | 286 | 43.9% |
| Single Unit, Attached | 75 | 11.5% |
| 2 Unit Apartments | 49 | 7.5% |
| 3 or 4 Unit Apartments | 0 | 0.0% |
| 5 to 9 Unit Apartments | 14 | 2.1% |
| 10 or more Apartments | 0 | 0.0% |
| Mobile Home / Other | 228 | 35.0% |
| Total | 652 | 100.0% |
Housing Structures by Occupancy in Pablo
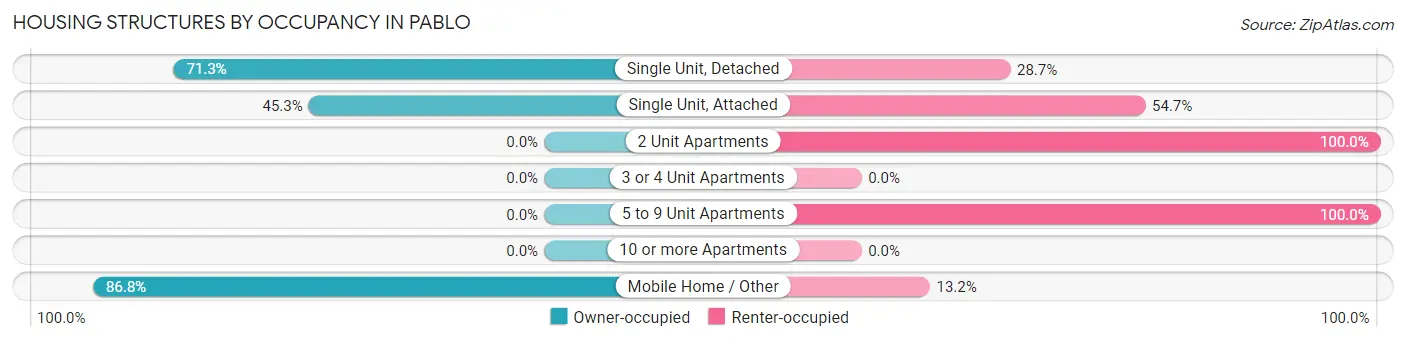
| Structure Type | Owner-occupied | Renter-occupied |
| Single Unit, Detached | 204 (71.3%) | 82 (28.7%) |
| Single Unit, Attached | 34 (45.3%) | 41 (54.7%) |
| 2 Unit Apartments | 0 (0.0%) | 49 (100.0%) |
| 3 or 4 Unit Apartments | 0 (0.0%) | 0 (0.0%) |
| 5 to 9 Unit Apartments | 0 (0.0%) | 14 (100.0%) |
| 10 or more Apartments | 0 (0.0%) | 0 (0.0%) |
| Mobile Home / Other | 198 (86.8%) | 30 (13.2%) |
| Total | 436 (66.9%) | 216 (33.1%) |
Housing Structures by Number of Rooms in Pablo
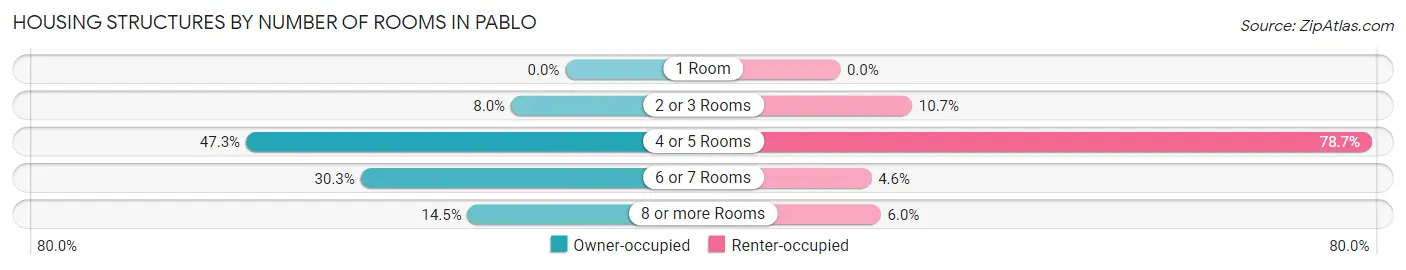
| Number of Rooms | Owner-occupied | Renter-occupied |
| 1 Room | 0 (0.0%) | 0 (0.0%) |
| 2 or 3 Rooms | 35 (8.0%) | 23 (10.6%) |
| 4 or 5 Rooms | 206 (47.2%) | 170 (78.7%) |
| 6 or 7 Rooms | 132 (30.3%) | 10 (4.6%) |
| 8 or more Rooms | 63 (14.4%) | 13 (6.0%) |
| Total | 436 (100.0%) | 216 (100.0%) |
Housing Structure by Heating Type in Pablo
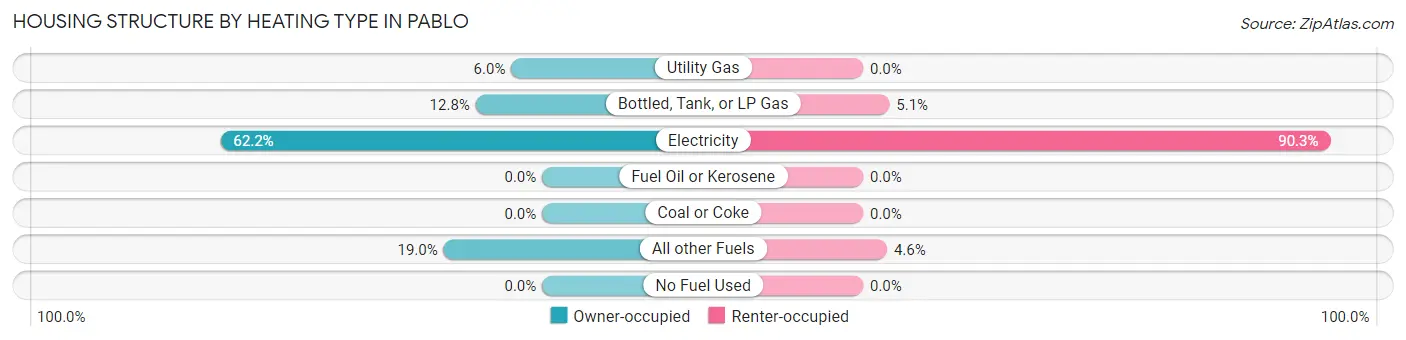
| Heating Type | Owner-occupied | Renter-occupied |
| Utility Gas | 26 (6.0%) | 0 (0.0%) |
| Bottled, Tank, or LP Gas | 56 (12.8%) | 11 (5.1%) |
| Electricity | 271 (62.2%) | 195 (90.3%) |
| Fuel Oil or Kerosene | 0 (0.0%) | 0 (0.0%) |
| Coal or Coke | 0 (0.0%) | 0 (0.0%) |
| All other Fuels | 83 (19.0%) | 10 (4.6%) |
| No Fuel Used | 0 (0.0%) | 0 (0.0%) |
| Total | 436 (100.0%) | 216 (100.0%) |
Household Vehicle Usage in Pablo
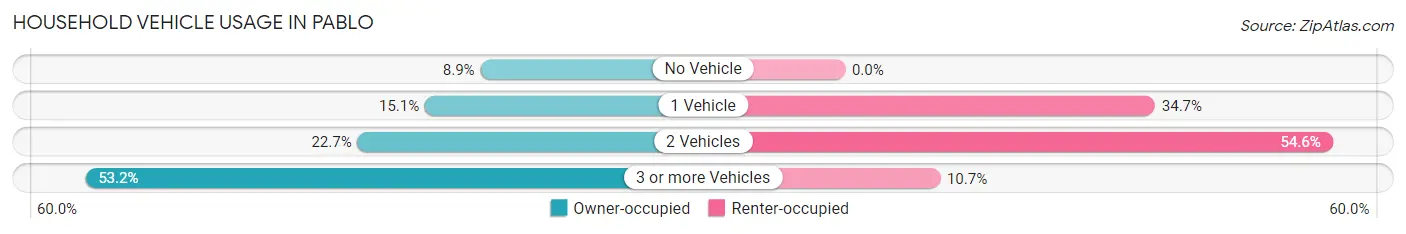
| Vehicles per Household | Owner-occupied | Renter-occupied |
| No Vehicle | 39 (8.9%) | 0 (0.0%) |
| 1 Vehicle | 66 (15.1%) | 75 (34.7%) |
| 2 Vehicles | 99 (22.7%) | 118 (54.6%) |
| 3 or more Vehicles | 232 (53.2%) | 23 (10.6%) |
| Total | 436 (100.0%) | 216 (100.0%) |
Real Estate & Mortgages in Pablo
Real Estate and Mortgage Overview in Pablo
| Characteristic | Without Mortgage | With Mortgage |
| Housing Units | 265 | 171 |
| Median Property Value | $105,700 | $253,000 |
| Median Household Income | $29,219 | $0 |
| Monthly Housing Costs | $343 | $0 |
| Real Estate Taxes | $490 | $42 |
Property Value by Mortgage Status in Pablo
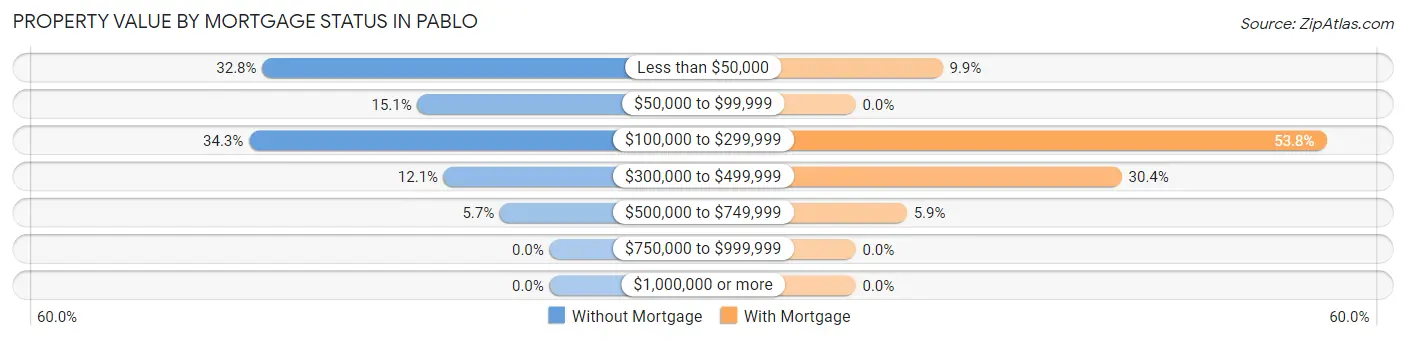
| Property Value | Without Mortgage | With Mortgage |
| Less than $50,000 | 87 (32.8%) | 17 (9.9%) |
| $50,000 to $99,999 | 40 (15.1%) | 0 (0.0%) |
| $100,000 to $299,999 | 91 (34.3%) | 92 (53.8%) |
| $300,000 to $499,999 | 32 (12.1%) | 52 (30.4%) |
| $500,000 to $749,999 | 15 (5.7%) | 10 (5.9%) |
| $750,000 to $999,999 | 0 (0.0%) | 0 (0.0%) |
| $1,000,000 or more | 0 (0.0%) | 0 (0.0%) |
| Total | 265 (100.0%) | 171 (100.0%) |
Household Income by Mortgage Status in Pablo
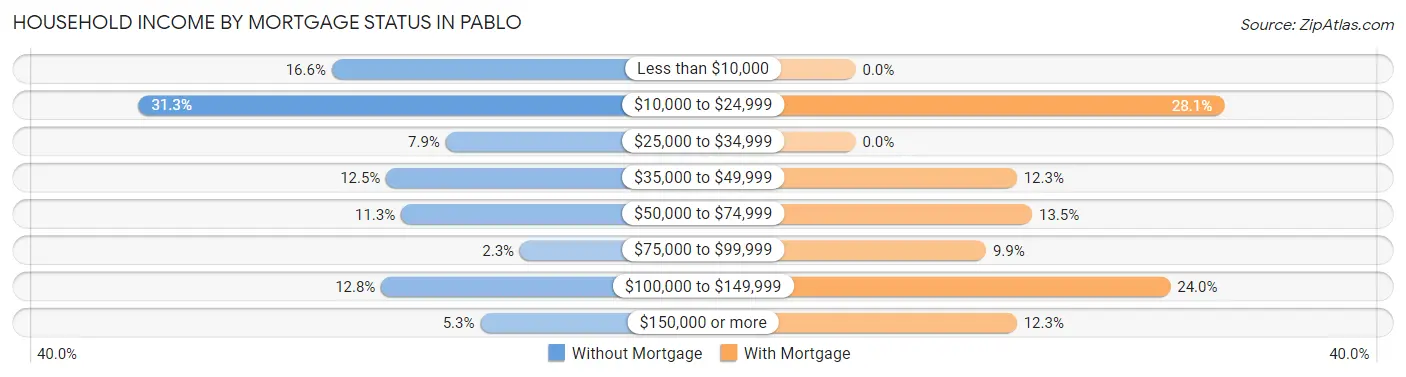
| Household Income | Without Mortgage | With Mortgage |
| Less than $10,000 | 44 (16.6%) | 0 (0.0%) |
| $10,000 to $24,999 | 83 (31.3%) | 48 (28.1%) |
| $25,000 to $34,999 | 21 (7.9%) | 0 (0.0%) |
| $35,000 to $49,999 | 33 (12.4%) | 21 (12.3%) |
| $50,000 to $74,999 | 30 (11.3%) | 23 (13.5%) |
| $75,000 to $99,999 | 6 (2.3%) | 17 (9.9%) |
| $100,000 to $149,999 | 34 (12.8%) | 41 (24.0%) |
| $150,000 or more | 14 (5.3%) | 21 (12.3%) |
| Total | 265 (100.0%) | 171 (100.0%) |
Property Value to Household Income Ratio in Pablo
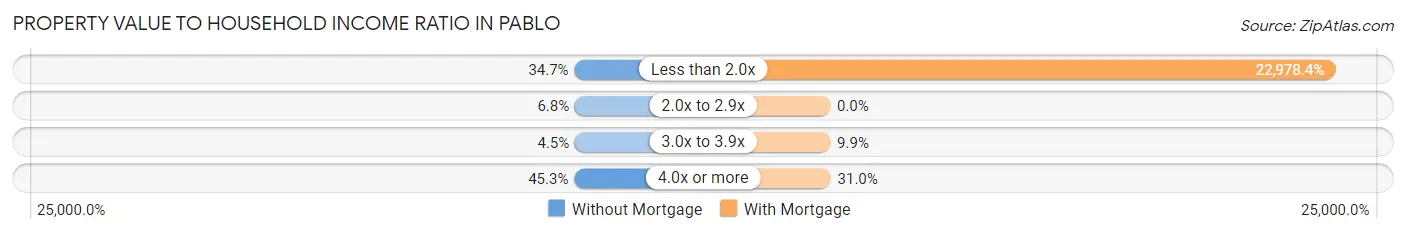
| Value-to-Income Ratio | Without Mortgage | With Mortgage |
| Less than 2.0x | 92 (34.7%) | 39,293 (22,978.4%) |
| 2.0x to 2.9x | 18 (6.8%) | 0 (0.0%) |
| 3.0x to 3.9x | 12 (4.5%) | 17 (9.9%) |
| 4.0x or more | 120 (45.3%) | 53 (31.0%) |
| Total | 265 (100.0%) | 171 (100.0%) |
Real Estate Taxes by Mortgage Status in Pablo
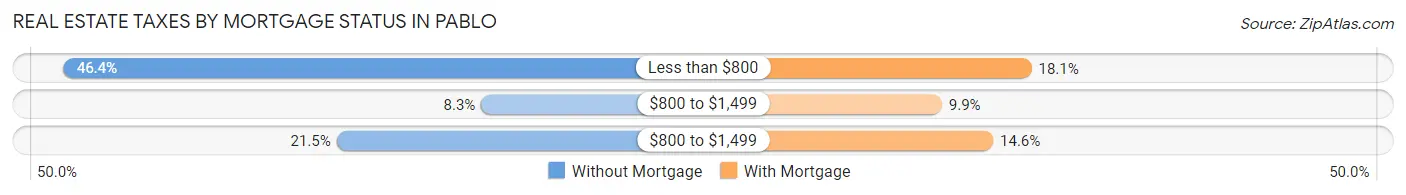
| Property Taxes | Without Mortgage | With Mortgage |
| Less than $800 | 123 (46.4%) | 31 (18.1%) |
| $800 to $1,499 | 22 (8.3%) | 17 (9.9%) |
| $800 to $1,499 | 57 (21.5%) | 25 (14.6%) |
| Total | 265 (100.0%) | 171 (100.0%) |
Health & Disability in Pablo
Health Insurance Coverage by Age in Pablo
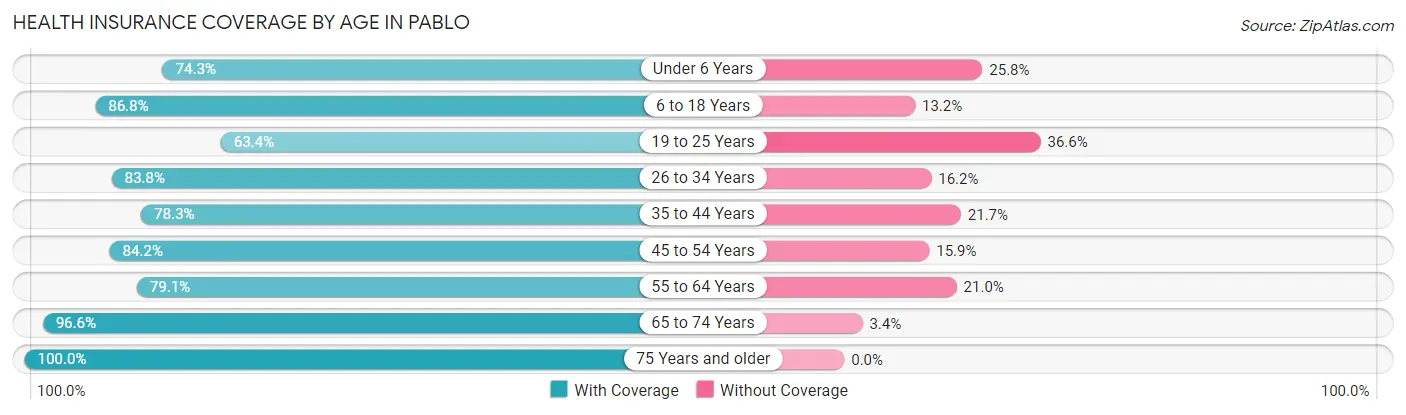
| Age Bracket | With Coverage | Without Coverage |
| Under 6 Years | 173 (74.3%) | 60 (25.8%) |
| 6 to 18 Years | 316 (86.8%) | 48 (13.2%) |
| 19 to 25 Years | 168 (63.4%) | 97 (36.6%) |
| 26 to 34 Years | 155 (83.8%) | 30 (16.2%) |
| 35 to 44 Years | 162 (78.3%) | 45 (21.7%) |
| 45 to 54 Years | 69 (84.2%) | 13 (15.9%) |
| 55 to 64 Years | 166 (79.0%) | 44 (20.9%) |
| 65 to 74 Years | 114 (96.6%) | 4 (3.4%) |
| 75 Years and older | 128 (100.0%) | 0 (0.0%) |
| Total | 1,451 (81.0%) | 341 (19.0%) |
Health Insurance Coverage by Citizenship Status in Pablo
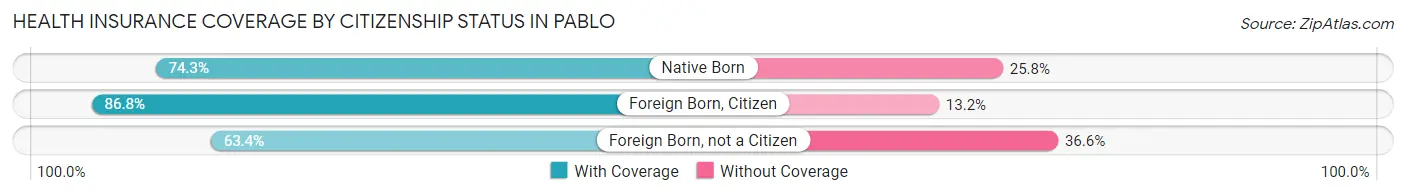
| Citizenship Status | With Coverage | Without Coverage |
| Native Born | 173 (74.3%) | 60 (25.8%) |
| Foreign Born, Citizen | 316 (86.8%) | 48 (13.2%) |
| Foreign Born, not a Citizen | 168 (63.4%) | 97 (36.6%) |
Health Insurance Coverage by Household Income in Pablo
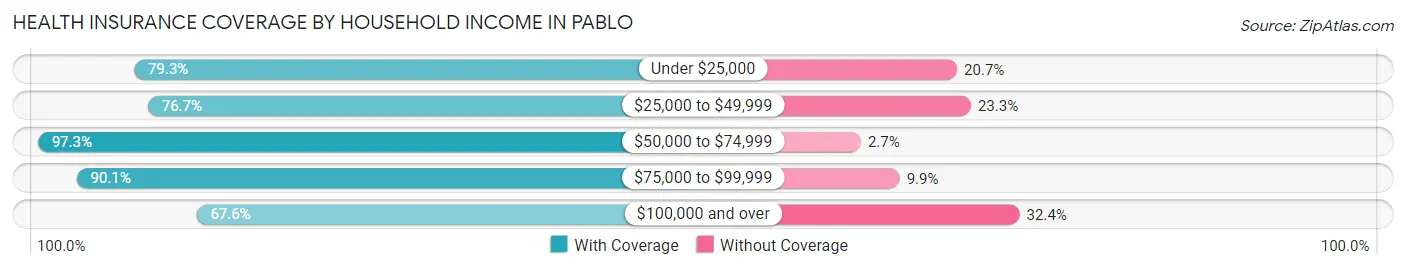
| Household Income | With Coverage | Without Coverage |
| Under $25,000 | 510 (79.3%) | 133 (20.7%) |
| $25,000 to $49,999 | 333 (76.7%) | 101 (23.3%) |
| $50,000 to $74,999 | 256 (97.3%) | 7 (2.7%) |
| $75,000 to $99,999 | 209 (90.1%) | 23 (9.9%) |
| $100,000 and over | 119 (67.6%) | 57 (32.4%) |
Public vs Private Health Insurance Coverage by Age in Pablo
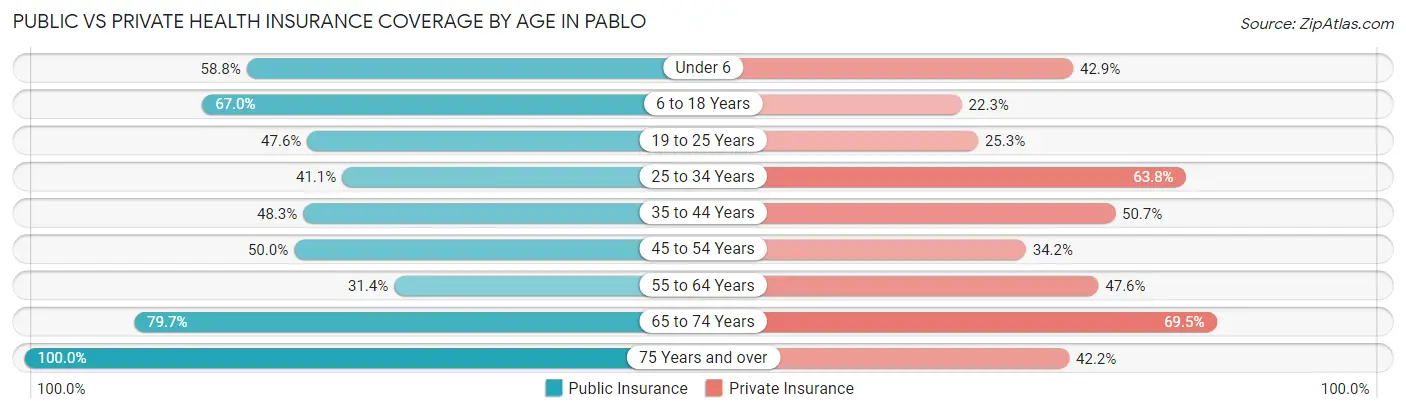
| Age Bracket | Public Insurance | Private Insurance |
| Under 6 | 137 (58.8%) | 100 (42.9%) |
| 6 to 18 Years | 244 (67.0%) | 81 (22.3%) |
| 19 to 25 Years | 126 (47.5%) | 67 (25.3%) |
| 25 to 34 Years | 76 (41.1%) | 118 (63.8%) |
| 35 to 44 Years | 100 (48.3%) | 105 (50.7%) |
| 45 to 54 Years | 41 (50.0%) | 28 (34.2%) |
| 55 to 64 Years | 66 (31.4%) | 100 (47.6%) |
| 65 to 74 Years | 94 (79.7%) | 82 (69.5%) |
| 75 Years and over | 128 (100.0%) | 54 (42.2%) |
| Total | 1,012 (56.5%) | 735 (41.0%) |
Disability Status by Sex by Age in Pablo
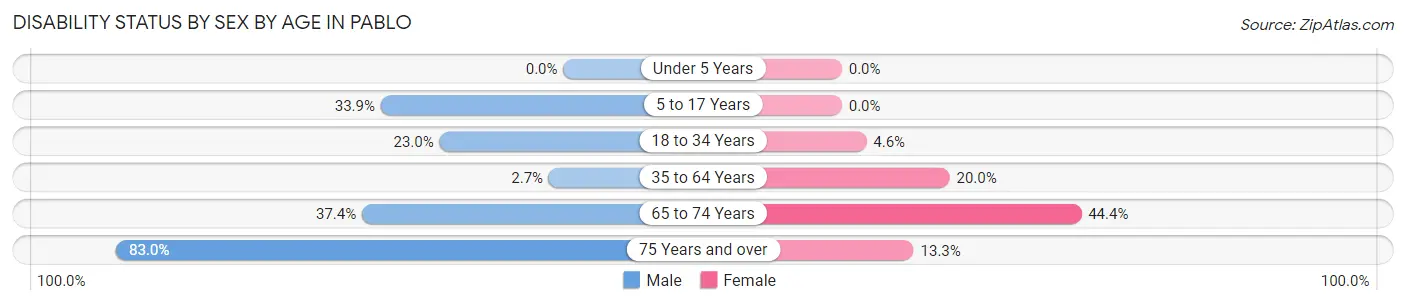
| Age Bracket | Male | Female |
| Under 5 Years | 0 (0.0%) | 0 (0.0%) |
| 5 to 17 Years | 61 (33.9%) | 0 (0.0%) |
| 18 to 34 Years | 57 (23.0%) | 11 (4.5%) |
| 35 to 64 Years | 6 (2.7%) | 55 (20.0%) |
| 65 to 74 Years | 34 (37.4%) | 12 (44.4%) |
| 75 Years and over | 44 (83.0%) | 10 (13.3%) |
Disability Class by Sex by Age in Pablo
Disability Class: Hearing Difficulty
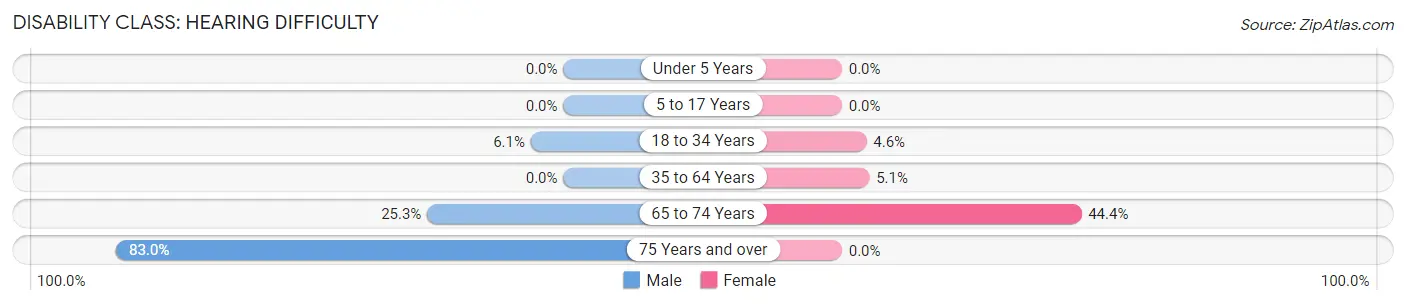
| Age Bracket | Male | Female |
| Under 5 Years | 0 (0.0%) | 0 (0.0%) |
| 5 to 17 Years | 0 (0.0%) | 0 (0.0%) |
| 18 to 34 Years | 15 (6.0%) | 11 (4.5%) |
| 35 to 64 Years | 0 (0.0%) | 14 (5.1%) |
| 65 to 74 Years | 23 (25.3%) | 12 (44.4%) |
| 75 Years and over | 44 (83.0%) | 0 (0.0%) |
Disability Class: Vision Difficulty
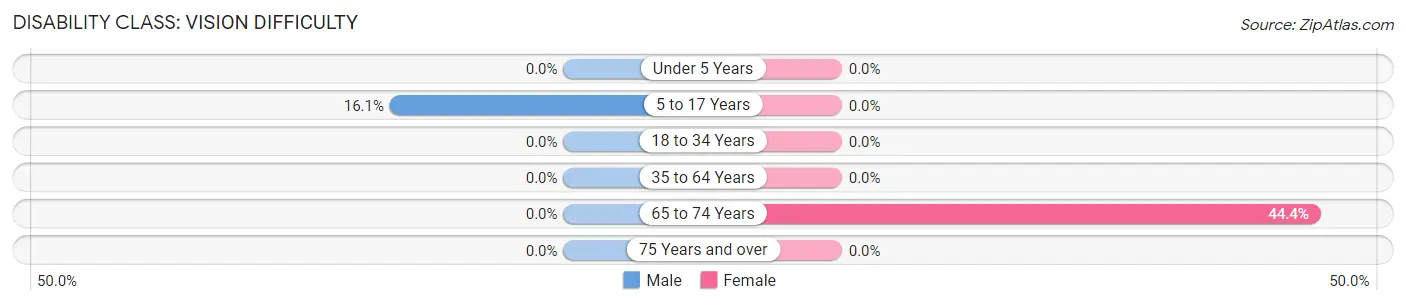
| Age Bracket | Male | Female |
| Under 5 Years | 0 (0.0%) | 0 (0.0%) |
| 5 to 17 Years | 29 (16.1%) | 0 (0.0%) |
| 18 to 34 Years | 0 (0.0%) | 0 (0.0%) |
| 35 to 64 Years | 0 (0.0%) | 0 (0.0%) |
| 65 to 74 Years | 0 (0.0%) | 12 (44.4%) |
| 75 Years and over | 0 (0.0%) | 0 (0.0%) |
Disability Class: Cognitive Difficulty
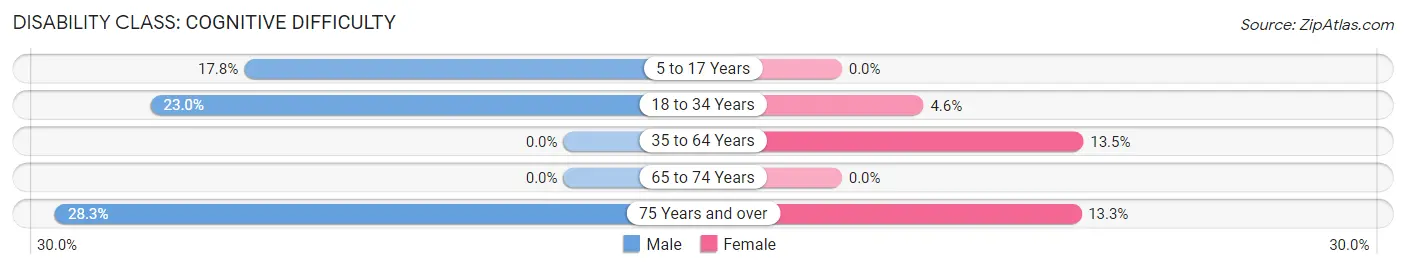
| Age Bracket | Male | Female |
| 5 to 17 Years | 32 (17.8%) | 0 (0.0%) |
| 18 to 34 Years | 57 (23.0%) | 11 (4.5%) |
| 35 to 64 Years | 0 (0.0%) | 37 (13.5%) |
| 65 to 74 Years | 0 (0.0%) | 0 (0.0%) |
| 75 Years and over | 15 (28.3%) | 10 (13.3%) |
Disability Class: Ambulatory Difficulty
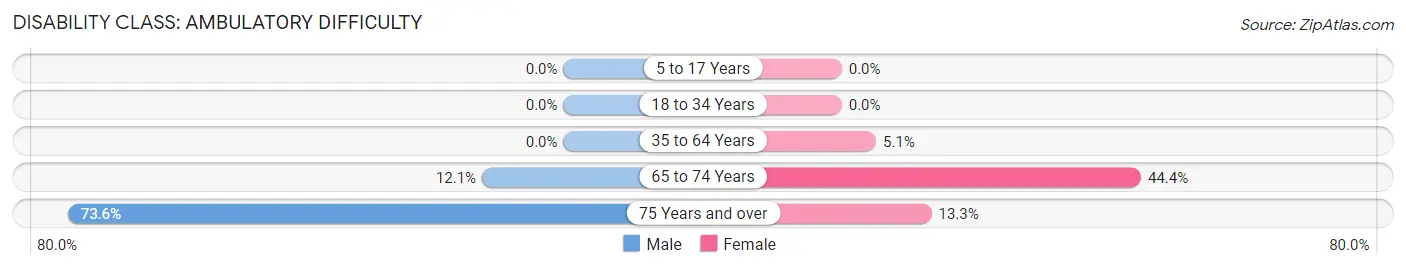
| Age Bracket | Male | Female |
| 5 to 17 Years | 0 (0.0%) | 0 (0.0%) |
| 18 to 34 Years | 0 (0.0%) | 0 (0.0%) |
| 35 to 64 Years | 0 (0.0%) | 14 (5.1%) |
| 65 to 74 Years | 11 (12.1%) | 12 (44.4%) |
| 75 Years and over | 39 (73.6%) | 10 (13.3%) |
Disability Class: Self-Care Difficulty
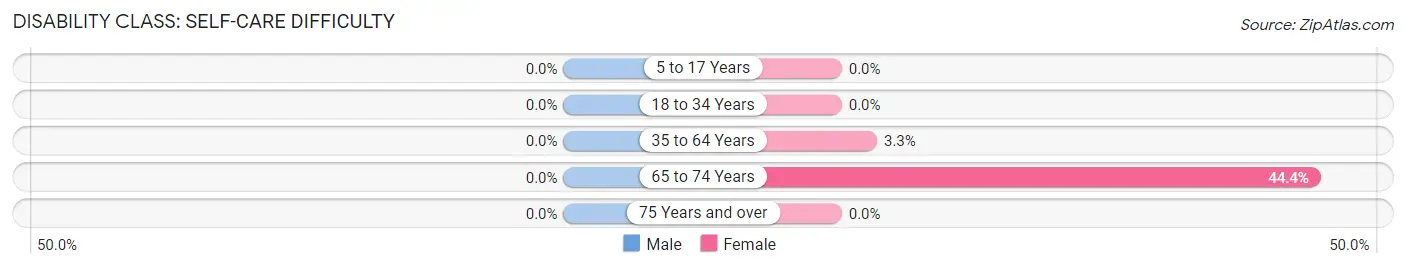
| Age Bracket | Male | Female |
| 5 to 17 Years | 0 (0.0%) | 0 (0.0%) |
| 18 to 34 Years | 0 (0.0%) | 0 (0.0%) |
| 35 to 64 Years | 0 (0.0%) | 9 (3.3%) |
| 65 to 74 Years | 0 (0.0%) | 12 (44.4%) |
| 75 Years and over | 0 (0.0%) | 0 (0.0%) |
Technology Access in Pablo
Computing Device Access in Pablo
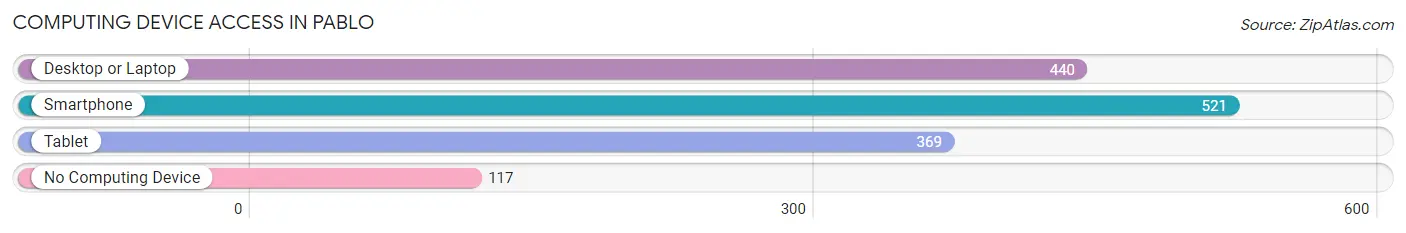
| Device Type | # Households | % Households |
| Desktop or Laptop | 440 | 67.5% |
| Smartphone | 521 | 79.9% |
| Tablet | 369 | 56.6% |
| No Computing Device | 117 | 17.9% |
| Total | 652 | 100.0% |
Internet Access in Pablo
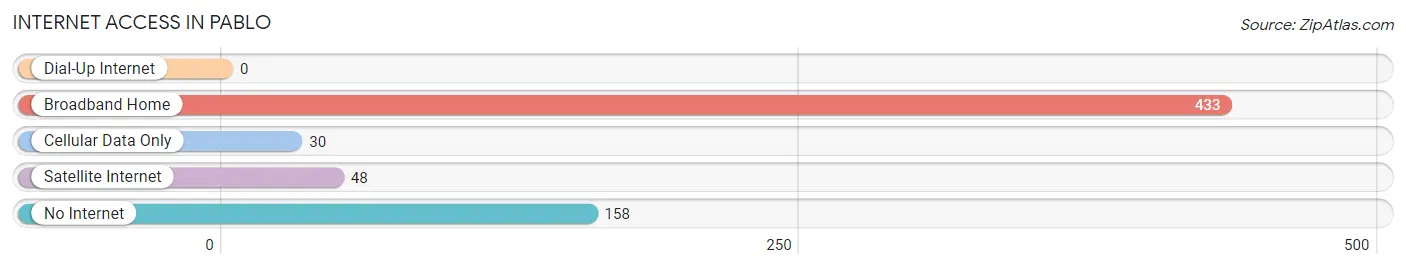
| Internet Type | # Households | % Households |
| Dial-Up Internet | 0 | 0.0% |
| Broadband Home | 433 | 66.4% |
| Cellular Data Only | 30 | 4.6% |
| Satellite Internet | 48 | 7.4% |
| No Internet | 158 | 24.2% |
| Total | 652 | 100.0% |
Pablo Summary
Pablo, Montana is a small town located in the northwest corner of the state, just south of the Flathead Indian Reservation. It is situated in the Flathead Valley, which is surrounded by the Mission Mountains to the east and the Swan Range to the west. The town is located on the Flathead River, which is a major tributary of the Clark Fork River. The town is home to approximately 1,000 people and is the county seat of Lake County.
History
The area around Pablo was first inhabited by the Salish-Kootenai Indians, who were the original inhabitants of the Flathead Valley. The first white settlers arrived in the area in the late 1800s, and the town of Pablo was officially established in 1902. The town was named after Chief Pablo, a leader of the Salish-Kootenai tribe.
The town grew rapidly in the early 1900s, and by 1910 it had a population of over 500 people. The town was home to a variety of businesses, including a sawmill, a flour mill, a hotel, and a general store. The town also had a school, a post office, and a newspaper.
In the 1920s, the town began to decline as the timber industry in the area began to decline. The Great Depression further exacerbated the decline, and by 1940 the population had dropped to just over 200 people. The town continued to decline until the 1970s, when the timber industry began to rebound.
Geography
Pablo is located in the northwest corner of Montana, just south of the Flathead Indian Reservation. It is situated in the Flathead Valley, which is surrounded by the Mission Mountains to the east and the Swan Range to the west. The town is located on the Flathead River, which is a major tributary of the Clark Fork River.
The town is located at an elevation of 3,000 feet, and the surrounding area is mostly flat. The climate is semi-arid, with hot summers and cold winters. The average annual precipitation is around 15 inches, and the average annual temperature is around 45 degrees Fahrenheit.
Economy
The economy of Pablo is largely based on agriculture and tourism. The town is home to a variety of farms, including cattle, sheep, and hay farms. The town is also home to a number of tourist attractions, including the Flathead Lake State Park, the National Bison Range, and the Ninepipe National Wildlife Refuge.
The town is also home to a variety of businesses, including restaurants, hotels, and retail stores. The town is also home to a number of manufacturing companies, including a sawmill, a flour mill, and a furniture factory.
Demographics
As of the 2010 census, the population of Pablo was 1,000 people. The racial makeup of the town was 95.2% White, 0.7% Native American, 0.3% Asian, 0.1% African American, and 3.7% from other races. The median household income was $35,000, and the median family income was $41,000. The per capita income was $17,000. The town had a poverty rate of 17.3%.
Common Questions
What is Per Capita Income in Pablo?
Per Capita income in Pablo is $17,661.
What is the Median Family Income in Pablo?
Median Family Income in Pablo is $36,500.
What is the Median Household income in Pablo?
Median Household Income in Pablo is $35,395.
What is Income or Wage Gap in Pablo?
Income or Wage Gap in Pablo is 32.8%.
Women in Pablo earn 67.2 cents for every dollar earned by a man.
What is Inequality or Gini Index in Pablo?
Inequality or Gini Index in Pablo is 0.53.
What is the Total Population of Pablo?
Total Population of Pablo is 1,799.
What is the Total Male Population of Pablo?
Total Male Population of Pablo is 900.
What is the Total Female Population of Pablo?
Total Female Population of Pablo is 899.
What is the Ratio of Males per 100 Females in Pablo?
There are 100.11 Males per 100 Females in Pablo.
What is the Ratio of Females per 100 Males in Pablo?
There are 99.89 Females per 100 Males in Pablo.
What is the Median Population Age in Pablo?
Median Population Age in Pablo is 28.1 Years.
What is the Average Family Size in Pablo
Average Family Size in Pablo is 3.2 People.
What is the Average Household Size in Pablo
Average Household Size in Pablo is 2.7 People.
How Large is the Labor Force in Pablo?
There are 679 People in the Labor Forcein in Pablo.
What is the Percentage of People in the Labor Force in Pablo?
53.2% of People are in the Labor Force in Pablo.
What is the Unemployment Rate in Pablo?
Unemployment Rate in Pablo is 8.2%.