Victor, MT Map & Demographics
Victor Map
Victor Overview
$18,047
PER CAPITA INCOME
$57,974
AVG FAMILY INCOME
$38,427
AVG HOUSEHOLD INCOME
0.32
INEQUALITY / GINI INDEX
885
TOTAL POPULATION
425
MALE POPULATION
460
FEMALE POPULATION
92.39
MALES / 100 FEMALES
108.24
FEMALES / 100 MALES
35.9
MEDIAN AGE
3.9
AVG FAMILY SIZE
2.8
AVG HOUSEHOLD SIZE
450
LABOR FORCE [ PEOPLE ]
72.5%
PERCENT IN LABOR FORCE
Victor Zip Codes
Victor Area Codes
Income in Victor
Income Overview in Victor
Per Capita Income in Victor is $18,047, while median incomes of families and households are $57,974 and $38,427 respectively.
| Characteristic | Number | Measure |
| Per Capita Income | 885 | $18,047 |
| Median Family Income | 191 | $57,974 |
| Mean Family Income | 191 | $56,577 |
| Median Household Income | 317 | $38,427 |
| Mean Household Income | 317 | $47,218 |
| Income Deficit | 191 | $0 |
| Wage / Income Gap (%) | 885 | 0.00% |
| Wage / Income Gap ($) | 885 | 100.00¢ per $1 |
| Gini / Inequality Index | 885 | 0.32 |
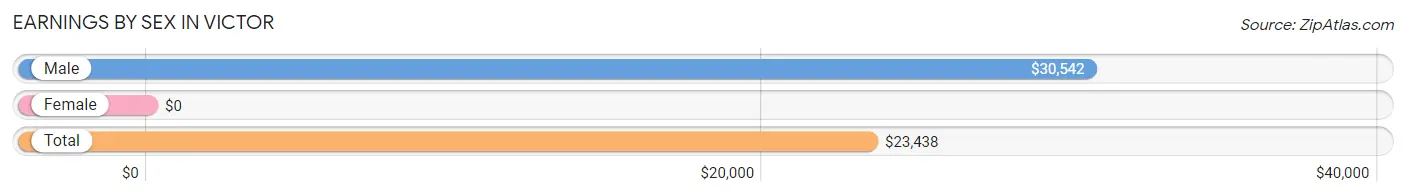
Earnings by Sex in Victor
| Sex | Number | Average Earnings |
| Male | 185 (41.1%) | $30,542 |
| Female | 265 (58.9%) | $0 |
| Total | 450 (100.0%) | $23,438 |
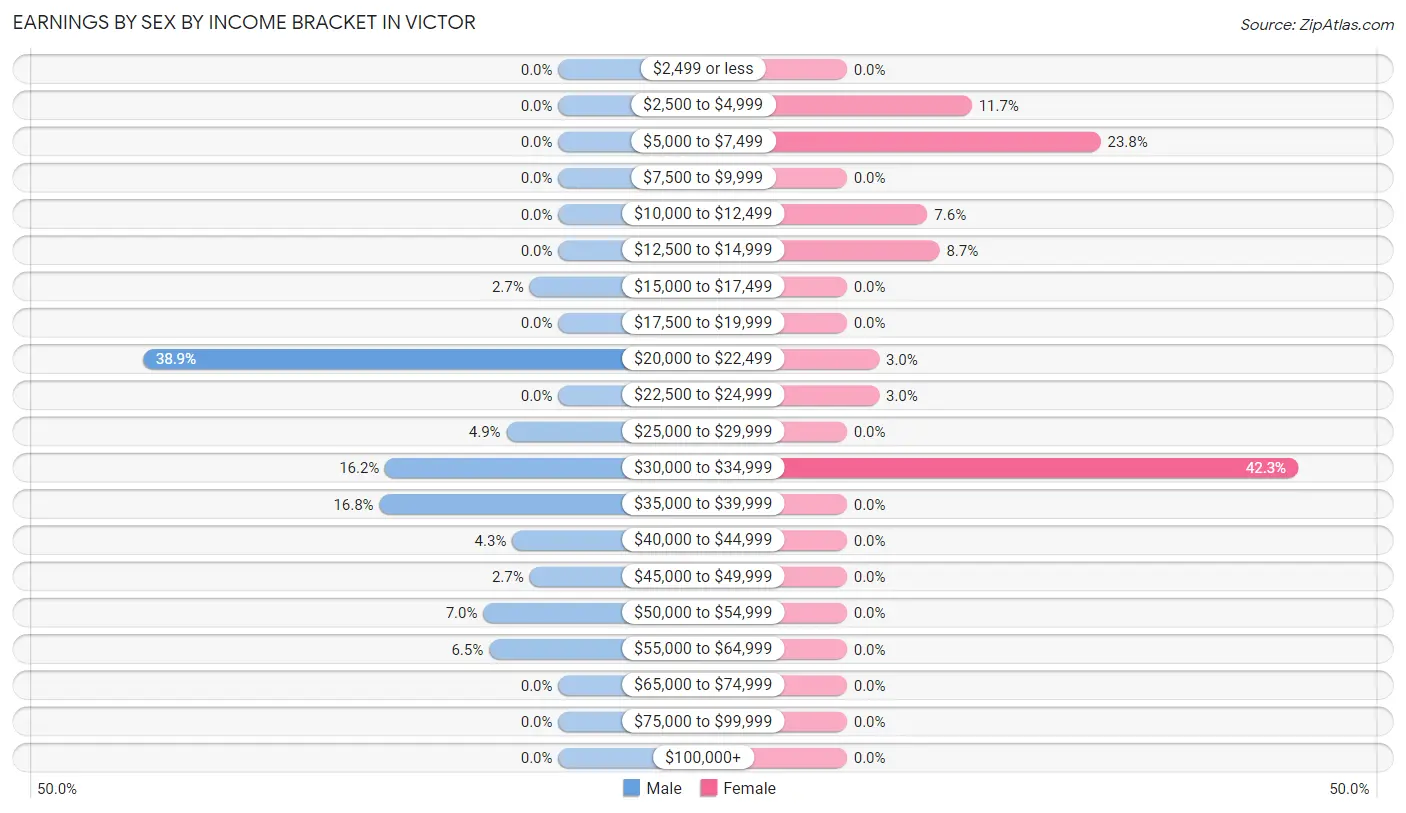
Earnings by Sex by Income Bracket in Victor
The most common earnings brackets in Victor are $20,000 to $22,499 for men (72 | 38.9%) and $30,000 to $34,999 for women (112 | 42.3%).
| Income | Male | Female |
| $2,499 or less | 0 (0.0%) | 0 (0.0%) |
| $2,500 to $4,999 | 0 (0.0%) | 31 (11.7%) |
| $5,000 to $7,499 | 0 (0.0%) | 63 (23.8%) |
| $7,500 to $9,999 | 0 (0.0%) | 0 (0.0%) |
| $10,000 to $12,499 | 0 (0.0%) | 20 (7.5%) |
| $12,500 to $14,999 | 0 (0.0%) | 23 (8.7%) |
| $15,000 to $17,499 | 5 (2.7%) | 0 (0.0%) |
| $17,500 to $19,999 | 0 (0.0%) | 0 (0.0%) |
| $20,000 to $22,499 | 72 (38.9%) | 8 (3.0%) |
| $22,500 to $24,999 | 0 (0.0%) | 8 (3.0%) |
| $25,000 to $29,999 | 9 (4.9%) | 0 (0.0%) |
| $30,000 to $34,999 | 30 (16.2%) | 112 (42.3%) |
| $35,000 to $39,999 | 31 (16.8%) | 0 (0.0%) |
| $40,000 to $44,999 | 8 (4.3%) | 0 (0.0%) |
| $45,000 to $49,999 | 5 (2.7%) | 0 (0.0%) |
| $50,000 to $54,999 | 13 (7.0%) | 0 (0.0%) |
| $55,000 to $64,999 | 12 (6.5%) | 0 (0.0%) |
| $65,000 to $74,999 | 0 (0.0%) | 0 (0.0%) |
| $75,000 to $99,999 | 0 (0.0%) | 0 (0.0%) |
| $100,000+ | 0 (0.0%) | 0 (0.0%) |
| Total | 185 (100.0%) | 265 (100.0%) |
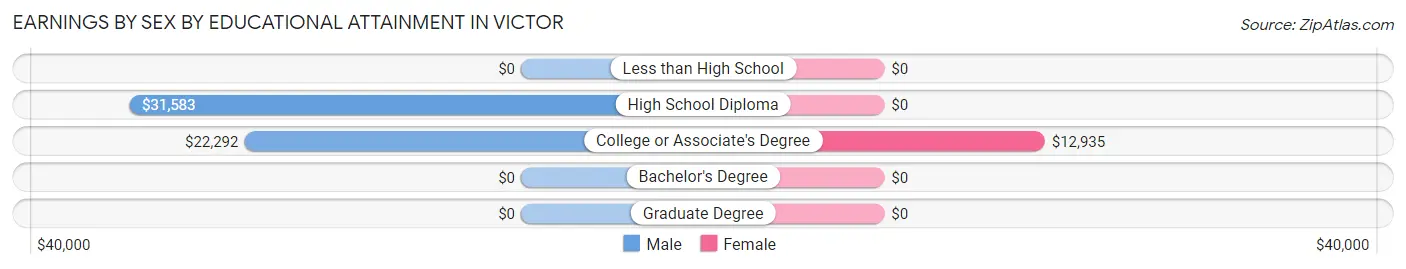
Earnings by Sex by Educational Attainment in Victor
Average earnings in Victor are $30,542 for men and $23,438 for women, a difference of 23.3%. Men with an educational attainment of high school diploma enjoy the highest average annual earnings of $31,583, while those with college or associate's degree education earn the least with $22,292. Women with an educational attainment of college or associate's degree earn the most with the average annual earnings of $12,935, while those with college or associate's degree education have the smallest earnings of $12,935.
| Educational Attainment | Male Income | Female Income |
| Less than High School | - | - |
| High School Diploma | $31,583 | $0 |
| College or Associate's Degree | $22,292 | $12,935 |
| Bachelor's Degree | - | - |
| Graduate Degree | - | - |
| Total | $30,542 | $23,438 |
Family Income in Victor
Family Income Brackets in Victor
According to the Victor family income data, there are 78 families falling into the $50,000 to $74,999 income range, which is the most common income bracket and makes up 40.8% of all families.
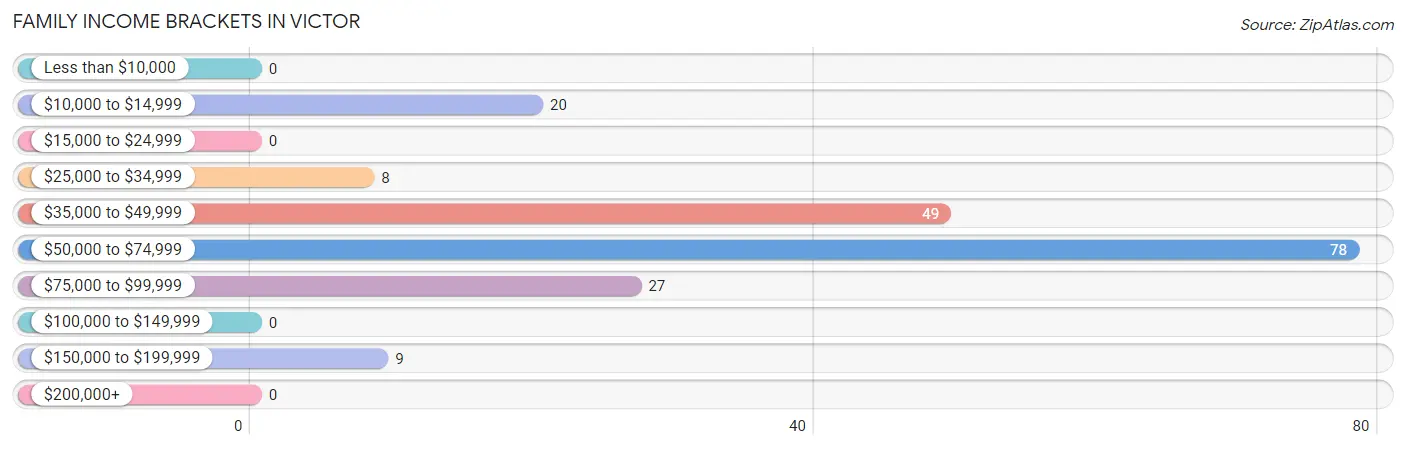
| Income Bracket | # Families | % Families |
| Less than $10,000 | 0 | 0.0% |
| $10,000 to $14,999 | 20 | 10.5% |
| $15,000 to $24,999 | 0 | 0.0% |
| $25,000 to $34,999 | 8 | 4.2% |
| $35,000 to $49,999 | 49 | 25.7% |
| $50,000 to $74,999 | 78 | 40.8% |
| $75,000 to $99,999 | 27 | 14.1% |
| $100,000 to $149,999 | 0 | 0.0% |
| $150,000 to $199,999 | 9 | 4.7% |
| $200,000+ | 0 | 0.0% |
Family Income by Famaliy Size in Victor
2-person families (53 | 27.8%) account for the highest median family income in Victor with $90,880 per family, while 2-person families (53 | 27.8%) have the highest median income of $45,440 per family member.
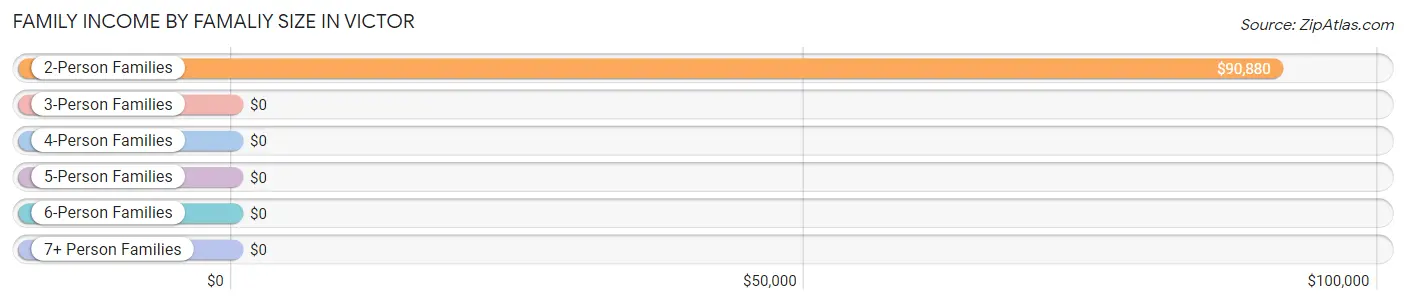
| Income Bracket | # Families | Median Income |
| 2-Person Families | 53 (27.8%) | $90,880 |
| 3-Person Families | 42 (22.0%) | $0 |
| 4-Person Families | 48 (25.1%) | $0 |
| 5-Person Families | 48 (25.1%) | $0 |
| 6-Person Families | 0 (0.0%) | $0 |
| 7+ Person Families | 0 (0.0%) | $0 |
| Total | 191 (100.0%) | $57,974 |
Family Income by Number of Earners in Victor
| Number of Earners | # Families | Median Income |
| No Earners | 10 (5.2%) | $0 |
| 1 Earner | 68 (35.6%) | $0 |
| 2 Earners | 84 (44.0%) | $0 |
| 3+ Earners | 29 (15.2%) | $0 |
| Total | 191 (100.0%) | $57,974 |
Household Income in Victor
Household Income Brackets in Victor
With 98 households falling in the category, the $50,000 to $74,999 income range is the most frequent in Victor, accounting for 30.9% of all households.
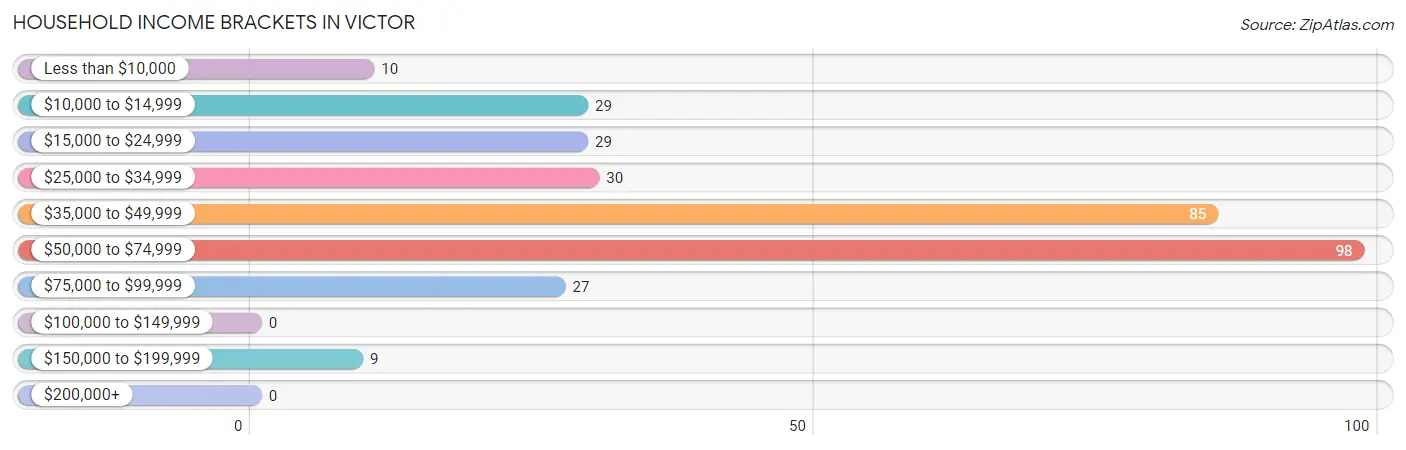
| Income Bracket | # Households | % Households |
| Less than $10,000 | 10 | 3.2% |
| $10,000 to $14,999 | 29 | 9.1% |
| $15,000 to $24,999 | 29 | 9.1% |
| $25,000 to $34,999 | 30 | 9.5% |
| $35,000 to $49,999 | 85 | 26.8% |
| $50,000 to $74,999 | 98 | 30.9% |
| $75,000 to $99,999 | 27 | 8.5% |
| $100,000 to $149,999 | 0 | 0.0% |
| $150,000 to $199,999 | 9 | 2.8% |
| $200,000+ | 0 | 0.0% |
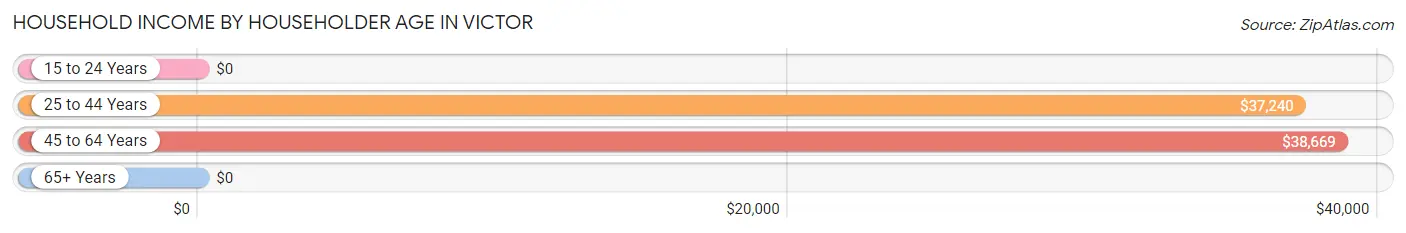
Household Income by Householder Age in Victor
The median household income in Victor is $38,427, with the highest median household income of $38,669 found in the 45 to 64 years age bracket for the primary householder. A total of 99 households (31.2%) fall into this category.
| Income Bracket | # Households | Median Income |
| 15 to 24 Years | 0 (0.0%) | $0 |
| 25 to 44 Years | 126 (39.8%) | $37,240 |
| 45 to 64 Years | 99 (31.2%) | $38,669 |
| 65+ Years | 92 (29.0%) | $0 |
| Total | 317 (100.0%) | $38,427 |
Poverty in Victor
Income Below Poverty by Sex and Age in Victor
With 12.2% poverty level for males and 16.5% for females among the residents of Victor, 25 to 34 year old males and 6 to 11 year old females are the most vulnerable to poverty, with 18 males (69.2%) and 23 females (74.2%) in their respective age groups living below the poverty level.
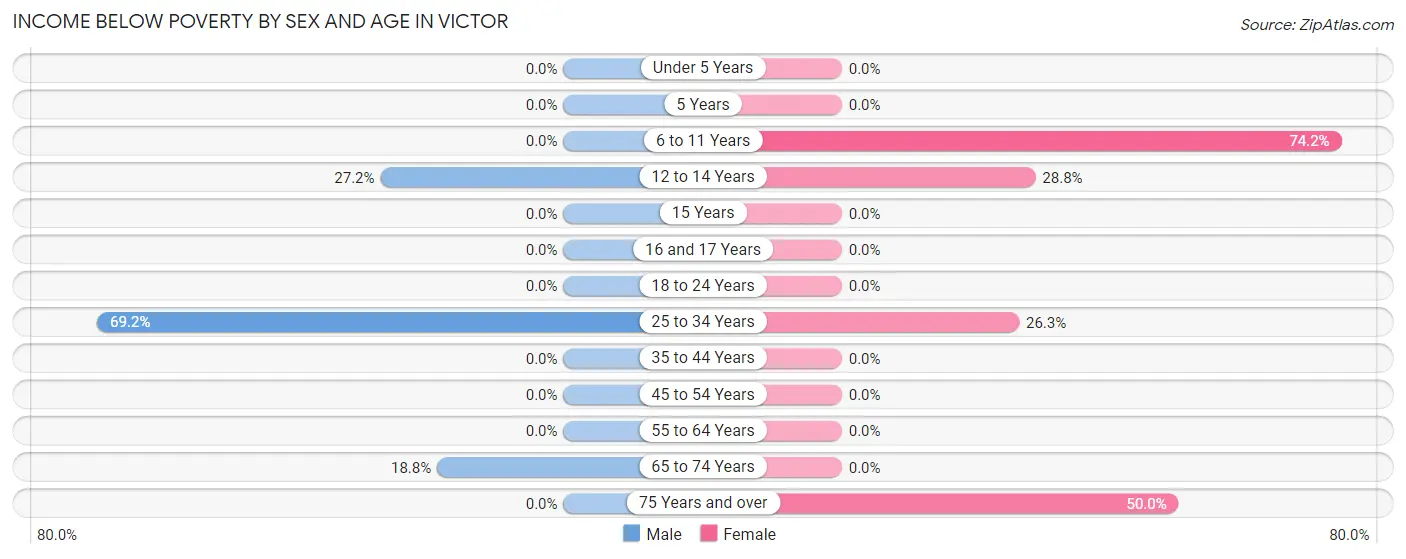
| Age Bracket | Male | Female |
| Under 5 Years | 0 (0.0%) | 0 (0.0%) |
| 5 Years | 0 (0.0%) | 0 (0.0%) |
| 6 to 11 Years | 0 (0.0%) | 23 (74.2%) |
| 12 to 14 Years | 25 (27.2%) | 23 (28.7%) |
| 15 Years | 0 (0.0%) | 0 (0.0%) |
| 16 and 17 Years | 0 (0.0%) | 0 (0.0%) |
| 18 to 24 Years | 0 (0.0%) | 0 (0.0%) |
| 25 to 34 Years | 18 (69.2%) | 20 (26.3%) |
| 35 to 44 Years | 0 (0.0%) | 0 (0.0%) |
| 45 to 54 Years | 0 (0.0%) | 0 (0.0%) |
| 55 to 64 Years | 0 (0.0%) | 0 (0.0%) |
| 65 to 74 Years | 9 (18.8%) | 0 (0.0%) |
| 75 Years and over | 0 (0.0%) | 10 (50.0%) |
| Total | 52 (12.2%) | 76 (16.5%) |
Income Above Poverty by Sex and Age in Victor
According to the poverty statistics in Victor, males aged under 5 years and females aged 16 and 17 years are the age groups that are most secure financially, with 100.0% of males and 100.0% of females in these age groups living above the poverty line.
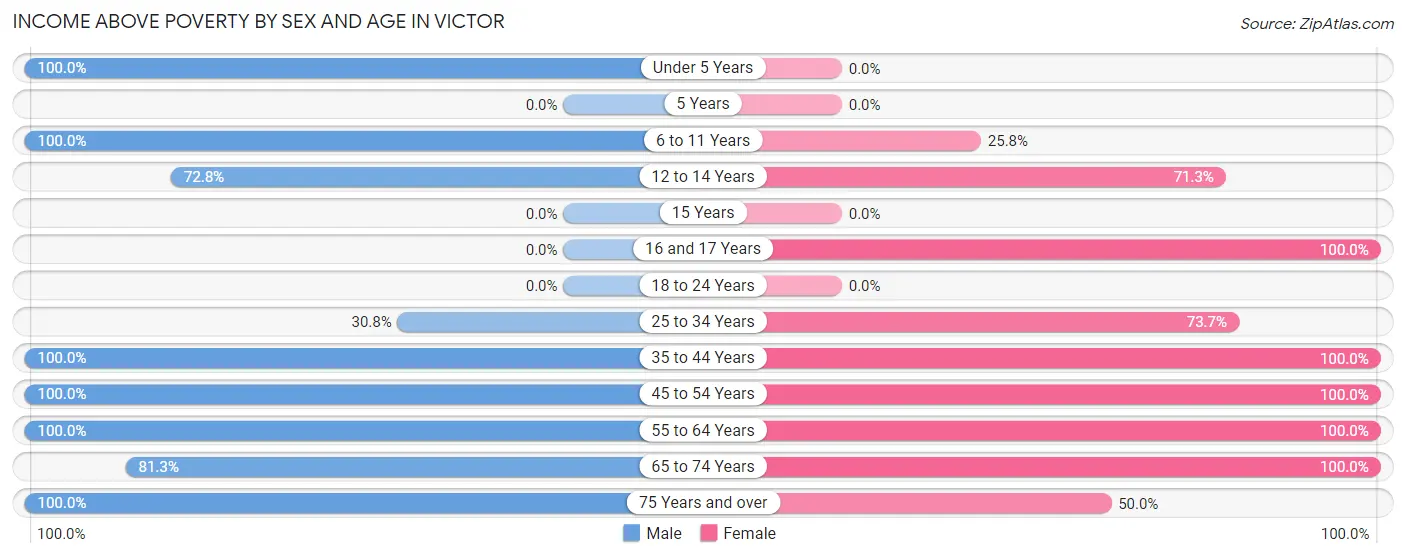
| Age Bracket | Male | Female |
| Under 5 Years | 21 (100.0%) | 0 (0.0%) |
| 5 Years | 0 (0.0%) | 0 (0.0%) |
| 6 to 11 Years | 40 (100.0%) | 8 (25.8%) |
| 12 to 14 Years | 67 (72.8%) | 57 (71.3%) |
| 15 Years | 0 (0.0%) | 0 (0.0%) |
| 16 and 17 Years | 0 (0.0%) | 31 (100.0%) |
| 18 to 24 Years | 0 (0.0%) | 0 (0.0%) |
| 25 to 34 Years | 8 (30.8%) | 56 (73.7%) |
| 35 to 44 Years | 94 (100.0%) | 83 (100.0%) |
| 45 to 54 Years | 36 (100.0%) | 63 (100.0%) |
| 55 to 64 Years | 35 (100.0%) | 53 (100.0%) |
| 65 to 74 Years | 39 (81.2%) | 23 (100.0%) |
| 75 Years and over | 33 (100.0%) | 10 (50.0%) |
| Total | 373 (87.8%) | 384 (83.5%) |
Income Below Poverty Among Married-Couple Families in Victor
The poverty statistics for married-couple families in Victor show that 18.9% or 20 of the total 106 families live below the poverty line. Families with 3 or 4 children have the highest poverty rate of 100.0%, comprising of 20 families. On the other hand, families with no children have the lowest poverty rate of 0.0%, which includes 0 families.
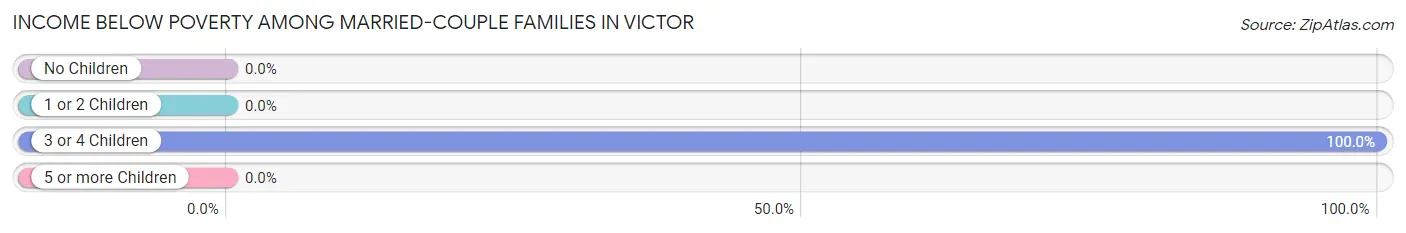
| Children | Above Poverty | Below Poverty |
| No Children | 44 (100.0%) | 0 (0.0%) |
| 1 or 2 Children | 42 (100.0%) | 0 (0.0%) |
| 3 or 4 Children | 0 (0.0%) | 20 (100.0%) |
| 5 or more Children | 0 (0.0%) | 0 (0.0%) |
| Total | 86 (81.1%) | 20 (18.9%) |
Income Below Poverty Among Single-Parent Households in Victor
| Children | Single Father | Single Mother |
| No Children | 0 (0.0%) | 0 (0.0%) |
| 1 or 2 Children | 0 (0.0%) | 0 (0.0%) |
| 3 or 4 Children | 0 (0.0%) | 0 (0.0%) |
| 5 or more Children | 0 (0.0%) | 0 (0.0%) |
| Total | 0 (0.0%) | 0 (0.0%) |
Income Below Poverty Among Married-Couple vs Single-Parent Households in Victor
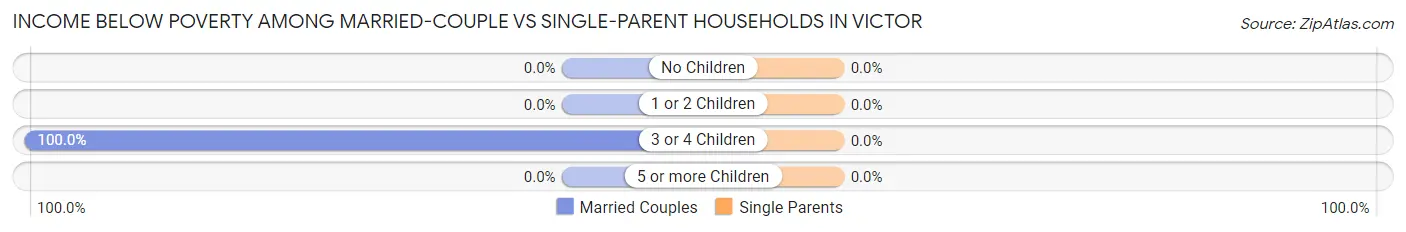
| Children | Married-Couple Families | Single-Parent Households |
| No Children | 0 (0.0%) | 0 (0.0%) |
| 1 or 2 Children | 0 (0.0%) | 0 (0.0%) |
| 3 or 4 Children | 20 (100.0%) | 0 (0.0%) |
| 5 or more Children | 0 (0.0%) | 0 (0.0%) |
| Total | 20 (18.9%) | 0 (0.0%) |
Race in Victor
The most populous races in Victor are White / Caucasian (650 | 73.5%), and Two or more Races (235 | 26.6%).
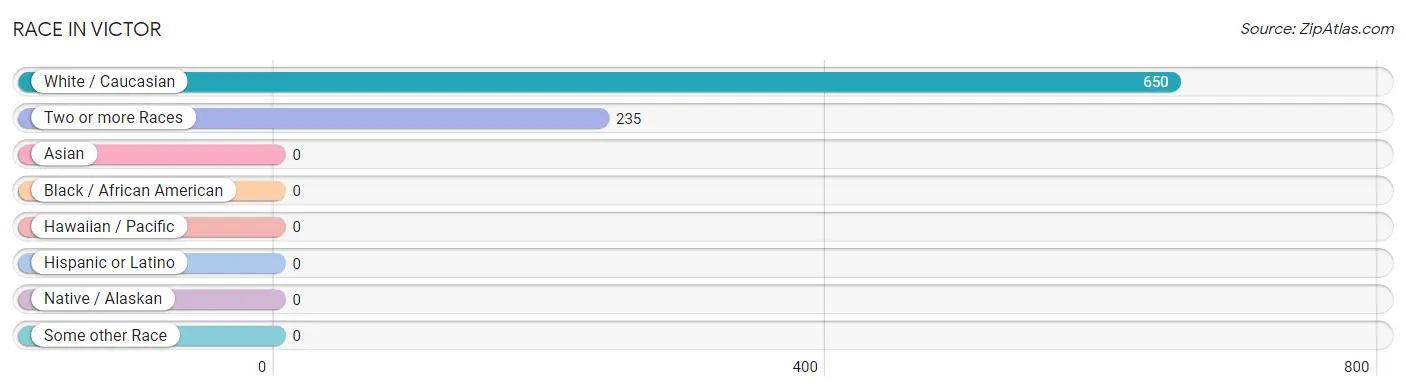
| Race | # Population | % Population |
| Asian | 0 | 0.0% |
| Black / African American | 0 | 0.0% |
| Hawaiian / Pacific | 0 | 0.0% |
| Hispanic or Latino | 0 | 0.0% |
| Native / Alaskan | 0 | 0.0% |
| White / Caucasian | 650 | 73.5% |
| Two or more Races | 235 | 26.6% |
| Some other Race | 0 | 0.0% |
| Total | 885 | 100.0% |
Ancestry in Victor
The most populous ancestries reported in Victor are Irish (132 | 14.9%), English (128 | 14.5%), Norwegian (110 | 12.4%), German (65 | 7.3%), and Scotch-Irish (53 | 6.0%), together accounting for 55.1% of all Victor residents.
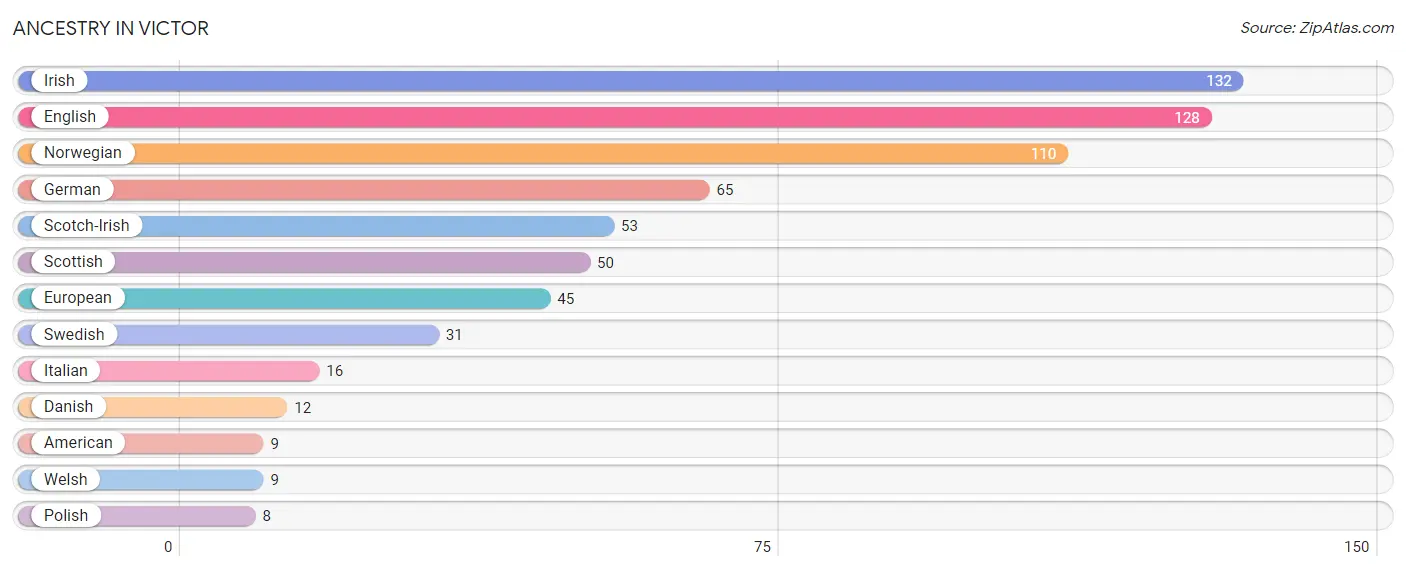
| Ancestry | # Population | % Population |
| American | 9 | 1.0% |
| Danish | 12 | 1.4% |
| English | 128 | 14.5% |
| European | 45 | 5.1% |
| German | 65 | 7.3% |
| Irish | 132 | 14.9% |
| Italian | 16 | 1.8% |
| Norwegian | 110 | 12.4% |
| Polish | 8 | 0.9% |
| Scotch-Irish | 53 | 6.0% |
| Scottish | 50 | 5.7% |
| Swedish | 31 | 3.5% |
| Welsh | 9 | 1.0% | View All 13 Rows |
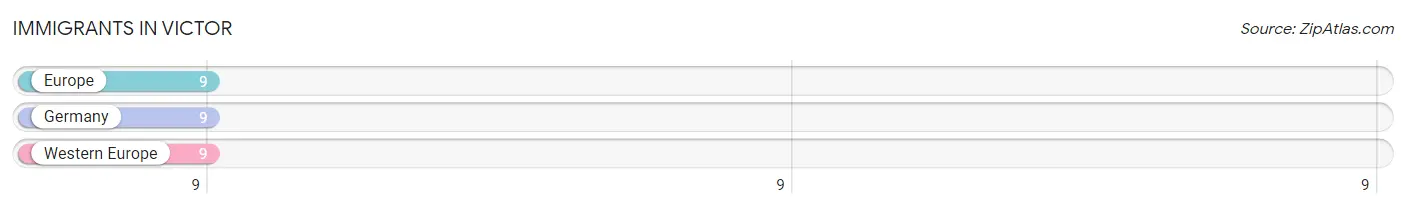
Immigrants in Victor
The most numerous immigrant groups reported in Victor came from Europe (9 | 1.0%), Germany (9 | 1.0%), and Western Europe (9 | 1.0%), together accounting for 3.1% of all Victor residents.
| Immigration Origin | # Population | % Population |
| Europe | 9 | 1.0% |
| Germany | 9 | 1.0% |
| Western Europe | 9 | 1.0% | View All 3 Rows |
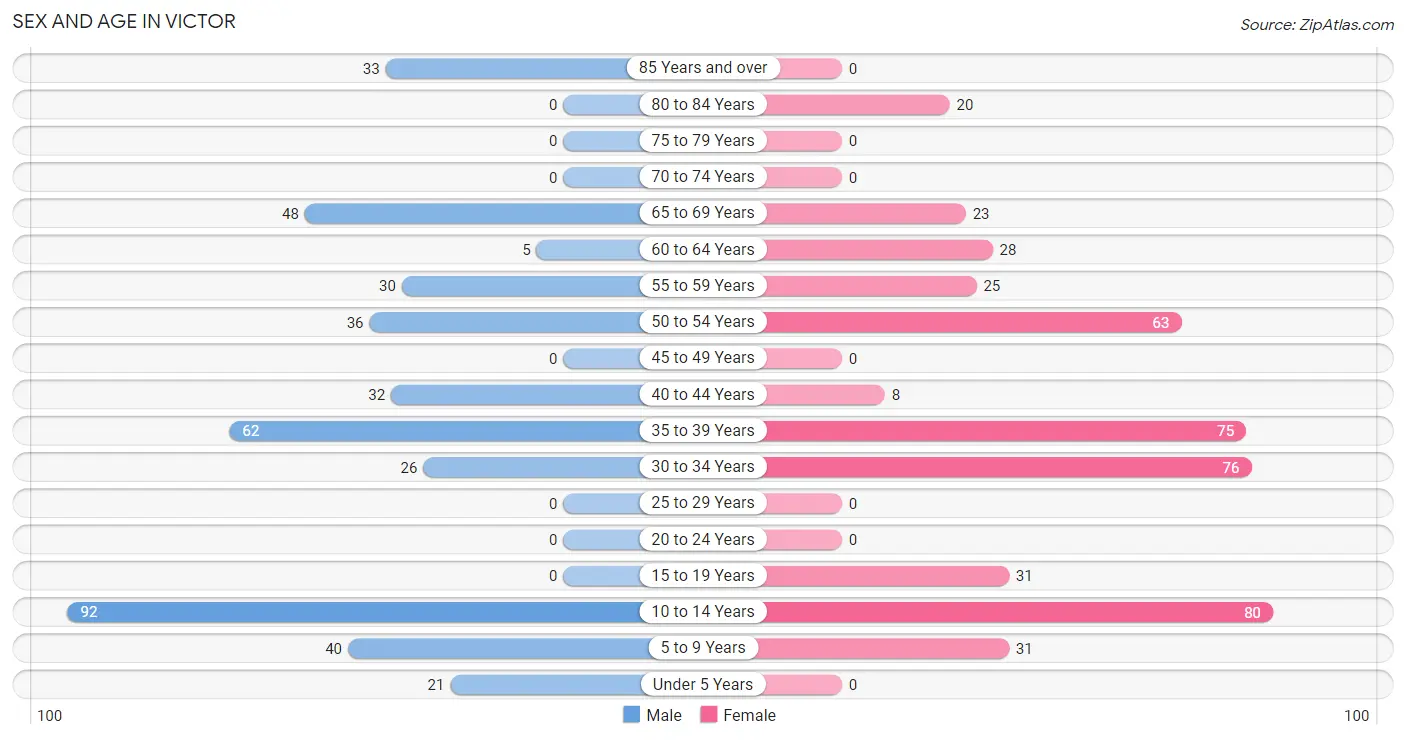
Sex and Age in Victor
Sex and Age in Victor
The most populous age groups in Victor are 10 to 14 Years (92 | 21.6%) for men and 10 to 14 Years (80 | 17.4%) for women.
| Age Bracket | Male | Female |
| Under 5 Years | 21 (4.9%) | 0 (0.0%) |
| 5 to 9 Years | 40 (9.4%) | 31 (6.7%) |
| 10 to 14 Years | 92 (21.6%) | 80 (17.4%) |
| 15 to 19 Years | 0 (0.0%) | 31 (6.7%) |
| 20 to 24 Years | 0 (0.0%) | 0 (0.0%) |
| 25 to 29 Years | 0 (0.0%) | 0 (0.0%) |
| 30 to 34 Years | 26 (6.1%) | 76 (16.5%) |
| 35 to 39 Years | 62 (14.6%) | 75 (16.3%) |
| 40 to 44 Years | 32 (7.5%) | 8 (1.7%) |
| 45 to 49 Years | 0 (0.0%) | 0 (0.0%) |
| 50 to 54 Years | 36 (8.5%) | 63 (13.7%) |
| 55 to 59 Years | 30 (7.1%) | 25 (5.4%) |
| 60 to 64 Years | 5 (1.2%) | 28 (6.1%) |
| 65 to 69 Years | 48 (11.3%) | 23 (5.0%) |
| 70 to 74 Years | 0 (0.0%) | 0 (0.0%) |
| 75 to 79 Years | 0 (0.0%) | 0 (0.0%) |
| 80 to 84 Years | 0 (0.0%) | 20 (4.3%) |
| 85 Years and over | 33 (7.8%) | 0 (0.0%) |
| Total | 425 (100.0%) | 460 (100.0%) |
Families and Households in Victor
Median Family Size in Victor
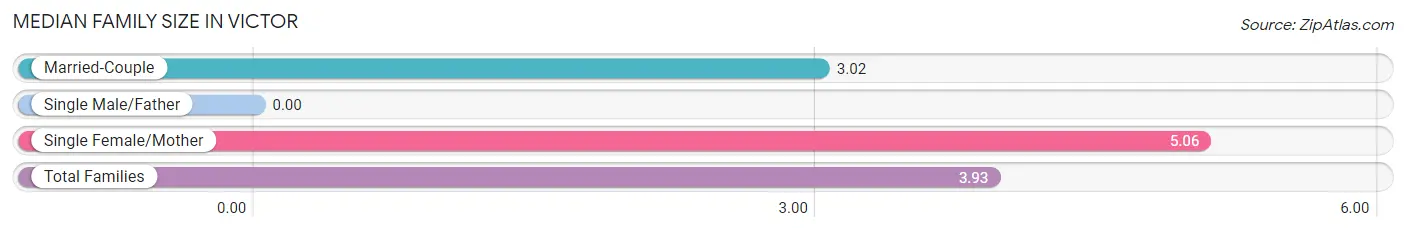
| Family Type | # Families | Family Size |
| Married-Couple | 106 (55.5%) | 3.02 |
| Single Male/Father | 0 (0.0%) | - |
| Single Female/Mother | 85 (44.5%) | 5.06 |
| Total Families | 191 (100.0%) | 3.93 |
Median Household Size in Victor
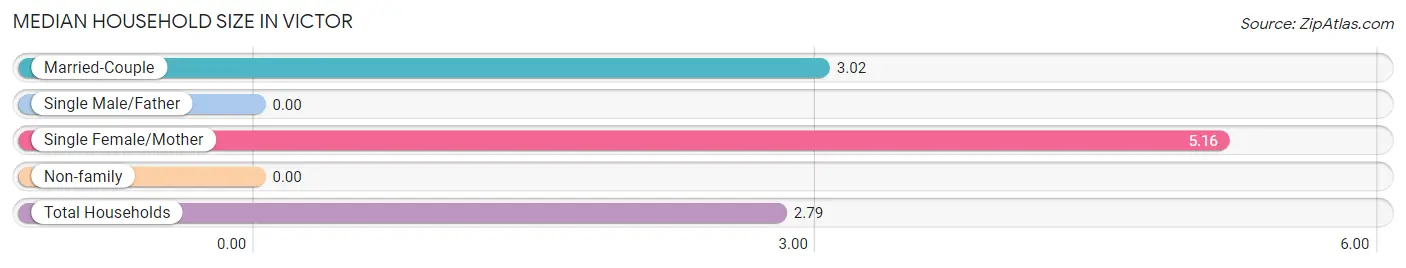
| Household Type | # Households | Household Size |
| Married-Couple | 106 (33.4%) | 3.02 |
| Single Male/Father | 0 (0.0%) | - |
| Single Female/Mother | 85 (26.8%) | 5.16 |
| Non-family | 126 (39.8%) | - |
| Total Households | 317 (100.0%) | 2.79 |
Household Size by Marriage Status in Victor
Out of a total of 317 households in Victor, 191 (60.3%) are family households, while 126 (39.8%) are nonfamily households. The most numerous type of family households are 3-person households, comprising 50, and the most common type of nonfamily households are 1-person households, comprising 126.
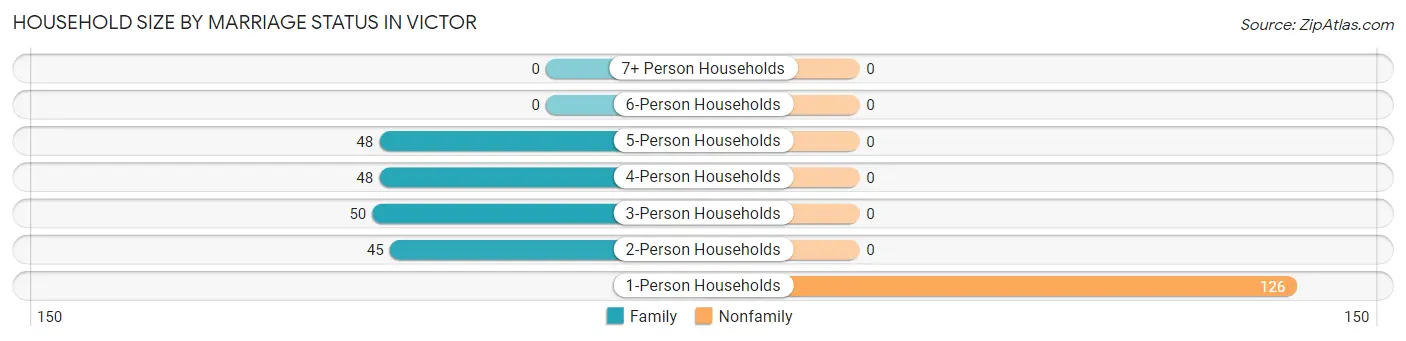
| Household Size | Family Households | Nonfamily Households |
| 1-Person Households | - | 126 (39.8%) |
| 2-Person Households | 45 (14.2%) | 0 (0.0%) |
| 3-Person Households | 50 (15.8%) | 0 (0.0%) |
| 4-Person Households | 48 (15.1%) | 0 (0.0%) |
| 5-Person Households | 48 (15.1%) | 0 (0.0%) |
| 6-Person Households | 0 (0.0%) | 0 (0.0%) |
| 7+ Person Households | 0 (0.0%) | 0 (0.0%) |
| Total | 191 (60.3%) | 126 (39.8%) |
Female Fertility in Victor
Fertility by Age in Victor
Average fertility rate in Victor is 184.0 births per 1,000 women. Women in the age bracket of 35 to 50 years have the highest fertility rate with 422.0 births per 1,000 women. Women in the age bracket of 35 to 50 years acount for 100.0% of all women with births.
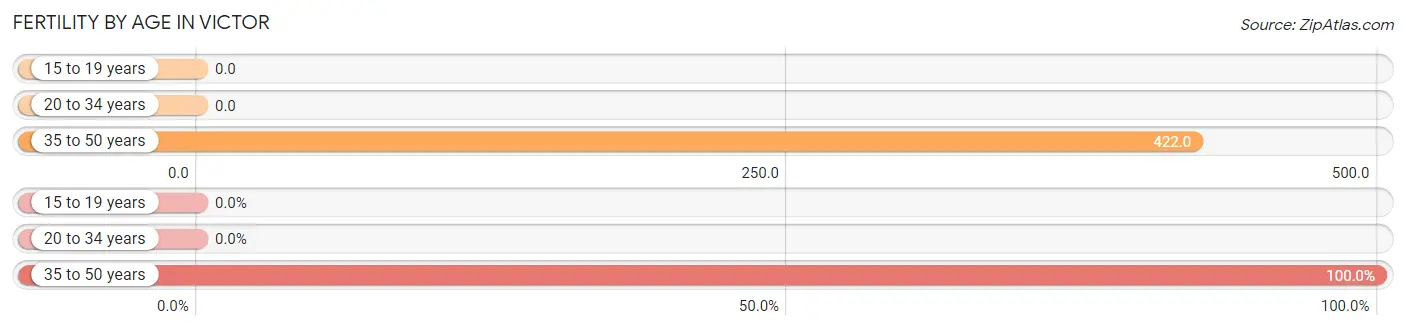
| Age Bracket | Women with Births | Births / 1,000 Women |
| 15 to 19 years | 0 (0.0%) | 0.0 |
| 20 to 34 years | 0 (0.0%) | 0.0 |
| 35 to 50 years | 35 (100.0%) | 422.0 |
| Total | 35 (100.0%) | 184.0 |
Fertility by Age by Marriage Status in Victor
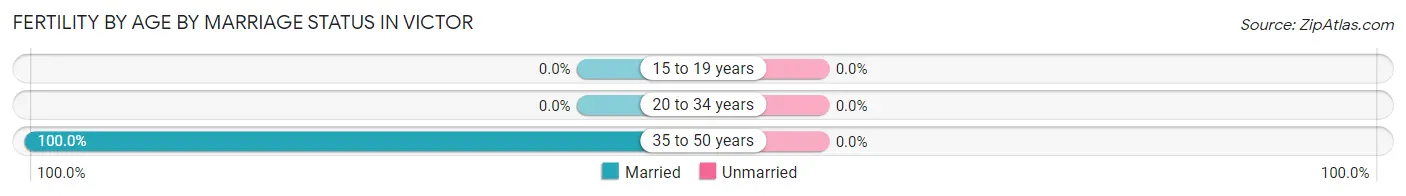
| Age Bracket | Married | Unmarried |
| 15 to 19 years | 0 (0.0%) | 0 (0.0%) |
| 20 to 34 years | 0 (0.0%) | 0 (0.0%) |
| 35 to 50 years | 35 (100.0%) | 0 (0.0%) |
| Total | 35 (100.0%) | 0 (0.0%) |
Fertility by Education in Victor
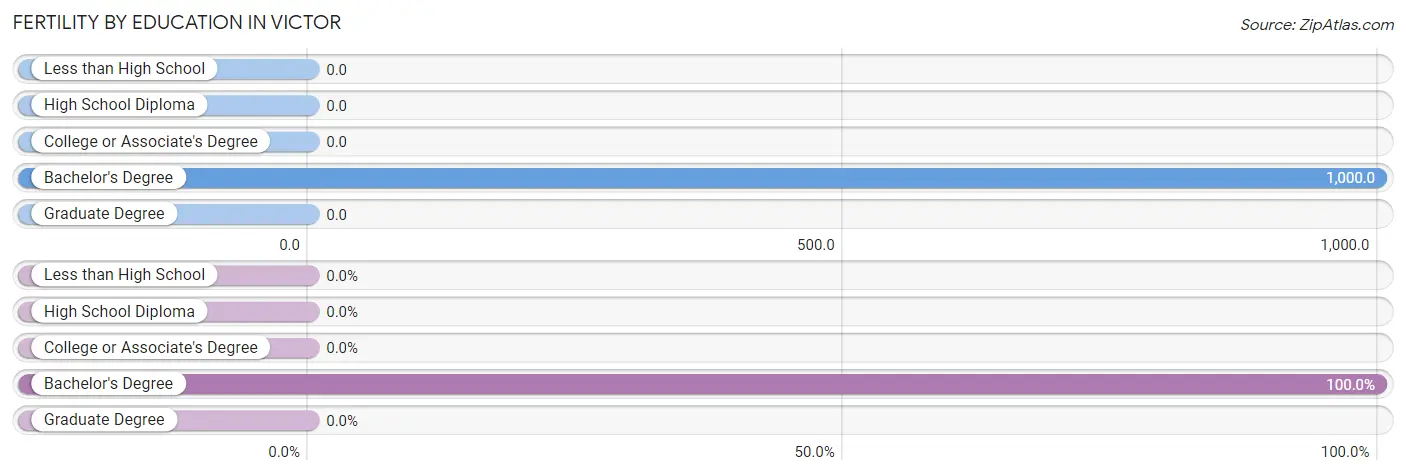
| Educational Attainment | Women with Births | Births / 1,000 Women |
| Less than High School | 0 (0.0%) | 0.0 |
| High School Diploma | 0 (0.0%) | 0.0 |
| College or Associate's Degree | 0 (0.0%) | 0.0 |
| Bachelor's Degree | 35 (100.0%) | 1,000.0 |
| Graduate Degree | 0 (0.0%) | 0.0 |
| Total | 35 (100.0%) | 184.0 |
Fertility by Education by Marriage Status in Victor
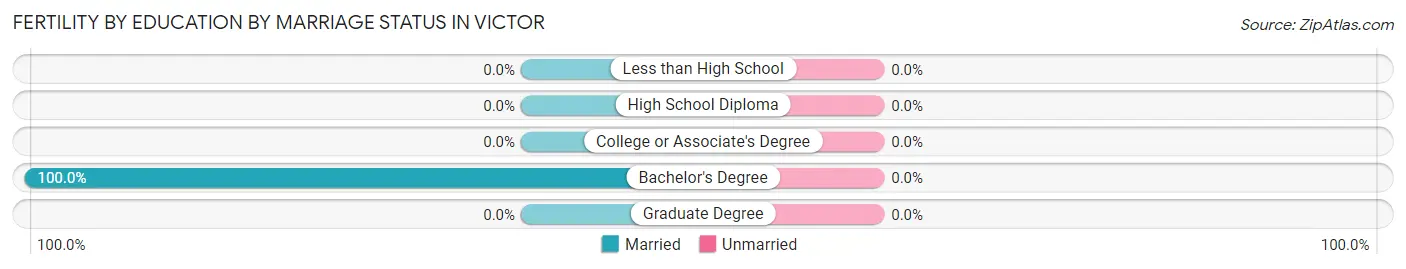
| Educational Attainment | Married | Unmarried |
| Less than High School | 0 (0.0%) | 0 (0.0%) |
| High School Diploma | 0 (0.0%) | 0 (0.0%) |
| College or Associate's Degree | 0 (0.0%) | 0 (0.0%) |
| Bachelor's Degree | 35 (100.0%) | 0 (0.0%) |
| Graduate Degree | 0 (0.0%) | 0 (0.0%) |
| Total | 35 (100.0%) | 0 (0.0%) |
Employment Characteristics in Victor
Employment by Class of Employer in Victor
Among the 450 employed individuals in Victor, private company employees (296 | 65.8%), not-for-profit organizations (106 | 23.6%), and local government employees (43 | 9.6%) make up the most common classes of employment.
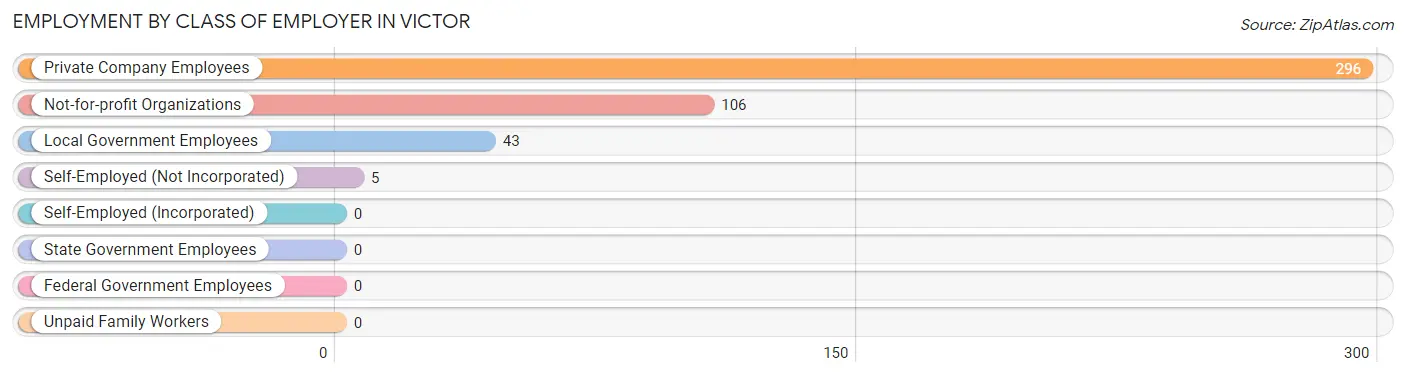
| Employer Class | # Employees | % Employees |
| Private Company Employees | 296 | 65.8% |
| Self-Employed (Incorporated) | 0 | 0.0% |
| Self-Employed (Not Incorporated) | 5 | 1.1% |
| Not-for-profit Organizations | 106 | 23.6% |
| Local Government Employees | 43 | 9.6% |
| State Government Employees | 0 | 0.0% |
| Federal Government Employees | 0 | 0.0% |
| Unpaid Family Workers | 0 | 0.0% |
| Total | 450 | 100.0% |
Employment Status by Age in Victor
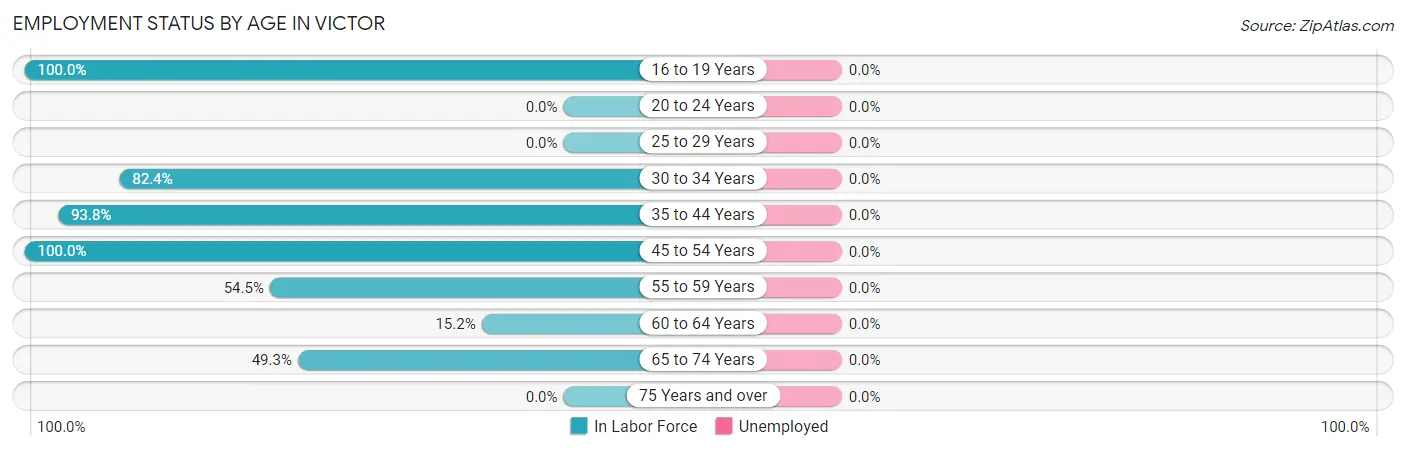
| Age Bracket | In Labor Force | Unemployed |
| 16 to 19 Years | 31 (100.0%) | 0 (0.0%) |
| 20 to 24 Years | 0 (0.0%) | 0 (0.0%) |
| 25 to 29 Years | 0 (0.0%) | 0 (0.0%) |
| 30 to 34 Years | 84 (82.4%) | 0 (0.0%) |
| 35 to 44 Years | 166 (93.8%) | 0 (0.0%) |
| 45 to 54 Years | 99 (100.0%) | 0 (0.0%) |
| 55 to 59 Years | 30 (54.5%) | 0 (0.0%) |
| 60 to 64 Years | 5 (15.2%) | 0 (0.0%) |
| 65 to 74 Years | 35 (49.3%) | 0 (0.0%) |
| 75 Years and over | 0 (0.0%) | 0 (0.0%) |
| Total | 450 (72.5%) | 0 (0.0%) |
Employment Status by Educational Attainment in Victor
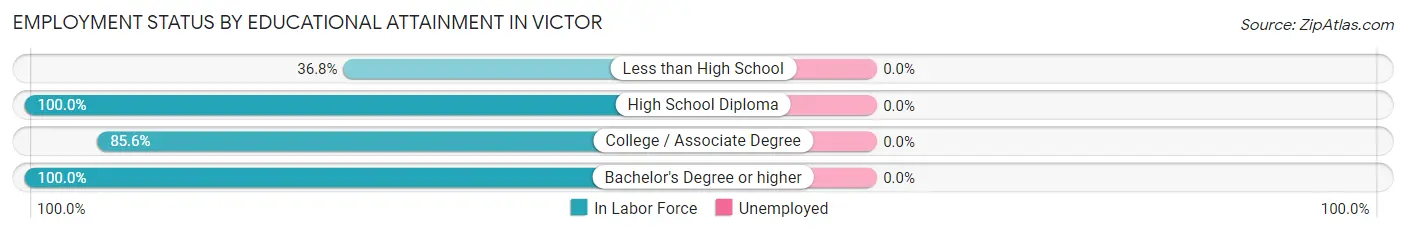
| Educational Attainment | In Labor Force | Unemployed |
| Less than High School | 25 (36.8%) | 0 (0.0%) |
| High School Diploma | 85 (100.0%) | 0 (0.0%) |
| College / Associate Degree | 231 (85.6%) | 0 (0.0%) |
| Bachelor's Degree or higher | 43 (100.0%) | 0 (0.0%) |
| Total | 384 (82.4%) | 0 (0.0%) |
Employment Occupations by Sex in Victor
Management, Business, Science and Arts Occupations
The most common Management, Business, Science and Arts occupations in Victor are Community & Social Service (43 | 9.6%), and Education Instruction & Library (43 | 9.6%).
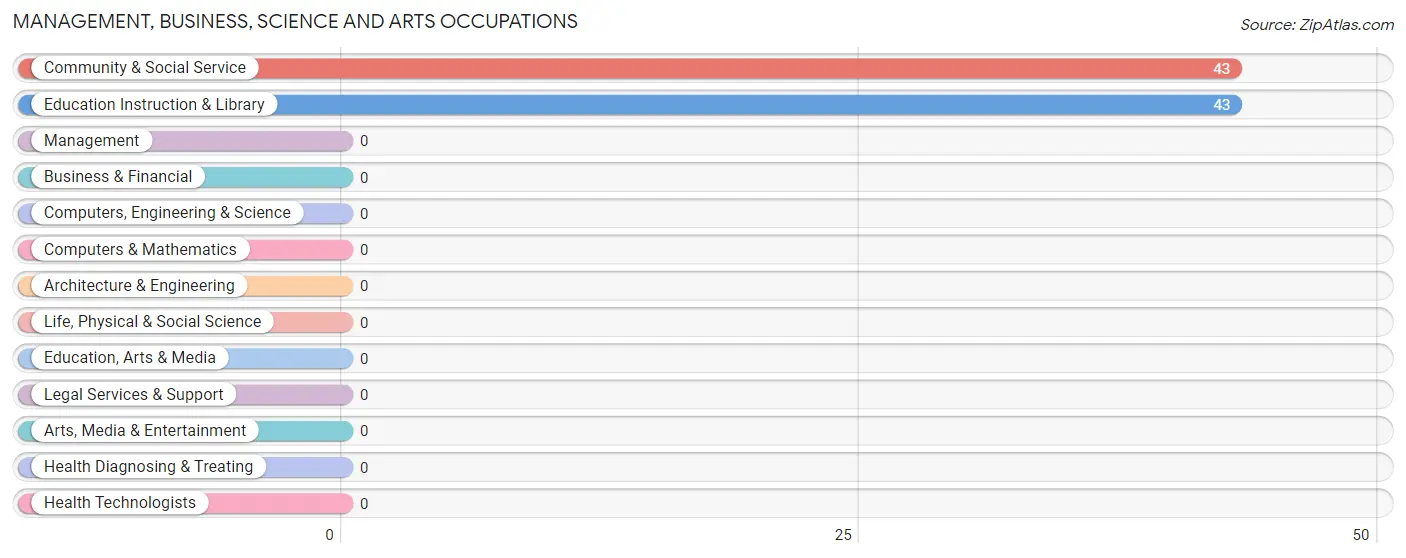
Management, Business, Science and Arts Occupations by Sex
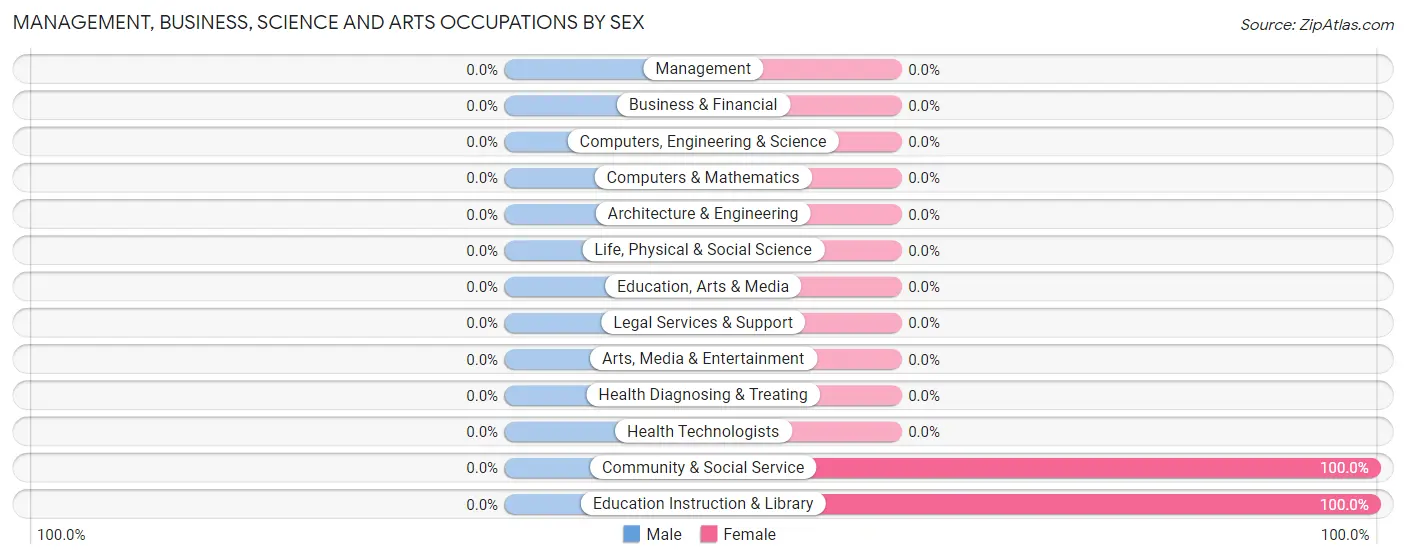
| Occupation | Male | Female |
| Management | 0 (0.0%) | 0 (0.0%) |
| Business & Financial | 0 (0.0%) | 0 (0.0%) |
| Computers, Engineering & Science | 0 (0.0%) | 0 (0.0%) |
| Computers & Mathematics | 0 (0.0%) | 0 (0.0%) |
| Architecture & Engineering | 0 (0.0%) | 0 (0.0%) |
| Life, Physical & Social Science | 0 (0.0%) | 0 (0.0%) |
| Community & Social Service | 0 (0.0%) | 43 (100.0%) |
| Education, Arts & Media | 0 (0.0%) | 0 (0.0%) |
| Legal Services & Support | 0 (0.0%) | 0 (0.0%) |
| Education Instruction & Library | 0 (0.0%) | 43 (100.0%) |
| Arts, Media & Entertainment | 0 (0.0%) | 0 (0.0%) |
| Health Diagnosing & Treating | 0 (0.0%) | 0 (0.0%) |
| Health Technologists | 0 (0.0%) | 0 (0.0%) |
| Total (Category) | 0 (0.0%) | 43 (100.0%) |
| Total (Overall) | 185 (41.1%) | 265 (58.9%) |
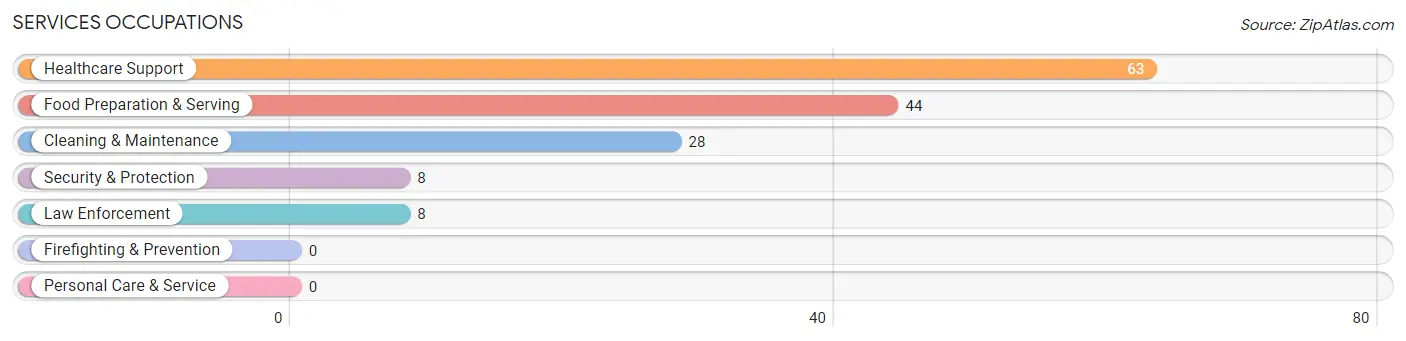
Services Occupations
The most common Services occupations in Victor are Healthcare Support (63 | 14.0%), Food Preparation & Serving (44 | 9.8%), Cleaning & Maintenance (28 | 6.2%), Security & Protection (8 | 1.8%), and Law Enforcement (8 | 1.8%).
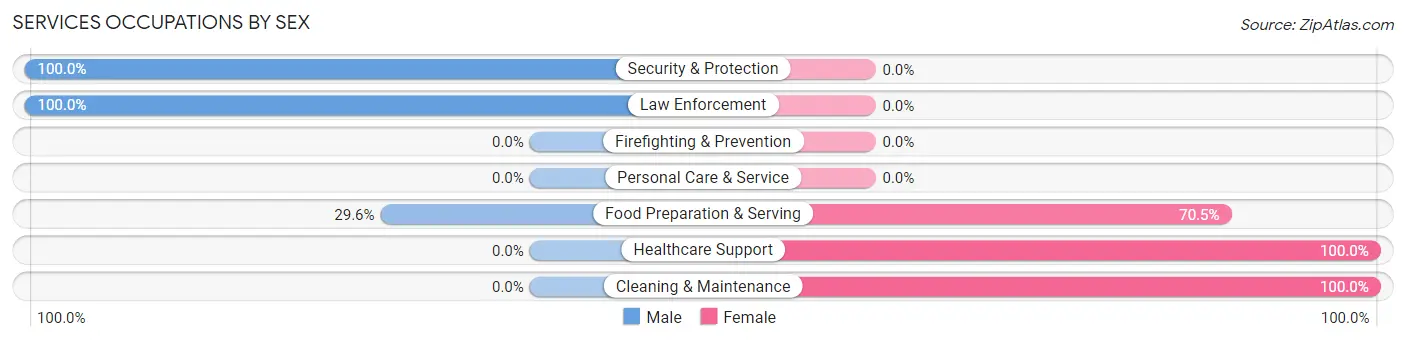
Services Occupations by Sex
Within the Services occupations in Victor, the most male-oriented occupations are Security & Protection (100.0%), Law Enforcement (100.0%), and Food Preparation & Serving (29.5%), while the most female-oriented occupations are Healthcare Support (100.0%), Cleaning & Maintenance (100.0%), and Food Preparation & Serving (70.5%).
| Occupation | Male | Female |
| Healthcare Support | 0 (0.0%) | 63 (100.0%) |
| Security & Protection | 8 (100.0%) | 0 (0.0%) |
| Firefighting & Prevention | 0 (0.0%) | 0 (0.0%) |
| Law Enforcement | 8 (100.0%) | 0 (0.0%) |
| Food Preparation & Serving | 13 (29.5%) | 31 (70.5%) |
| Cleaning & Maintenance | 0 (0.0%) | 28 (100.0%) |
| Personal Care & Service | 0 (0.0%) | 0 (0.0%) |
| Total (Category) | 21 (14.7%) | 122 (85.3%) |
| Total (Overall) | 185 (41.1%) | 265 (58.9%) |
Sales and Office Occupations
The most common Sales and Office occupations in Victor are Sales & Related (63 | 14.0%), and Office & Administration (29 | 6.4%).
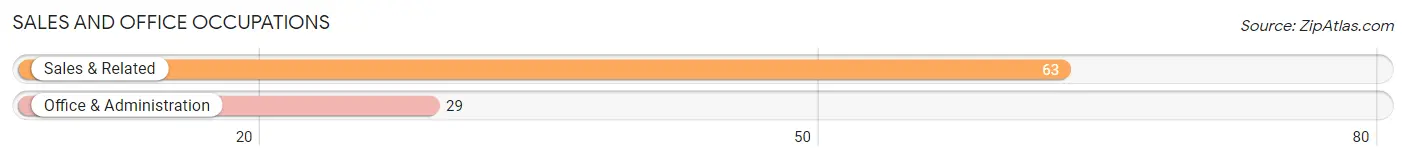
Sales and Office Occupations by Sex

| Occupation | Male | Female |
| Sales & Related | 40 (63.5%) | 23 (36.5%) |
| Office & Administration | 0 (0.0%) | 29 (100.0%) |
| Total (Category) | 40 (43.5%) | 52 (56.5%) |
| Total (Overall) | 185 (41.1%) | 265 (58.9%) |
Natural Resources, Construction and Maintenance Occupations
The most common Natural Resources, Construction and Maintenance occupations in Victor are Installation, Maintenance & Repair (73 | 16.2%), and Construction & Extraction (37 | 8.2%).
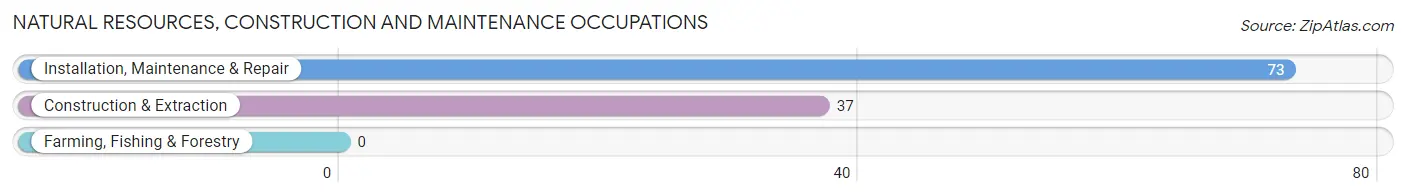
Natural Resources, Construction and Maintenance Occupations by Sex
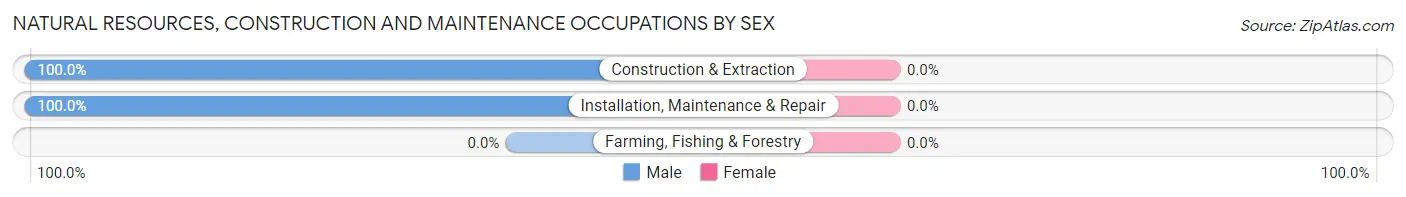
| Occupation | Male | Female |
| Farming, Fishing & Forestry | 0 (0.0%) | 0 (0.0%) |
| Construction & Extraction | 37 (100.0%) | 0 (0.0%) |
| Installation, Maintenance & Repair | 73 (100.0%) | 0 (0.0%) |
| Total (Category) | 110 (100.0%) | 0 (0.0%) |
| Total (Overall) | 185 (41.1%) | 265 (58.9%) |
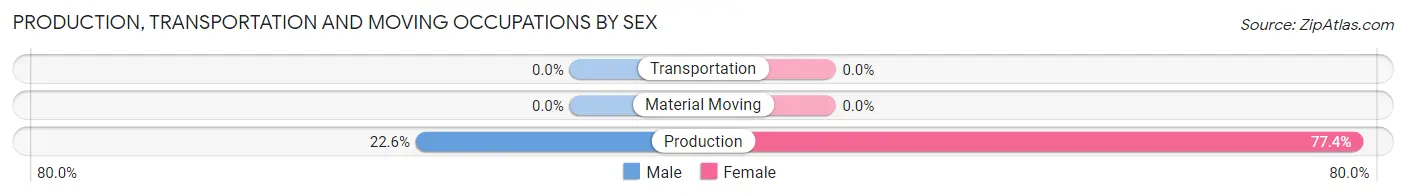
Production, Transportation and Moving Occupations
The most common Production, Transportation and Moving occupations in Victor are , and Production (62 | 13.8%).
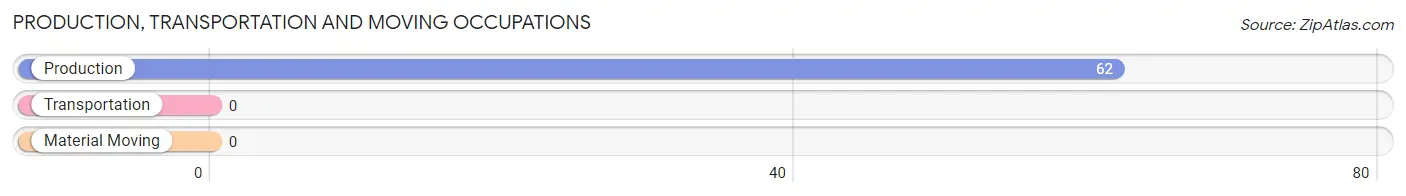
Production, Transportation and Moving Occupations by Sex
| Occupation | Male | Female |
| Production | 14 (22.6%) | 48 (77.4%) |
| Transportation | 0 (0.0%) | 0 (0.0%) |
| Material Moving | 0 (0.0%) | 0 (0.0%) |
| Total (Category) | 14 (22.6%) | 48 (77.4%) |
| Total (Overall) | 185 (41.1%) | 265 (58.9%) |
Employment Industries by Sex in Victor
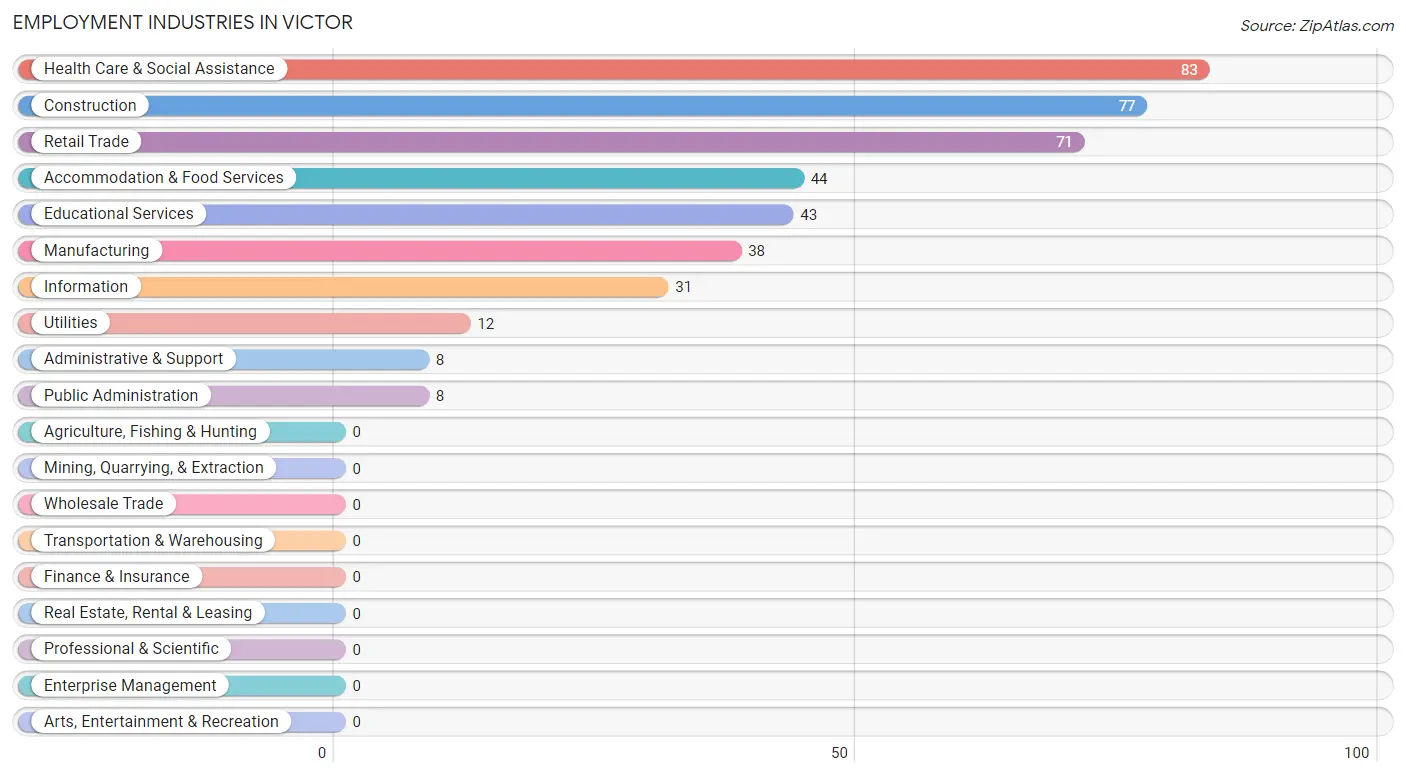
Employment Industries in Victor
The major employment industries in Victor include Health Care & Social Assistance (83 | 18.4%), Construction (77 | 17.1%), Retail Trade (71 | 15.8%), Accommodation & Food Services (44 | 9.8%), and Educational Services (43 | 9.6%).
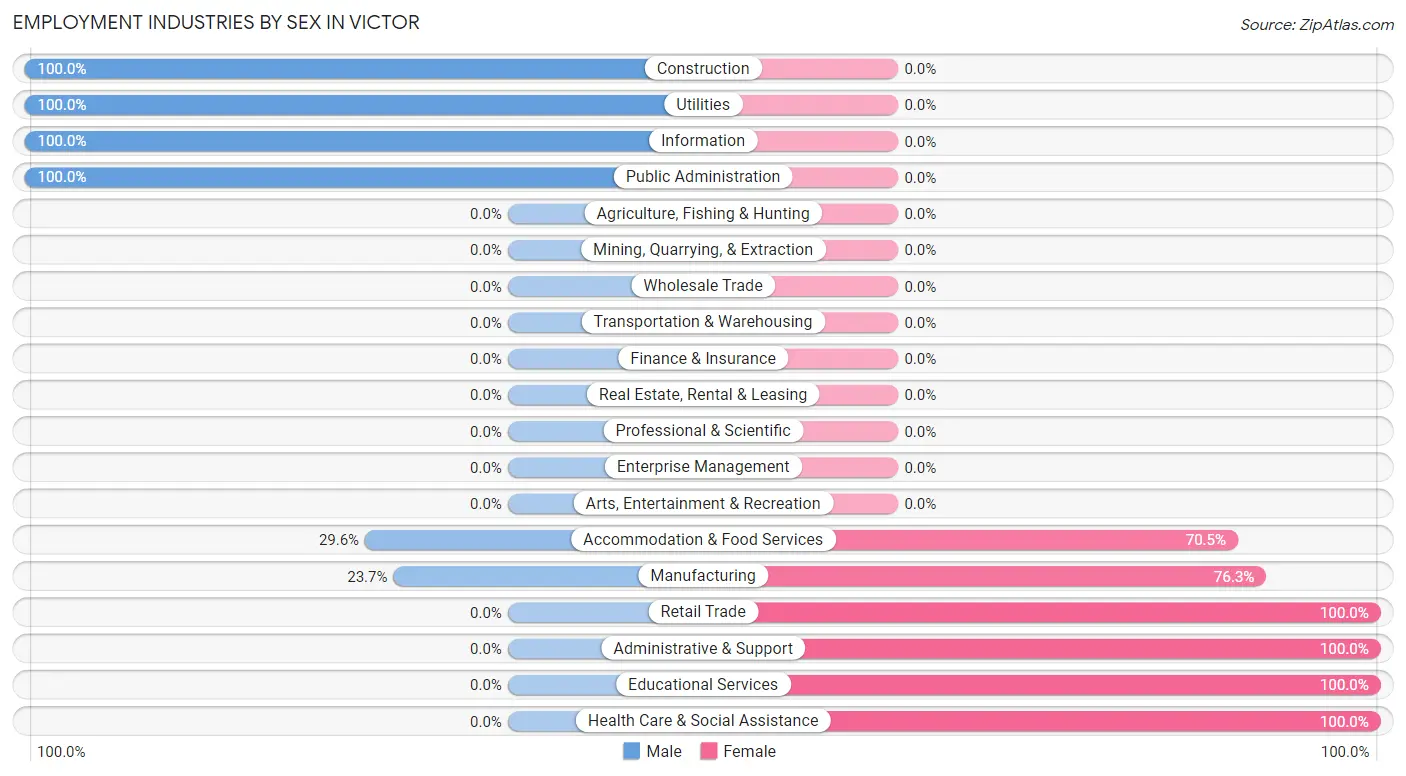
Employment Industries by Sex in Victor
The Victor industries that see more men than women are Construction (100.0%), Utilities (100.0%), and Information (100.0%), whereas the industries that tend to have a higher number of women are Retail Trade (100.0%), Administrative & Support (100.0%), and Educational Services (100.0%).
| Industry | Male | Female |
| Agriculture, Fishing & Hunting | 0 (0.0%) | 0 (0.0%) |
| Mining, Quarrying, & Extraction | 0 (0.0%) | 0 (0.0%) |
| Construction | 77 (100.0%) | 0 (0.0%) |
| Manufacturing | 9 (23.7%) | 29 (76.3%) |
| Wholesale Trade | 0 (0.0%) | 0 (0.0%) |
| Retail Trade | 0 (0.0%) | 71 (100.0%) |
| Transportation & Warehousing | 0 (0.0%) | 0 (0.0%) |
| Utilities | 12 (100.0%) | 0 (0.0%) |
| Information | 31 (100.0%) | 0 (0.0%) |
| Finance & Insurance | 0 (0.0%) | 0 (0.0%) |
| Real Estate, Rental & Leasing | 0 (0.0%) | 0 (0.0%) |
| Professional & Scientific | 0 (0.0%) | 0 (0.0%) |
| Enterprise Management | 0 (0.0%) | 0 (0.0%) |
| Administrative & Support | 0 (0.0%) | 8 (100.0%) |
| Educational Services | 0 (0.0%) | 43 (100.0%) |
| Health Care & Social Assistance | 0 (0.0%) | 83 (100.0%) |
| Arts, Entertainment & Recreation | 0 (0.0%) | 0 (0.0%) |
| Accommodation & Food Services | 13 (29.5%) | 31 (70.5%) |
| Public Administration | 8 (100.0%) | 0 (0.0%) |
| Total | 185 (41.1%) | 265 (58.9%) |
Education in Victor
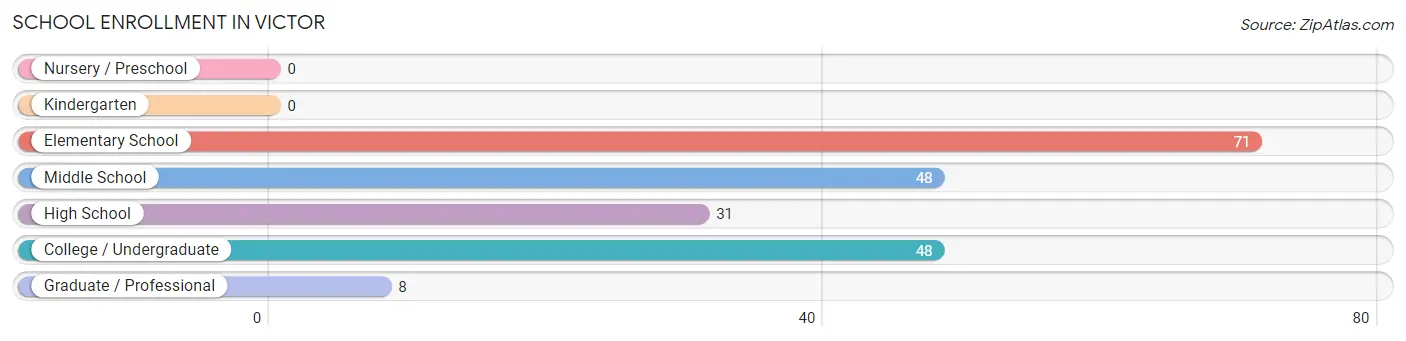
School Enrollment in Victor
The most common levels of schooling among the 206 students in Victor are elementary school (71 | 34.5%), middle school (48 | 23.3%), and college / undergraduate (48 | 23.3%).
| School Level | # Students | % Students |
| Nursery / Preschool | 0 | 0.0% |
| Kindergarten | 0 | 0.0% |
| Elementary School | 71 | 34.5% |
| Middle School | 48 | 23.3% |
| High School | 31 | 15.0% |
| College / Undergraduate | 48 | 23.3% |
| Graduate / Professional | 8 | 3.9% |
| Total | 206 | 100.0% |
School Enrollment by Age by Funding Source in Victor
Out of a total of 206 students who are enrolled in schools in Victor, 48 (23.3%) attend a private institution, while the remaining 158 (76.7%) are enrolled in public schools. The age group of 25 to 34 year olds has the highest likelihood of being enrolled in private schools, with 48 (85.7% in the age bracket) enrolled. Conversely, the age group of 5 to 9 year old has the lowest likelihood of being enrolled in a private school, with 71 (100.0% in the age bracket) attending a public institution.
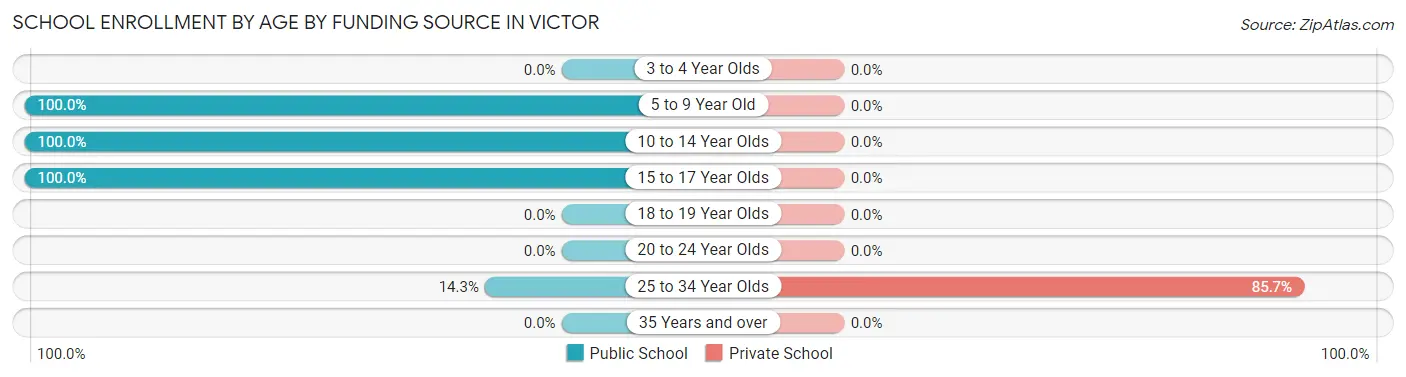
| Age Bracket | Public School | Private School |
| 3 to 4 Year Olds | 0 (0.0%) | 0 (0.0%) |
| 5 to 9 Year Old | 71 (100.0%) | 0 (0.0%) |
| 10 to 14 Year Olds | 48 (100.0%) | 0 (0.0%) |
| 15 to 17 Year Olds | 31 (100.0%) | 0 (0.0%) |
| 18 to 19 Year Olds | 0 (0.0%) | 0 (0.0%) |
| 20 to 24 Year Olds | 0 (0.0%) | 0 (0.0%) |
| 25 to 34 Year Olds | 8 (14.3%) | 48 (85.7%) |
| 35 Years and over | 0 (0.0%) | 0 (0.0%) |
| Total | 158 (76.7%) | 48 (23.3%) |
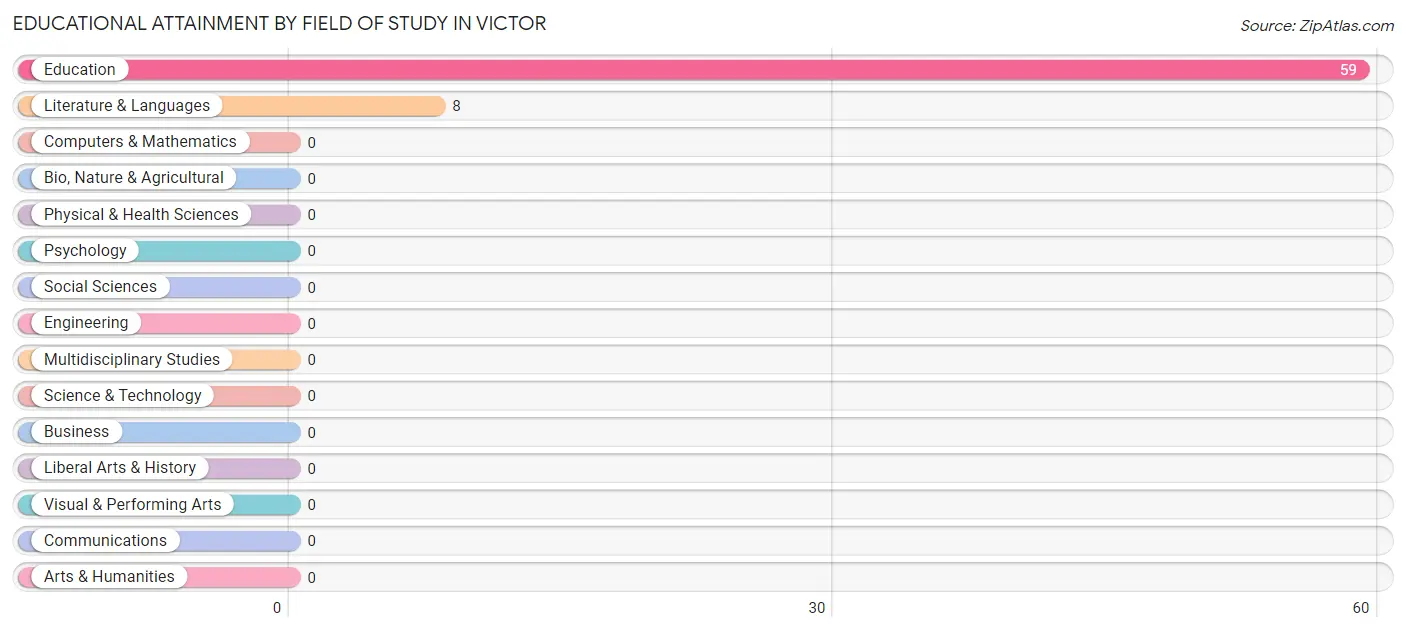
Educational Attainment by Field of Study in Victor
Education (59 | 88.1%), and literature & languages (8 | 11.9%) are the most common fields of study among 67 individuals in Victor who have obtained a bachelor's degree or higher.
| Field of Study | # Graduates | % Graduates |
| Computers & Mathematics | 0 | 0.0% |
| Bio, Nature & Agricultural | 0 | 0.0% |
| Physical & Health Sciences | 0 | 0.0% |
| Psychology | 0 | 0.0% |
| Social Sciences | 0 | 0.0% |
| Engineering | 0 | 0.0% |
| Multidisciplinary Studies | 0 | 0.0% |
| Science & Technology | 0 | 0.0% |
| Business | 0 | 0.0% |
| Education | 59 | 88.1% |
| Literature & Languages | 8 | 11.9% |
| Liberal Arts & History | 0 | 0.0% |
| Visual & Performing Arts | 0 | 0.0% |
| Communications | 0 | 0.0% |
| Arts & Humanities | 0 | 0.0% |
| Total | 67 | 100.0% |
Transportation & Commute in Victor
Vehicle Availability by Sex in Victor
The most prevalent vehicle ownership categories in Victor are males with 2 vehicles (119, accounting for 64.3%) and females with 2 vehicles (78, making up 44.9%).
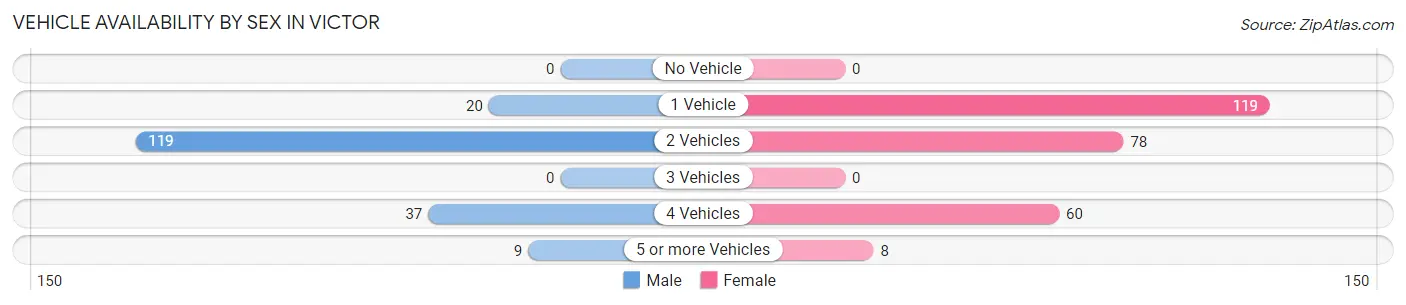
| Vehicles Available | Male | Female |
| No Vehicle | 0 (0.0%) | 0 (0.0%) |
| 1 Vehicle | 20 (10.8%) | 119 (44.9%) |
| 2 Vehicles | 119 (64.3%) | 78 (29.4%) |
| 3 Vehicles | 0 (0.0%) | 0 (0.0%) |
| 4 Vehicles | 37 (20.0%) | 60 (22.6%) |
| 5 or more Vehicles | 9 (4.9%) | 8 (3.0%) |
| Total | 185 (100.0%) | 265 (100.0%) |
Commute Time in Victor
The most frequently occuring commute durations in Victor are 20 to 24 minutes (168 commuters, 40.6%), 15 to 19 minutes (76 commuters, 18.4%), and 10 to 14 minutes (69 commuters, 16.7%).
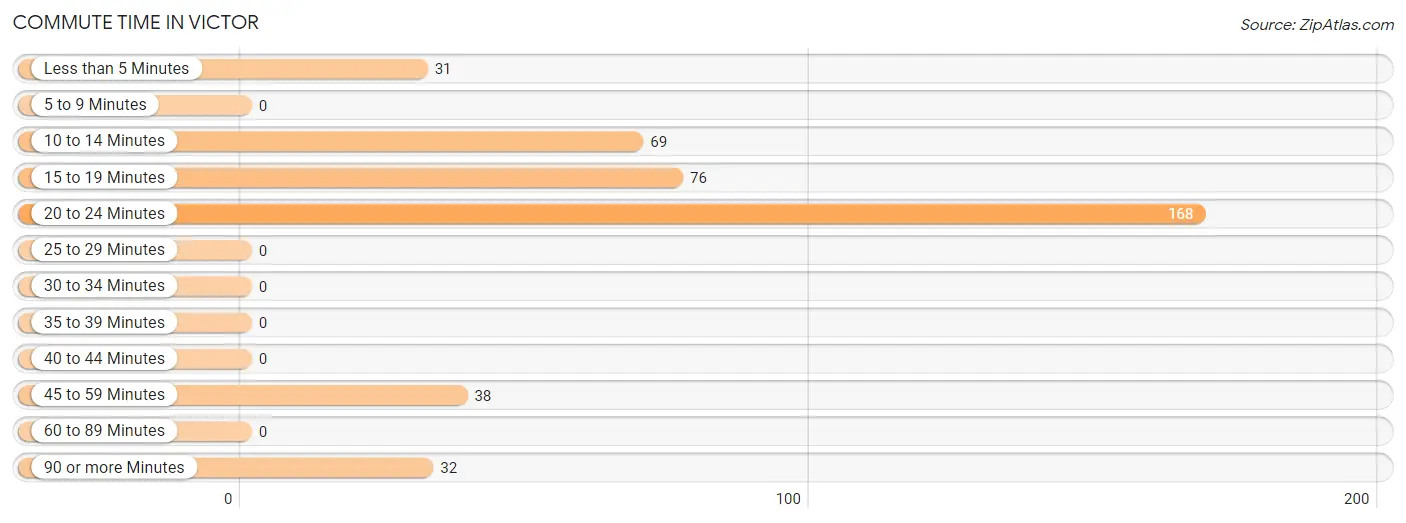
| Commute Time | # Commuters | % Commuters |
| Less than 5 Minutes | 31 | 7.5% |
| 5 to 9 Minutes | 0 | 0.0% |
| 10 to 14 Minutes | 69 | 16.7% |
| 15 to 19 Minutes | 76 | 18.4% |
| 20 to 24 Minutes | 168 | 40.6% |
| 25 to 29 Minutes | 0 | 0.0% |
| 30 to 34 Minutes | 0 | 0.0% |
| 35 to 39 Minutes | 0 | 0.0% |
| 40 to 44 Minutes | 0 | 0.0% |
| 45 to 59 Minutes | 38 | 9.2% |
| 60 to 89 Minutes | 0 | 0.0% |
| 90 or more Minutes | 32 | 7.7% |
Commute Time by Sex in Victor
The most common commute times in Victor are 20 to 24 minutes (47 commuters, 31.5%) for males and 20 to 24 minutes (121 commuters, 45.7%) for females.
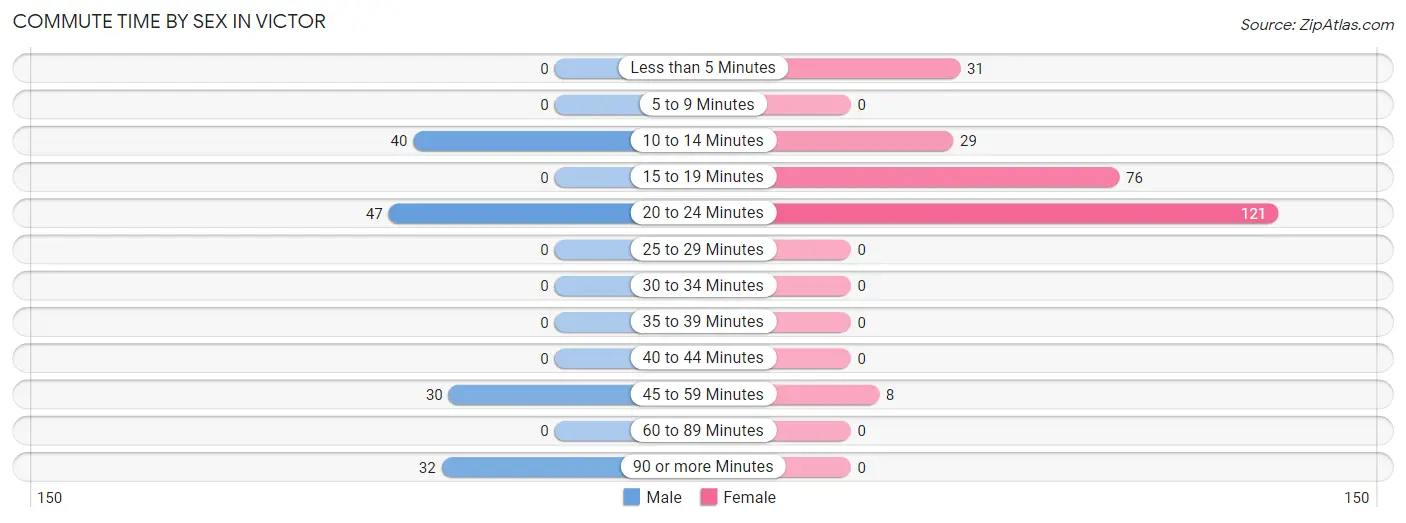
| Commute Time | Male | Female |
| Less than 5 Minutes | 0 (0.0%) | 31 (11.7%) |
| 5 to 9 Minutes | 0 (0.0%) | 0 (0.0%) |
| 10 to 14 Minutes | 40 (26.9%) | 29 (10.9%) |
| 15 to 19 Minutes | 0 (0.0%) | 76 (28.7%) |
| 20 to 24 Minutes | 47 (31.5%) | 121 (45.7%) |
| 25 to 29 Minutes | 0 (0.0%) | 0 (0.0%) |
| 30 to 34 Minutes | 0 (0.0%) | 0 (0.0%) |
| 35 to 39 Minutes | 0 (0.0%) | 0 (0.0%) |
| 40 to 44 Minutes | 0 (0.0%) | 0 (0.0%) |
| 45 to 59 Minutes | 30 (20.1%) | 8 (3.0%) |
| 60 to 89 Minutes | 0 (0.0%) | 0 (0.0%) |
| 90 or more Minutes | 32 (21.5%) | 0 (0.0%) |
Time of Departure to Work by Sex in Victor
The most frequent times of departure to work in Victor are 7:30 AM to 7:59 AM (52, 34.9%) for males and 7:30 AM to 7:59 AM (83, 31.3%) for females.
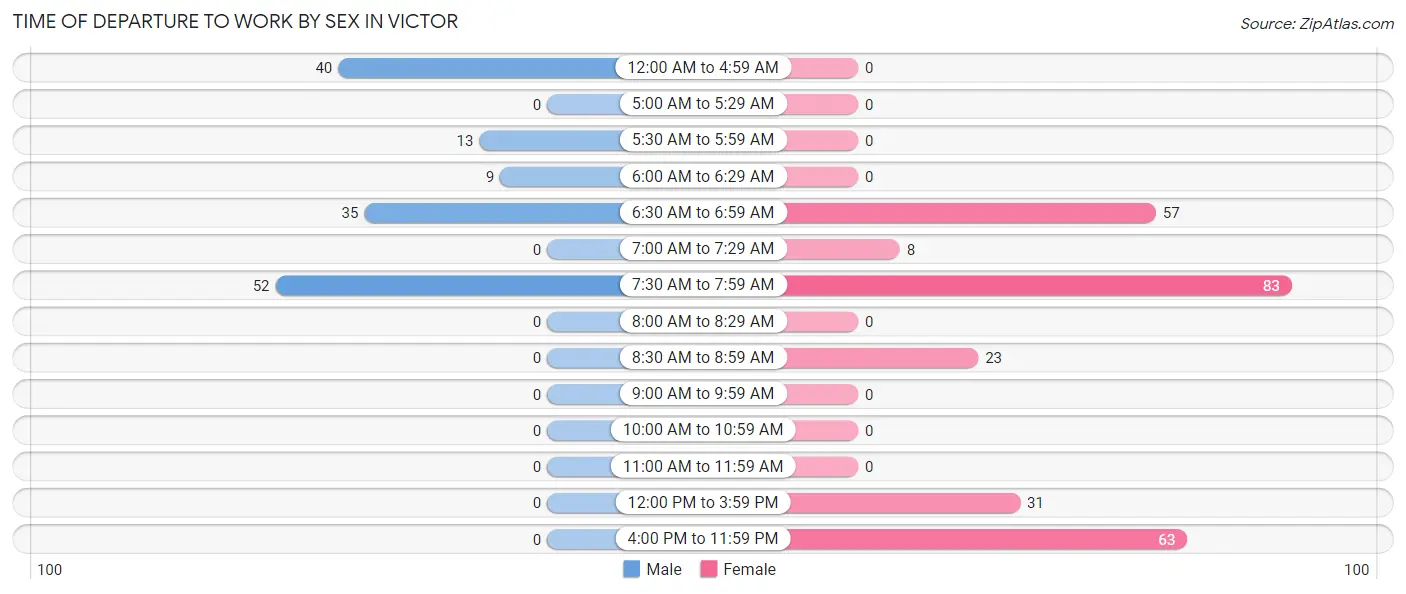
| Time of Departure | Male | Female |
| 12:00 AM to 4:59 AM | 40 (26.9%) | 0 (0.0%) |
| 5:00 AM to 5:29 AM | 0 (0.0%) | 0 (0.0%) |
| 5:30 AM to 5:59 AM | 13 (8.7%) | 0 (0.0%) |
| 6:00 AM to 6:29 AM | 9 (6.0%) | 0 (0.0%) |
| 6:30 AM to 6:59 AM | 35 (23.5%) | 57 (21.5%) |
| 7:00 AM to 7:29 AM | 0 (0.0%) | 8 (3.0%) |
| 7:30 AM to 7:59 AM | 52 (34.9%) | 83 (31.3%) |
| 8:00 AM to 8:29 AM | 0 (0.0%) | 0 (0.0%) |
| 8:30 AM to 8:59 AM | 0 (0.0%) | 23 (8.7%) |
| 9:00 AM to 9:59 AM | 0 (0.0%) | 0 (0.0%) |
| 10:00 AM to 10:59 AM | 0 (0.0%) | 0 (0.0%) |
| 11:00 AM to 11:59 AM | 0 (0.0%) | 0 (0.0%) |
| 12:00 PM to 3:59 PM | 0 (0.0%) | 31 (11.7%) |
| 4:00 PM to 11:59 PM | 0 (0.0%) | 63 (23.8%) |
| Total | 149 (100.0%) | 265 (100.0%) |
Housing Occupancy in Victor
Occupancy by Ownership in Victor
Of the total 317 dwellings in Victor, owner-occupied units account for 198 (62.5%), while renter-occupied units make up 119 (37.5%).
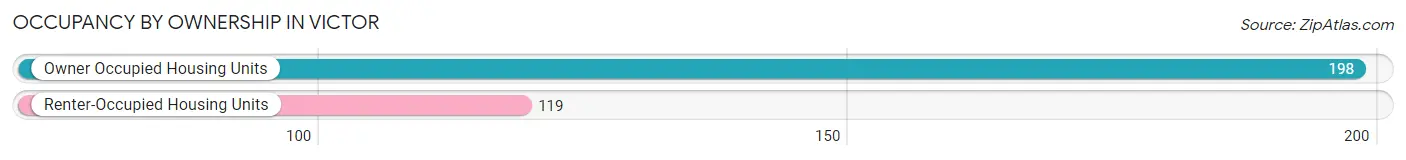
| Occupancy | # Housing Units | % Housing Units |
| Owner Occupied Housing Units | 198 | 62.5% |
| Renter-Occupied Housing Units | 119 | 37.5% |
| Total Occupied Housing Units | 317 | 100.0% |
Occupancy by Household Size in Victor
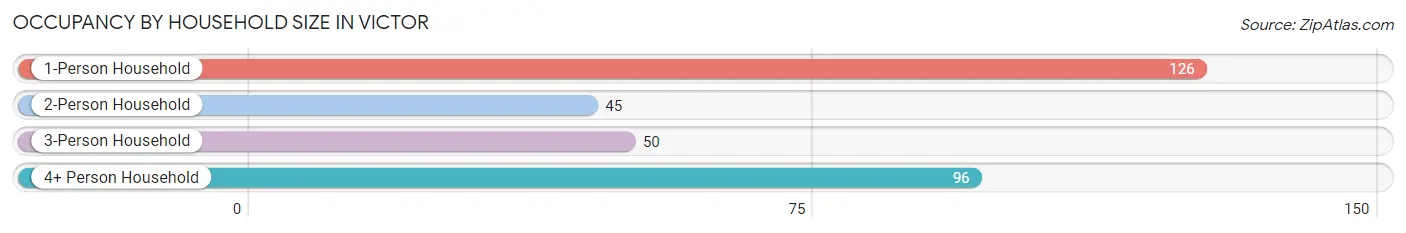
| Household Size | # Housing Units | % Housing Units |
| 1-Person Household | 126 | 39.8% |
| 2-Person Household | 45 | 14.2% |
| 3-Person Household | 50 | 15.8% |
| 4+ Person Household | 96 | 30.3% |
| Total Housing Units | 317 | 100.0% |
Occupancy by Ownership by Household Size in Victor
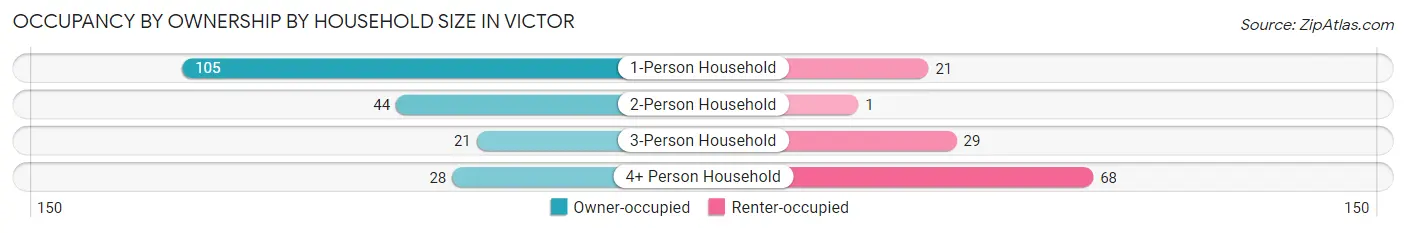
| Household Size | Owner-occupied | Renter-occupied |
| 1-Person Household | 105 (83.3%) | 21 (16.7%) |
| 2-Person Household | 44 (97.8%) | 1 (2.2%) |
| 3-Person Household | 21 (42.0%) | 29 (58.0%) |
| 4+ Person Household | 28 (29.2%) | 68 (70.8%) |
| Total Housing Units | 198 (62.5%) | 119 (37.5%) |
Occupancy by Educational Attainment in Victor
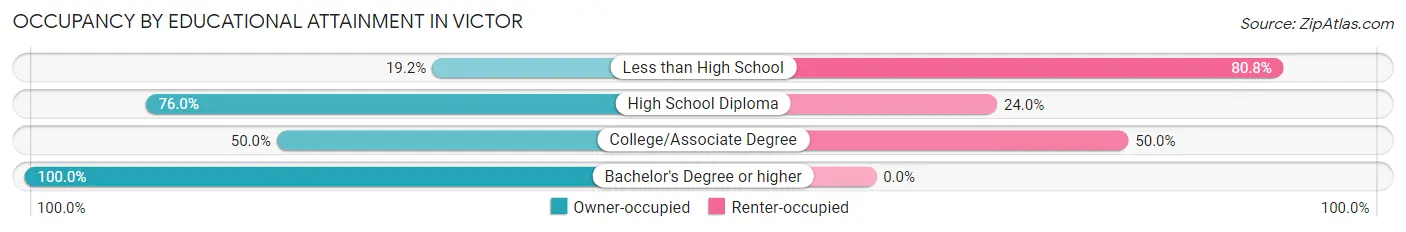
| Household Size | Owner-occupied | Renter-occupied |
| Less than High School | 5 (19.2%) | 21 (80.8%) |
| High School Diploma | 92 (76.0%) | 29 (24.0%) |
| College/Associate Degree | 69 (50.0%) | 69 (50.0%) |
| Bachelor's Degree or higher | 32 (100.0%) | 0 (0.0%) |
Occupancy by Age of Householder in Victor
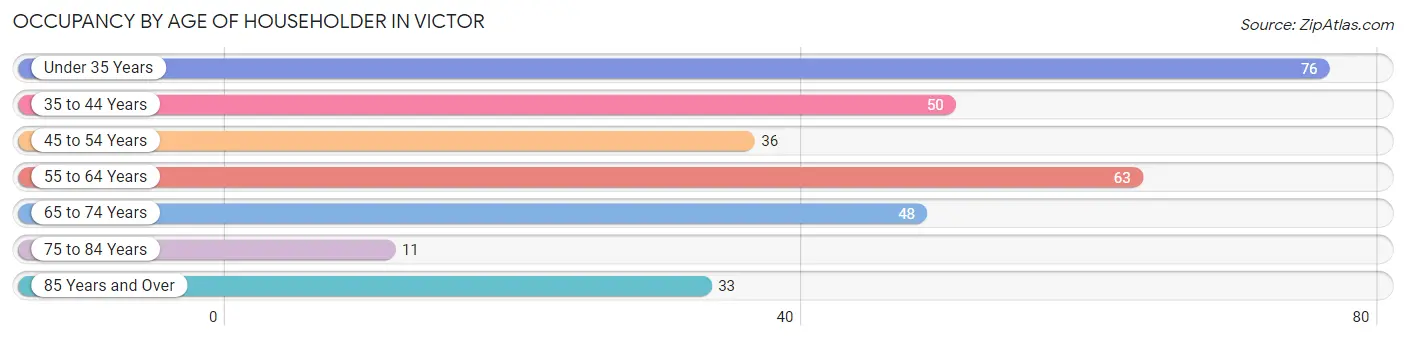
| Age Bracket | # Households | % Households |
| Under 35 Years | 76 | 24.0% |
| 35 to 44 Years | 50 | 15.8% |
| 45 to 54 Years | 36 | 11.4% |
| 55 to 64 Years | 63 | 19.9% |
| 65 to 74 Years | 48 | 15.1% |
| 75 to 84 Years | 11 | 3.5% |
| 85 Years and Over | 33 | 10.4% |
| Total | 317 | 100.0% |
Housing Finances in Victor
Median Income by Occupancy in Victor
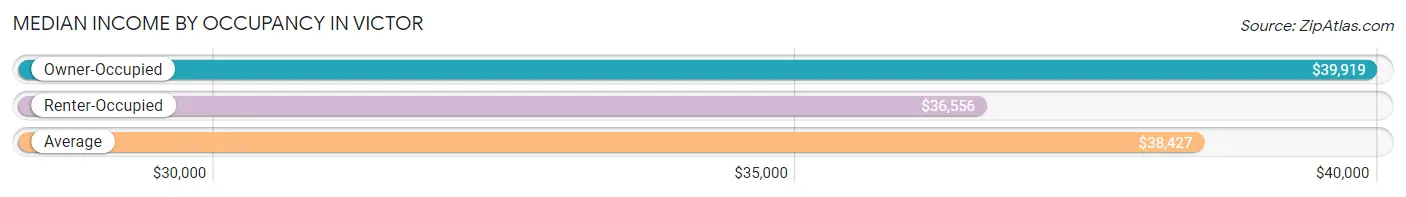
| Occupancy Type | # Households | Median Income |
| Owner-Occupied | 198 (62.5%) | $39,919 |
| Renter-Occupied | 119 (37.5%) | $36,556 |
| Average | 317 (100.0%) | $38,427 |
Occupancy by Householder Income Bracket in Victor
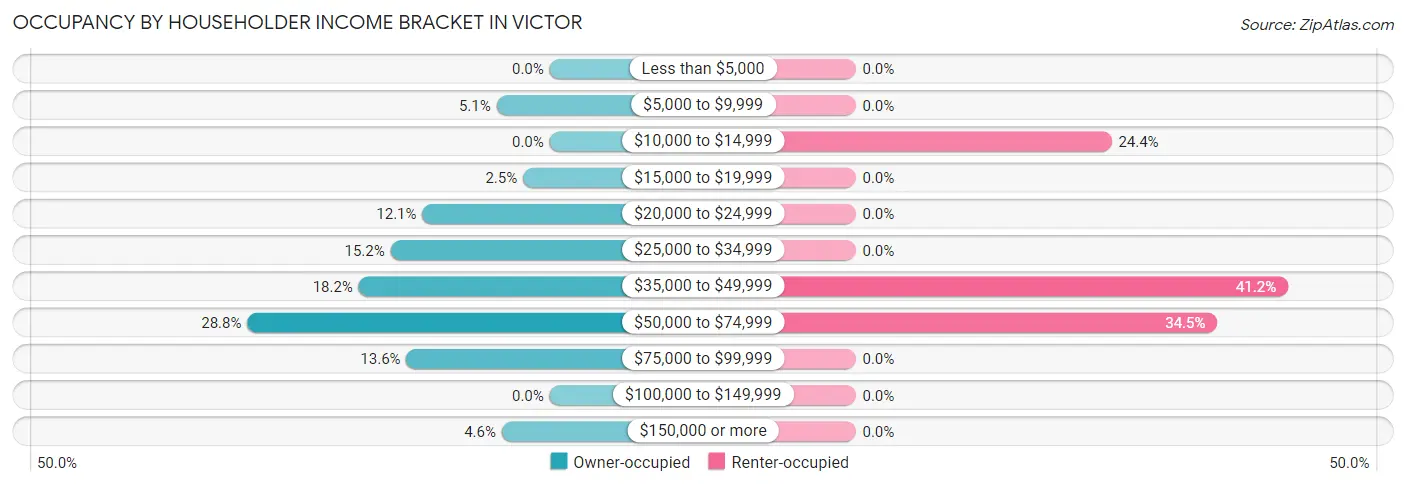
| Income Bracket | Owner-occupied | Renter-occupied |
| Less than $5,000 | 0 (0.0%) | 0 (0.0%) |
| $5,000 to $9,999 | 10 (5.1%) | 0 (0.0%) |
| $10,000 to $14,999 | 0 (0.0%) | 29 (24.4%) |
| $15,000 to $19,999 | 5 (2.5%) | 0 (0.0%) |
| $20,000 to $24,999 | 24 (12.1%) | 0 (0.0%) |
| $25,000 to $34,999 | 30 (15.1%) | 0 (0.0%) |
| $35,000 to $49,999 | 36 (18.2%) | 49 (41.2%) |
| $50,000 to $74,999 | 57 (28.8%) | 41 (34.4%) |
| $75,000 to $99,999 | 27 (13.6%) | 0 (0.0%) |
| $100,000 to $149,999 | 0 (0.0%) | 0 (0.0%) |
| $150,000 or more | 9 (4.5%) | 0 (0.0%) |
| Total | 198 (100.0%) | 119 (100.0%) |
Monthly Housing Cost Tiers in Victor
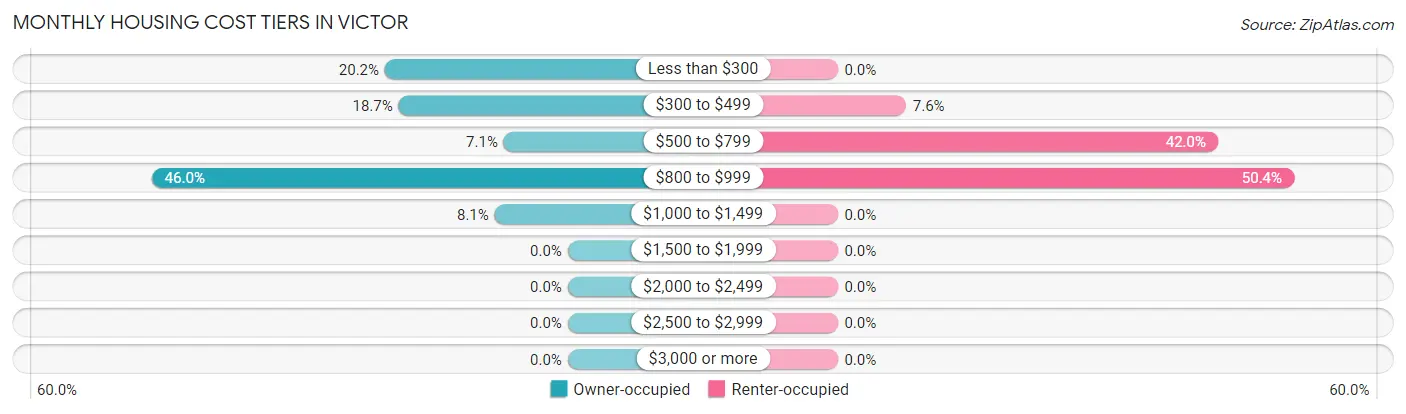
| Monthly Cost | Owner-occupied | Renter-occupied |
| Less than $300 | 40 (20.2%) | 0 (0.0%) |
| $300 to $499 | 37 (18.7%) | 9 (7.6%) |
| $500 to $799 | 14 (7.1%) | 50 (42.0%) |
| $800 to $999 | 91 (46.0%) | 60 (50.4%) |
| $1,000 to $1,499 | 16 (8.1%) | 0 (0.0%) |
| $1,500 to $1,999 | 0 (0.0%) | 0 (0.0%) |
| $2,000 to $2,499 | 0 (0.0%) | 0 (0.0%) |
| $2,500 to $2,999 | 0 (0.0%) | 0 (0.0%) |
| $3,000 or more | 0 (0.0%) | 0 (0.0%) |
| Total | 198 (100.0%) | 119 (100.0%) |
Physical Housing Characteristics in Victor
Housing Structures in Victor
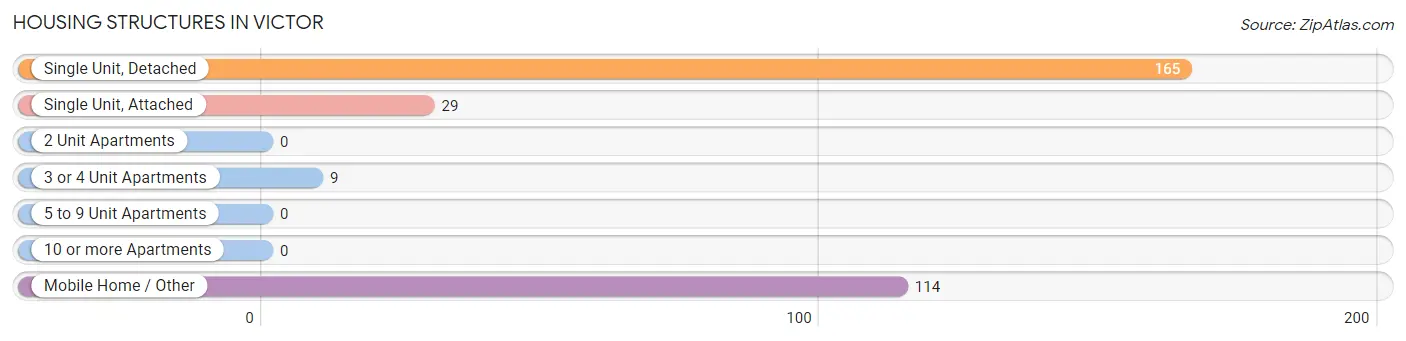
| Structure Type | # Housing Units | % Housing Units |
| Single Unit, Detached | 165 | 52.0% |
| Single Unit, Attached | 29 | 9.1% |
| 2 Unit Apartments | 0 | 0.0% |
| 3 or 4 Unit Apartments | 9 | 2.8% |
| 5 to 9 Unit Apartments | 0 | 0.0% |
| 10 or more Apartments | 0 | 0.0% |
| Mobile Home / Other | 114 | 36.0% |
| Total | 317 | 100.0% |
Housing Structures by Occupancy in Victor
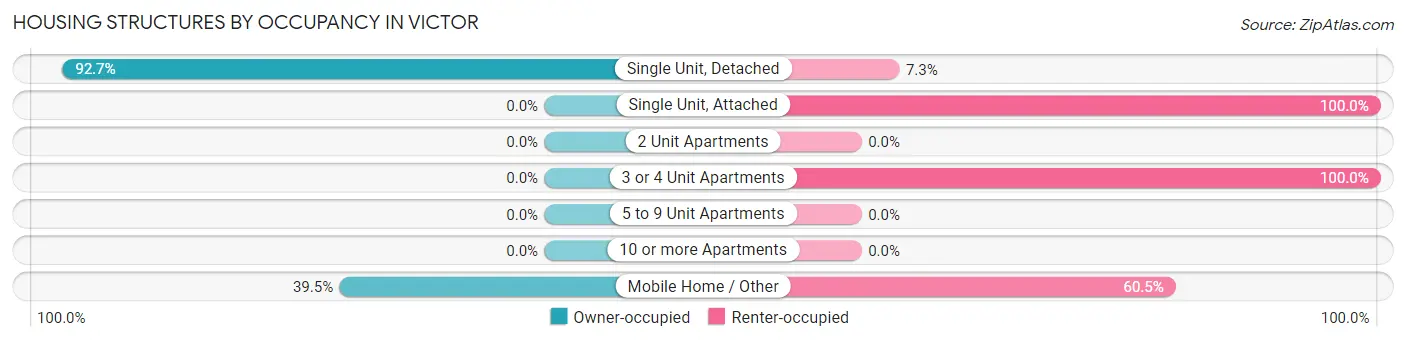
| Structure Type | Owner-occupied | Renter-occupied |
| Single Unit, Detached | 153 (92.7%) | 12 (7.3%) |
| Single Unit, Attached | 0 (0.0%) | 29 (100.0%) |
| 2 Unit Apartments | 0 (0.0%) | 0 (0.0%) |
| 3 or 4 Unit Apartments | 0 (0.0%) | 9 (100.0%) |
| 5 to 9 Unit Apartments | 0 (0.0%) | 0 (0.0%) |
| 10 or more Apartments | 0 (0.0%) | 0 (0.0%) |
| Mobile Home / Other | 45 (39.5%) | 69 (60.5%) |
| Total | 198 (62.5%) | 119 (37.5%) |
Housing Structures by Number of Rooms in Victor
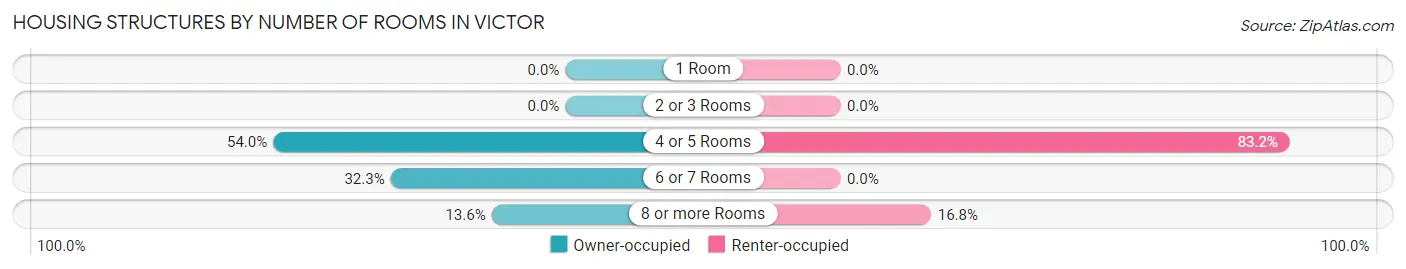
| Number of Rooms | Owner-occupied | Renter-occupied |
| 1 Room | 0 (0.0%) | 0 (0.0%) |
| 2 or 3 Rooms | 0 (0.0%) | 0 (0.0%) |
| 4 or 5 Rooms | 107 (54.0%) | 99 (83.2%) |
| 6 or 7 Rooms | 64 (32.3%) | 0 (0.0%) |
| 8 or more Rooms | 27 (13.6%) | 20 (16.8%) |
| Total | 198 (100.0%) | 119 (100.0%) |
Housing Structure by Heating Type in Victor
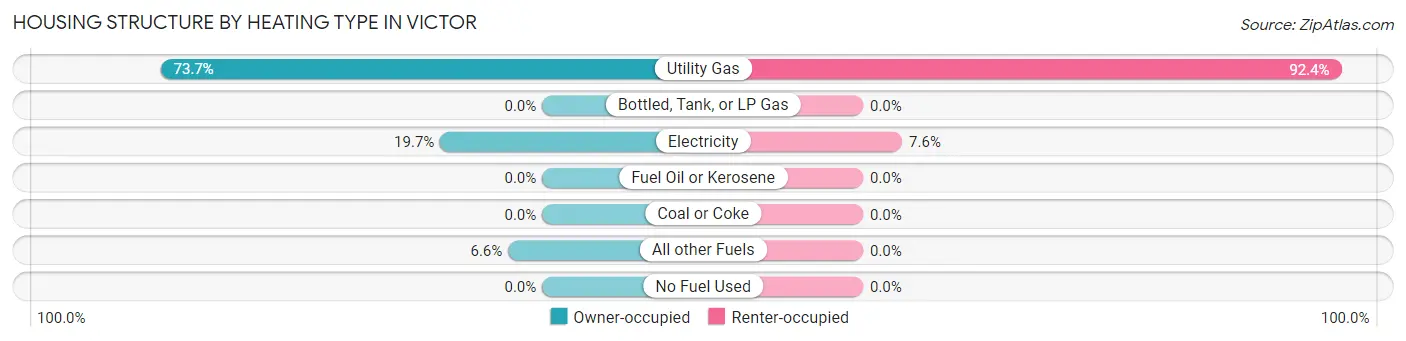
| Heating Type | Owner-occupied | Renter-occupied |
| Utility Gas | 146 (73.7%) | 110 (92.4%) |
| Bottled, Tank, or LP Gas | 0 (0.0%) | 0 (0.0%) |
| Electricity | 39 (19.7%) | 9 (7.6%) |
| Fuel Oil or Kerosene | 0 (0.0%) | 0 (0.0%) |
| Coal or Coke | 0 (0.0%) | 0 (0.0%) |
| All other Fuels | 13 (6.6%) | 0 (0.0%) |
| No Fuel Used | 0 (0.0%) | 0 (0.0%) |
| Total | 198 (100.0%) | 119 (100.0%) |
Household Vehicle Usage in Victor
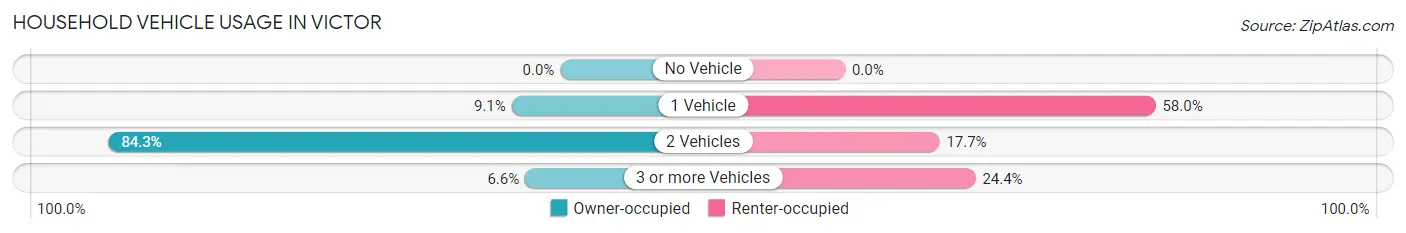
| Vehicles per Household | Owner-occupied | Renter-occupied |
| No Vehicle | 0 (0.0%) | 0 (0.0%) |
| 1 Vehicle | 18 (9.1%) | 69 (58.0%) |
| 2 Vehicles | 167 (84.3%) | 21 (17.6%) |
| 3 or more Vehicles | 13 (6.6%) | 29 (24.4%) |
| Total | 198 (100.0%) | 119 (100.0%) |
Real Estate & Mortgages in Victor
Real Estate and Mortgage Overview in Victor
| Characteristic | Without Mortgage | With Mortgage |
| Housing Units | 77 | 121 |
| Median Property Value | $217,700 | $230,900 |
| Median Household Income | $30,375 | $9 |
| Monthly Housing Costs | - | - |
| Real Estate Taxes | $793 | $0 |
Property Value by Mortgage Status in Victor
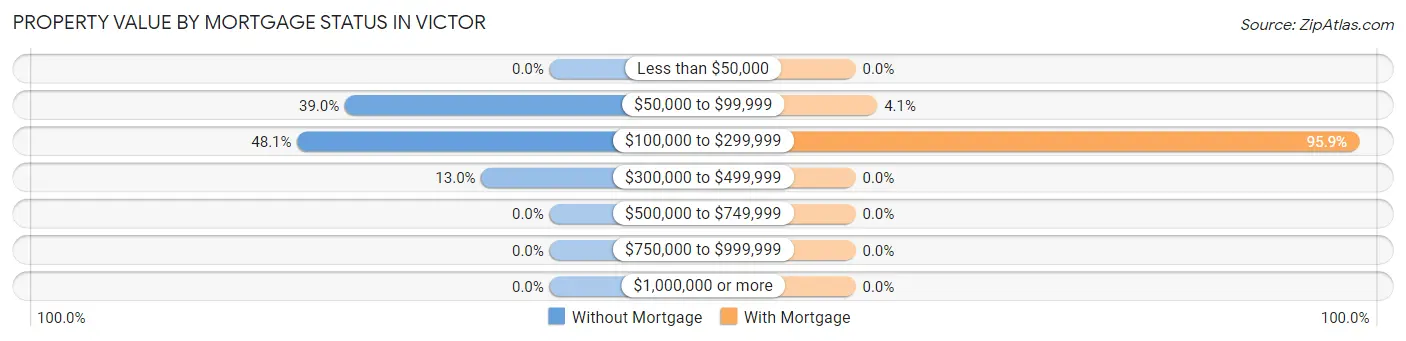
| Property Value | Without Mortgage | With Mortgage |
| Less than $50,000 | 0 (0.0%) | 0 (0.0%) |
| $50,000 to $99,999 | 30 (39.0%) | 5 (4.1%) |
| $100,000 to $299,999 | 37 (48.0%) | 116 (95.9%) |
| $300,000 to $499,999 | 10 (13.0%) | 0 (0.0%) |
| $500,000 to $749,999 | 0 (0.0%) | 0 (0.0%) |
| $750,000 to $999,999 | 0 (0.0%) | 0 (0.0%) |
| $1,000,000 or more | 0 (0.0%) | 0 (0.0%) |
| Total | 77 (100.0%) | 121 (100.0%) |
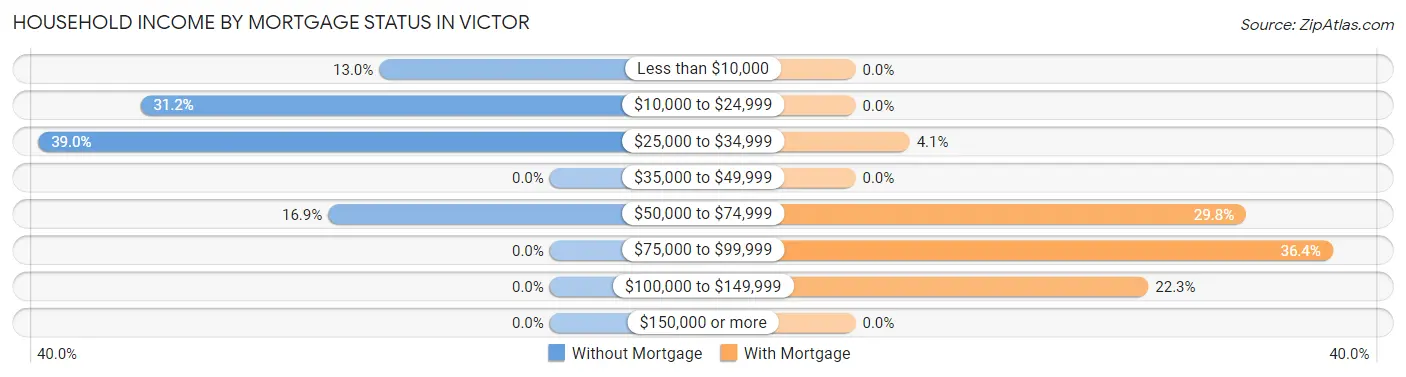
Household Income by Mortgage Status in Victor
| Household Income | Without Mortgage | With Mortgage |
| Less than $10,000 | 10 (13.0%) | 0 (0.0%) |
| $10,000 to $24,999 | 24 (31.2%) | 0 (0.0%) |
| $25,000 to $34,999 | 30 (39.0%) | 5 (4.1%) |
| $35,000 to $49,999 | 0 (0.0%) | 0 (0.0%) |
| $50,000 to $74,999 | 13 (16.9%) | 36 (29.7%) |
| $75,000 to $99,999 | 0 (0.0%) | 44 (36.4%) |
| $100,000 to $149,999 | 0 (0.0%) | 27 (22.3%) |
| $150,000 or more | 0 (0.0%) | 0 (0.0%) |
| Total | 77 (100.0%) | 121 (100.0%) |
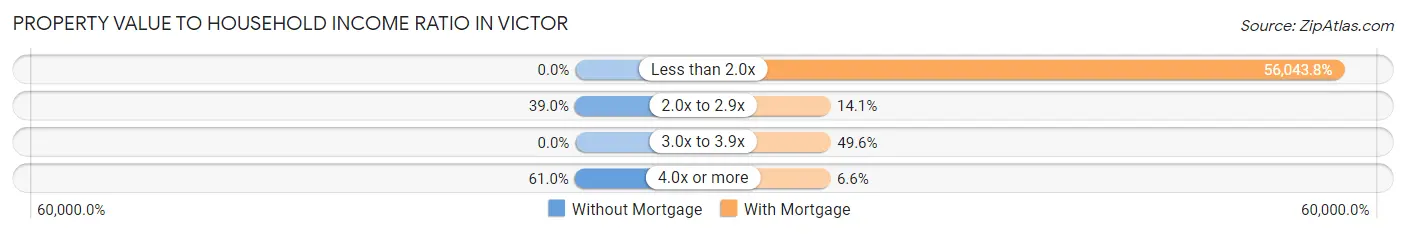
Property Value to Household Income Ratio in Victor
| Value-to-Income Ratio | Without Mortgage | With Mortgage |
| Less than 2.0x | 0 (0.0%) | 67,813 (56,043.8%) |
| 2.0x to 2.9x | 30 (39.0%) | 17 (14.1%) |
| 3.0x to 3.9x | 0 (0.0%) | 60 (49.6%) |
| 4.0x or more | 47 (61.0%) | 8 (6.6%) |
| Total | 77 (100.0%) | 121 (100.0%) |
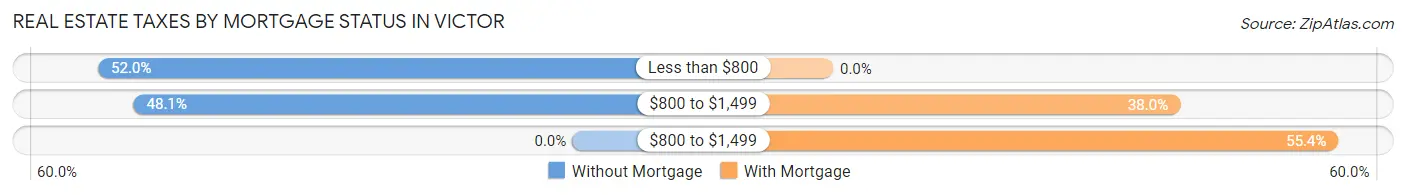
Real Estate Taxes by Mortgage Status in Victor
| Property Taxes | Without Mortgage | With Mortgage |
| Less than $800 | 40 (51.9%) | 0 (0.0%) |
| $800 to $1,499 | 37 (48.0%) | 46 (38.0%) |
| $800 to $1,499 | 0 (0.0%) | 67 (55.4%) |
| Total | 77 (100.0%) | 121 (100.0%) |
Health & Disability in Victor
Health Insurance Coverage by Age in Victor
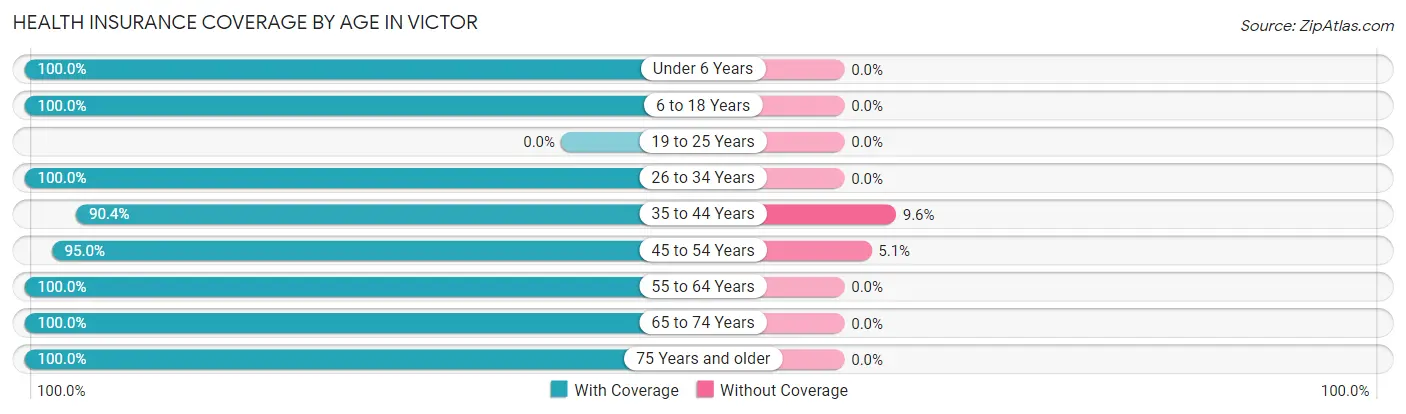
| Age Bracket | With Coverage | Without Coverage |
| Under 6 Years | 21 (100.0%) | 0 (0.0%) |
| 6 to 18 Years | 274 (100.0%) | 0 (0.0%) |
| 19 to 25 Years | 0 (0.0%) | 0 (0.0%) |
| 26 to 34 Years | 102 (100.0%) | 0 (0.0%) |
| 35 to 44 Years | 160 (90.4%) | 17 (9.6%) |
| 45 to 54 Years | 94 (95.0%) | 5 (5.1%) |
| 55 to 64 Years | 88 (100.0%) | 0 (0.0%) |
| 65 to 74 Years | 71 (100.0%) | 0 (0.0%) |
| 75 Years and older | 53 (100.0%) | 0 (0.0%) |
| Total | 863 (97.5%) | 22 (2.5%) |
Health Insurance Coverage by Citizenship Status in Victor
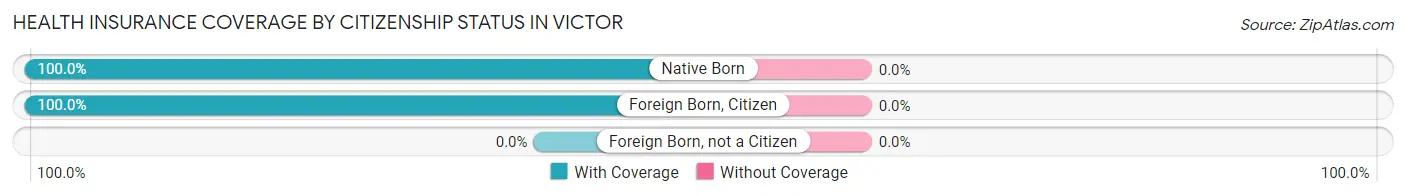
| Citizenship Status | With Coverage | Without Coverage |
| Native Born | 21 (100.0%) | 0 (0.0%) |
| Foreign Born, Citizen | 274 (100.0%) | 0 (0.0%) |
| Foreign Born, not a Citizen | 0 (0.0%) | 0 (0.0%) |
Health Insurance Coverage by Household Income in Victor
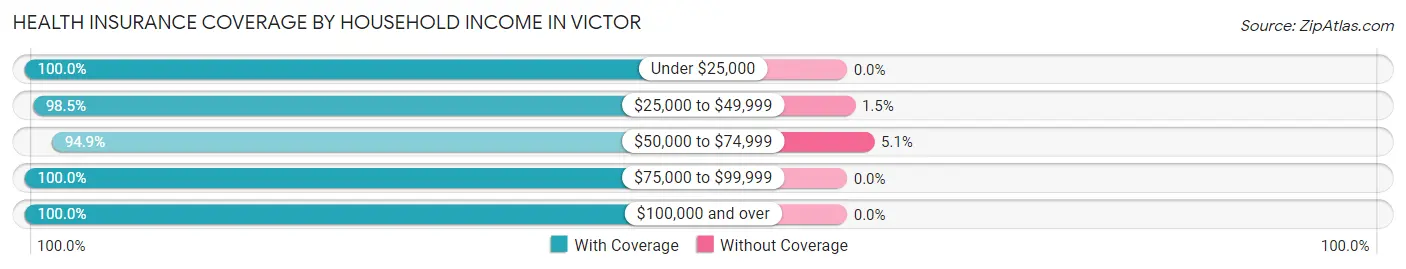
| Household Income | With Coverage | Without Coverage |
| Under $25,000 | 157 (100.0%) | 0 (0.0%) |
| $25,000 to $49,999 | 322 (98.5%) | 5 (1.5%) |
| $50,000 to $74,999 | 316 (94.9%) | 17 (5.1%) |
| $75,000 to $99,999 | 50 (100.0%) | 0 (0.0%) |
| $100,000 and over | 18 (100.0%) | 0 (0.0%) |
Public vs Private Health Insurance Coverage by Age in Victor
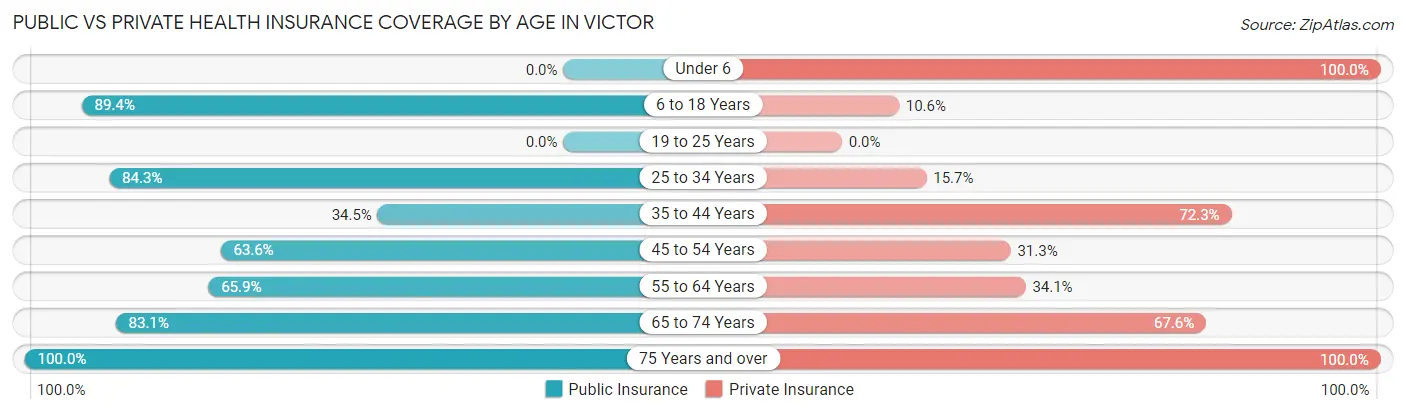
| Age Bracket | Public Insurance | Private Insurance |
| Under 6 | 0 (0.0%) | 21 (100.0%) |
| 6 to 18 Years | 245 (89.4%) | 29 (10.6%) |
| 19 to 25 Years | 0 (0.0%) | 0 (0.0%) |
| 25 to 34 Years | 86 (84.3%) | 16 (15.7%) |
| 35 to 44 Years | 61 (34.5%) | 128 (72.3%) |
| 45 to 54 Years | 63 (63.6%) | 31 (31.3%) |
| 55 to 64 Years | 58 (65.9%) | 30 (34.1%) |
| 65 to 74 Years | 59 (83.1%) | 48 (67.6%) |
| 75 Years and over | 53 (100.0%) | 53 (100.0%) |
| Total | 625 (70.6%) | 356 (40.2%) |
Disability Status by Sex by Age in Victor
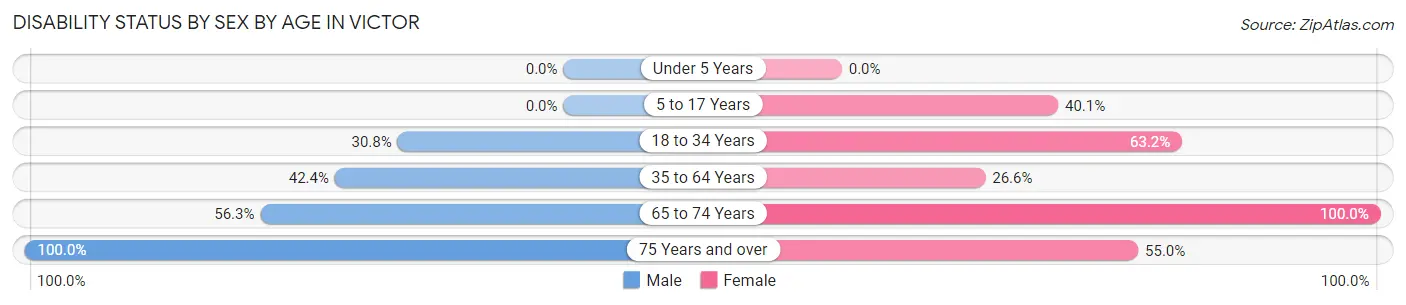
| Age Bracket | Male | Female |
| Under 5 Years | 0 (0.0%) | 0 (0.0%) |
| 5 to 17 Years | 0 (0.0%) | 57 (40.1%) |
| 18 to 34 Years | 8 (30.8%) | 48 (63.2%) |
| 35 to 64 Years | 70 (42.4%) | 53 (26.6%) |
| 65 to 74 Years | 27 (56.2%) | 23 (100.0%) |
| 75 Years and over | 33 (100.0%) | 11 (55.0%) |
Disability Class by Sex by Age in Victor
Disability Class: Hearing Difficulty
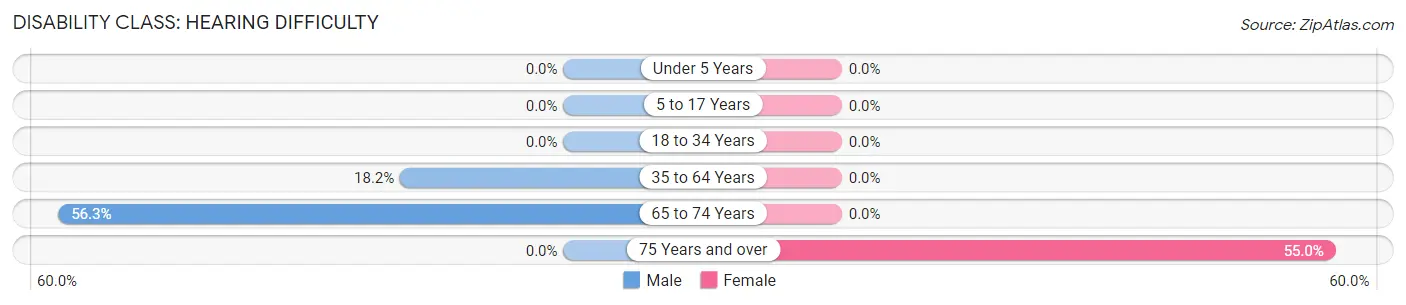
| Age Bracket | Male | Female |
| Under 5 Years | 0 (0.0%) | 0 (0.0%) |
| 5 to 17 Years | 0 (0.0%) | 0 (0.0%) |
| 18 to 34 Years | 0 (0.0%) | 0 (0.0%) |
| 35 to 64 Years | 30 (18.2%) | 0 (0.0%) |
| 65 to 74 Years | 27 (56.2%) | 0 (0.0%) |
| 75 Years and over | 0 (0.0%) | 11 (55.0%) |
Disability Class: Vision Difficulty
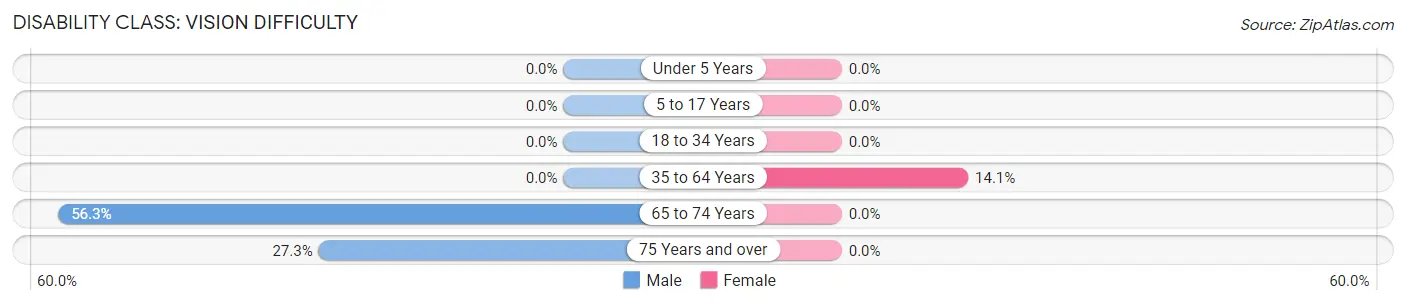
| Age Bracket | Male | Female |
| Under 5 Years | 0 (0.0%) | 0 (0.0%) |
| 5 to 17 Years | 0 (0.0%) | 0 (0.0%) |
| 18 to 34 Years | 0 (0.0%) | 0 (0.0%) |
| 35 to 64 Years | 0 (0.0%) | 28 (14.1%) |
| 65 to 74 Years | 27 (56.2%) | 0 (0.0%) |
| 75 Years and over | 9 (27.3%) | 0 (0.0%) |
Disability Class: Cognitive Difficulty
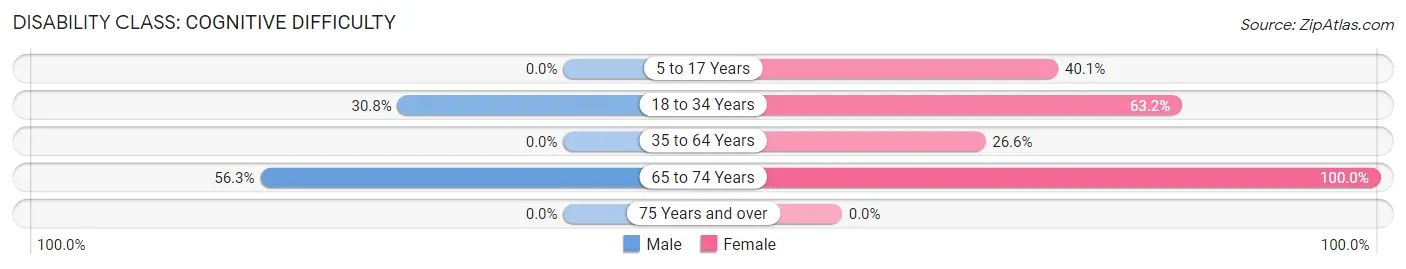
| Age Bracket | Male | Female |
| 5 to 17 Years | 0 (0.0%) | 57 (40.1%) |
| 18 to 34 Years | 8 (30.8%) | 48 (63.2%) |
| 35 to 64 Years | 0 (0.0%) | 53 (26.6%) |
| 65 to 74 Years | 27 (56.2%) | 23 (100.0%) |
| 75 Years and over | 0 (0.0%) | 0 (0.0%) |
Disability Class: Ambulatory Difficulty
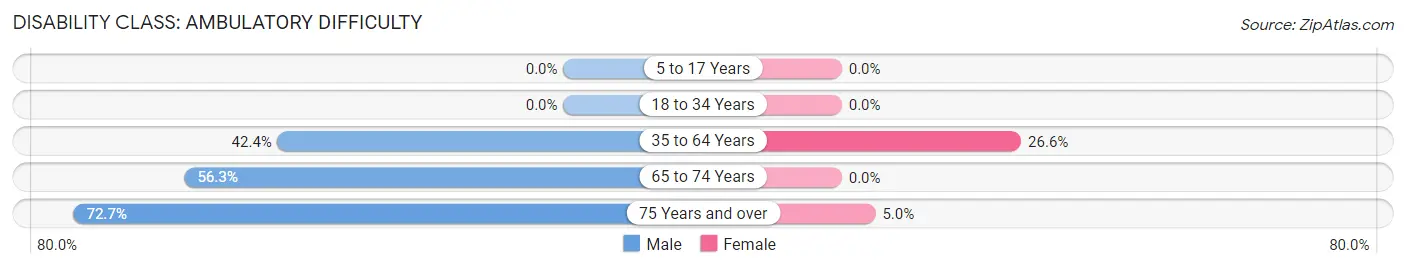
| Age Bracket | Male | Female |
| 5 to 17 Years | 0 (0.0%) | 0 (0.0%) |
| 18 to 34 Years | 0 (0.0%) | 0 (0.0%) |
| 35 to 64 Years | 70 (42.4%) | 53 (26.6%) |
| 65 to 74 Years | 27 (56.2%) | 0 (0.0%) |
| 75 Years and over | 24 (72.7%) | 1 (5.0%) |
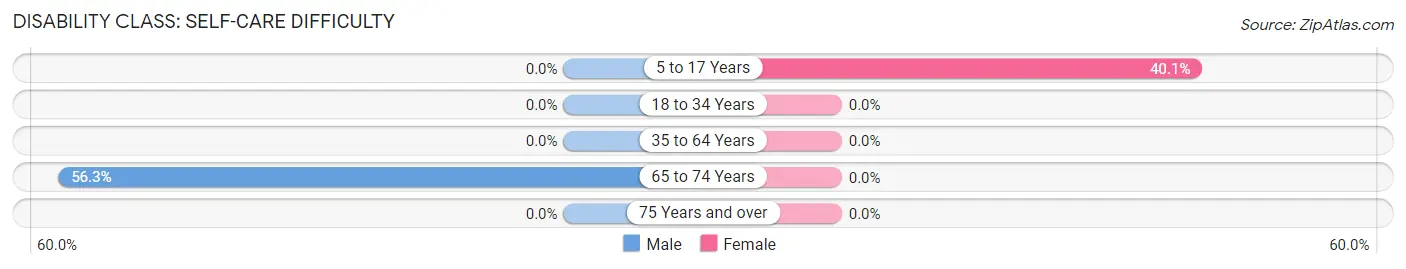
Disability Class: Self-Care Difficulty
| Age Bracket | Male | Female |
| 5 to 17 Years | 0 (0.0%) | 57 (40.1%) |
| 18 to 34 Years | 0 (0.0%) | 0 (0.0%) |
| 35 to 64 Years | 0 (0.0%) | 0 (0.0%) |
| 65 to 74 Years | 27 (56.2%) | 0 (0.0%) |
| 75 Years and over | 0 (0.0%) | 0 (0.0%) |
Technology Access in Victor
Computing Device Access in Victor
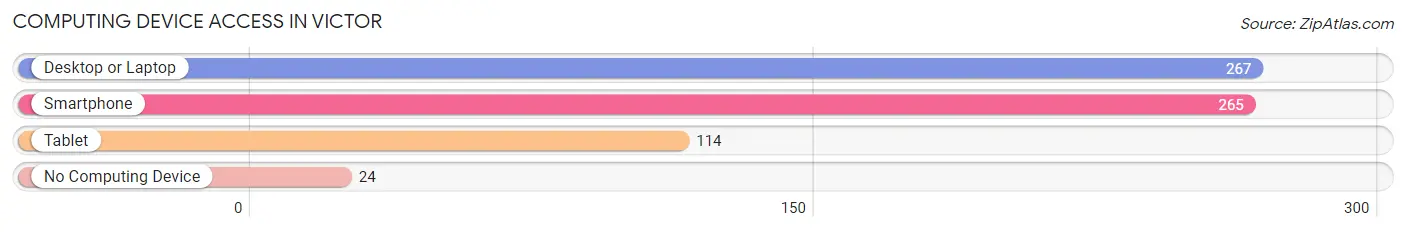
| Device Type | # Households | % Households |
| Desktop or Laptop | 267 | 84.2% |
| Smartphone | 265 | 83.6% |
| Tablet | 114 | 36.0% |
| No Computing Device | 24 | 7.6% |
| Total | 317 | 100.0% |
Internet Access in Victor
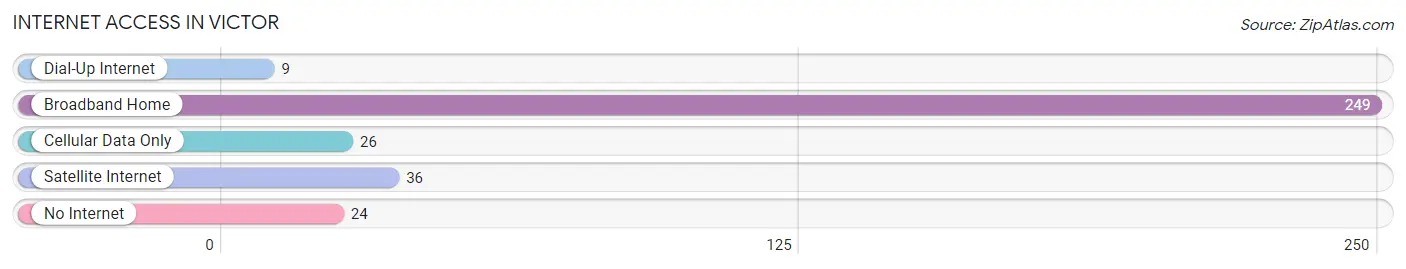
| Internet Type | # Households | % Households |
| Dial-Up Internet | 9 | 2.8% |
| Broadband Home | 249 | 78.5% |
| Cellular Data Only | 26 | 8.2% |
| Satellite Internet | 36 | 11.4% |
| No Internet | 24 | 7.6% |
| Total | 317 | 100.0% |
Victor Summary
Victor, Montana is a small town located in Ravalli County, Montana. It is situated in the Bitterroot Valley, a region of the Rocky Mountains. The town was founded in 1883 and has a population of approximately 1,000 people.
Victor is located in the Bitterroot Valley, which is a region of the Rocky Mountains. The valley is surrounded by the Bitterroot Mountains to the east and the Sapphire Mountains to the west. The valley is known for its beautiful scenery and is a popular destination for outdoor recreation. The town of Victor is situated at an elevation of 4,000 feet and is surrounded by rolling hills and forests.
The economy of Victor is largely based on agriculture and tourism. The town is home to several farms and ranches, which produce a variety of crops and livestock. The town is also a popular destination for outdoor recreation, such as fishing, hunting, camping, and hiking. The nearby Bitterroot National Forest provides a variety of recreational opportunities.
Victor is served by the Ravalli County Airport, which is located just outside of town. The airport provides air service to the surrounding area and is a popular destination for private pilots. The town is also served by a number of bus lines, which provide transportation to nearby towns and cities.
The demographics of Victor are largely white, with a small percentage of Native American and Hispanic residents. The median household income in Victor is $37,000, which is slightly lower than the national average. The town has a high rate of poverty, with nearly 20% of the population living below the poverty line.
Victor is a small town with a rich history and a vibrant economy. The town is home to a variety of businesses, farms, and ranches, and is a popular destination for outdoor recreation. The town is served by the Ravalli County Airport and is a great place to live and work.
Common Questions
What is Per Capita Income in Victor?
Per Capita income in Victor is $18,047.
What is the Median Family Income in Victor?
Median Family Income in Victor is $57,974.
What is the Median Household income in Victor?
Median Household Income in Victor is $38,427.
What is Inequality or Gini Index in Victor?
Inequality or Gini Index in Victor is 0.32.
What is the Total Population of Victor?
Total Population of Victor is 885.
What is the Total Male Population of Victor?
Total Male Population of Victor is 425.
What is the Total Female Population of Victor?
Total Female Population of Victor is 460.
What is the Ratio of Males per 100 Females in Victor?
There are 92.39 Males per 100 Females in Victor.
What is the Ratio of Females per 100 Males in Victor?
There are 108.24 Females per 100 Males in Victor.
What is the Median Population Age in Victor?
Median Population Age in Victor is 35.9 Years.
What is the Average Family Size in Victor
Average Family Size in Victor is 3.9 People.
What is the Average Household Size in Victor
Average Household Size in Victor is 2.8 People.
How Large is the Labor Force in Victor?
There are 450 People in the Labor Forcein in Victor.
What is the Percentage of People in the Labor Force in Victor?
72.5% of People are in the Labor Force in Victor.