Florence, MT Map & Demographics
Florence Map
Florence Overview
$34,894
PER CAPITA INCOME
$88,295
AVG FAMILY INCOME
$74,615
AVG HOUSEHOLD INCOME
27.2%
WAGE / INCOME GAP [ % ]
72.8¢/ $1
WAGE / INCOME GAP [ $ ]
0.33
INEQUALITY / GINI INDEX
1,046
TOTAL POPULATION
503
MALE POPULATION
543
FEMALE POPULATION
92.63
MALES / 100 FEMALES
107.95
FEMALES / 100 MALES
56.0
MEDIAN AGE
2.9
AVG FAMILY SIZE
2.3
AVG HOUSEHOLD SIZE
471
LABOR FORCE [ PEOPLE ]
55.5%
PERCENT IN LABOR FORCE
11.7%
UNEMPLOYMENT RATE
Florence Zip Codes
Florence Area Codes
Income in Florence
Income Overview in Florence
Per Capita Income in Florence is $34,894, while median incomes of families and households are $88,295 and $74,615 respectively.
| Characteristic | Number | Measure |
| Per Capita Income | 1,046 | $34,894 |
| Median Family Income | 295 | $88,295 |
| Mean Family Income | 295 | $78,564 |
| Median Household Income | 454 | $74,615 |
| Mean Household Income | 454 | $78,433 |
| Income Deficit | 295 | $0 |
| Wage / Income Gap (%) | 1,046 | 27.16% |
| Wage / Income Gap ($) | 1,046 | 72.84¢ per $1 |
| Gini / Inequality Index | 1,046 | 0.33 |
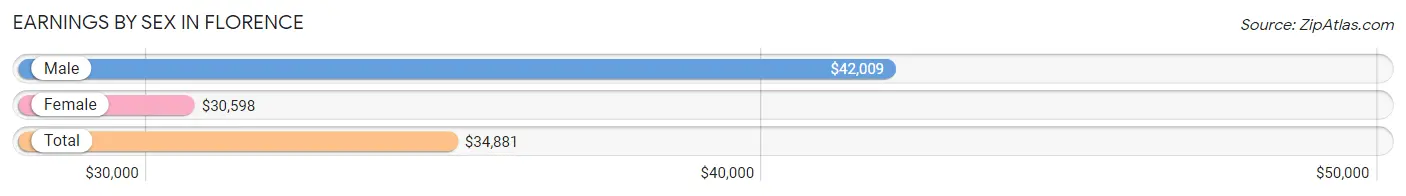
Earnings by Sex in Florence
Average Earnings in Florence are $34,881, $42,009 for men and $30,598 for women, a difference of 27.2%.
| Sex | Number | Average Earnings |
| Male | 242 (51.5%) | $42,009 |
| Female | 228 (48.5%) | $30,598 |
| Total | 470 (100.0%) | $34,881 |
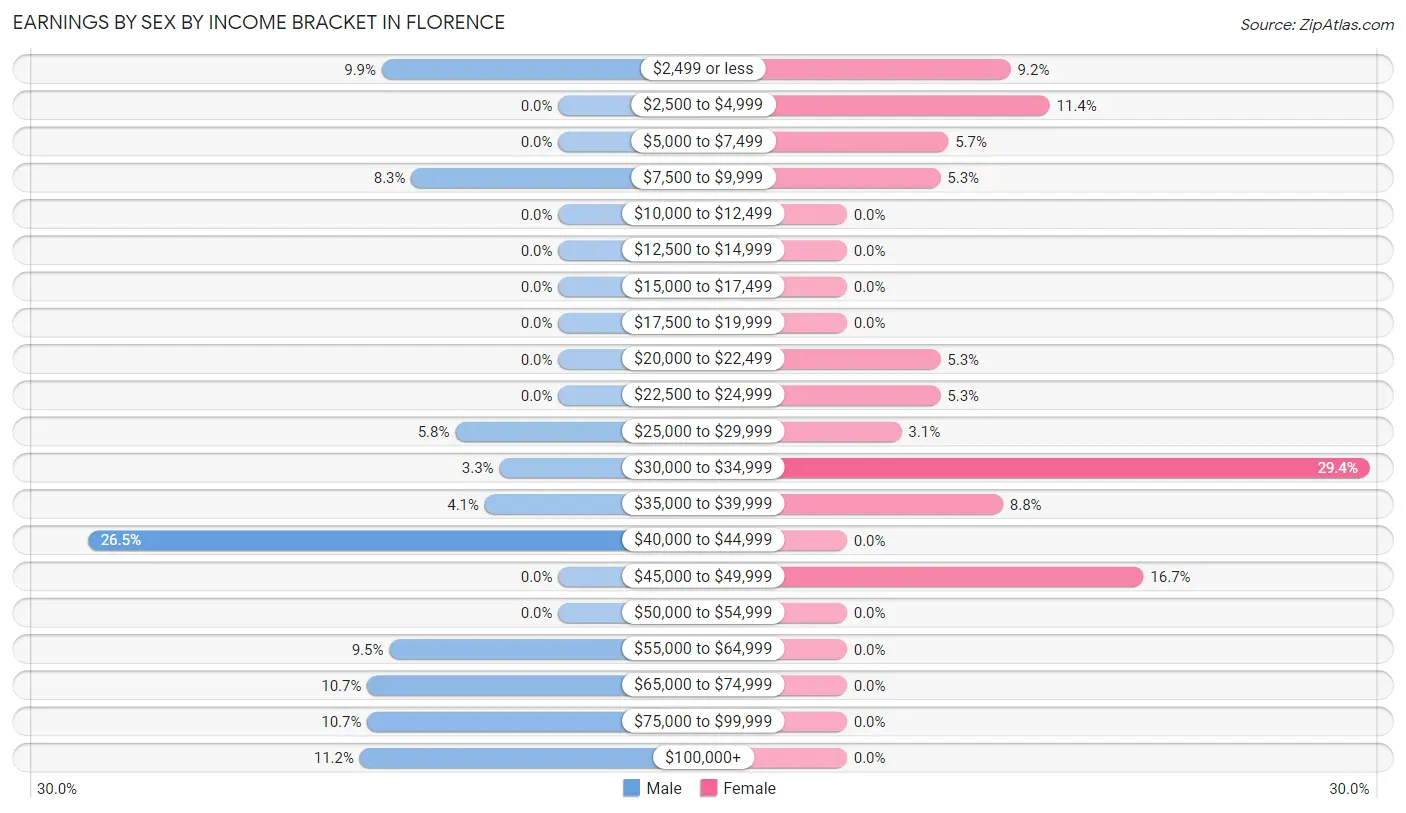
Earnings by Sex by Income Bracket in Florence
The most common earnings brackets in Florence are $40,000 to $44,999 for men (64 | 26.5%) and $30,000 to $34,999 for women (67 | 29.4%).
| Income | Male | Female |
| $2,499 or less | 24 (9.9%) | 21 (9.2%) |
| $2,500 to $4,999 | 0 (0.0%) | 26 (11.4%) |
| $5,000 to $7,499 | 0 (0.0%) | 13 (5.7%) |
| $7,500 to $9,999 | 20 (8.3%) | 12 (5.3%) |
| $10,000 to $12,499 | 0 (0.0%) | 0 (0.0%) |
| $12,500 to $14,999 | 0 (0.0%) | 0 (0.0%) |
| $15,000 to $17,499 | 0 (0.0%) | 0 (0.0%) |
| $17,500 to $19,999 | 0 (0.0%) | 0 (0.0%) |
| $20,000 to $22,499 | 0 (0.0%) | 12 (5.3%) |
| $22,500 to $24,999 | 0 (0.0%) | 12 (5.3%) |
| $25,000 to $29,999 | 14 (5.8%) | 7 (3.1%) |
| $30,000 to $34,999 | 8 (3.3%) | 67 (29.4%) |
| $35,000 to $39,999 | 10 (4.1%) | 20 (8.8%) |
| $40,000 to $44,999 | 64 (26.5%) | 0 (0.0%) |
| $45,000 to $49,999 | 0 (0.0%) | 38 (16.7%) |
| $50,000 to $54,999 | 0 (0.0%) | 0 (0.0%) |
| $55,000 to $64,999 | 23 (9.5%) | 0 (0.0%) |
| $65,000 to $74,999 | 26 (10.7%) | 0 (0.0%) |
| $75,000 to $99,999 | 26 (10.7%) | 0 (0.0%) |
| $100,000+ | 27 (11.2%) | 0 (0.0%) |
| Total | 242 (100.0%) | 228 (100.0%) |
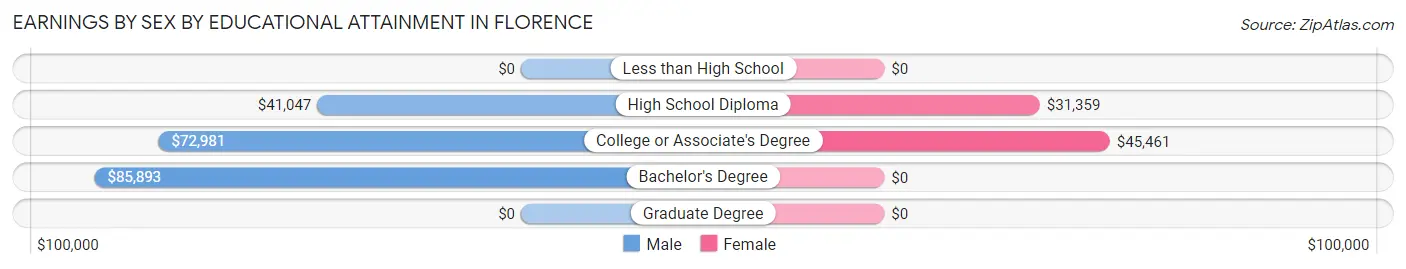
Earnings by Sex by Educational Attainment in Florence
Average earnings in Florence are $42,500 for men and $30,598 for women, a difference of 28.0%. Men with an educational attainment of bachelor's degree enjoy the highest average annual earnings of $85,893, while those with high school diploma education earn the least with $41,047. Women with an educational attainment of college or associate's degree earn the most with the average annual earnings of $45,461, while those with high school diploma education have the smallest earnings of $31,359.
| Educational Attainment | Male Income | Female Income |
| Less than High School | - | - |
| High School Diploma | $41,047 | $31,359 |
| College or Associate's Degree | $72,981 | $45,461 |
| Bachelor's Degree | $85,893 | $0 |
| Graduate Degree | - | - |
| Total | $42,500 | $30,598 |
Family Income in Florence
Family Income Brackets in Florence
According to the Florence family income data, there are 80 families falling into the $75,000 to $99,999 income range, which is the most common income bracket and makes up 27.1% of all families.
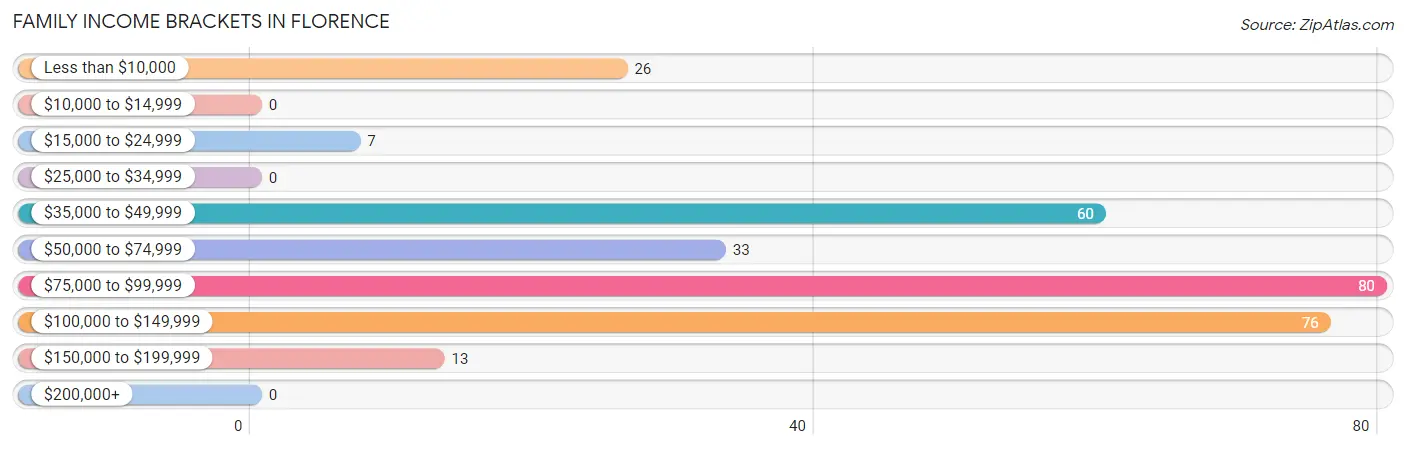
| Income Bracket | # Families | % Families |
| Less than $10,000 | 26 | 8.8% |
| $10,000 to $14,999 | 0 | 0.0% |
| $15,000 to $24,999 | 7 | 2.4% |
| $25,000 to $34,999 | 0 | 0.0% |
| $35,000 to $49,999 | 60 | 20.3% |
| $50,000 to $74,999 | 33 | 11.2% |
| $75,000 to $99,999 | 80 | 27.1% |
| $100,000 to $149,999 | 76 | 25.8% |
| $150,000 to $199,999 | 13 | 4.4% |
| $200,000+ | 0 | 0.0% |
Family Income by Famaliy Size in Florence
3-person families (69 | 23.4%) account for the highest median family income in Florence with $117,730 per family, while 3-person families (69 | 23.4%) have the highest median income of $39,243 per family member.
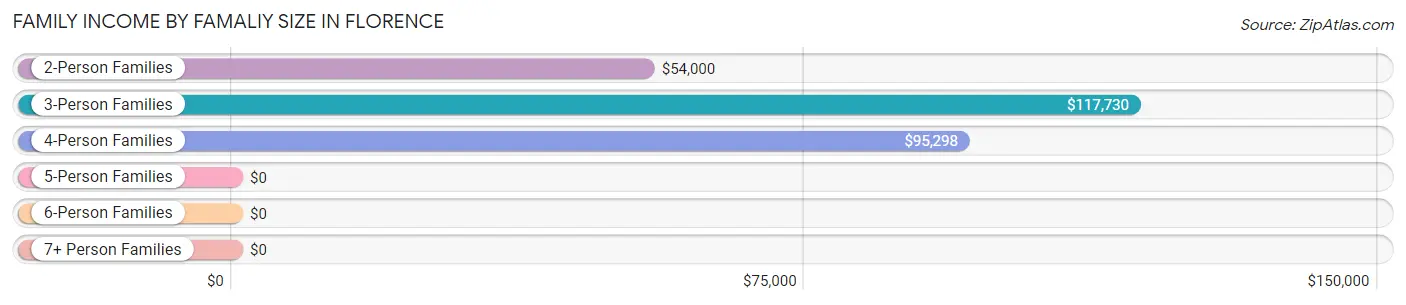
| Income Bracket | # Families | Median Income |
| 2-Person Families | 158 (53.6%) | $54,000 |
| 3-Person Families | 69 (23.4%) | $117,730 |
| 4-Person Families | 37 (12.5%) | $95,298 |
| 5-Person Families | 20 (6.8%) | $0 |
| 6-Person Families | 11 (3.7%) | $0 |
| 7+ Person Families | 0 (0.0%) | $0 |
| Total | 295 (100.0%) | $88,295 |
Family Income by Number of Earners in Florence
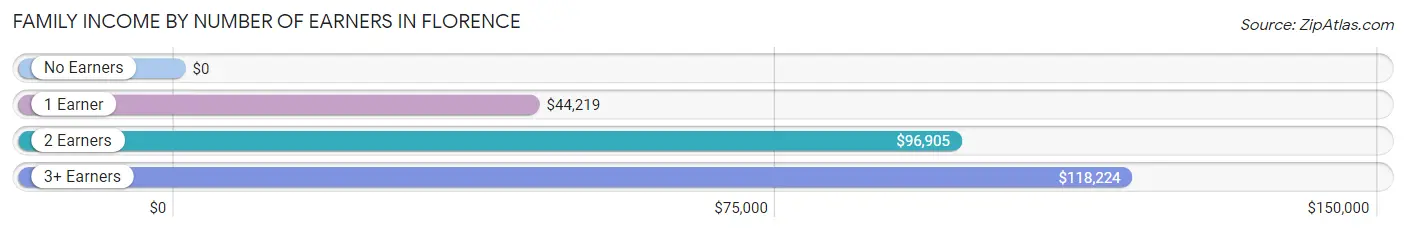
| Number of Earners | # Families | Median Income |
| No Earners | 122 (41.4%) | $0 |
| 1 Earner | 57 (19.3%) | $44,219 |
| 2 Earners | 62 (21.0%) | $96,905 |
| 3+ Earners | 54 (18.3%) | $118,224 |
| Total | 295 (100.0%) | $88,295 |
Household Income in Florence
Household Income Brackets in Florence
With 83 households falling in the category, the $100,000 to $149,999 income range is the most frequent in Florence, accounting for 18.3% of all households.
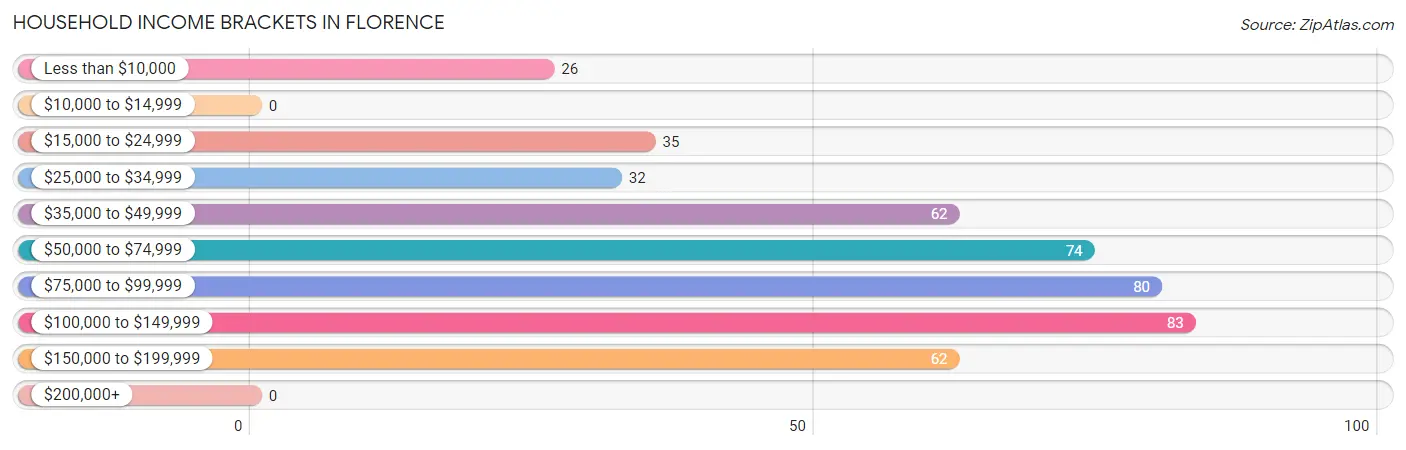
| Income Bracket | # Households | % Households |
| Less than $10,000 | 26 | 5.7% |
| $10,000 to $14,999 | 0 | 0.0% |
| $15,000 to $24,999 | 35 | 7.7% |
| $25,000 to $34,999 | 32 | 7.0% |
| $35,000 to $49,999 | 62 | 13.7% |
| $50,000 to $74,999 | 74 | 16.3% |
| $75,000 to $99,999 | 80 | 17.6% |
| $100,000 to $149,999 | 83 | 18.3% |
| $150,000 to $199,999 | 62 | 13.7% |
| $200,000+ | 0 | 0.0% |
Household Income by Householder Age in Florence
The median household income in Florence is $74,615, with the highest median household income of $95,298 found in the 25 to 44 years age bracket for the primary householder. A total of 89 households (19.6%) fall into this category. Meanwhile, the 15 to 24 years age bracket for the primary householder has the lowest median household income of $0, with 33 households (7.3%) in this group.
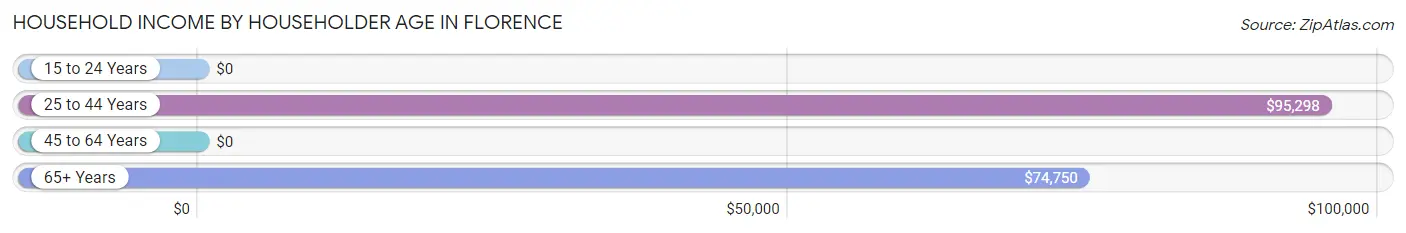
| Income Bracket | # Households | Median Income |
| 15 to 24 Years | 33 (7.3%) | $0 |
| 25 to 44 Years | 89 (19.6%) | $95,298 |
| 45 to 64 Years | 123 (27.1%) | $0 |
| 65+ Years | 209 (46.0%) | $74,750 |
| Total | 454 (100.0%) | $74,615 |
Poverty in Florence
Income Below Poverty by Sex and Age in Florence
With 11.1% poverty level for males and 9.9% for females among the residents of Florence, 15 year old males and 45 to 54 year old females are the most vulnerable to poverty, with 11 males (100.0%) and 16 females (44.4%) in their respective age groups living below the poverty level.
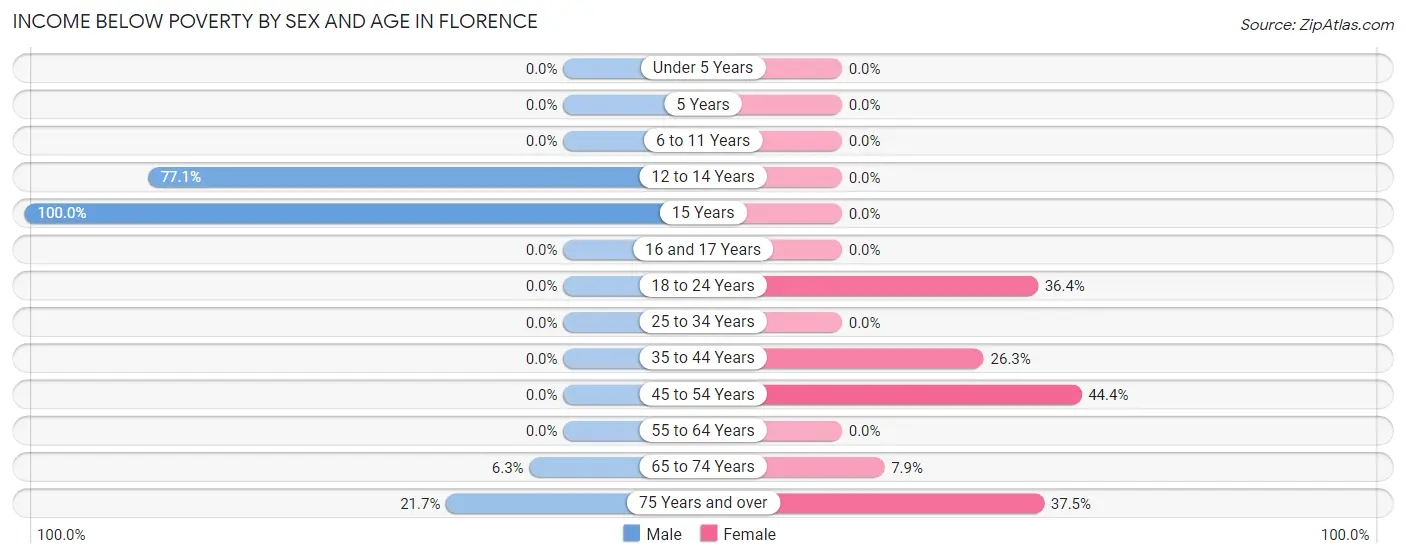
| Age Bracket | Male | Female |
| Under 5 Years | 0 (0.0%) | 0 (0.0%) |
| 5 Years | 0 (0.0%) | 0 (0.0%) |
| 6 to 11 Years | 0 (0.0%) | 0 (0.0%) |
| 12 to 14 Years | 27 (77.1%) | 0 (0.0%) |
| 15 Years | 11 (100.0%) | 0 (0.0%) |
| 16 and 17 Years | 0 (0.0%) | 0 (0.0%) |
| 18 to 24 Years | 0 (0.0%) | 12 (36.4%) |
| 25 to 34 Years | 0 (0.0%) | 0 (0.0%) |
| 35 to 44 Years | 0 (0.0%) | 10 (26.3%) |
| 45 to 54 Years | 0 (0.0%) | 16 (44.4%) |
| 55 to 64 Years | 0 (0.0%) | 0 (0.0%) |
| 65 to 74 Years | 8 (6.3%) | 7 (7.9%) |
| 75 Years and over | 10 (21.7%) | 9 (37.5%) |
| Total | 56 (11.1%) | 54 (9.9%) |
Income Above Poverty by Sex and Age in Florence
According to the poverty statistics in Florence, males aged under 5 years and females aged under 5 years are the age groups that are most secure financially, with 100.0% of males and 100.0% of females in these age groups living above the poverty line.
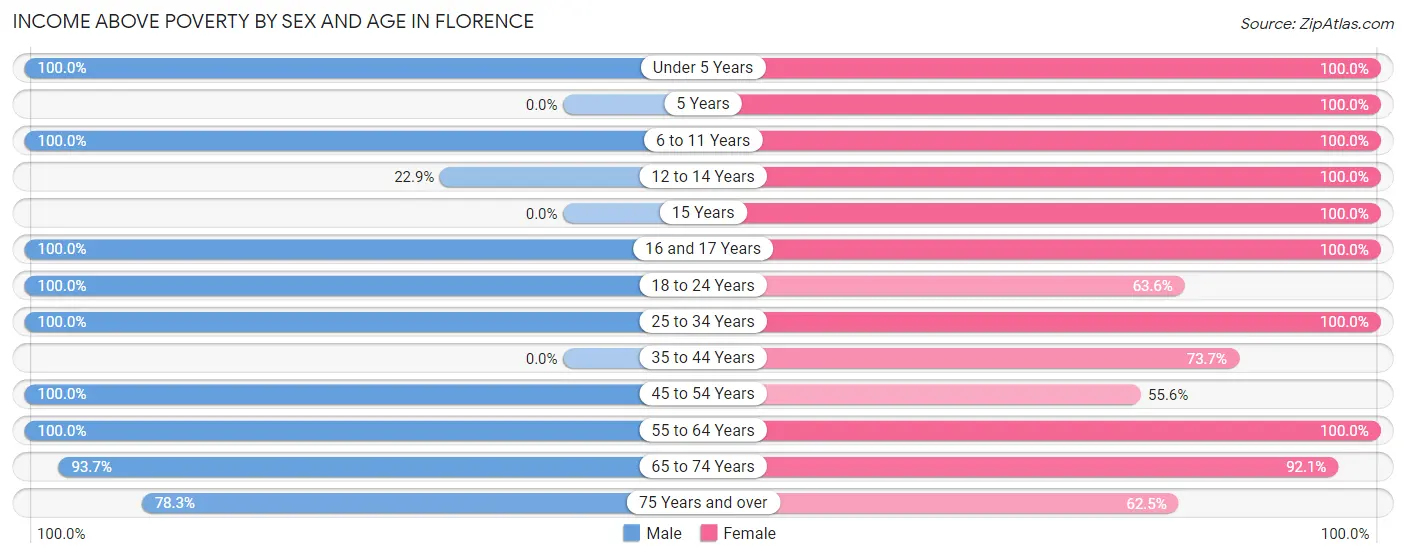
| Age Bracket | Male | Female |
| Under 5 Years | 5 (100.0%) | 36 (100.0%) |
| 5 Years | 0 (0.0%) | 39 (100.0%) |
| 6 to 11 Years | 8 (100.0%) | 22 (100.0%) |
| 12 to 14 Years | 8 (22.9%) | 27 (100.0%) |
| 15 Years | 0 (0.0%) | 15 (100.0%) |
| 16 and 17 Years | 18 (100.0%) | 9 (100.0%) |
| 18 to 24 Years | 42 (100.0%) | 21 (63.6%) |
| 25 to 34 Years | 89 (100.0%) | 32 (100.0%) |
| 35 to 44 Years | 0 (0.0%) | 28 (73.7%) |
| 45 to 54 Years | 28 (100.0%) | 20 (55.6%) |
| 55 to 64 Years | 94 (100.0%) | 143 (100.0%) |
| 65 to 74 Years | 119 (93.7%) | 82 (92.1%) |
| 75 Years and over | 36 (78.3%) | 15 (62.5%) |
| Total | 447 (88.9%) | 489 (90.1%) |
Income Below Poverty Among Married-Couple Families in Florence
The poverty statistics for married-couple families in Florence show that 7.2% or 17 of the total 235 families live below the poverty line. Families with 1 or 2 children have the highest poverty rate of 10.0%, comprising of 7 families. On the other hand, families with 3 or 4 children have the lowest poverty rate of 0.0%, which includes 0 families.
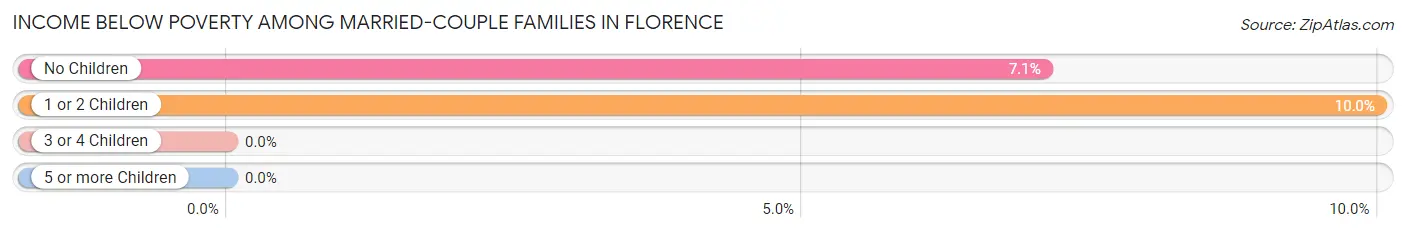
| Children | Above Poverty | Below Poverty |
| No Children | 131 (92.9%) | 10 (7.1%) |
| 1 or 2 Children | 63 (90.0%) | 7 (10.0%) |
| 3 or 4 Children | 24 (100.0%) | 0 (0.0%) |
| 5 or more Children | 0 (0.0%) | 0 (0.0%) |
| Total | 218 (92.8%) | 17 (7.2%) |
Income Below Poverty Among Single-Parent Households in Florence
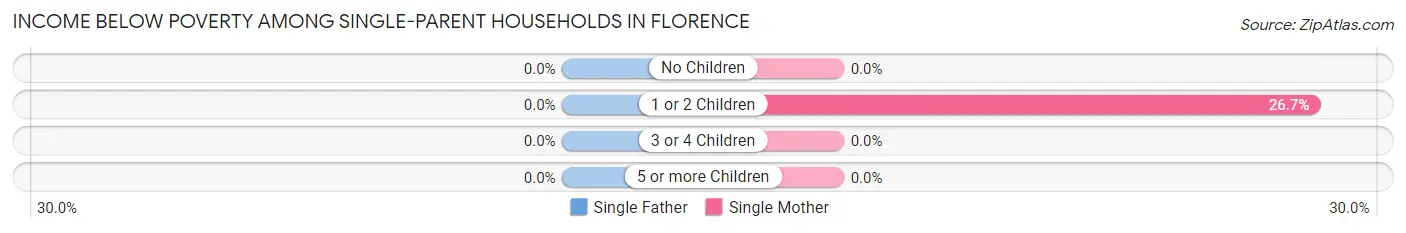
| Children | Single Father | Single Mother |
| No Children | 0 (0.0%) | 0 (0.0%) |
| 1 or 2 Children | 0 (0.0%) | 16 (26.7%) |
| 3 or 4 Children | 0 (0.0%) | 0 (0.0%) |
| 5 or more Children | 0 (0.0%) | 0 (0.0%) |
| Total | 0 (0.0%) | 16 (26.7%) |
Income Below Poverty Among Married-Couple vs Single-Parent Households in Florence
The poverty data for Florence shows that 17 of the married-couple family households (7.2%) and 16 of the single-parent households (26.7%) are living below the poverty level. Within the married-couple family households, those with 1 or 2 children have the highest poverty rate, with 7 households (10.0%) falling below the poverty line. Among the single-parent households, those with 1 or 2 children have the highest poverty rate, with 16 household (26.7%) living below poverty.
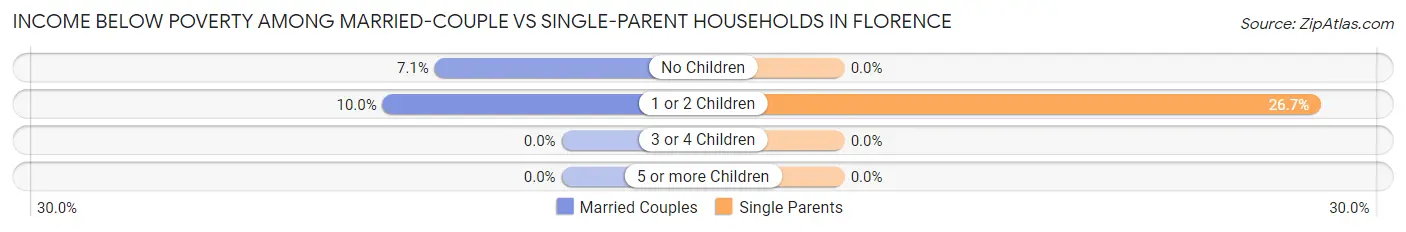
| Children | Married-Couple Families | Single-Parent Households |
| No Children | 10 (7.1%) | 0 (0.0%) |
| 1 or 2 Children | 7 (10.0%) | 16 (26.7%) |
| 3 or 4 Children | 0 (0.0%) | 0 (0.0%) |
| 5 or more Children | 0 (0.0%) | 0 (0.0%) |
| Total | 17 (7.2%) | 16 (26.7%) |
Race in Florence
The most populous races in Florence are White / Caucasian (897 | 85.8%), Two or more Races (129 | 12.3%), and Hispanic or Latino (65 | 6.2%).
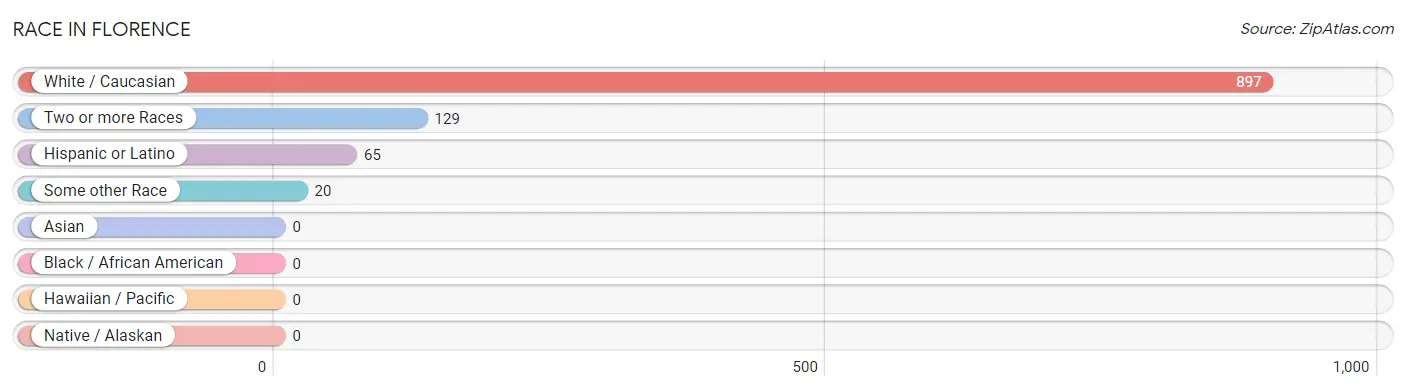
| Race | # Population | % Population |
| Asian | 0 | 0.0% |
| Black / African American | 0 | 0.0% |
| Hawaiian / Pacific | 0 | 0.0% |
| Hispanic or Latino | 65 | 6.2% |
| Native / Alaskan | 0 | 0.0% |
| White / Caucasian | 897 | 85.8% |
| Two or more Races | 129 | 12.3% |
| Some other Race | 20 | 1.9% |
| Total | 1,046 | 100.0% |
Ancestry in Florence
The most populous ancestries reported in Florence are German (409 | 39.1%), Irish (166 | 15.9%), English (149 | 14.2%), Polish (85 | 8.1%), and Norwegian (77 | 7.4%), together accounting for 84.7% of all Florence residents.
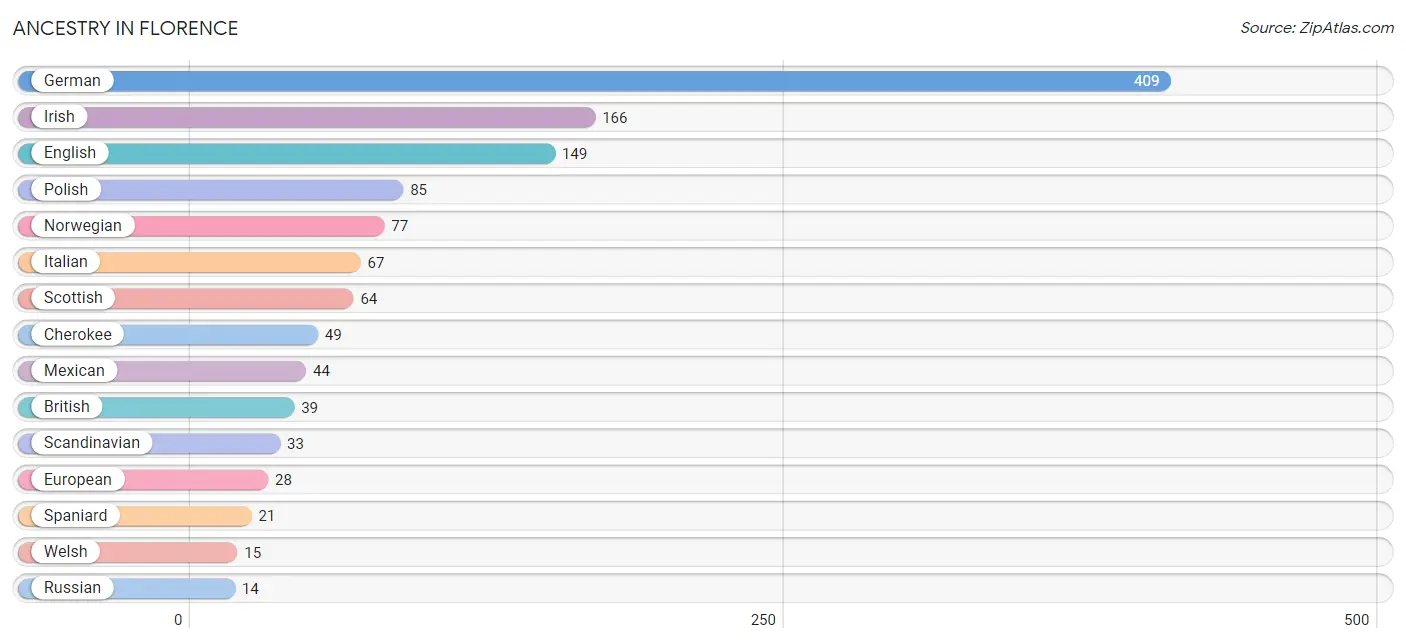
| Ancestry | # Population | % Population |
| British | 39 | 3.7% |
| Cherokee | 49 | 4.7% |
| English | 149 | 14.2% |
| European | 28 | 2.7% |
| German | 409 | 39.1% |
| Irish | 166 | 15.9% |
| Iroquois | 5 | 0.5% |
| Italian | 67 | 6.4% |
| Mexican | 44 | 4.2% |
| Norwegian | 77 | 7.4% |
| Polish | 85 | 8.1% |
| Russian | 14 | 1.3% |
| Scandinavian | 33 | 3.2% |
| Scotch-Irish | 6 | 0.6% |
| Scottish | 64 | 6.1% |
| Spaniard | 21 | 2.0% |
| Swedish | 10 | 1.0% |
| Welsh | 15 | 1.4% | View All 18 Rows |
Immigrants in Florence

| Immigration Origin | # Population | % Population | View All 0 Rows |
Sex and Age in Florence
Sex and Age in Florence
The most populous age groups in Florence are 70 to 74 Years (99 | 19.7%) for men and 60 to 64 Years (84 | 15.5%) for women.
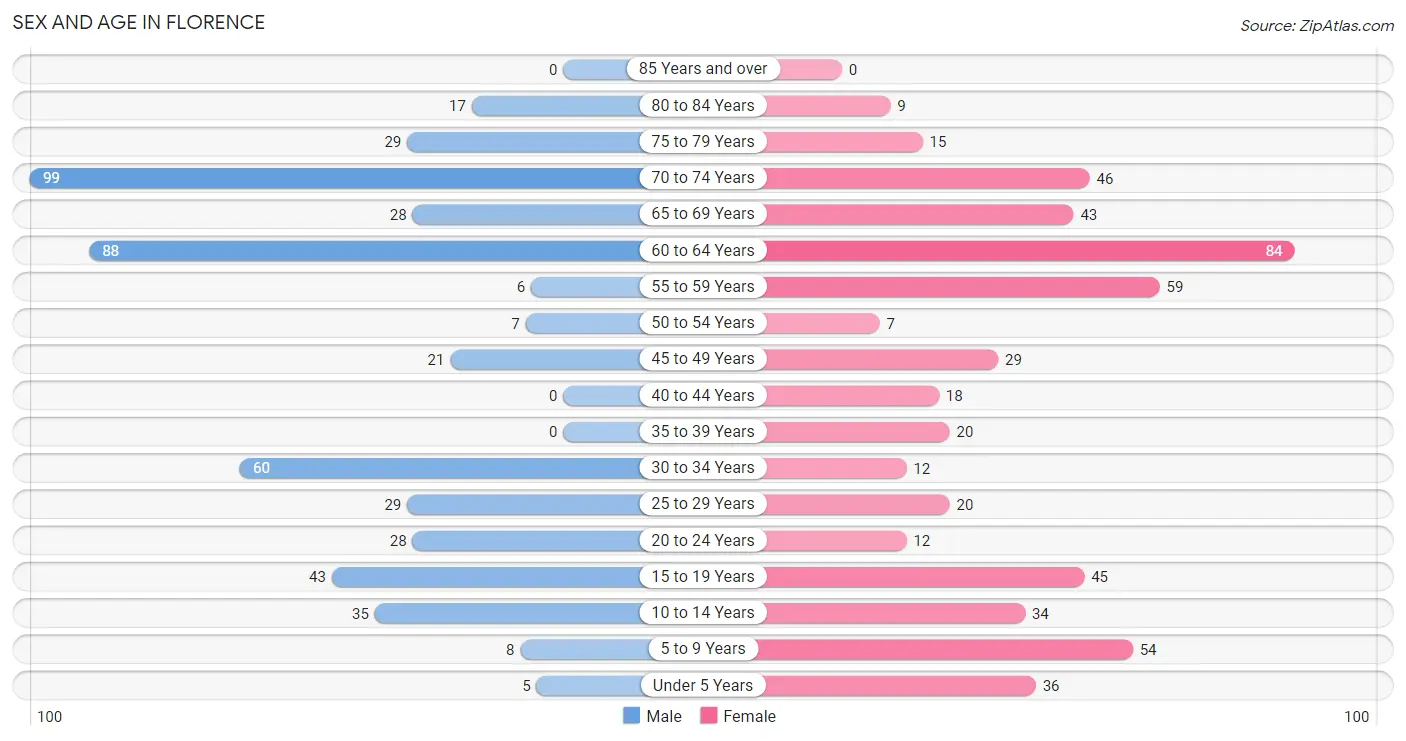
| Age Bracket | Male | Female |
| Under 5 Years | 5 (1.0%) | 36 (6.6%) |
| 5 to 9 Years | 8 (1.6%) | 54 (9.9%) |
| 10 to 14 Years | 35 (7.0%) | 34 (6.3%) |
| 15 to 19 Years | 43 (8.6%) | 45 (8.3%) |
| 20 to 24 Years | 28 (5.6%) | 12 (2.2%) |
| 25 to 29 Years | 29 (5.8%) | 20 (3.7%) |
| 30 to 34 Years | 60 (11.9%) | 12 (2.2%) |
| 35 to 39 Years | 0 (0.0%) | 20 (3.7%) |
| 40 to 44 Years | 0 (0.0%) | 18 (3.3%) |
| 45 to 49 Years | 21 (4.2%) | 29 (5.3%) |
| 50 to 54 Years | 7 (1.4%) | 7 (1.3%) |
| 55 to 59 Years | 6 (1.2%) | 59 (10.9%) |
| 60 to 64 Years | 88 (17.5%) | 84 (15.5%) |
| 65 to 69 Years | 28 (5.6%) | 43 (7.9%) |
| 70 to 74 Years | 99 (19.7%) | 46 (8.5%) |
| 75 to 79 Years | 29 (5.8%) | 15 (2.8%) |
| 80 to 84 Years | 17 (3.4%) | 9 (1.7%) |
| 85 Years and over | 0 (0.0%) | 0 (0.0%) |
| Total | 503 (100.0%) | 543 (100.0%) |
Families and Households in Florence
Median Family Size in Florence
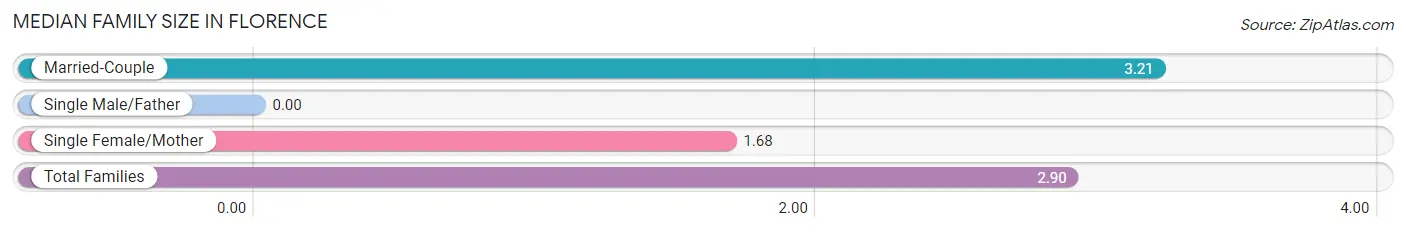
| Family Type | # Families | Family Size |
| Married-Couple | 235 (79.7%) | 3.21 |
| Single Male/Father | 0 (0.0%) | - |
| Single Female/Mother | 60 (20.3%) | 1.68 |
| Total Families | 295 (100.0%) | 2.90 |
Median Household Size in Florence
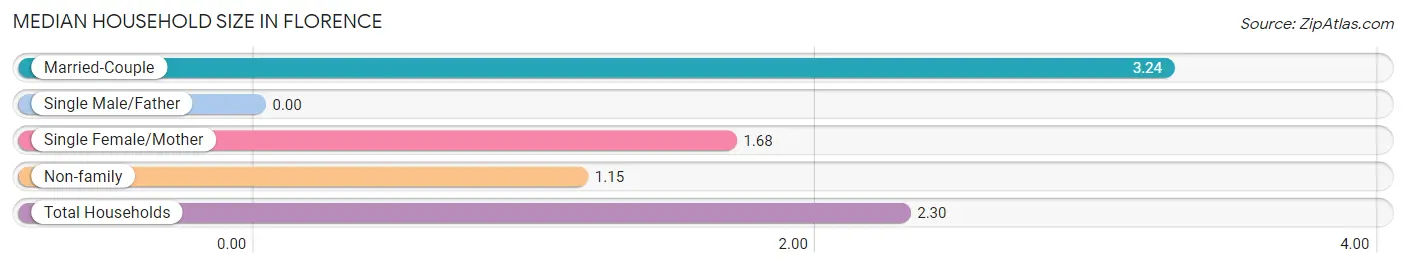
| Household Type | # Households | Household Size |
| Married-Couple | 235 (51.8%) | 3.24 |
| Single Male/Father | 0 (0.0%) | - |
| Single Female/Mother | 60 (13.2%) | 1.68 |
| Non-family | 159 (35.0%) | 1.15 |
| Total Households | 454 (100.0%) | 2.30 |
Household Size by Marriage Status in Florence
Out of a total of 454 households in Florence, 295 (65.0%) are family households, while 159 (35.0%) are nonfamily households. The most numerous type of family households are 2-person households, comprising 158, and the most common type of nonfamily households are 1-person households, comprising 126.
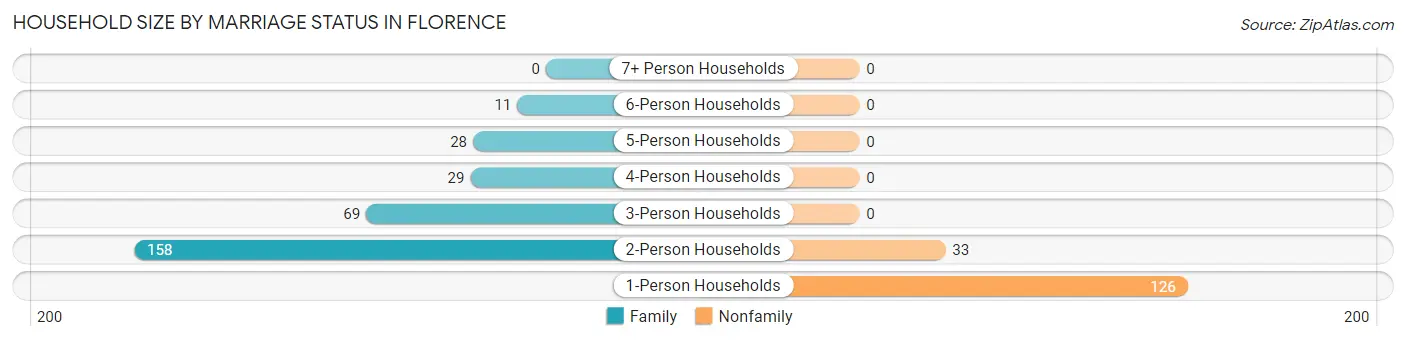
| Household Size | Family Households | Nonfamily Households |
| 1-Person Households | - | 126 (27.8%) |
| 2-Person Households | 158 (34.8%) | 33 (7.3%) |
| 3-Person Households | 69 (15.2%) | 0 (0.0%) |
| 4-Person Households | 29 (6.4%) | 0 (0.0%) |
| 5-Person Households | 28 (6.2%) | 0 (0.0%) |
| 6-Person Households | 11 (2.4%) | 0 (0.0%) |
| 7+ Person Households | 0 (0.0%) | 0 (0.0%) |
| Total | 295 (65.0%) | 159 (35.0%) |
Female Fertility in Florence
Fertility by Age in Florence
Average fertility rate in Florence is 128.0 births per 1,000 women. Women in the age bracket of 20 to 34 years have the highest fertility rate with 455.0 births per 1,000 women. Women in the age bracket of 20 to 34 years acount for 100.0% of all women with births.
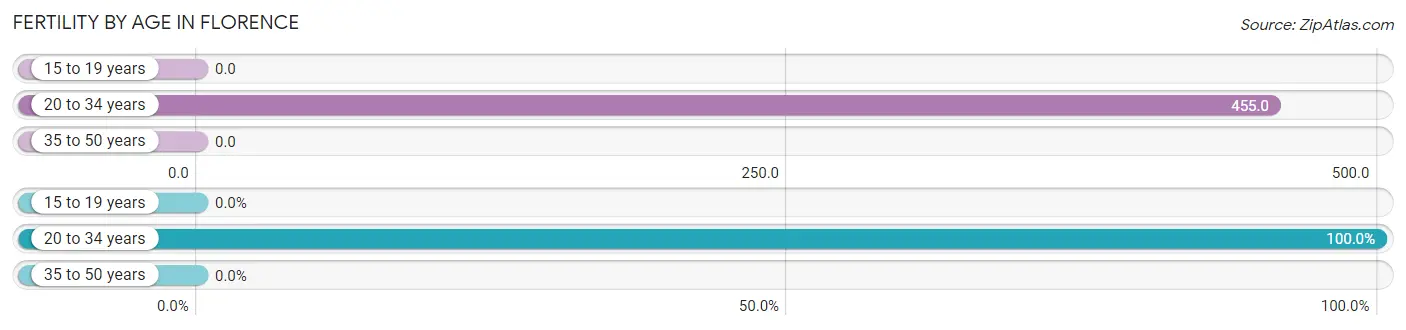
| Age Bracket | Women with Births | Births / 1,000 Women |
| 15 to 19 years | 0 (0.0%) | 0.0 |
| 20 to 34 years | 20 (100.0%) | 455.0 |
| 35 to 50 years | 0 (0.0%) | 0.0 |
| Total | 20 (100.0%) | 128.0 |
Fertility by Age by Marriage Status in Florence
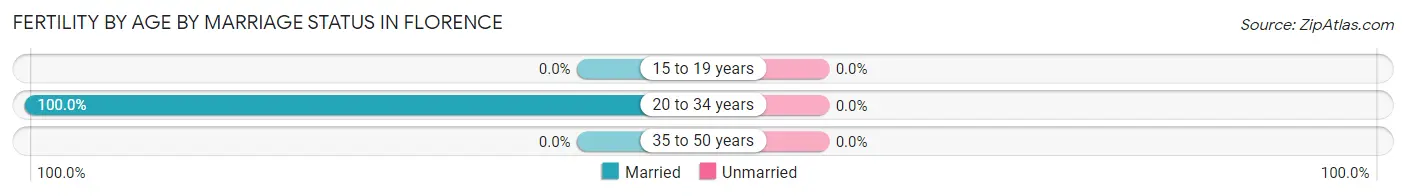
| Age Bracket | Married | Unmarried |
| 15 to 19 years | 0 (0.0%) | 0 (0.0%) |
| 20 to 34 years | 20 (100.0%) | 0 (0.0%) |
| 35 to 50 years | 0 (0.0%) | 0 (0.0%) |
| Total | 20 (100.0%) | 0 (0.0%) |
Fertility by Education in Florence
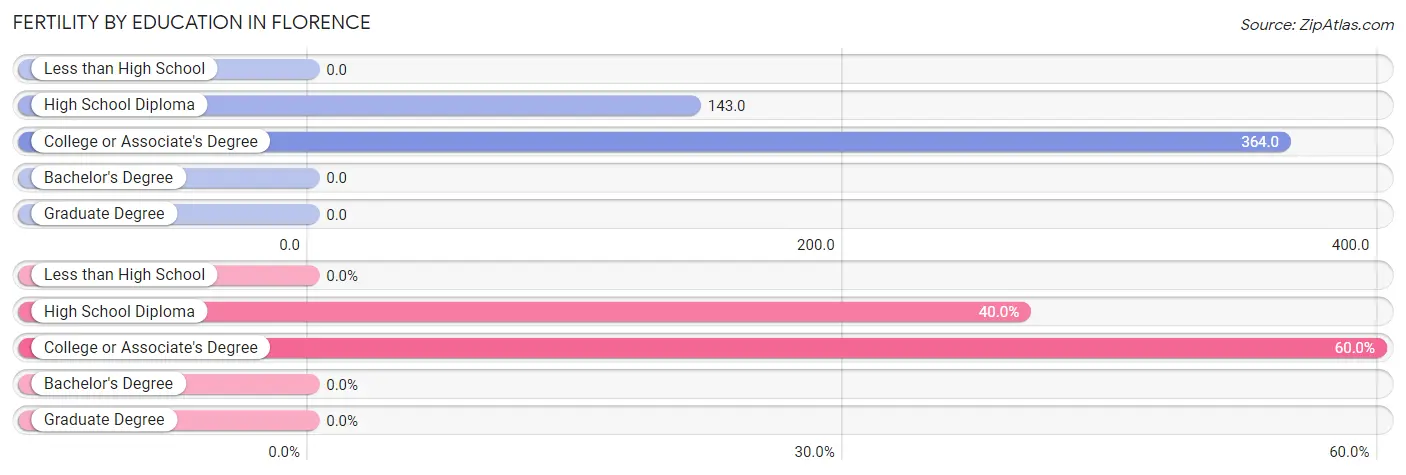
| Educational Attainment | Women with Births | Births / 1,000 Women |
| Less than High School | 0 (0.0%) | 0.0 |
| High School Diploma | 8 (40.0%) | 143.0 |
| College or Associate's Degree | 12 (60.0%) | 364.0 |
| Bachelor's Degree | 0 (0.0%) | 0.0 |
| Graduate Degree | 0 (0.0%) | 0.0 |
| Total | 20 (100.0%) | 128.0 |
Fertility by Education by Marriage Status in Florence
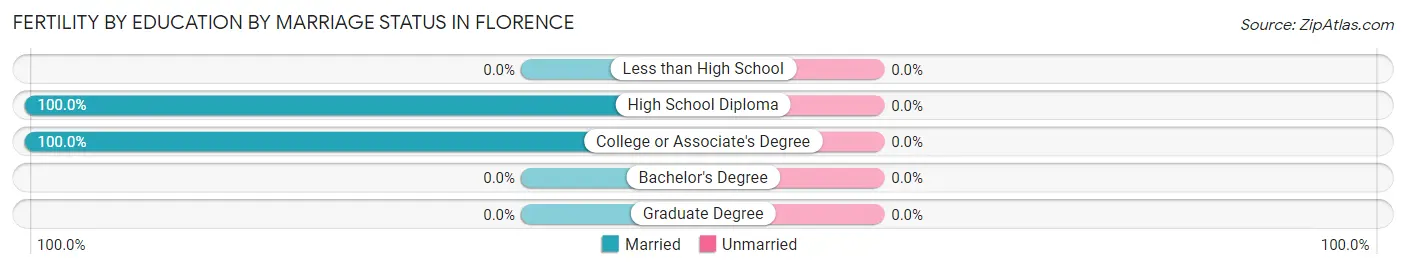
| Educational Attainment | Married | Unmarried |
| Less than High School | 0 (0.0%) | 0 (0.0%) |
| High School Diploma | 8 (100.0%) | 0 (0.0%) |
| College or Associate's Degree | 12 (100.0%) | 0 (0.0%) |
| Bachelor's Degree | 0 (0.0%) | 0 (0.0%) |
| Graduate Degree | 0 (0.0%) | 0 (0.0%) |
| Total | 20 (100.0%) | 0 (0.0%) |
Employment Characteristics in Florence
Employment by Class of Employer in Florence
Among the 385 employed individuals in Florence, private company employees (198 | 51.4%), not-for-profit organizations (92 | 23.9%), and self-employed (not incorporated) (38 | 9.9%) make up the most common classes of employment.
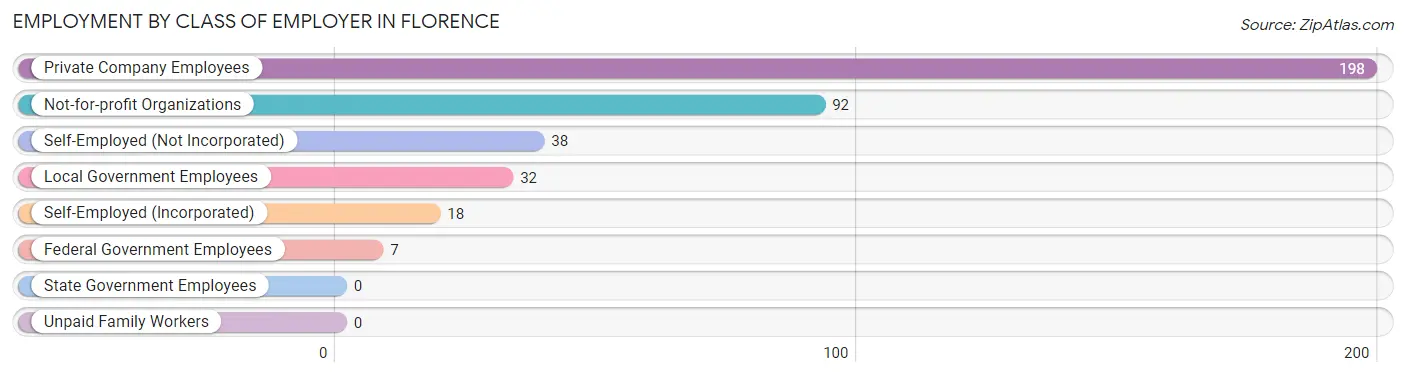
| Employer Class | # Employees | % Employees |
| Private Company Employees | 198 | 51.4% |
| Self-Employed (Incorporated) | 18 | 4.7% |
| Self-Employed (Not Incorporated) | 38 | 9.9% |
| Not-for-profit Organizations | 92 | 23.9% |
| Local Government Employees | 32 | 8.3% |
| State Government Employees | 0 | 0.0% |
| Federal Government Employees | 7 | 1.8% |
| Unpaid Family Workers | 0 | 0.0% |
| Total | 385 | 100.0% |
Employment Status by Age in Florence
According to the labor force statistics for Florence, out of the total population over 16 years of age (848), 55.5% or 471 individuals are in the labor force, with 11.7% or 55 of them unemployed. The age group with the highest labor force participation rate is 20 to 24 years, with 100.0% or 40 individuals in the labor force. Within the labor force, the 65 to 74 years age range has the highest percentage of unemployed individuals, with 78.7% or 37 of them being unemployed.
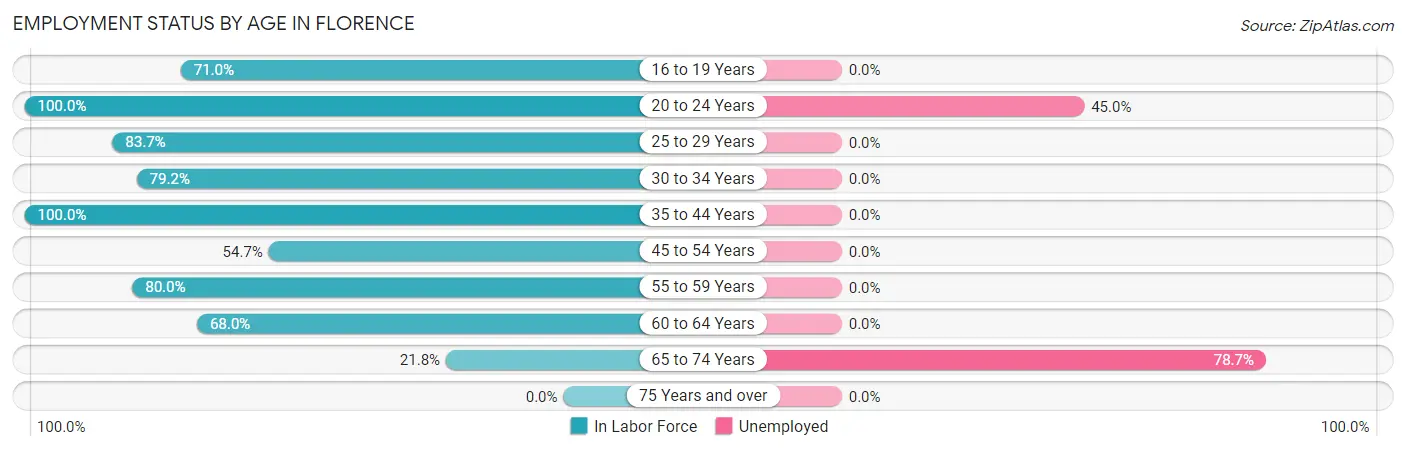
| Age Bracket | In Labor Force | Unemployed |
| 16 to 19 Years | 44 (71.0%) | 0 (0.0%) |
| 20 to 24 Years | 40 (100.0%) | 18 (45.0%) |
| 25 to 29 Years | 41 (83.7%) | 0 (0.0%) |
| 30 to 34 Years | 57 (79.2%) | 0 (0.0%) |
| 35 to 44 Years | 38 (100.0%) | 0 (0.0%) |
| 45 to 54 Years | 35 (54.7%) | 0 (0.0%) |
| 55 to 59 Years | 52 (80.0%) | 0 (0.0%) |
| 60 to 64 Years | 117 (68.0%) | 0 (0.0%) |
| 65 to 74 Years | 47 (21.8%) | 37 (78.7%) |
| 75 Years and over | 0 (0.0%) | 0 (0.0%) |
| Total | 471 (55.5%) | 55 (11.7%) |
Employment Status by Educational Attainment in Florence
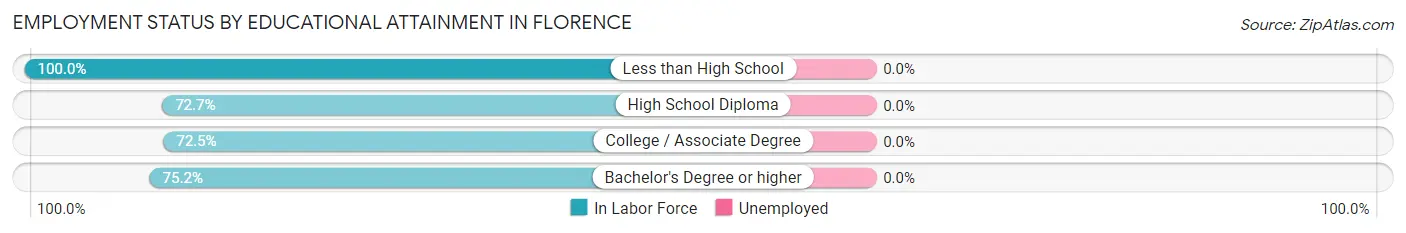
| Educational Attainment | In Labor Force | Unemployed |
| Less than High School | 12 (100.0%) | 0 (0.0%) |
| High School Diploma | 125 (72.7%) | 0 (0.0%) |
| College / Associate Degree | 124 (72.5%) | 0 (0.0%) |
| Bachelor's Degree or higher | 79 (75.2%) | 0 (0.0%) |
| Total | 340 (73.9%) | 0 (0.0%) |
Employment Occupations by Sex in Florence
Management, Business, Science and Arts Occupations
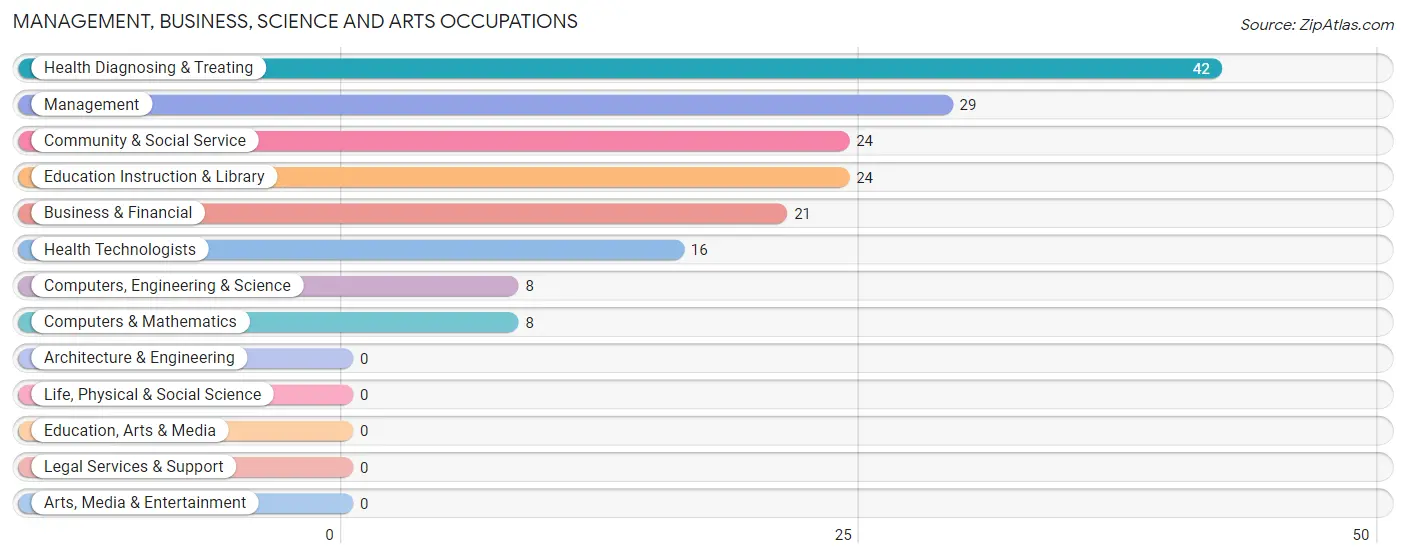
The most common Management, Business, Science and Arts occupations in Florence are Health Diagnosing & Treating (42 | 10.1%), Management (29 | 7.0%), Community & Social Service (24 | 5.8%), Education Instruction & Library (24 | 5.8%), and Business & Financial (21 | 5.1%).
Management, Business, Science and Arts Occupations by Sex
Within the Management, Business, Science and Arts occupations in Florence, the most male-oriented occupations are Business & Financial (100.0%), Computers, Engineering & Science (100.0%), and Computers & Mathematics (100.0%), while the most female-oriented occupations are Community & Social Service (100.0%), Education Instruction & Library (100.0%), and Health Technologists (50.0%).
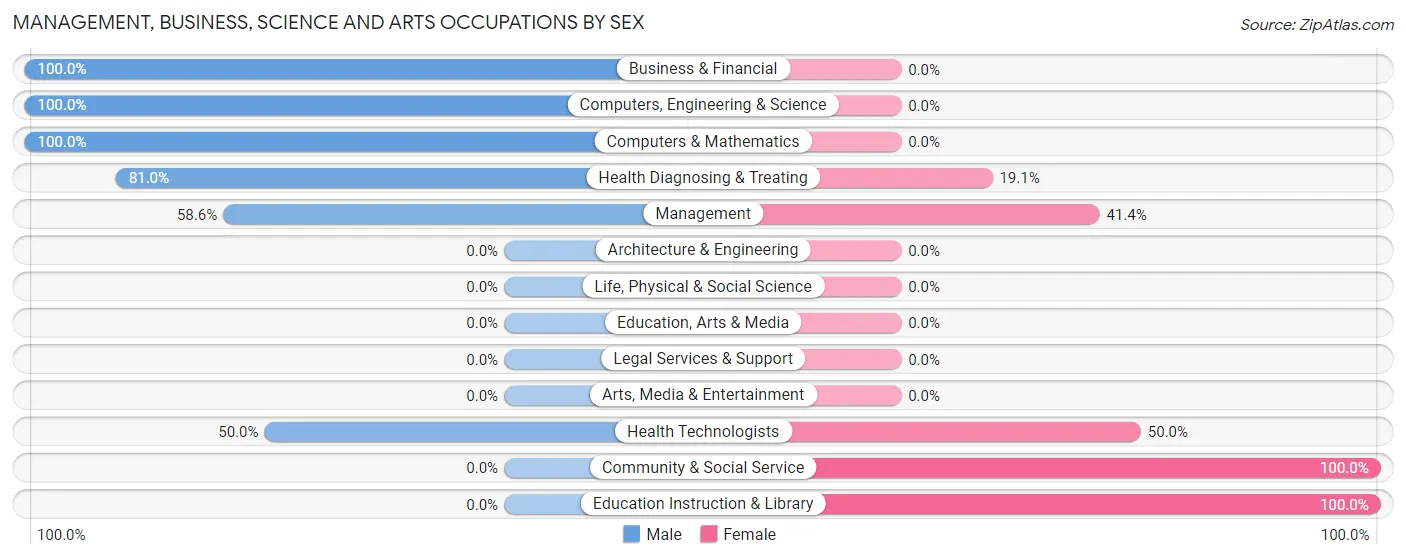
| Occupation | Male | Female |
| Management | 17 (58.6%) | 12 (41.4%) |
| Business & Financial | 21 (100.0%) | 0 (0.0%) |
| Computers, Engineering & Science | 8 (100.0%) | 0 (0.0%) |
| Computers & Mathematics | 8 (100.0%) | 0 (0.0%) |
| Architecture & Engineering | 0 (0.0%) | 0 (0.0%) |
| Life, Physical & Social Science | 0 (0.0%) | 0 (0.0%) |
| Community & Social Service | 0 (0.0%) | 24 (100.0%) |
| Education, Arts & Media | 0 (0.0%) | 0 (0.0%) |
| Legal Services & Support | 0 (0.0%) | 0 (0.0%) |
| Education Instruction & Library | 0 (0.0%) | 24 (100.0%) |
| Arts, Media & Entertainment | 0 (0.0%) | 0 (0.0%) |
| Health Diagnosing & Treating | 34 (80.9%) | 8 (19.1%) |
| Health Technologists | 8 (50.0%) | 8 (50.0%) |
| Total (Category) | 80 (64.5%) | 44 (35.5%) |
| Total (Overall) | 204 (49.0%) | 212 (51.0%) |
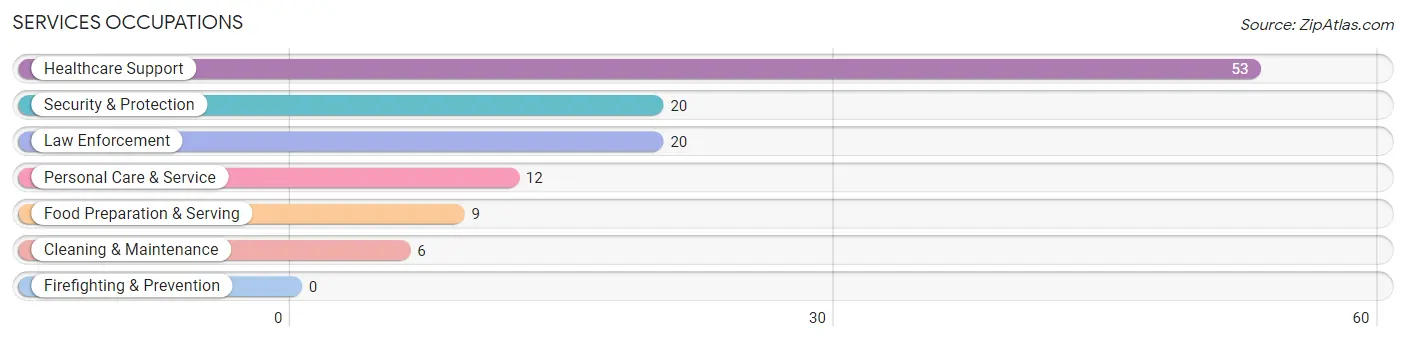
Services Occupations
The most common Services occupations in Florence are Healthcare Support (53 | 12.7%), Security & Protection (20 | 4.8%), Law Enforcement (20 | 4.8%), Personal Care & Service (12 | 2.9%), and Food Preparation & Serving (9 | 2.2%).
Services Occupations by Sex
Within the Services occupations in Florence, the most male-oriented occupations are Security & Protection (100.0%), Law Enforcement (100.0%), and Cleaning & Maintenance (100.0%), while the most female-oriented occupations are Healthcare Support (100.0%), Food Preparation & Serving (100.0%), and Personal Care & Service (100.0%).
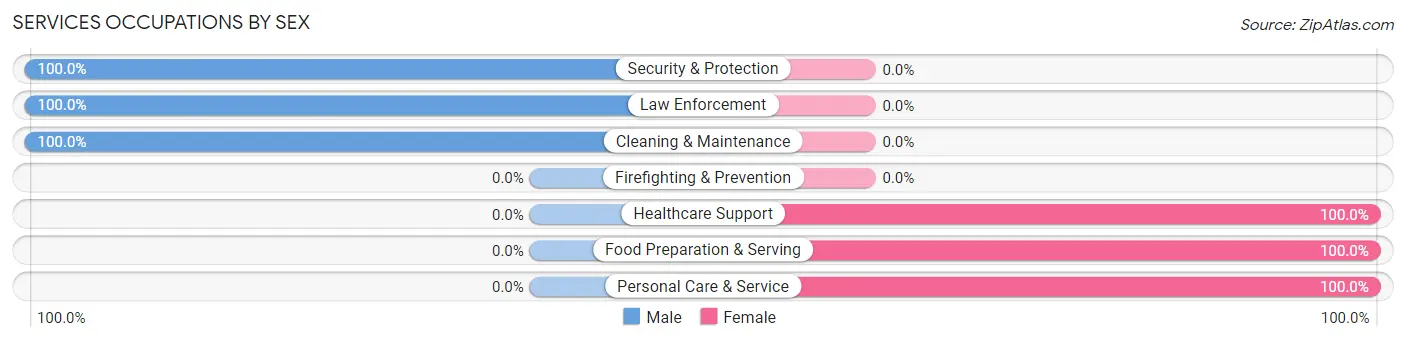
| Occupation | Male | Female |
| Healthcare Support | 0 (0.0%) | 53 (100.0%) |
| Security & Protection | 20 (100.0%) | 0 (0.0%) |
| Firefighting & Prevention | 0 (0.0%) | 0 (0.0%) |
| Law Enforcement | 20 (100.0%) | 0 (0.0%) |
| Food Preparation & Serving | 0 (0.0%) | 9 (100.0%) |
| Cleaning & Maintenance | 6 (100.0%) | 0 (0.0%) |
| Personal Care & Service | 0 (0.0%) | 12 (100.0%) |
| Total (Category) | 26 (26.0%) | 74 (74.0%) |
| Total (Overall) | 204 (49.0%) | 212 (51.0%) |
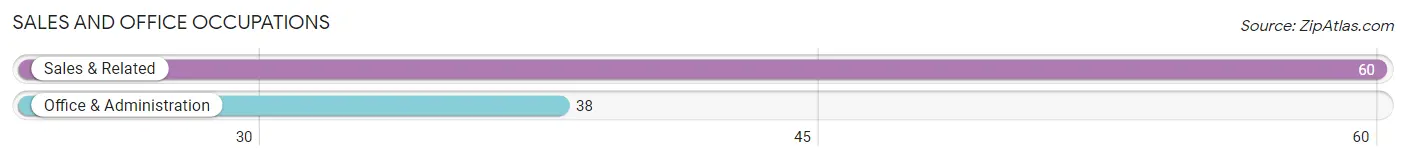
Sales and Office Occupations
The most common Sales and Office occupations in Florence are Sales & Related (60 | 14.4%), and Office & Administration (38 | 9.1%).
Sales and Office Occupations by Sex

| Occupation | Male | Female |
| Sales & Related | 50 (83.3%) | 10 (16.7%) |
| Office & Administration | 0 (0.0%) | 38 (100.0%) |
| Total (Category) | 50 (51.0%) | 48 (49.0%) |
| Total (Overall) | 204 (49.0%) | 212 (51.0%) |
Natural Resources, Construction and Maintenance Occupations
The most common Natural Resources, Construction and Maintenance occupations in Florence are , and Construction & Extraction (29 | 7.0%).
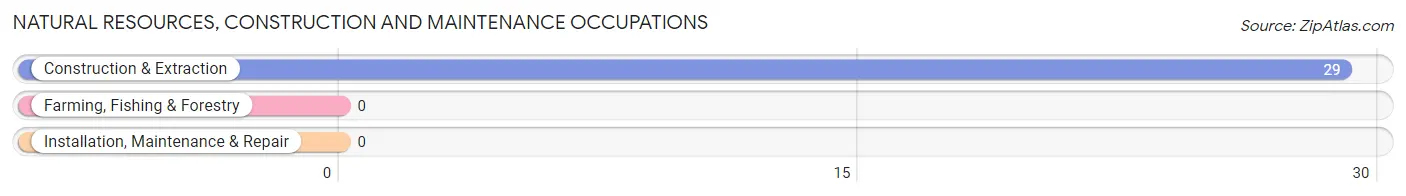
Natural Resources, Construction and Maintenance Occupations by Sex
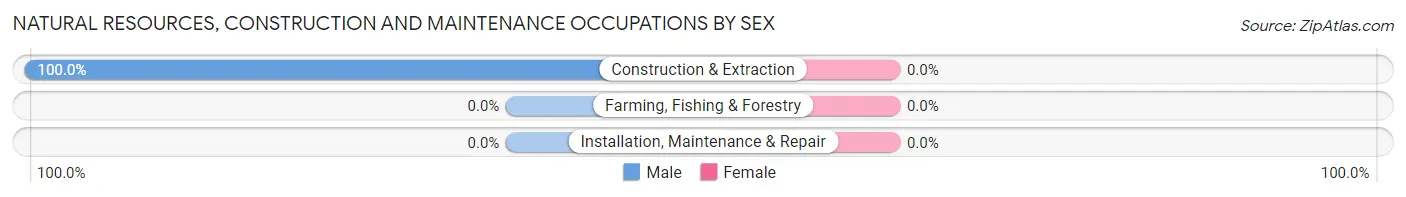
| Occupation | Male | Female |
| Farming, Fishing & Forestry | 0 (0.0%) | 0 (0.0%) |
| Construction & Extraction | 29 (100.0%) | 0 (0.0%) |
| Installation, Maintenance & Repair | 0 (0.0%) | 0 (0.0%) |
| Total (Category) | 29 (100.0%) | 0 (0.0%) |
| Total (Overall) | 204 (49.0%) | 212 (51.0%) |
Production, Transportation and Moving Occupations
The most common Production, Transportation and Moving occupations in Florence are , and Production (65 | 15.6%).
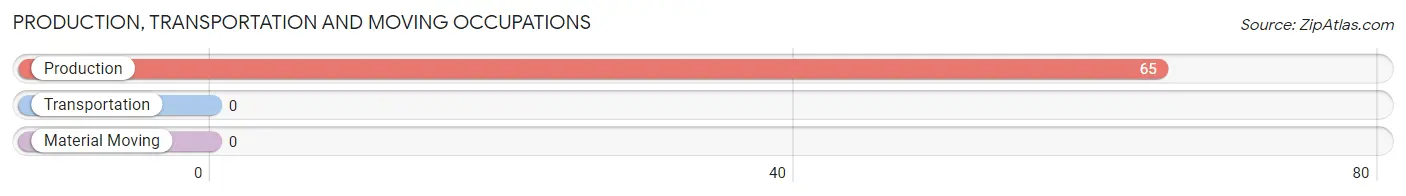
Production, Transportation and Moving Occupations by Sex
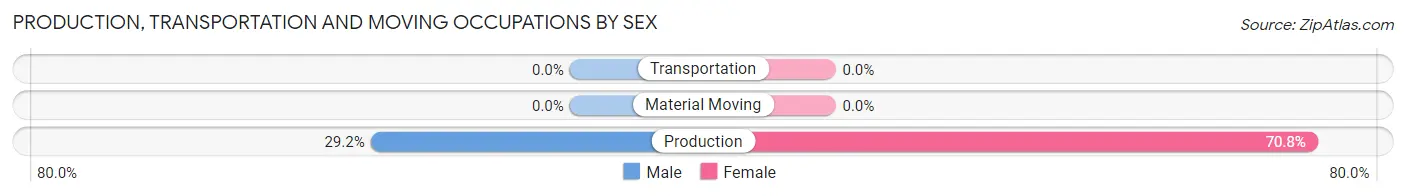
| Occupation | Male | Female |
| Production | 19 (29.2%) | 46 (70.8%) |
| Transportation | 0 (0.0%) | 0 (0.0%) |
| Material Moving | 0 (0.0%) | 0 (0.0%) |
| Total (Category) | 19 (29.2%) | 46 (70.8%) |
| Total (Overall) | 204 (49.0%) | 212 (51.0%) |
Employment Industries by Sex in Florence
Employment Industries in Florence
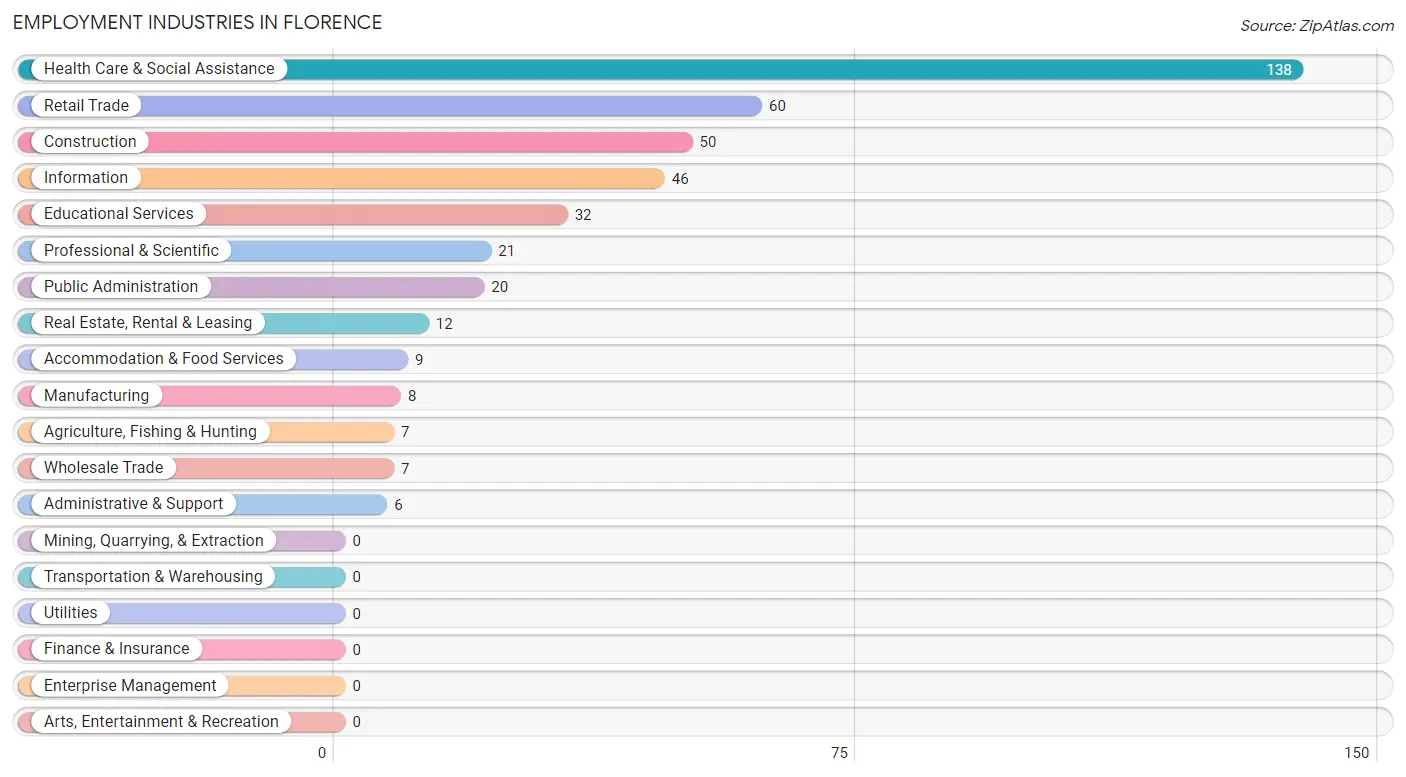
The major employment industries in Florence include Health Care & Social Assistance (138 | 33.2%), Retail Trade (60 | 14.4%), Construction (50 | 12.0%), Information (46 | 11.1%), and Educational Services (32 | 7.7%).
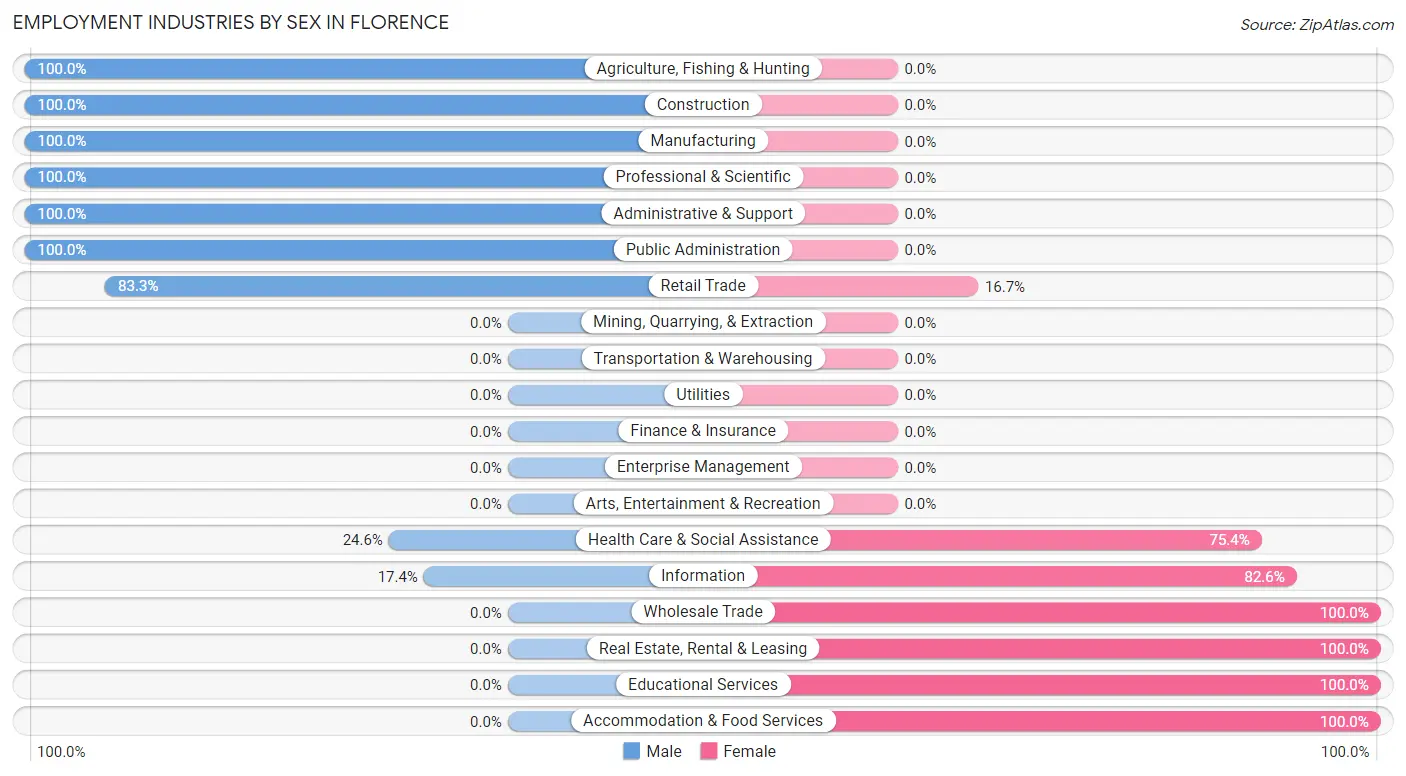
Employment Industries by Sex in Florence
The Florence industries that see more men than women are Agriculture, Fishing & Hunting (100.0%), Construction (100.0%), and Manufacturing (100.0%), whereas the industries that tend to have a higher number of women are Wholesale Trade (100.0%), Real Estate, Rental & Leasing (100.0%), and Educational Services (100.0%).
| Industry | Male | Female |
| Agriculture, Fishing & Hunting | 7 (100.0%) | 0 (0.0%) |
| Mining, Quarrying, & Extraction | 0 (0.0%) | 0 (0.0%) |
| Construction | 50 (100.0%) | 0 (0.0%) |
| Manufacturing | 8 (100.0%) | 0 (0.0%) |
| Wholesale Trade | 0 (0.0%) | 7 (100.0%) |
| Retail Trade | 50 (83.3%) | 10 (16.7%) |
| Transportation & Warehousing | 0 (0.0%) | 0 (0.0%) |
| Utilities | 0 (0.0%) | 0 (0.0%) |
| Information | 8 (17.4%) | 38 (82.6%) |
| Finance & Insurance | 0 (0.0%) | 0 (0.0%) |
| Real Estate, Rental & Leasing | 0 (0.0%) | 12 (100.0%) |
| Professional & Scientific | 21 (100.0%) | 0 (0.0%) |
| Enterprise Management | 0 (0.0%) | 0 (0.0%) |
| Administrative & Support | 6 (100.0%) | 0 (0.0%) |
| Educational Services | 0 (0.0%) | 32 (100.0%) |
| Health Care & Social Assistance | 34 (24.6%) | 104 (75.4%) |
| Arts, Entertainment & Recreation | 0 (0.0%) | 0 (0.0%) |
| Accommodation & Food Services | 0 (0.0%) | 9 (100.0%) |
| Public Administration | 20 (100.0%) | 0 (0.0%) |
| Total | 204 (49.0%) | 212 (51.0%) |
Education in Florence
School Enrollment in Florence
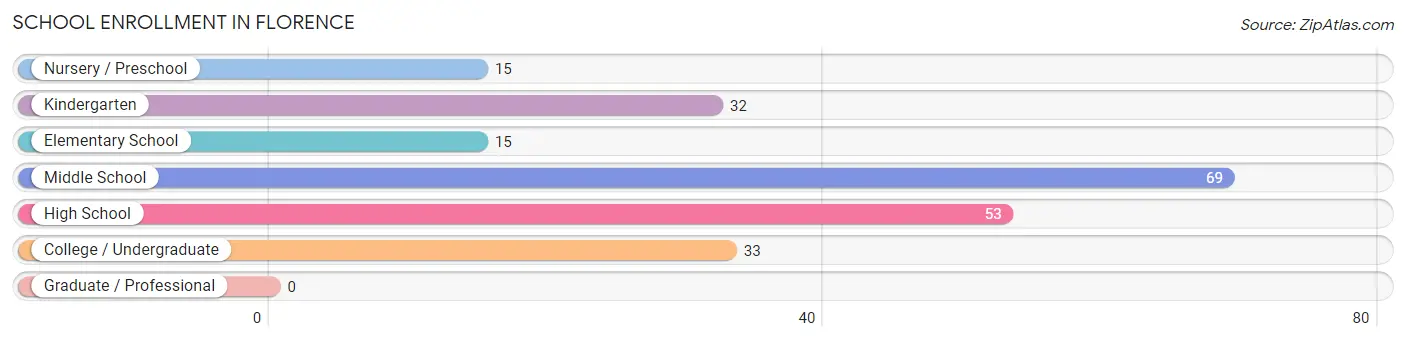
The most common levels of schooling among the 217 students in Florence are middle school (69 | 31.8%), high school (53 | 24.4%), and college / undergraduate (33 | 15.2%).
| School Level | # Students | % Students |
| Nursery / Preschool | 15 | 6.9% |
| Kindergarten | 32 | 14.7% |
| Elementary School | 15 | 6.9% |
| Middle School | 69 | 31.8% |
| High School | 53 | 24.4% |
| College / Undergraduate | 33 | 15.2% |
| Graduate / Professional | 0 | 0.0% |
| Total | 217 | 100.0% |
School Enrollment by Age by Funding Source in Florence
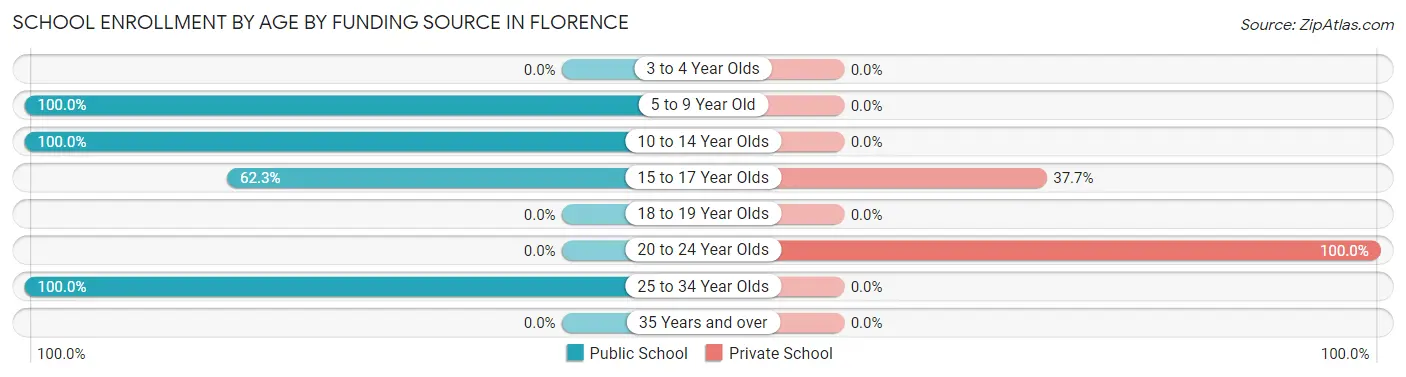
Out of a total of 217 students who are enrolled in schools in Florence, 38 (17.5%) attend a private institution, while the remaining 179 (82.5%) are enrolled in public schools. The age group of 20 to 24 year olds has the highest likelihood of being enrolled in private schools, with 18 (100.0% in the age bracket) enrolled. Conversely, the age group of 5 to 9 year old has the lowest likelihood of being enrolled in a private school, with 62 (100.0% in the age bracket) attending a public institution.
| Age Bracket | Public School | Private School |
| 3 to 4 Year Olds | 0 (0.0%) | 0 (0.0%) |
| 5 to 9 Year Old | 62 (100.0%) | 0 (0.0%) |
| 10 to 14 Year Olds | 69 (100.0%) | 0 (0.0%) |
| 15 to 17 Year Olds | 33 (62.3%) | 20 (37.7%) |
| 18 to 19 Year Olds | 0 (0.0%) | 0 (0.0%) |
| 20 to 24 Year Olds | 0 (0.0%) | 18 (100.0%) |
| 25 to 34 Year Olds | 15 (100.0%) | 0 (0.0%) |
| 35 Years and over | 0 (0.0%) | 0 (0.0%) |
| Total | 179 (82.5%) | 38 (17.5%) |
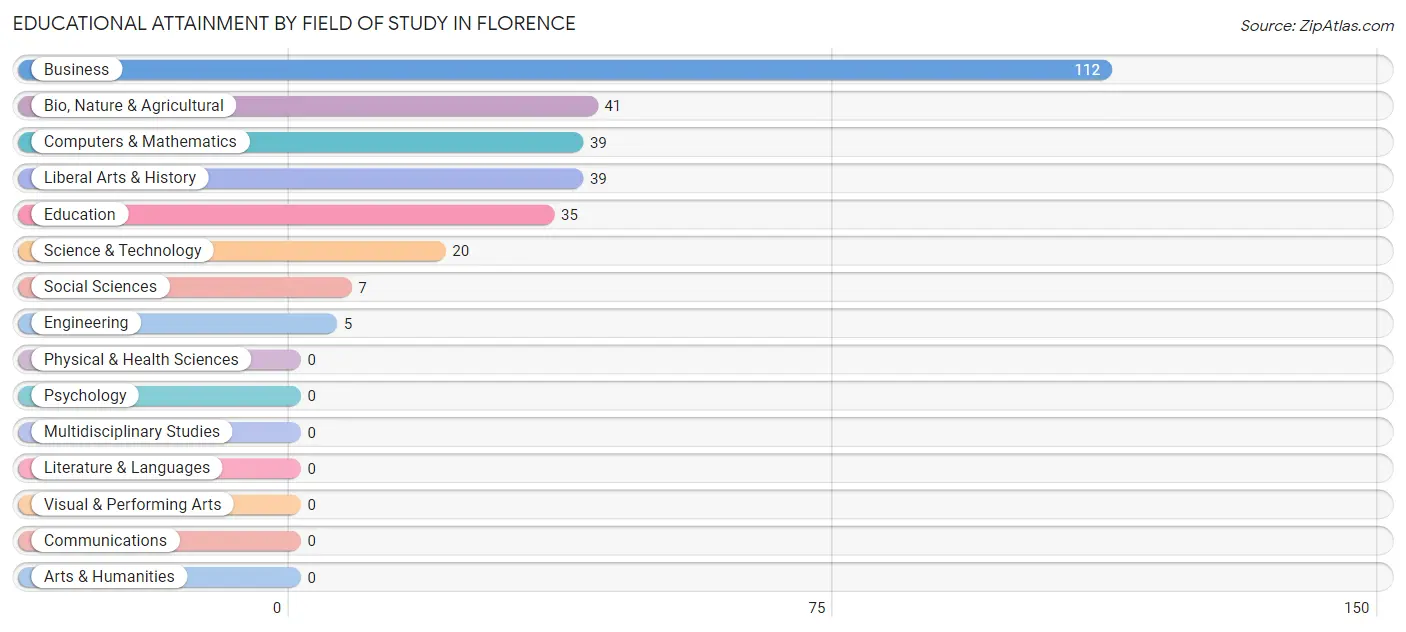
Educational Attainment by Field of Study in Florence
Business (112 | 37.6%), bio, nature & agricultural (41 | 13.8%), computers & mathematics (39 | 13.1%), liberal arts & history (39 | 13.1%), and education (35 | 11.7%) are the most common fields of study among 298 individuals in Florence who have obtained a bachelor's degree or higher.
| Field of Study | # Graduates | % Graduates |
| Computers & Mathematics | 39 | 13.1% |
| Bio, Nature & Agricultural | 41 | 13.8% |
| Physical & Health Sciences | 0 | 0.0% |
| Psychology | 0 | 0.0% |
| Social Sciences | 7 | 2.4% |
| Engineering | 5 | 1.7% |
| Multidisciplinary Studies | 0 | 0.0% |
| Science & Technology | 20 | 6.7% |
| Business | 112 | 37.6% |
| Education | 35 | 11.7% |
| Literature & Languages | 0 | 0.0% |
| Liberal Arts & History | 39 | 13.1% |
| Visual & Performing Arts | 0 | 0.0% |
| Communications | 0 | 0.0% |
| Arts & Humanities | 0 | 0.0% |
| Total | 298 | 100.0% |
Transportation & Commute in Florence
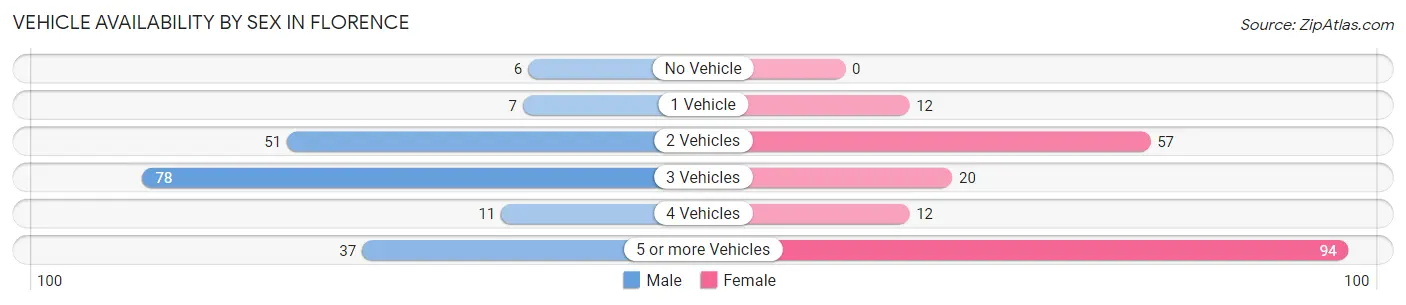
Vehicle Availability by Sex in Florence
The most prevalent vehicle ownership categories in Florence are males with 3 vehicles (78, accounting for 41.0%) and females with 3 vehicles (20, making up 40.0%).
| Vehicles Available | Male | Female |
| No Vehicle | 6 (3.2%) | 0 (0.0%) |
| 1 Vehicle | 7 (3.7%) | 12 (6.1%) |
| 2 Vehicles | 51 (26.8%) | 57 (29.2%) |
| 3 Vehicles | 78 (41.0%) | 20 (10.3%) |
| 4 Vehicles | 11 (5.8%) | 12 (6.1%) |
| 5 or more Vehicles | 37 (19.5%) | 94 (48.2%) |
| Total | 190 (100.0%) | 195 (100.0%) |
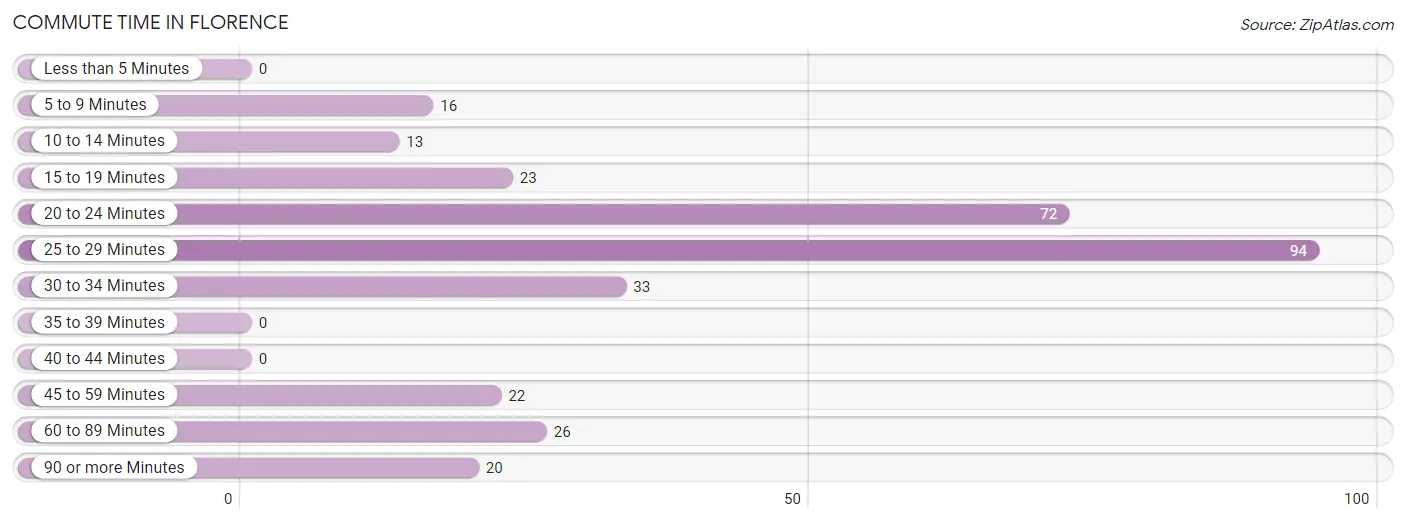
Commute Time in Florence
The most frequently occuring commute durations in Florence are 25 to 29 minutes (94 commuters, 29.5%), 20 to 24 minutes (72 commuters, 22.6%), and 30 to 34 minutes (33 commuters, 10.3%).
| Commute Time | # Commuters | % Commuters |
| Less than 5 Minutes | 0 | 0.0% |
| 5 to 9 Minutes | 16 | 5.0% |
| 10 to 14 Minutes | 13 | 4.1% |
| 15 to 19 Minutes | 23 | 7.2% |
| 20 to 24 Minutes | 72 | 22.6% |
| 25 to 29 Minutes | 94 | 29.5% |
| 30 to 34 Minutes | 33 | 10.3% |
| 35 to 39 Minutes | 0 | 0.0% |
| 40 to 44 Minutes | 0 | 0.0% |
| 45 to 59 Minutes | 22 | 6.9% |
| 60 to 89 Minutes | 26 | 8.2% |
| 90 or more Minutes | 20 | 6.3% |
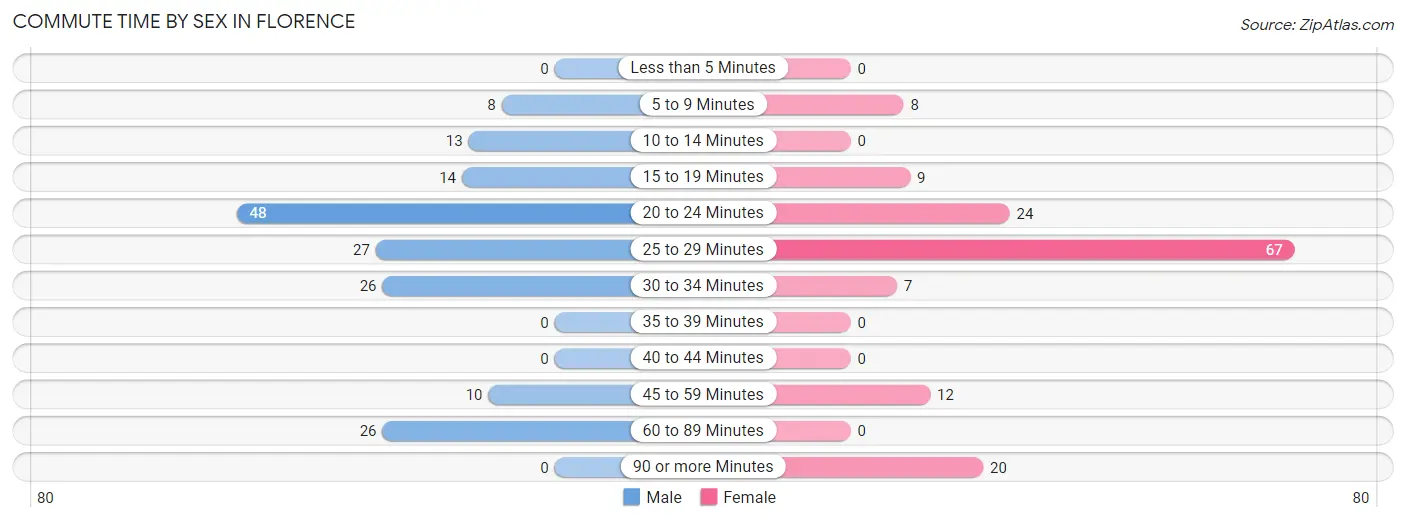
Commute Time by Sex in Florence
The most common commute times in Florence are 20 to 24 minutes (48 commuters, 27.9%) for males and 25 to 29 minutes (67 commuters, 45.6%) for females.
| Commute Time | Male | Female |
| Less than 5 Minutes | 0 (0.0%) | 0 (0.0%) |
| 5 to 9 Minutes | 8 (4.6%) | 8 (5.4%) |
| 10 to 14 Minutes | 13 (7.6%) | 0 (0.0%) |
| 15 to 19 Minutes | 14 (8.1%) | 9 (6.1%) |
| 20 to 24 Minutes | 48 (27.9%) | 24 (16.3%) |
| 25 to 29 Minutes | 27 (15.7%) | 67 (45.6%) |
| 30 to 34 Minutes | 26 (15.1%) | 7 (4.8%) |
| 35 to 39 Minutes | 0 (0.0%) | 0 (0.0%) |
| 40 to 44 Minutes | 0 (0.0%) | 0 (0.0%) |
| 45 to 59 Minutes | 10 (5.8%) | 12 (8.2%) |
| 60 to 89 Minutes | 26 (15.1%) | 0 (0.0%) |
| 90 or more Minutes | 0 (0.0%) | 20 (13.6%) |
Time of Departure to Work by Sex in Florence
The most frequent times of departure to work in Florence are 6:30 AM to 6:59 AM (93, 54.1%) for males and 5:00 AM to 5:29 AM (46, 31.3%) for females.
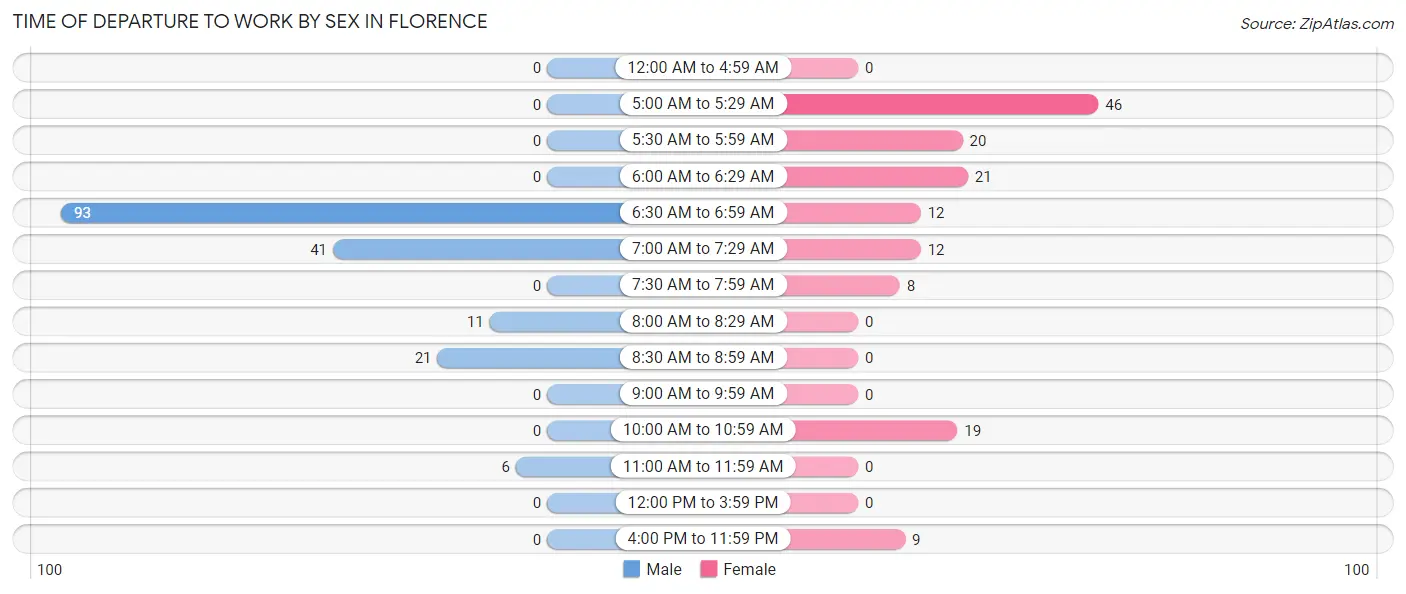
| Time of Departure | Male | Female |
| 12:00 AM to 4:59 AM | 0 (0.0%) | 0 (0.0%) |
| 5:00 AM to 5:29 AM | 0 (0.0%) | 46 (31.3%) |
| 5:30 AM to 5:59 AM | 0 (0.0%) | 20 (13.6%) |
| 6:00 AM to 6:29 AM | 0 (0.0%) | 21 (14.3%) |
| 6:30 AM to 6:59 AM | 93 (54.1%) | 12 (8.2%) |
| 7:00 AM to 7:29 AM | 41 (23.8%) | 12 (8.2%) |
| 7:30 AM to 7:59 AM | 0 (0.0%) | 8 (5.4%) |
| 8:00 AM to 8:29 AM | 11 (6.4%) | 0 (0.0%) |
| 8:30 AM to 8:59 AM | 21 (12.2%) | 0 (0.0%) |
| 9:00 AM to 9:59 AM | 0 (0.0%) | 0 (0.0%) |
| 10:00 AM to 10:59 AM | 0 (0.0%) | 19 (12.9%) |
| 11:00 AM to 11:59 AM | 6 (3.5%) | 0 (0.0%) |
| 12:00 PM to 3:59 PM | 0 (0.0%) | 0 (0.0%) |
| 4:00 PM to 11:59 PM | 0 (0.0%) | 9 (6.1%) |
| Total | 172 (100.0%) | 147 (100.0%) |
Housing Occupancy in Florence
Occupancy by Ownership in Florence
Of the total 454 dwellings in Florence, owner-occupied units account for 373 (82.2%), while renter-occupied units make up 81 (17.8%).
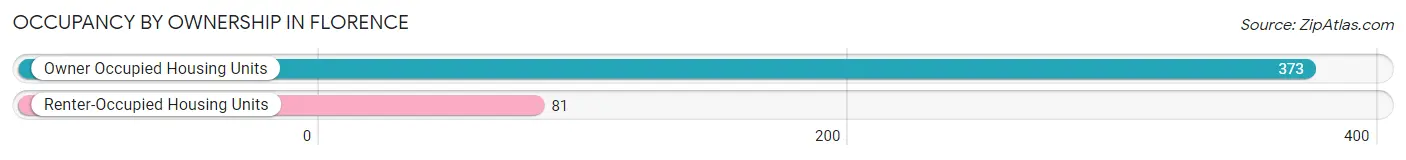
| Occupancy | # Housing Units | % Housing Units |
| Owner Occupied Housing Units | 373 | 82.2% |
| Renter-Occupied Housing Units | 81 | 17.8% |
| Total Occupied Housing Units | 454 | 100.0% |
Occupancy by Household Size in Florence
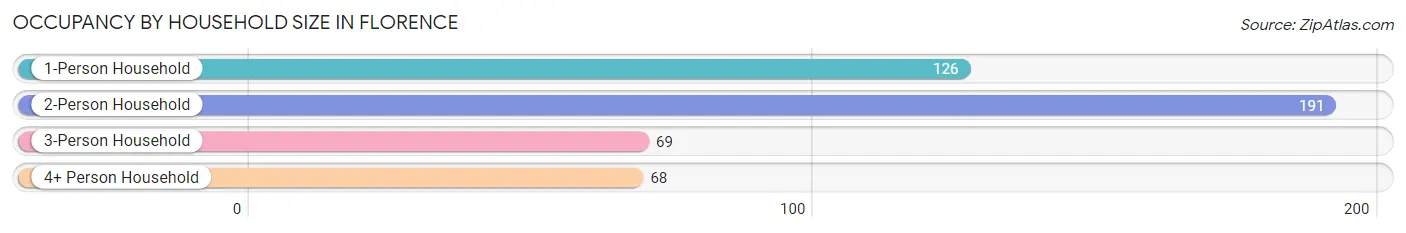
| Household Size | # Housing Units | % Housing Units |
| 1-Person Household | 126 | 27.8% |
| 2-Person Household | 191 | 42.1% |
| 3-Person Household | 69 | 15.2% |
| 4+ Person Household | 68 | 15.0% |
| Total Housing Units | 454 | 100.0% |
Occupancy by Ownership by Household Size in Florence
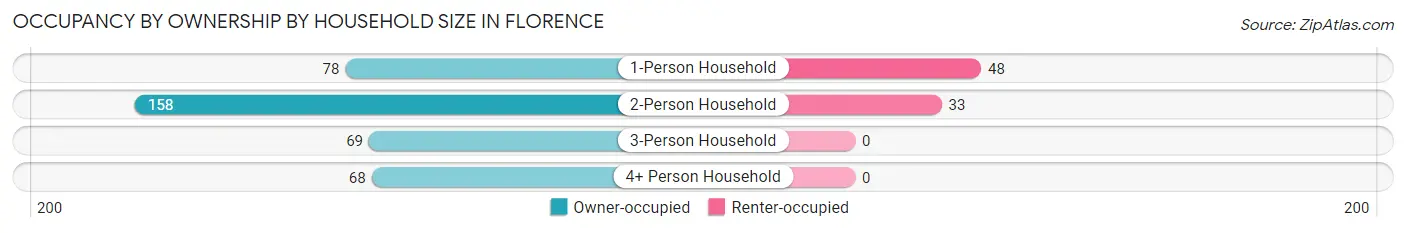
| Household Size | Owner-occupied | Renter-occupied |
| 1-Person Household | 78 (61.9%) | 48 (38.1%) |
| 2-Person Household | 158 (82.7%) | 33 (17.3%) |
| 3-Person Household | 69 (100.0%) | 0 (0.0%) |
| 4+ Person Household | 68 (100.0%) | 0 (0.0%) |
| Total Housing Units | 373 (82.2%) | 81 (17.8%) |
Occupancy by Educational Attainment in Florence
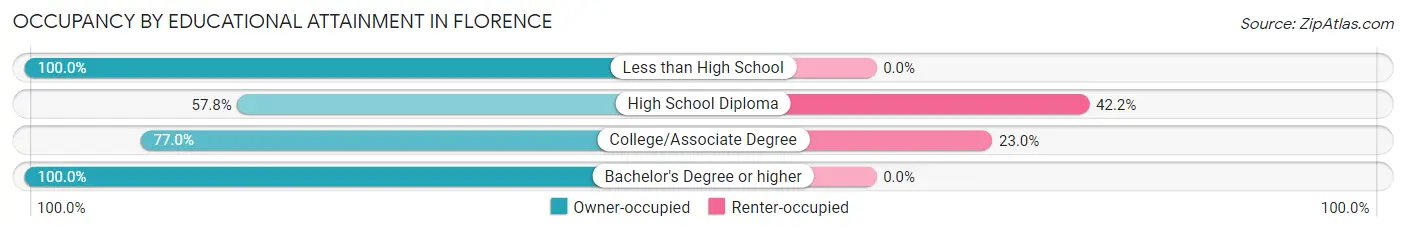
| Household Size | Owner-occupied | Renter-occupied |
| Less than High School | 12 (100.0%) | 0 (0.0%) |
| High School Diploma | 52 (57.8%) | 38 (42.2%) |
| College/Associate Degree | 144 (77.0%) | 43 (23.0%) |
| Bachelor's Degree or higher | 165 (100.0%) | 0 (0.0%) |
Occupancy by Age of Householder in Florence
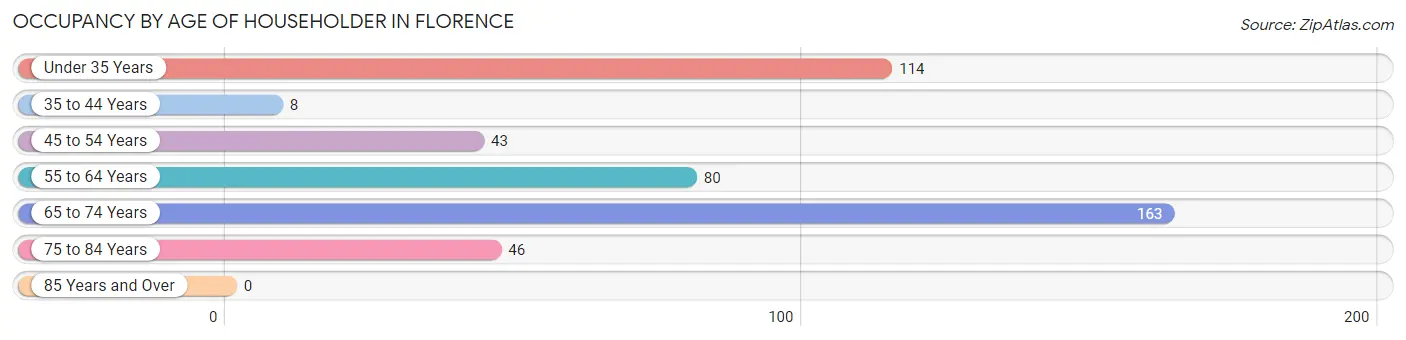
| Age Bracket | # Households | % Households |
| Under 35 Years | 114 | 25.1% |
| 35 to 44 Years | 8 | 1.8% |
| 45 to 54 Years | 43 | 9.5% |
| 55 to 64 Years | 80 | 17.6% |
| 65 to 74 Years | 163 | 35.9% |
| 75 to 84 Years | 46 | 10.1% |
| 85 Years and Over | 0 | 0.0% |
| Total | 454 | 100.0% |
Housing Finances in Florence
Median Income by Occupancy in Florence
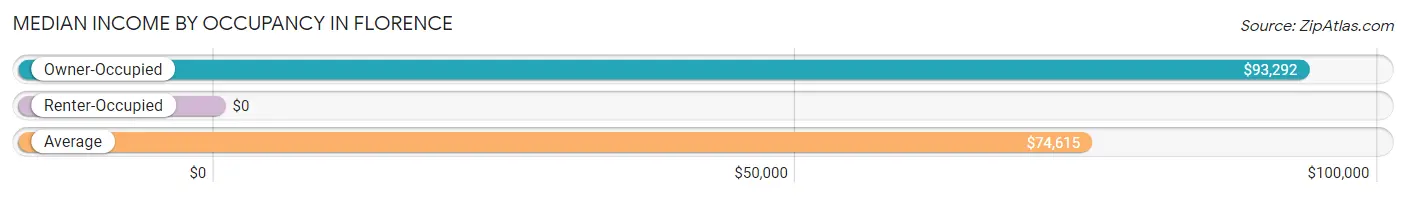
| Occupancy Type | # Households | Median Income |
| Owner-Occupied | 373 (82.2%) | $93,292 |
| Renter-Occupied | 81 (17.8%) | $0 |
| Average | 454 (100.0%) | $74,615 |
Occupancy by Householder Income Bracket in Florence
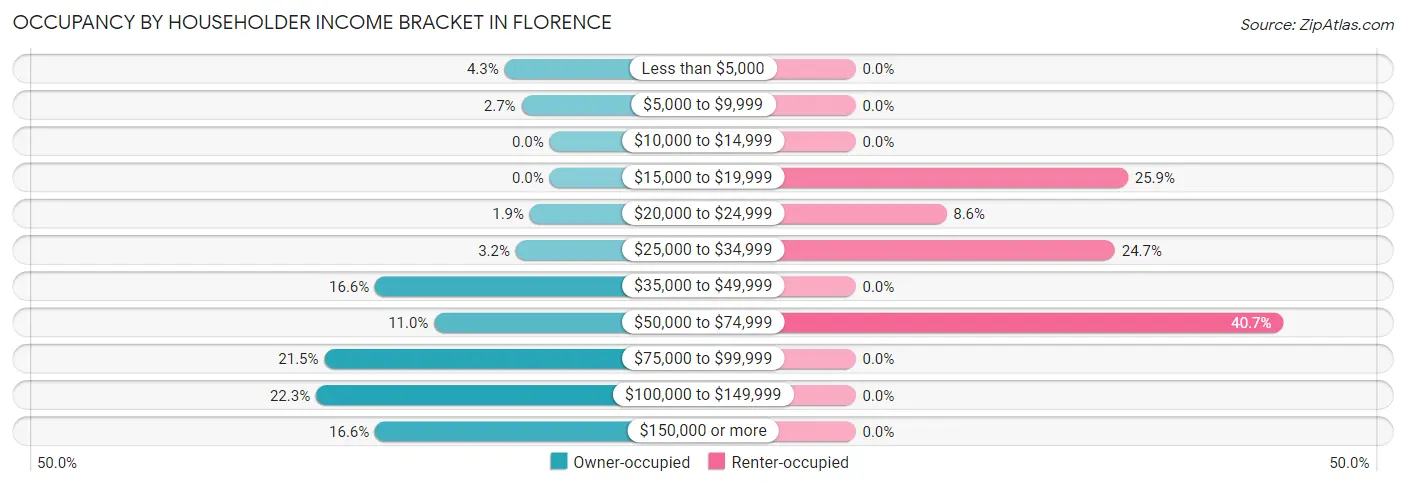
| Income Bracket | Owner-occupied | Renter-occupied |
| Less than $5,000 | 16 (4.3%) | 0 (0.0%) |
| $5,000 to $9,999 | 10 (2.7%) | 0 (0.0%) |
| $10,000 to $14,999 | 0 (0.0%) | 0 (0.0%) |
| $15,000 to $19,999 | 0 (0.0%) | 21 (25.9%) |
| $20,000 to $24,999 | 7 (1.9%) | 7 (8.6%) |
| $25,000 to $34,999 | 12 (3.2%) | 20 (24.7%) |
| $35,000 to $49,999 | 62 (16.6%) | 0 (0.0%) |
| $50,000 to $74,999 | 41 (11.0%) | 33 (40.7%) |
| $75,000 to $99,999 | 80 (21.4%) | 0 (0.0%) |
| $100,000 to $149,999 | 83 (22.3%) | 0 (0.0%) |
| $150,000 or more | 62 (16.6%) | 0 (0.0%) |
| Total | 373 (100.0%) | 81 (100.0%) |
Monthly Housing Cost Tiers in Florence
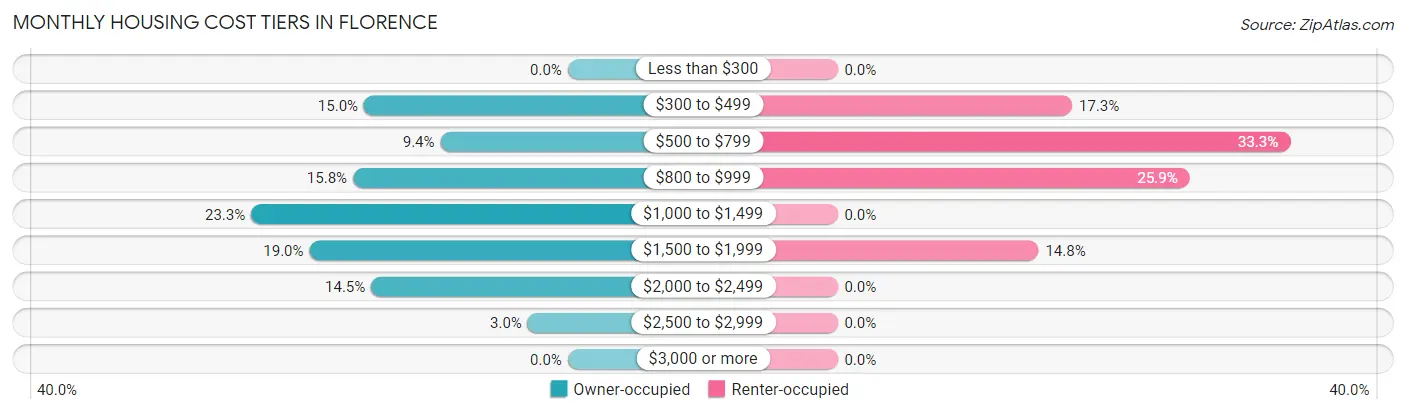
| Monthly Cost | Owner-occupied | Renter-occupied |
| Less than $300 | 0 (0.0%) | 0 (0.0%) |
| $300 to $499 | 56 (15.0%) | 14 (17.3%) |
| $500 to $799 | 35 (9.4%) | 27 (33.3%) |
| $800 to $999 | 59 (15.8%) | 21 (25.9%) |
| $1,000 to $1,499 | 87 (23.3%) | 0 (0.0%) |
| $1,500 to $1,999 | 71 (19.0%) | 12 (14.8%) |
| $2,000 to $2,499 | 54 (14.5%) | 0 (0.0%) |
| $2,500 to $2,999 | 11 (2.9%) | 0 (0.0%) |
| $3,000 or more | 0 (0.0%) | 0 (0.0%) |
| Total | 373 (100.0%) | 81 (100.0%) |
Physical Housing Characteristics in Florence
Housing Structures in Florence
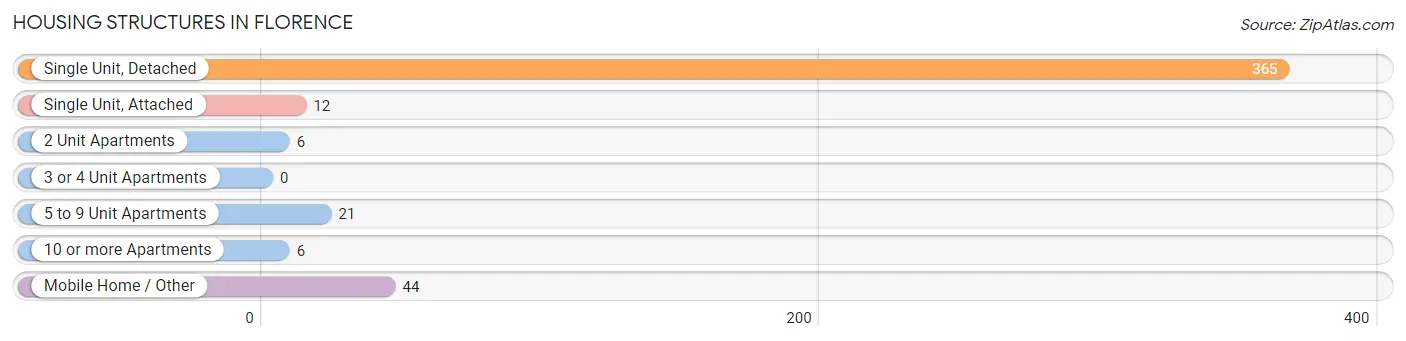
| Structure Type | # Housing Units | % Housing Units |
| Single Unit, Detached | 365 | 80.4% |
| Single Unit, Attached | 12 | 2.6% |
| 2 Unit Apartments | 6 | 1.3% |
| 3 or 4 Unit Apartments | 0 | 0.0% |
| 5 to 9 Unit Apartments | 21 | 4.6% |
| 10 or more Apartments | 6 | 1.3% |
| Mobile Home / Other | 44 | 9.7% |
| Total | 454 | 100.0% |
Housing Structures by Occupancy in Florence
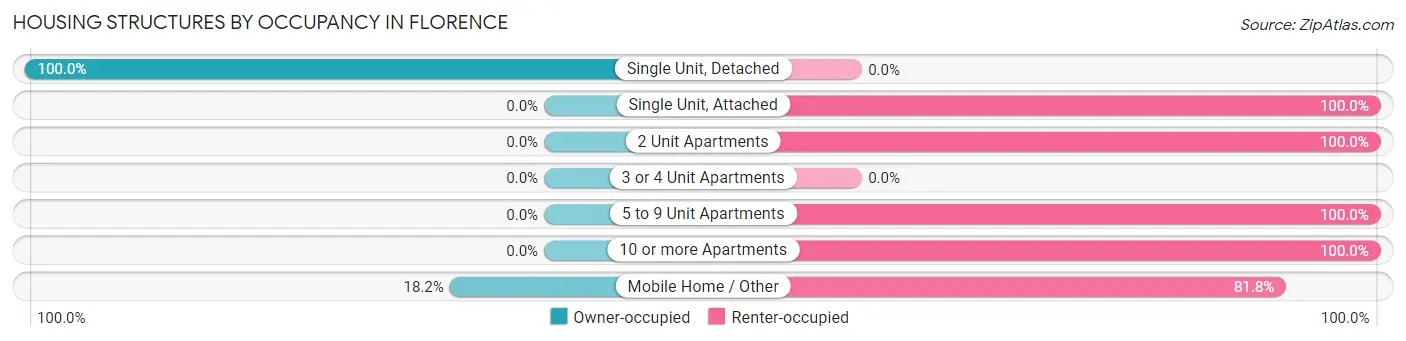
| Structure Type | Owner-occupied | Renter-occupied |
| Single Unit, Detached | 365 (100.0%) | 0 (0.0%) |
| Single Unit, Attached | 0 (0.0%) | 12 (100.0%) |
| 2 Unit Apartments | 0 (0.0%) | 6 (100.0%) |
| 3 or 4 Unit Apartments | 0 (0.0%) | 0 (0.0%) |
| 5 to 9 Unit Apartments | 0 (0.0%) | 21 (100.0%) |
| 10 or more Apartments | 0 (0.0%) | 6 (100.0%) |
| Mobile Home / Other | 8 (18.2%) | 36 (81.8%) |
| Total | 373 (82.2%) | 81 (17.8%) |
Housing Structures by Number of Rooms in Florence
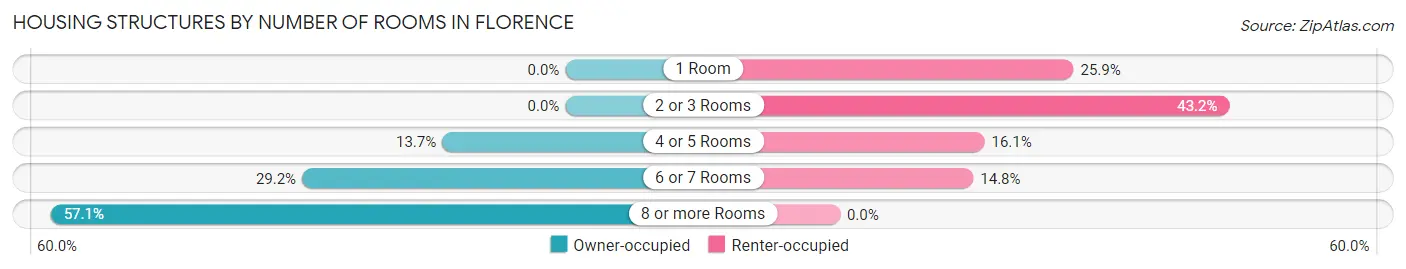
| Number of Rooms | Owner-occupied | Renter-occupied |
| 1 Room | 0 (0.0%) | 21 (25.9%) |
| 2 or 3 Rooms | 0 (0.0%) | 35 (43.2%) |
| 4 or 5 Rooms | 51 (13.7%) | 13 (16.1%) |
| 6 or 7 Rooms | 109 (29.2%) | 12 (14.8%) |
| 8 or more Rooms | 213 (57.1%) | 0 (0.0%) |
| Total | 373 (100.0%) | 81 (100.0%) |
Housing Structure by Heating Type in Florence
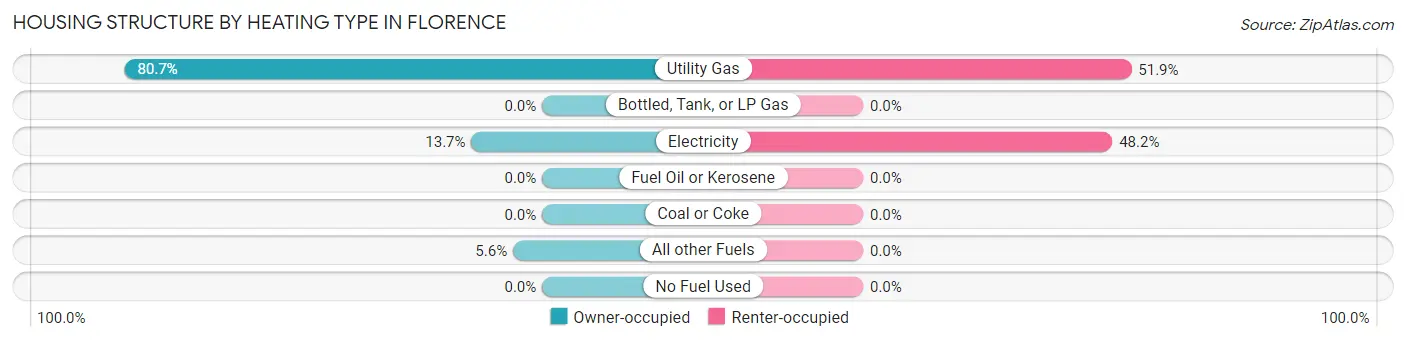
| Heating Type | Owner-occupied | Renter-occupied |
| Utility Gas | 301 (80.7%) | 42 (51.8%) |
| Bottled, Tank, or LP Gas | 0 (0.0%) | 0 (0.0%) |
| Electricity | 51 (13.7%) | 39 (48.1%) |
| Fuel Oil or Kerosene | 0 (0.0%) | 0 (0.0%) |
| Coal or Coke | 0 (0.0%) | 0 (0.0%) |
| All other Fuels | 21 (5.6%) | 0 (0.0%) |
| No Fuel Used | 0 (0.0%) | 0 (0.0%) |
| Total | 373 (100.0%) | 81 (100.0%) |
Household Vehicle Usage in Florence
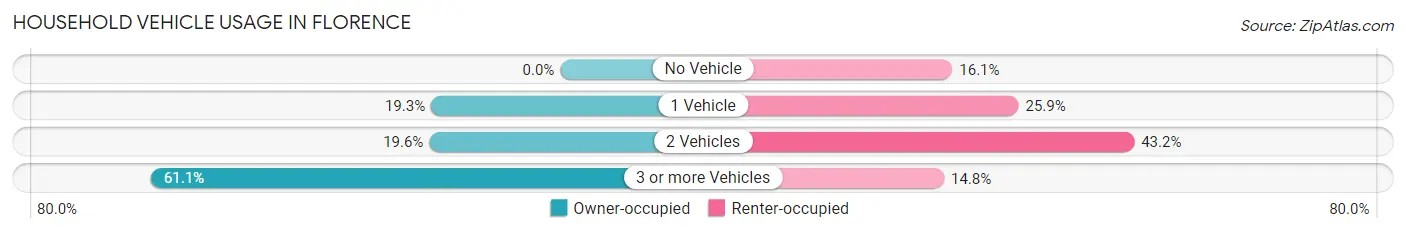
| Vehicles per Household | Owner-occupied | Renter-occupied |
| No Vehicle | 0 (0.0%) | 13 (16.1%) |
| 1 Vehicle | 72 (19.3%) | 21 (25.9%) |
| 2 Vehicles | 73 (19.6%) | 35 (43.2%) |
| 3 or more Vehicles | 228 (61.1%) | 12 (14.8%) |
| Total | 373 (100.0%) | 81 (100.0%) |
Real Estate & Mortgages in Florence
Real Estate and Mortgage Overview in Florence
| Characteristic | Without Mortgage | With Mortgage |
| Housing Units | 123 | 250 |
| Median Property Value | $498,600 | $365,400 |
| Median Household Income | - | - |
| Monthly Housing Costs | $704 | $0 |
| Real Estate Taxes | $3,436 | $0 |
Property Value by Mortgage Status in Florence
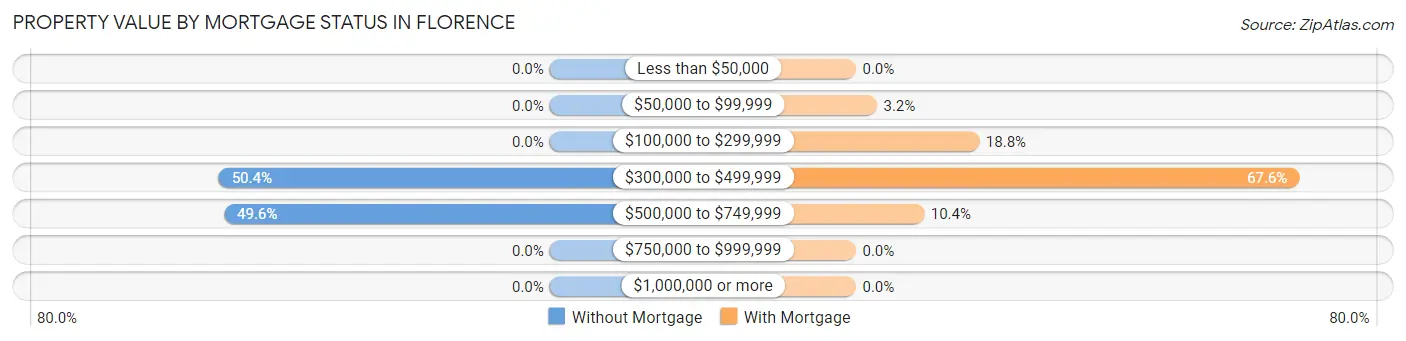
| Property Value | Without Mortgage | With Mortgage |
| Less than $50,000 | 0 (0.0%) | 0 (0.0%) |
| $50,000 to $99,999 | 0 (0.0%) | 8 (3.2%) |
| $100,000 to $299,999 | 0 (0.0%) | 47 (18.8%) |
| $300,000 to $499,999 | 62 (50.4%) | 169 (67.6%) |
| $500,000 to $749,999 | 61 (49.6%) | 26 (10.4%) |
| $750,000 to $999,999 | 0 (0.0%) | 0 (0.0%) |
| $1,000,000 or more | 0 (0.0%) | 0 (0.0%) |
| Total | 123 (100.0%) | 250 (100.0%) |
Household Income by Mortgage Status in Florence
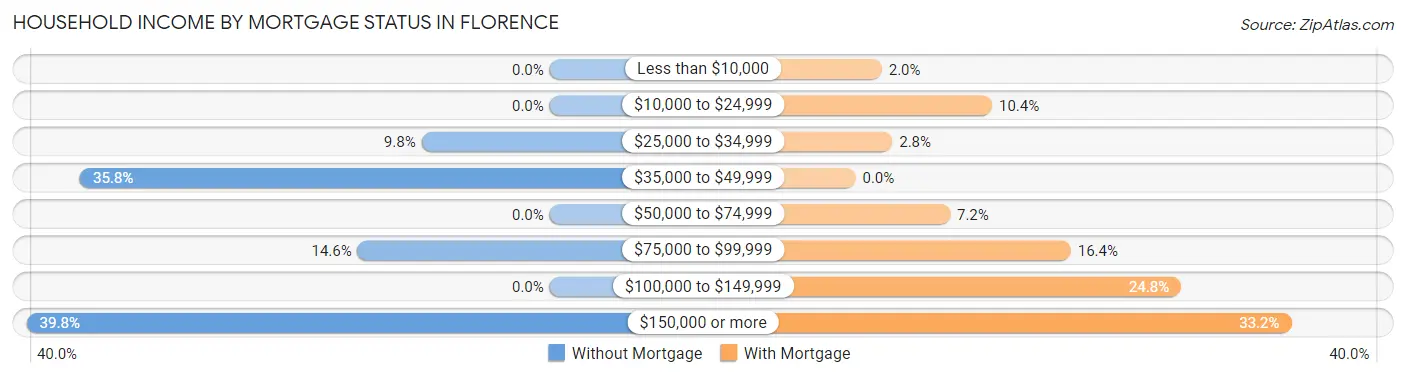
| Household Income | Without Mortgage | With Mortgage |
| Less than $10,000 | 0 (0.0%) | 5 (2.0%) |
| $10,000 to $24,999 | 0 (0.0%) | 26 (10.4%) |
| $25,000 to $34,999 | 12 (9.8%) | 7 (2.8%) |
| $35,000 to $49,999 | 44 (35.8%) | 0 (0.0%) |
| $50,000 to $74,999 | 0 (0.0%) | 18 (7.2%) |
| $75,000 to $99,999 | 18 (14.6%) | 41 (16.4%) |
| $100,000 to $149,999 | 0 (0.0%) | 62 (24.8%) |
| $150,000 or more | 49 (39.8%) | 83 (33.2%) |
| Total | 123 (100.0%) | 250 (100.0%) |
Property Value to Household Income Ratio in Florence
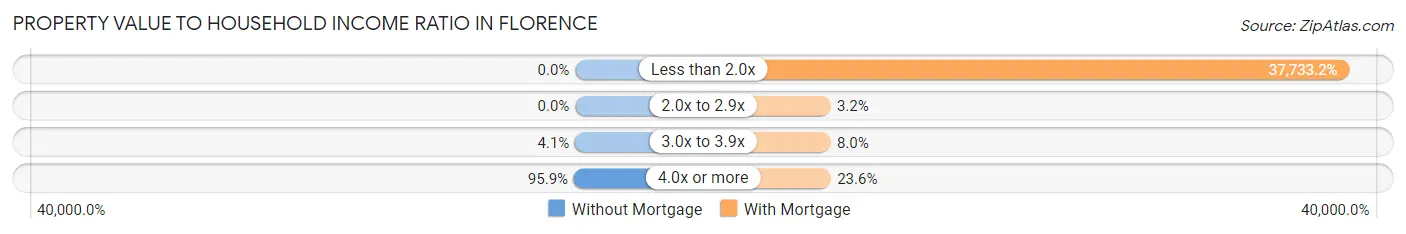
| Value-to-Income Ratio | Without Mortgage | With Mortgage |
| Less than 2.0x | 0 (0.0%) | 94,333 (37,733.2%) |
| 2.0x to 2.9x | 0 (0.0%) | 8 (3.2%) |
| 3.0x to 3.9x | 5 (4.1%) | 20 (8.0%) |
| 4.0x or more | 118 (95.9%) | 59 (23.6%) |
| Total | 123 (100.0%) | 250 (100.0%) |
Real Estate Taxes by Mortgage Status in Florence
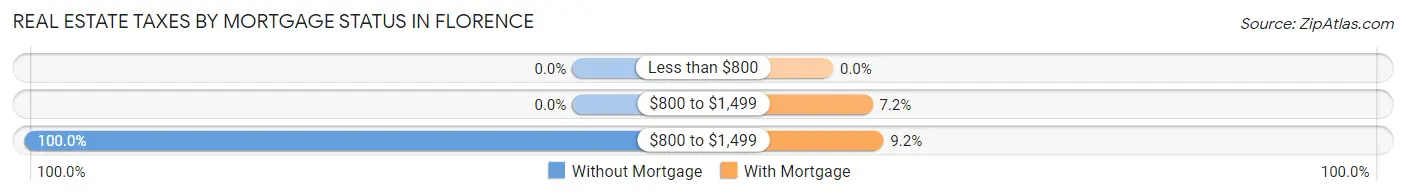
| Property Taxes | Without Mortgage | With Mortgage |
| Less than $800 | 0 (0.0%) | 0 (0.0%) |
| $800 to $1,499 | 0 (0.0%) | 18 (7.2%) |
| $800 to $1,499 | 123 (100.0%) | 23 (9.2%) |
| Total | 123 (100.0%) | 250 (100.0%) |
Health & Disability in Florence
Health Insurance Coverage by Age in Florence
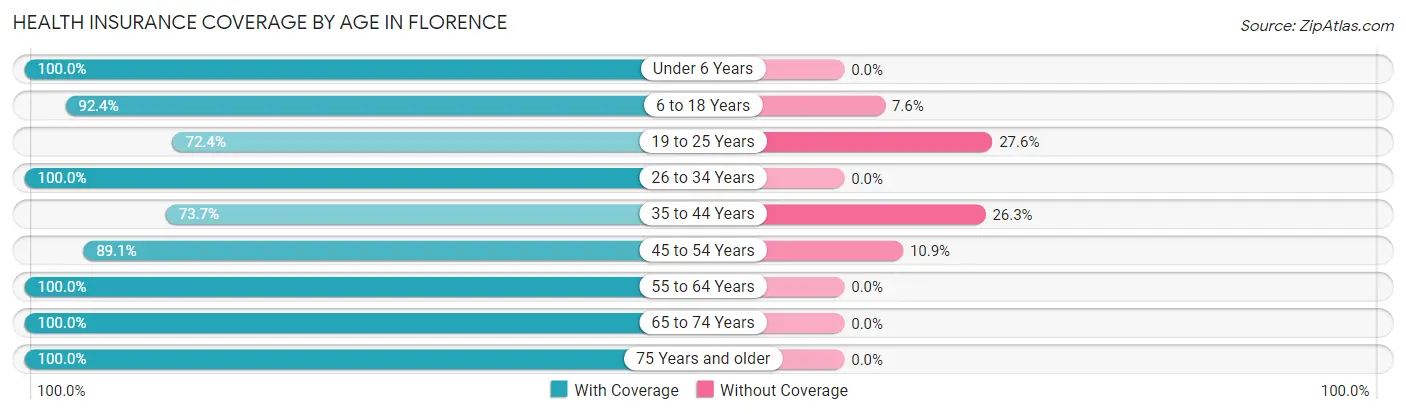
| Age Bracket | With Coverage | Without Coverage |
| Under 6 Years | 80 (100.0%) | 0 (0.0%) |
| 6 to 18 Years | 134 (92.4%) | 11 (7.6%) |
| 19 to 25 Years | 63 (72.4%) | 24 (27.6%) |
| 26 to 34 Years | 109 (100.0%) | 0 (0.0%) |
| 35 to 44 Years | 28 (73.7%) | 10 (26.3%) |
| 45 to 54 Years | 57 (89.1%) | 7 (10.9%) |
| 55 to 64 Years | 237 (100.0%) | 0 (0.0%) |
| 65 to 74 Years | 216 (100.0%) | 0 (0.0%) |
| 75 Years and older | 70 (100.0%) | 0 (0.0%) |
| Total | 994 (95.0%) | 52 (5.0%) |
Health Insurance Coverage by Citizenship Status in Florence
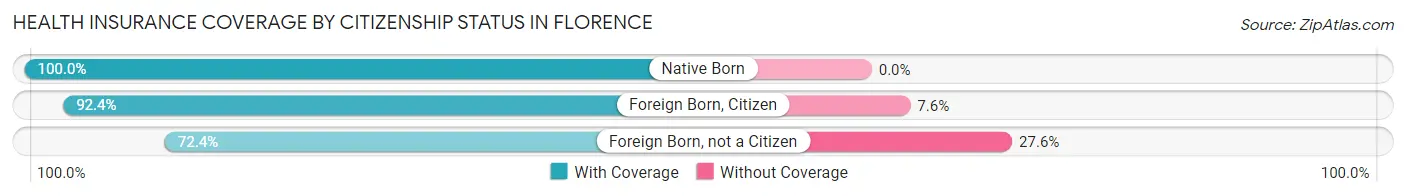
| Citizenship Status | With Coverage | Without Coverage |
| Native Born | 80 (100.0%) | 0 (0.0%) |
| Foreign Born, Citizen | 134 (92.4%) | 11 (7.6%) |
| Foreign Born, not a Citizen | 63 (72.4%) | 24 (27.6%) |
Health Insurance Coverage by Household Income in Florence
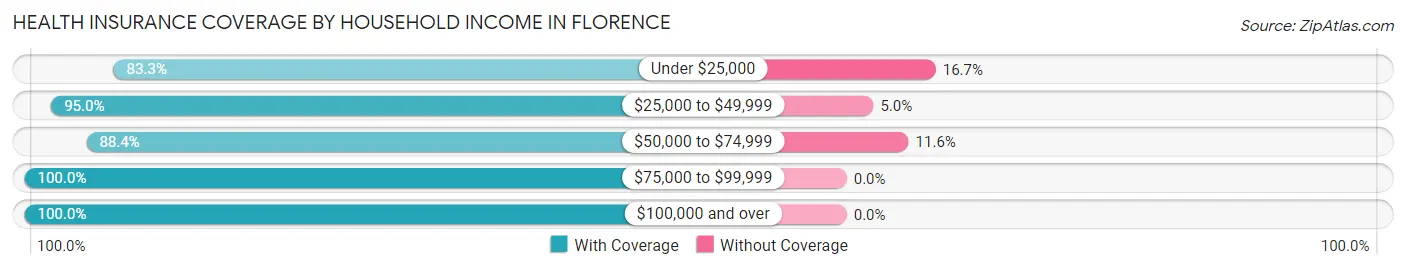
| Household Income | With Coverage | Without Coverage |
| Under $25,000 | 105 (83.3%) | 21 (16.7%) |
| $25,000 to $49,999 | 133 (95.0%) | 7 (5.0%) |
| $50,000 to $74,999 | 183 (88.4%) | 24 (11.6%) |
| $75,000 to $99,999 | 269 (100.0%) | 0 (0.0%) |
| $100,000 and over | 304 (100.0%) | 0 (0.0%) |
Public vs Private Health Insurance Coverage by Age in Florence
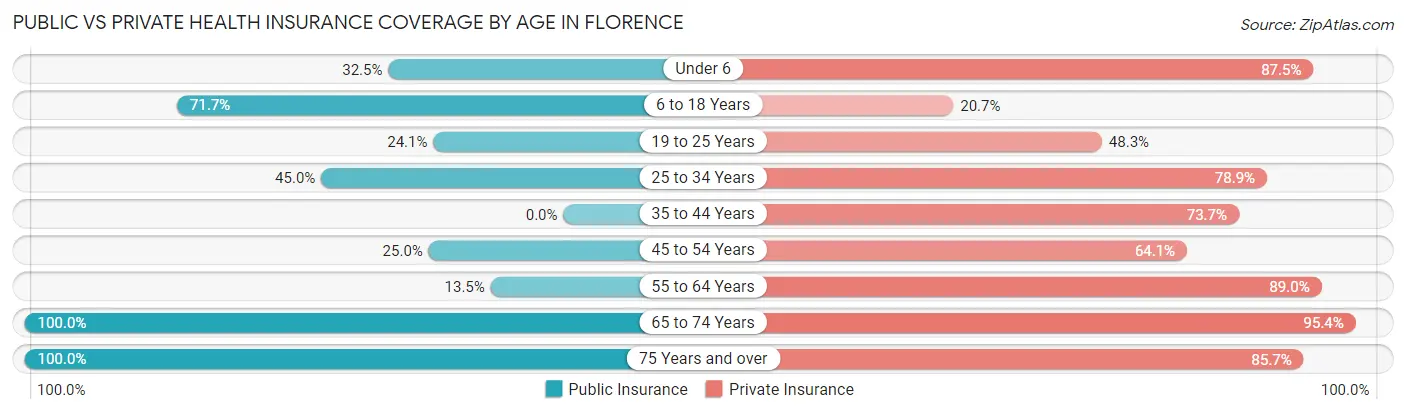
| Age Bracket | Public Insurance | Private Insurance |
| Under 6 | 26 (32.5%) | 70 (87.5%) |
| 6 to 18 Years | 104 (71.7%) | 30 (20.7%) |
| 19 to 25 Years | 21 (24.1%) | 42 (48.3%) |
| 25 to 34 Years | 49 (45.0%) | 86 (78.9%) |
| 35 to 44 Years | 0 (0.0%) | 28 (73.7%) |
| 45 to 54 Years | 16 (25.0%) | 41 (64.1%) |
| 55 to 64 Years | 32 (13.5%) | 211 (89.0%) |
| 65 to 74 Years | 216 (100.0%) | 206 (95.4%) |
| 75 Years and over | 70 (100.0%) | 60 (85.7%) |
| Total | 534 (51.0%) | 774 (74.0%) |
Disability Status by Sex by Age in Florence
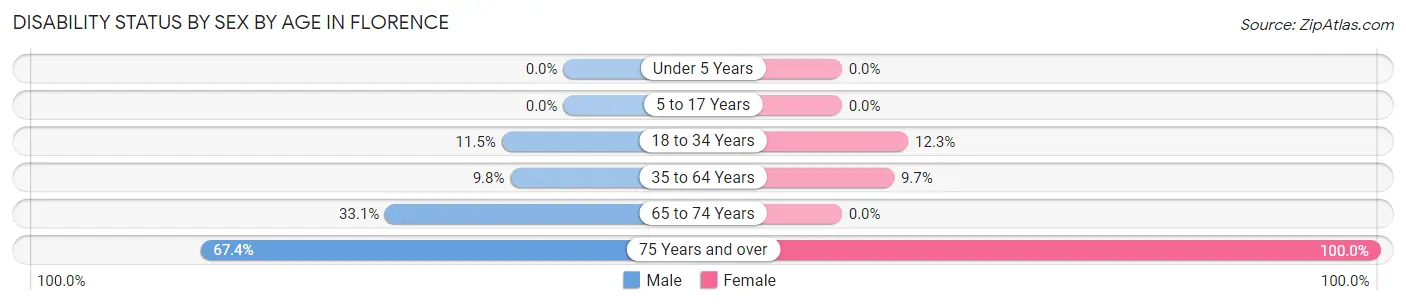
| Age Bracket | Male | Female |
| Under 5 Years | 0 (0.0%) | 0 (0.0%) |
| 5 to 17 Years | 0 (0.0%) | 0 (0.0%) |
| 18 to 34 Years | 15 (11.5%) | 8 (12.3%) |
| 35 to 64 Years | 12 (9.8%) | 21 (9.7%) |
| 65 to 74 Years | 42 (33.1%) | 0 (0.0%) |
| 75 Years and over | 31 (67.4%) | 24 (100.0%) |
Disability Class by Sex by Age in Florence
Disability Class: Hearing Difficulty
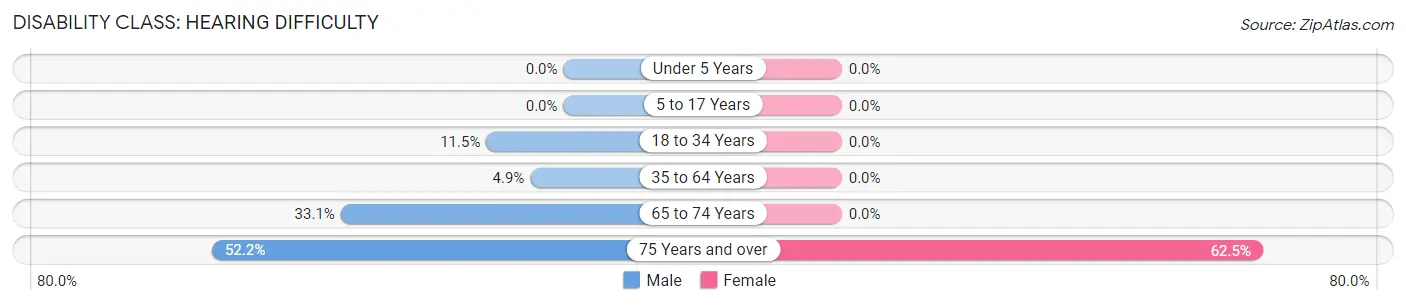
| Age Bracket | Male | Female |
| Under 5 Years | 0 (0.0%) | 0 (0.0%) |
| 5 to 17 Years | 0 (0.0%) | 0 (0.0%) |
| 18 to 34 Years | 15 (11.5%) | 0 (0.0%) |
| 35 to 64 Years | 6 (4.9%) | 0 (0.0%) |
| 65 to 74 Years | 42 (33.1%) | 0 (0.0%) |
| 75 Years and over | 24 (52.2%) | 15 (62.5%) |
Disability Class: Vision Difficulty
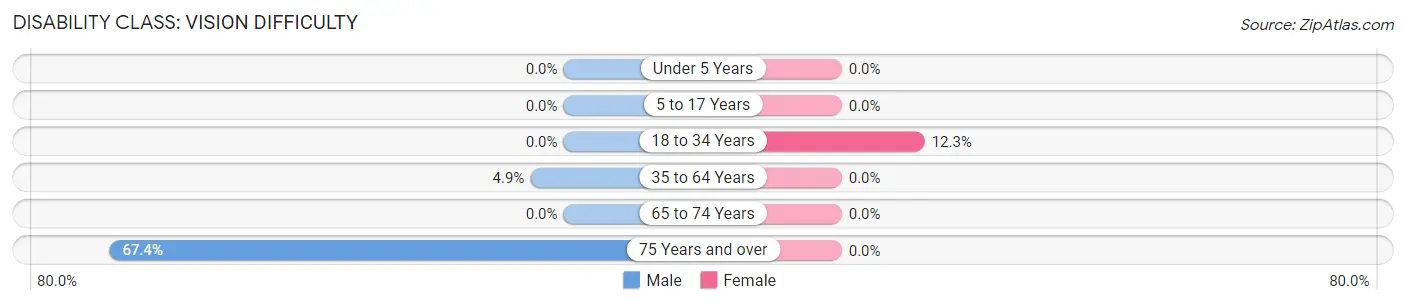
| Age Bracket | Male | Female |
| Under 5 Years | 0 (0.0%) | 0 (0.0%) |
| 5 to 17 Years | 0 (0.0%) | 0 (0.0%) |
| 18 to 34 Years | 0 (0.0%) | 8 (12.3%) |
| 35 to 64 Years | 6 (4.9%) | 0 (0.0%) |
| 65 to 74 Years | 0 (0.0%) | 0 (0.0%) |
| 75 Years and over | 31 (67.4%) | 0 (0.0%) |
Disability Class: Cognitive Difficulty
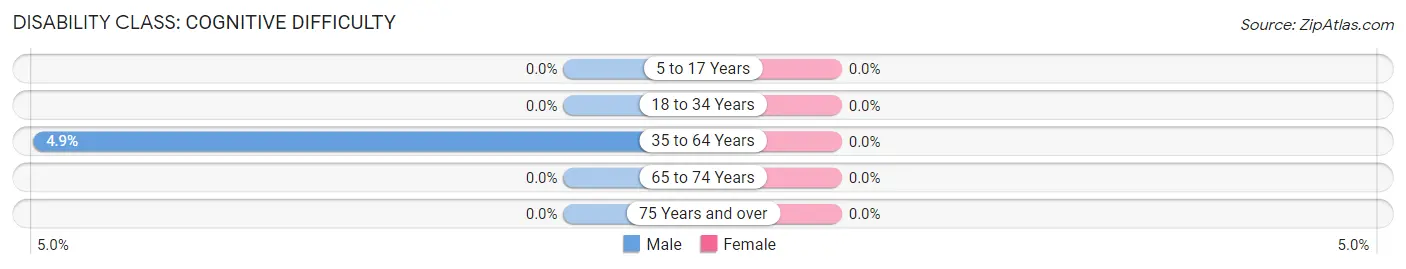
| Age Bracket | Male | Female |
| 5 to 17 Years | 0 (0.0%) | 0 (0.0%) |
| 18 to 34 Years | 0 (0.0%) | 0 (0.0%) |
| 35 to 64 Years | 6 (4.9%) | 0 (0.0%) |
| 65 to 74 Years | 0 (0.0%) | 0 (0.0%) |
| 75 Years and over | 0 (0.0%) | 0 (0.0%) |
Disability Class: Ambulatory Difficulty
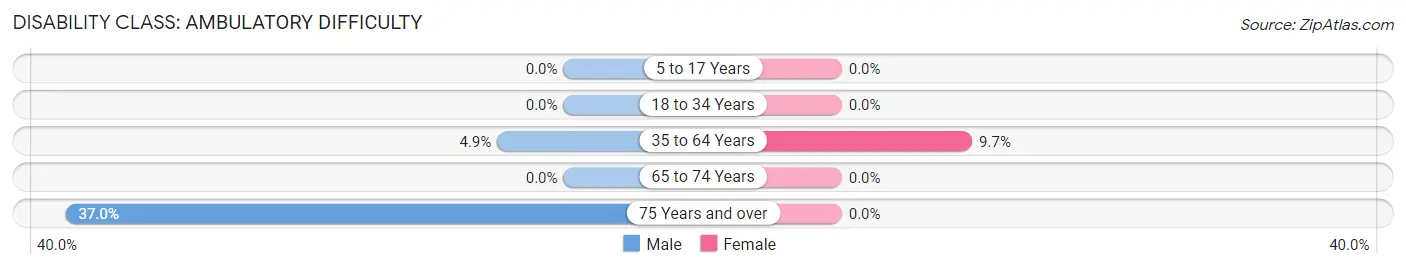
| Age Bracket | Male | Female |
| 5 to 17 Years | 0 (0.0%) | 0 (0.0%) |
| 18 to 34 Years | 0 (0.0%) | 0 (0.0%) |
| 35 to 64 Years | 6 (4.9%) | 21 (9.7%) |
| 65 to 74 Years | 0 (0.0%) | 0 (0.0%) |
| 75 Years and over | 17 (37.0%) | 0 (0.0%) |
Disability Class: Self-Care Difficulty
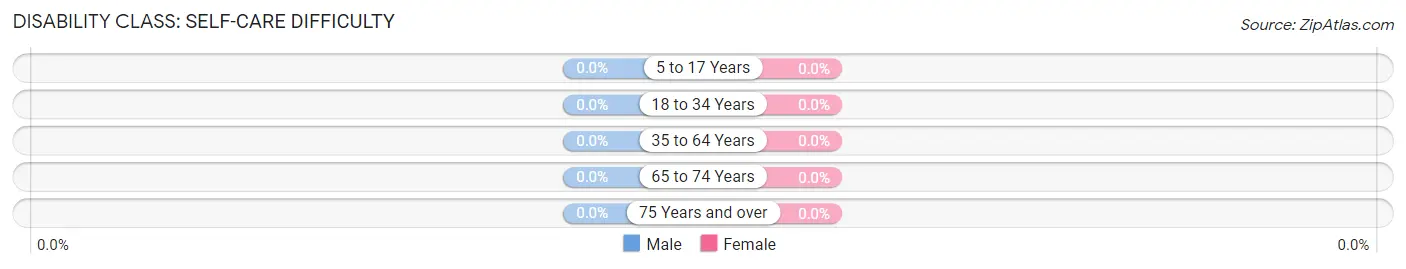
| Age Bracket | Male | Female |
| 5 to 17 Years | 0 (0.0%) | 0 (0.0%) |
| 18 to 34 Years | 0 (0.0%) | 0 (0.0%) |
| 35 to 64 Years | 0 (0.0%) | 0 (0.0%) |
| 65 to 74 Years | 0 (0.0%) | 0 (0.0%) |
| 75 Years and over | 0 (0.0%) | 0 (0.0%) |
Technology Access in Florence
Computing Device Access in Florence
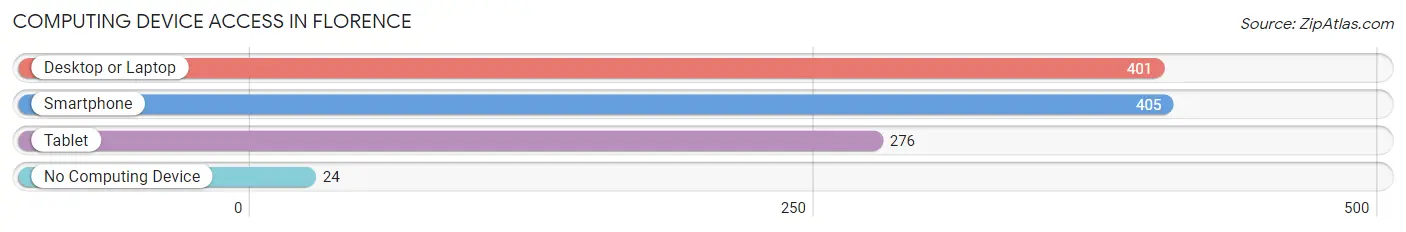
| Device Type | # Households | % Households |
| Desktop or Laptop | 401 | 88.3% |
| Smartphone | 405 | 89.2% |
| Tablet | 276 | 60.8% |
| No Computing Device | 24 | 5.3% |
| Total | 454 | 100.0% |
Internet Access in Florence
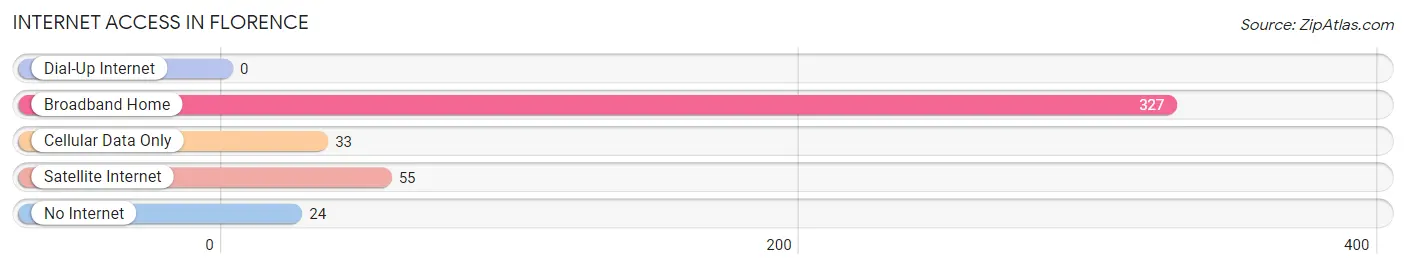
| Internet Type | # Households | % Households |
| Dial-Up Internet | 0 | 0.0% |
| Broadband Home | 327 | 72.0% |
| Cellular Data Only | 33 | 7.3% |
| Satellite Internet | 55 | 12.1% |
| No Internet | 24 | 5.3% |
| Total | 454 | 100.0% |
Florence Summary
Florence, Montana is a small town located in Ravalli County, Montana. It is situated in the Bitterroot Valley, which is a major agricultural area in the state. The town is located on the banks of the Bitterroot River, and is surrounded by the Bitterroot Mountains. The population of Florence was 1,093 in the 2010 census.
History
Florence was founded in 1882 by a group of settlers from Florence, Wisconsin. The town was named after the Wisconsin town, and was originally known as Florence City. The town was incorporated in 1887, and the first post office was established in 1888.
The town was originally a farming and ranching community, and the main crops grown were wheat, oats, barley, and hay. The town also had a sawmill, a flour mill, and a creamery.
In the early 1900s, the town began to grow and develop. The railroad arrived in Florence in 1906, and the town became a major shipping point for the surrounding area. The railroad also brought tourists to the area, and the town became a popular destination for fishing and hunting.
Geography
Florence is located in the Bitterroot Valley, which is a major agricultural area in the state. The town is situated on the banks of the Bitterroot River, and is surrounded by the Bitterroot Mountains. The town is located at an elevation of 3,400 feet, and has a total area of 1.2 square miles.
The climate in Florence is semi-arid, with hot summers and cold winters. The average annual temperature is 44 degrees Fahrenheit, and the average annual precipitation is 16 inches.
Economy
The economy of Florence is largely based on agriculture and tourism. The town is home to several farms and ranches, and the main crops grown are wheat, oats, barley, and hay. The town is also a popular destination for fishing and hunting, and there are several resorts and lodges in the area.
The town is also home to several small businesses, including restaurants, shops, and services. The town is also home to a small manufacturing plant, which produces wood products.
Demographics
As of the 2010 census, the population of Florence was 1,093. The racial makeup of the town was 95.3% White, 0.7% Native American, 0.3% Asian, 0.1% Pacific Islander, 0.1% from other races, and 3.5% from two or more races. The median household income was $37,500, and the median family income was $45,000.
The town is served by the Florence-Carlton School District, which includes an elementary school, a middle school, and a high school. The town is also home to a branch of the University of Montana, which offers a variety of degree programs.
Common Questions
What is Per Capita Income in Florence?
Per Capita income in Florence is $34,894.
What is the Median Family Income in Florence?
Median Family Income in Florence is $88,295.
What is the Median Household income in Florence?
Median Household Income in Florence is $74,615.
What is Income or Wage Gap in Florence?
Income or Wage Gap in Florence is 27.2%.
Women in Florence earn 72.8 cents for every dollar earned by a man.
What is Inequality or Gini Index in Florence?
Inequality or Gini Index in Florence is 0.33.
What is the Total Population of Florence?
Total Population of Florence is 1,046.
What is the Total Male Population of Florence?
Total Male Population of Florence is 503.
What is the Total Female Population of Florence?
Total Female Population of Florence is 543.
What is the Ratio of Males per 100 Females in Florence?
There are 92.63 Males per 100 Females in Florence.
What is the Ratio of Females per 100 Males in Florence?
There are 107.95 Females per 100 Males in Florence.
What is the Median Population Age in Florence?
Median Population Age in Florence is 56.0 Years.
What is the Average Family Size in Florence
Average Family Size in Florence is 2.9 People.
What is the Average Household Size in Florence
Average Household Size in Florence is 2.3 People.
How Large is the Labor Force in Florence?
There are 471 People in the Labor Forcein in Florence.
What is the Percentage of People in the Labor Force in Florence?
55.5% of People are in the Labor Force in Florence.
What is the Unemployment Rate in Florence?
Unemployment Rate in Florence is 11.7%.