Zip Codes with the Highest Percentage of Households with Income Below $10,000 in Baton Rouge, LA
RELATED REPORTS & OPTIONS
Household Income | $0-10k
Baton Rouge
Compare Zip Codes
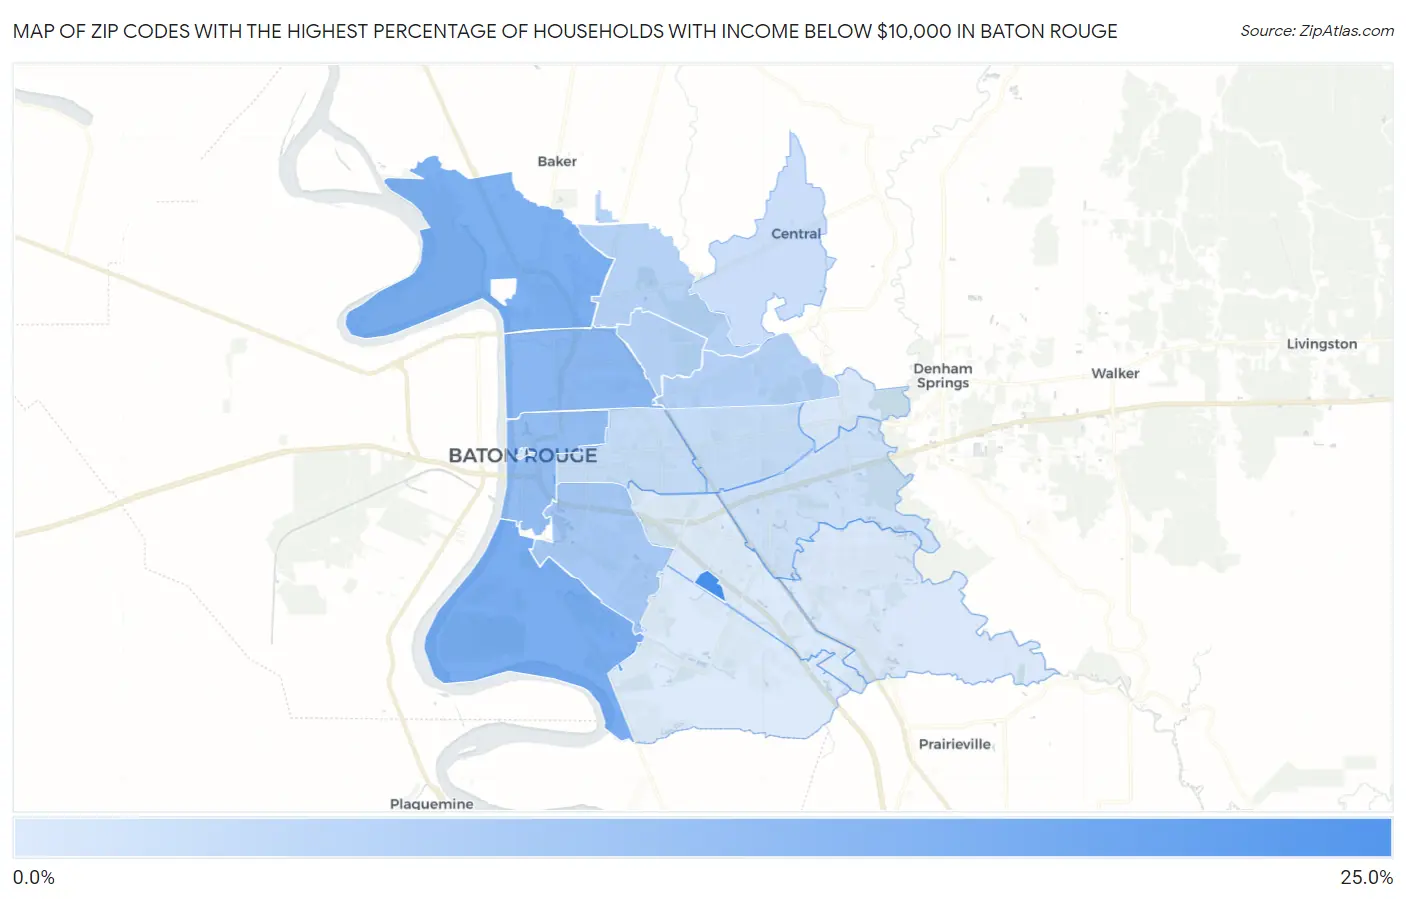
Map of Zip Codes with the Highest Percentage of Households with Income Below $10,000 in Baton Rouge
3.8%
22.9%
Zip Codes with the Highest Percentage of Households with Income Below $10,000 in Baton Rouge, LA
| Zip Code | Households with Income < $10k | vs State | vs National | |
| 1. | 70836 | 22.9% | 7.4%(+15.5)#20 | 4.9%(+18.0)#597 |
| 2. | 70820 | 16.2% | 7.4%(+8.80)#43 | 4.9%(+11.3)#1,290 |
| 3. | 70807 | 15.8% | 7.4%(+8.40)#48 | 4.9%(+10.9)#1,375 |
| 4. | 70805 | 14.0% | 7.4%(+6.60)#65 | 4.9%(+9.10)#1,761 |
| 5. | 70802 | 12.8% | 7.4%(+5.40)#75 | 4.9%(+7.90)#2,154 |
| 6. | 70808 | 10.6% | 7.4%(+3.20)#122 | 4.9%(+5.70)#3,170 |
| 7. | 70814 | 8.8% | 7.4%(+1.40)#182 | 4.9%(+3.90)#4,627 |
| 8. | 70811 | 8.5% | 7.4%(+1.10)#194 | 4.9%(+3.60)#4,938 |
| 9. | 70812 | 8.4% | 7.4%(+1.000)#196 | 4.9%(+3.50)#5,049 |
| 10. | 70815 | 6.5% | 7.4%(-0.900)#252 | 4.9%(+1.60)#7,906 |
| 11. | 70806 | 6.5% | 7.4%(-0.900)#253 | 4.9%(+1.60)#7,912 |
| 12. | 70818 | 6.0% | 7.4%(-1.40)#275 | 4.9%(+1.10)#9,044 |
| 13. | 70816 | 5.3% | 7.4%(-2.10)#299 | 4.9%(+0.400)#10,724 |
| 14. | 70819 | 4.4% | 7.4%(-3.00)#339 | 4.9%(-0.500)#13,862 |
| 15. | 70817 | 4.1% | 7.4%(-3.30)#350 | 4.9%(-0.800)#14,844 |
| 16. | 70810 | 3.9% | 7.4%(-3.50)#362 | 4.9%(-1.00)#15,603 |
| 17. | 70801 | 3.9% | 7.4%(-3.50)#369 | 4.9%(-1.00)#15,941 |
| 18. | 70809 | 3.8% | 7.4%(-3.60)#370 | 4.9%(-1.10)#16,041 |
1
Common Questions
What are the Top 10 Zip Codes with the Highest Percentage of Households with Income Below $10,000 in Baton Rouge, LA?
Top 10 Zip Codes with the Highest Percentage of Households with Income Below $10,000 in Baton Rouge, LA are:
What zip code has the Highest Percentage of Households with Income Below $10,000 in Baton Rouge, LA?
70836 has the Highest Percentage of Households with Income Below $10,000 in Baton Rouge, LA with 22.9%.
What is the Percentage of Households with Income Below $10,000 in Baton Rouge, LA?
Percentage of Households with Income Below $10,000 in Baton Rouge is 9.5%.
What is the Percentage of Households with Income Below $10,000 in Louisiana?
Percentage of Households with Income Below $10,000 in Louisiana is 7.4%.
What is the Percentage of Households with Income Below $10,000 in the United States?
Percentage of Households with Income Below $10,000 in the United States is 4.9%.