Zip Codes with the Highest Percentage of Families with Income Above $100,000 in Baton Rouge, LA
RELATED REPORTS & OPTIONS
Family Income | $100k+
Baton Rouge
Compare Zip Codes
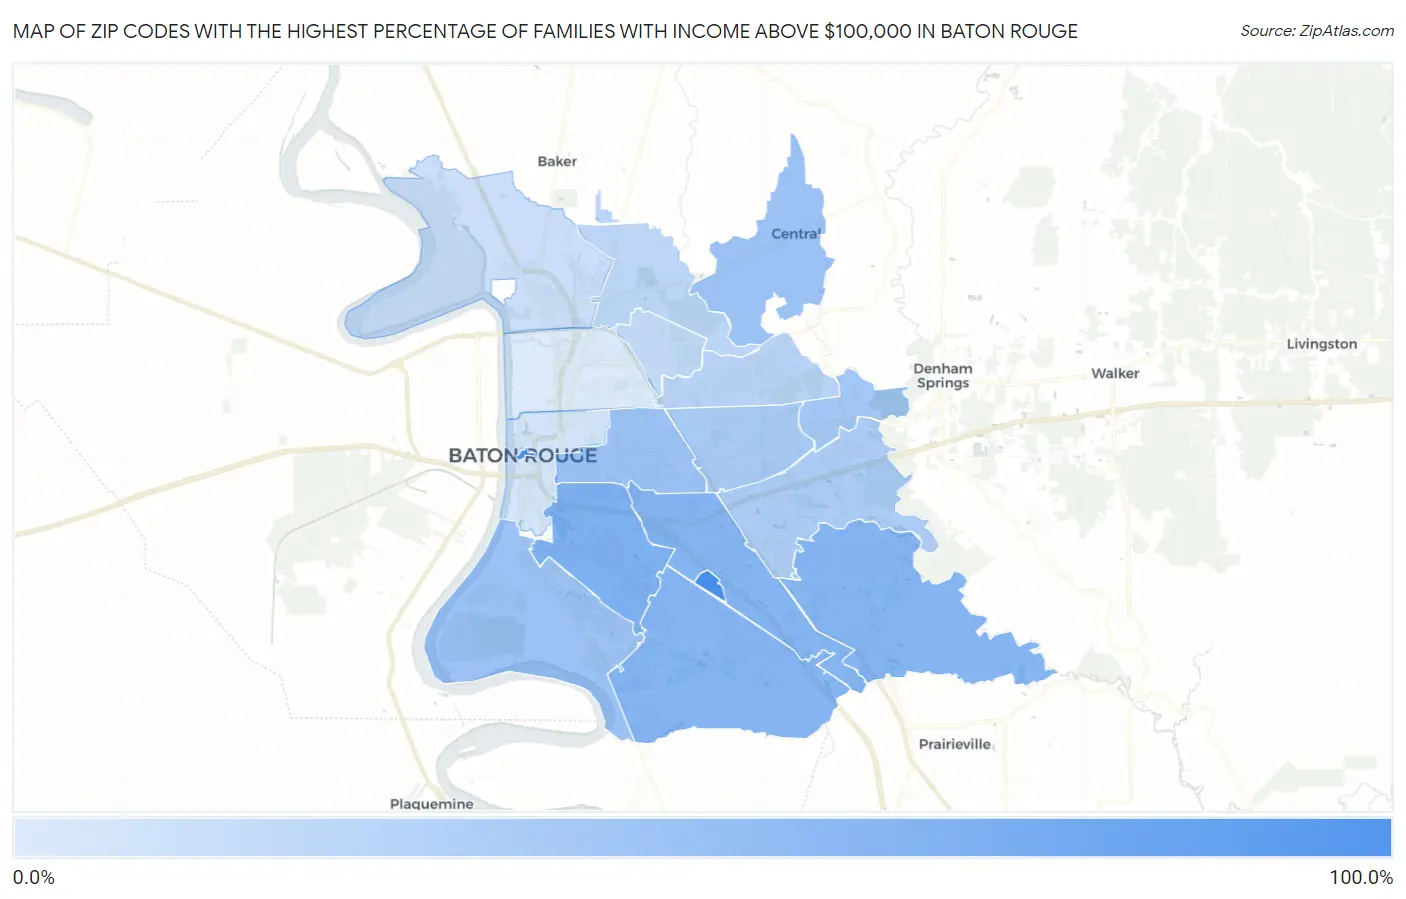
Map of Zip Codes with the Highest Percentage of Families with Income Above $100,000 in Baton Rouge
10.6%
100.0%
Zip Codes with the Highest Percentage of Families with Income Above $100,000 in Baton Rouge, LA
| Zip Code | Families with Income > $100k | vs State | vs National | |
| 1. | 70801 | 100.0% | 36.7%(+63.3)#1 | 46.1%(+53.9)#38 |
| 2. | 70836 | 100.0% | 36.7%(+63.3)#2 | 46.1%(+53.9)#47 |
| 3. | 70808 | 61.0% | 36.7%(+24.3)#27 | 46.1%(+14.9)#4,847 |
| 4. | 70817 | 56.2% | 36.7%(+19.5)#39 | 46.1%(+10.1)#6,360 |
| 5. | 70809 | 55.8% | 36.7%(+19.1)#40 | 46.1%(+9.70)#6,510 |
| 6. | 70810 | 55.7% | 36.7%(+19.0)#41 | 46.1%(+9.60)#6,536 |
| 7. | 70820 | 44.6% | 36.7%(+7.90)#95 | 46.1%(-1.50)#11,565 |
| 8. | 70818 | 43.5% | 36.7%(+6.80)#101 | 46.1%(-2.60)#12,185 |
| 9. | 70806 | 42.8% | 36.7%(+6.10)#107 | 46.1%(-3.30)#12,614 |
| 10. | 70819 | 39.1% | 36.7%(+2.40)#142 | 46.1%(-7.00)#15,017 |
| 11. | 70815 | 35.9% | 36.7%(-0.800)#186 | 46.1%(-10.2)#17,259 |
| 12. | 70816 | 34.5% | 36.7%(-2.20)#206 | 46.1%(-11.6)#18,229 |
| 13. | 70814 | 27.4% | 36.7%(-9.30)#297 | 46.1%(-18.7)#23,172 |
| 14. | 70811 | 25.1% | 36.7%(-11.6)#326 | 46.1%(-21.0)#24,650 |
| 15. | 70812 | 22.7% | 36.7%(-14.0)#354 | 46.1%(-23.4)#25,957 |
| 16. | 70807 | 18.6% | 36.7%(-18.1)#396 | 46.1%(-27.5)#27,861 |
| 17. | 70802 | 15.1% | 36.7%(-21.6)#428 | 46.1%(-31.0)#29,071 |
| 18. | 70805 | 10.6% | 36.7%(-26.1)#460 | 46.1%(-35.5)#30,224 |
1
Common Questions
What are the Top 10 Zip Codes with the Highest Percentage of Families with Income Above $100,000 in Baton Rouge, LA?
Top 10 Zip Codes with the Highest Percentage of Families with Income Above $100,000 in Baton Rouge, LA are:
What zip code has the Highest Percentage of Families with Income Above $100,000 in Baton Rouge, LA?
70801 has the Highest Percentage of Families with Income Above $100,000 in Baton Rouge, LA with 100.0%.
What is the Percentage of Families with Income Above $100,000 in Baton Rouge, LA?
Percentage of Families with Income Above $100,000 in Baton Rouge is 35.7%.
What is the Percentage of Families with Income Above $100,000 in Louisiana?
Percentage of Families with Income Above $100,000 in Louisiana is 36.7%.
What is the Percentage of Families with Income Above $100,000 in the United States?
Percentage of Families with Income Above $100,000 in the United States is 46.1%.