Zip Codes with the Highest Percentage of Population Employed in Security & Protection in Baton Rouge, LA
RELATED REPORTS & OPTIONS
Security & Protection
Baton Rouge
Compare Zip Codes
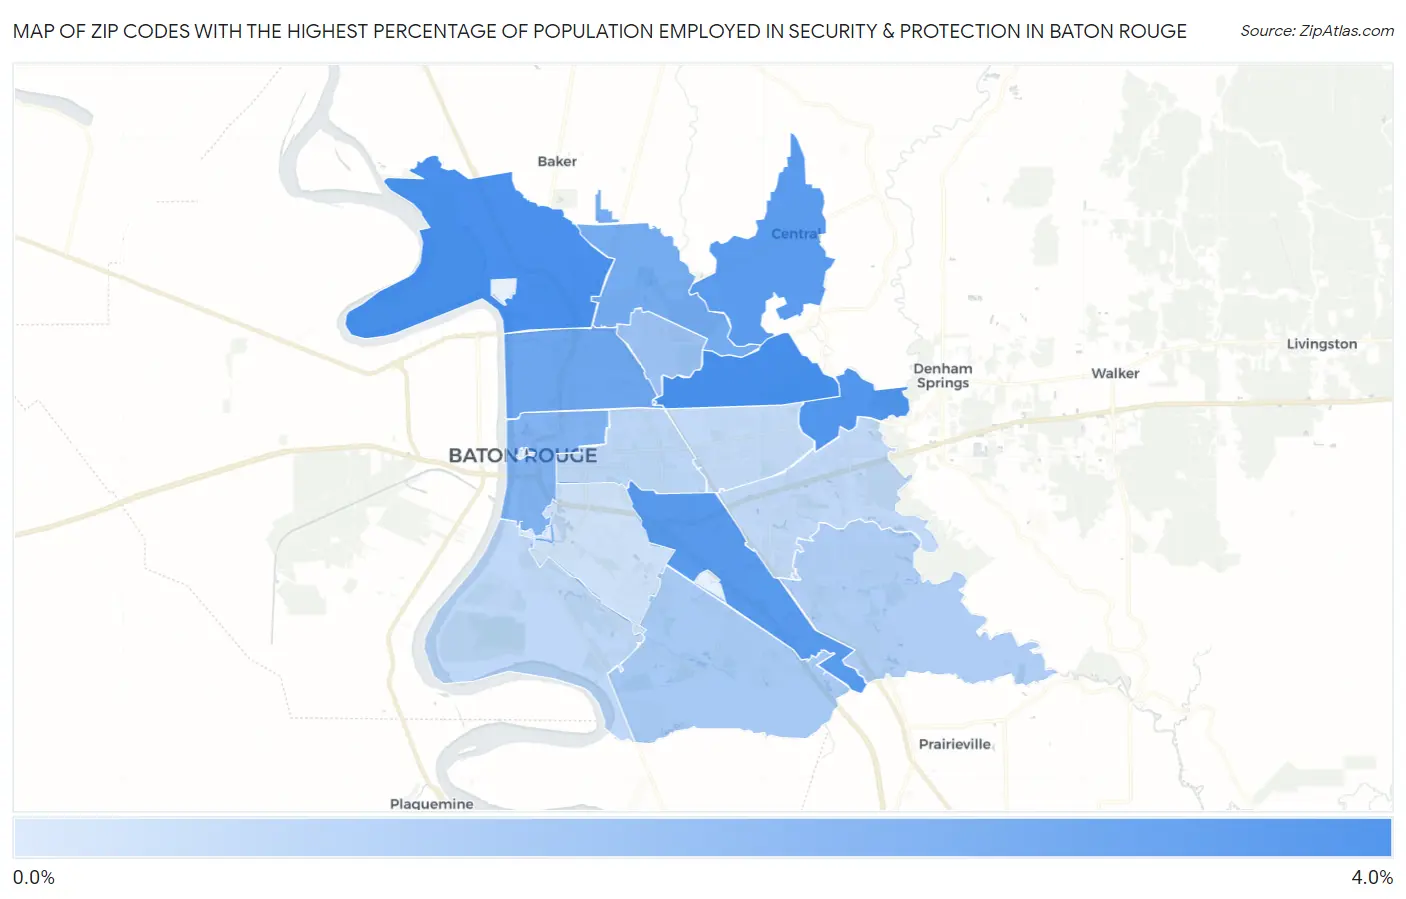
Map of Zip Codes with the Highest Percentage of Population Employed in Security & Protection in Baton Rouge
0.50%
3.7%
Zip Codes with the Highest Percentage of Population Employed in Security & Protection in Baton Rouge, LA
| Zip Code | % Employed | vs State | vs National | |
| 1. | 70814 | 3.7% | 2.6%(+1.05)#154 | 2.1%(+1.51)#5,245 |
| 2. | 70807 | 3.6% | 2.6%(+0.993)#160 | 2.1%(+1.45)#5,399 |
| 3. | 70819 | 3.4% | 2.6%(+0.827)#174 | 2.1%(+1.29)#5,839 |
| 4. | 70809 | 3.3% | 2.6%(+0.688)#186 | 2.1%(+1.15)#6,259 |
| 5. | 70818 | 3.2% | 2.6%(+0.593)#191 | 2.1%(+1.05)#6,540 |
| 6. | 70805 | 2.8% | 2.6%(+0.223)#214 | 2.1%(+0.681)#7,970 |
| 7. | 70811 | 2.7% | 2.6%(+0.086)#219 | 2.1%(+0.545)#8,566 |
| 8. | 70802 | 2.4% | 2.6%(-0.164)#238 | 2.1%(+0.295)#9,829 |
| 9. | 70812 | 1.9% | 2.6%(-0.706)#288 | 2.1%(-0.247)#13,208 |
| 10. | 70810 | 1.6% | 2.6%(-0.999)#311 | 2.1%(-0.541)#15,355 |
| 11. | 70817 | 1.5% | 2.6%(-1.12)#323 | 2.1%(-0.666)#16,338 |
| 12. | 70806 | 1.2% | 2.6%(-1.43)#341 | 2.1%(-0.968)#18,670 |
| 13. | 70820 | 1.1% | 2.6%(-1.50)#349 | 2.1%(-1.04)#19,217 |
| 14. | 70816 | 1.1% | 2.6%(-1.53)#353 | 2.1%(-1.08)#19,483 |
| 15. | 70815 | 1.0% | 2.6%(-1.59)#360 | 2.1%(-1.13)#19,923 |
| 16. | 70808 | 0.80% | 2.6%(-1.80)#375 | 2.1%(-1.35)#21,389 |
| 17. | 70803 | 0.50% | 2.6%(-2.10)#397 | 2.1%(-1.64)#23,202 |
1
Common Questions
What are the Top 10 Zip Codes with the Highest Percentage of Population Employed in Security & Protection in Baton Rouge, LA?
Top 10 Zip Codes with the Highest Percentage of Population Employed in Security & Protection in Baton Rouge, LA are:
What zip code has the Highest Percentage of Population Employed in Security & Protection in Baton Rouge, LA?
70814 has the Highest Percentage of Population Employed in Security & Protection in Baton Rouge, LA with 3.7%.
What is the Percentage of Population Employed in Security & Protection in Baton Rouge, LA?
Percentage of Population Employed in Security & Protection in Baton Rouge is 1.7%.
What is the Percentage of Population Employed in Security & Protection in Louisiana?
Percentage of Population Employed in Security & Protection in Louisiana is 2.6%.
What is the Percentage of Population Employed in Security & Protection in the United States?
Percentage of Population Employed in Security & Protection in the United States is 2.1%.