Zip Codes with the Highest Percentage of Population with a Degree in Communications in Baton Rouge, LA
RELATED REPORTS & OPTIONS
Communications
Baton Rouge
Compare Zip Codes
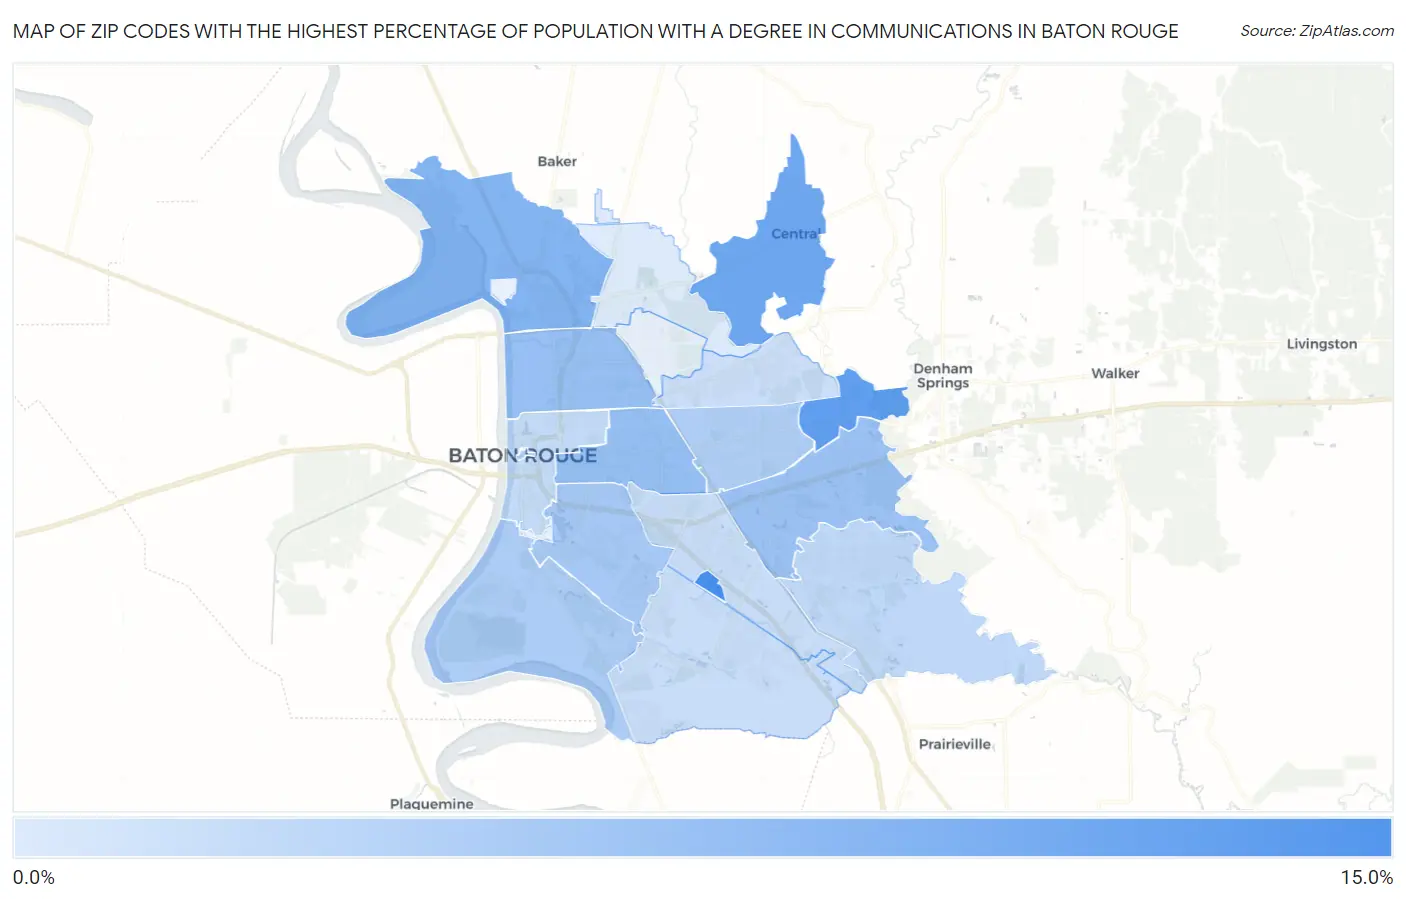
Map of Zip Codes with the Highest Percentage of Population with a Degree in Communications in Baton Rouge
1.3%
11.1%
Zip Codes with the Highest Percentage of Population with a Degree in Communications in Baton Rouge, LA
| Zip Code | % Graduates | vs State | vs National | |
| 1. | 70836 | 11.1% | 3.2%(+7.86)#12 | 4.1%(+6.98)#967 |
| 2. | 70819 | 9.4% | 3.2%(+6.11)#13 | 4.1%(+5.23)#1,313 |
| 3. | 70818 | 8.5% | 3.2%(+5.21)#19 | 4.1%(+4.32)#1,651 |
| 4. | 70807 | 7.1% | 3.2%(+3.90)#25 | 4.1%(+3.01)#2,473 |
| 5. | 70806 | 5.9% | 3.2%(+2.64)#39 | 4.1%(+1.75)#3,960 |
| 6. | 70805 | 5.8% | 3.2%(+2.53)#43 | 4.1%(+1.64)#4,155 |
| 7. | 70816 | 5.4% | 3.2%(+2.13)#51 | 4.1%(+1.24)#4,900 |
| 8. | 70808 | 4.9% | 3.2%(+1.62)#63 | 4.1%(+0.729)#6,024 |
| 9. | 70820 | 4.3% | 3.2%(+1.08)#75 | 4.1%(+0.188)#7,516 |
| 10. | 70801 | 4.3% | 3.2%(+1.01)#78 | 4.1%(+0.120)#7,717 |
| 11. | 70815 | 4.2% | 3.2%(+0.971)#80 | 4.1%(+0.082)#7,843 |
| 12. | 70817 | 3.2% | 3.2%(-0.003)#120 | 4.1%(-0.892)#11,286 |
| 13. | 70802 | 3.0% | 3.2%(-0.255)#129 | 4.1%(-1.14)#12,219 |
| 14. | 70810 | 2.6% | 3.2%(-0.615)#152 | 4.1%(-1.50)#13,679 |
| 15. | 70809 | 2.6% | 3.2%(-0.675)#154 | 4.1%(-1.56)#13,888 |
| 16. | 70814 | 2.5% | 3.2%(-0.777)#161 | 4.1%(-1.67)#14,243 |
| 17. | 70811 | 1.3% | 3.2%(-1.92)#206 | 4.1%(-2.80)#18,034 |
1
Common Questions
What are the Top 10 Zip Codes with the Highest Percentage of Population with a Degree in Communications in Baton Rouge, LA?
Top 10 Zip Codes with the Highest Percentage of Population with a Degree in Communications in Baton Rouge, LA are:
What zip code has the Highest Percentage of Population with a Degree in Communications in Baton Rouge, LA?
70836 has the Highest Percentage of Population with a Degree in Communications in Baton Rouge, LA with 11.1%.
What is the Percentage of Population with a Degree in Communications in Baton Rouge, LA?
Percentage of Population with a Degree in Communications in Baton Rouge is 4.6%.
What is the Percentage of Population with a Degree in Communications in Louisiana?
Percentage of Population with a Degree in Communications in Louisiana is 3.2%.
What is the Percentage of Population with a Degree in Communications in the United States?
Percentage of Population with a Degree in Communications in the United States is 4.1%.