Zip Codes with the Highest Percentage of Households with Income Below $10,000 in Gretna, LA
RELATED REPORTS & OPTIONS
Household Income | $0-10k
Gretna
Compare Zip Codes
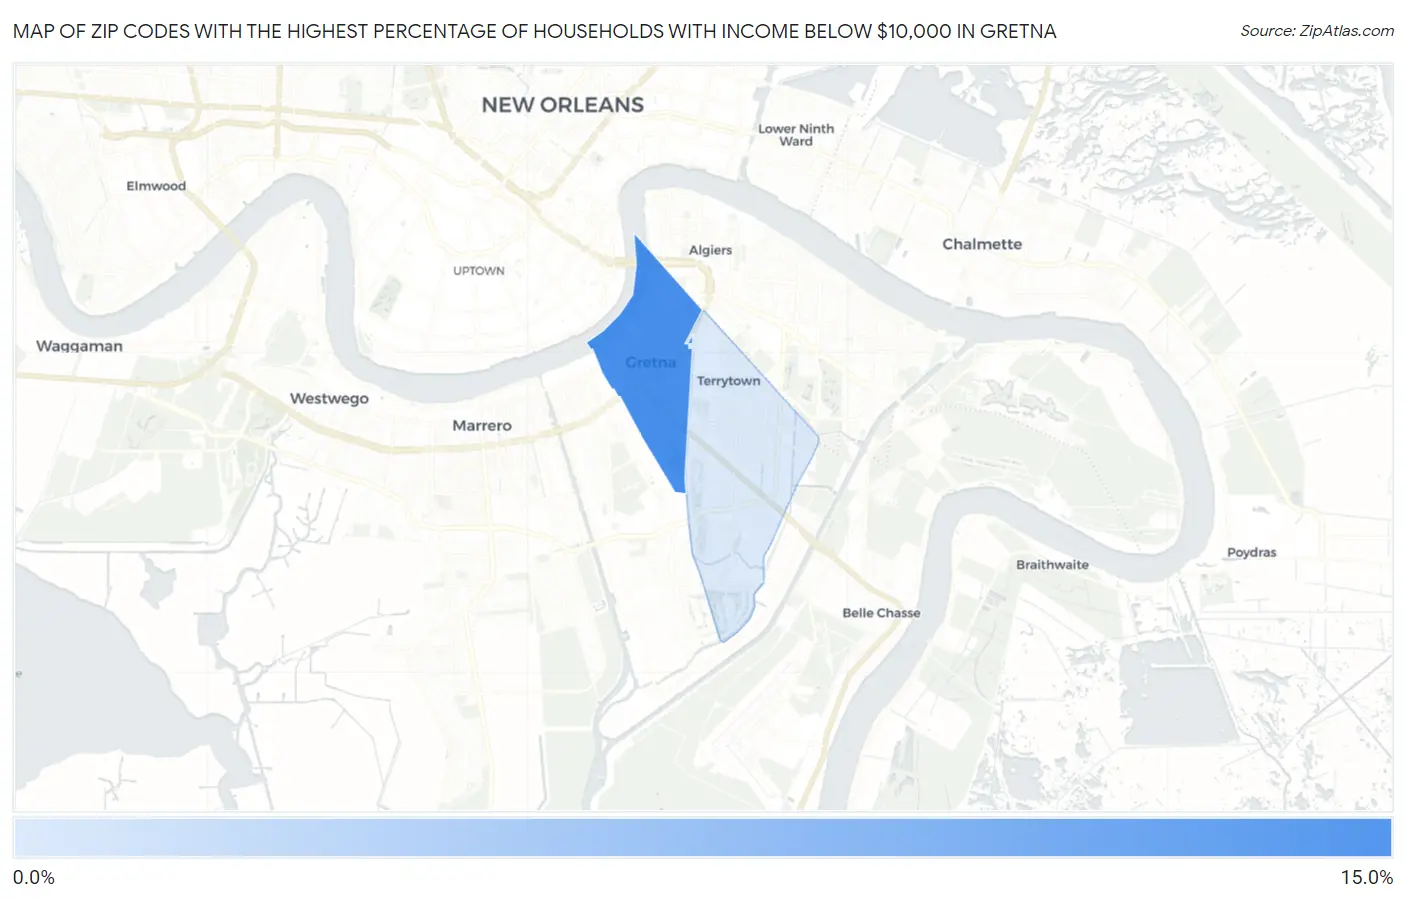
Map of Zip Codes with the Highest Percentage of Households with Income Below $10,000 in Gretna
3.5%
12.1%
Zip Codes with the Highest Percentage of Households with Income Below $10,000 in Gretna, LA
| Zip Code | Households with Income < $10k | vs State | vs National | |
| 1. | 70053 | 12.1% | 7.4%(+4.70)#85 | 4.9%(+7.20)#2,412 |
| 2. | 70056 | 3.5% | 7.4%(-3.90)#381 | 4.9%(-1.40)#17,203 |
1
Common Questions
What are the Top Zip Codes with the Highest Percentage of Households with Income Below $10,000 in Gretna, LA?
Top Zip Codes with the Highest Percentage of Households with Income Below $10,000 in Gretna, LA are:
What zip code has the Highest Percentage of Households with Income Below $10,000 in Gretna, LA?
70053 has the Highest Percentage of Households with Income Below $10,000 in Gretna, LA with 12.1%.
What is the Percentage of Households with Income Below $10,000 in Gretna, LA?
Percentage of Households with Income Below $10,000 in Gretna is 11.6%.
What is the Percentage of Households with Income Below $10,000 in Louisiana?
Percentage of Households with Income Below $10,000 in Louisiana is 7.4%.
What is the Percentage of Households with Income Below $10,000 in the United States?
Percentage of Households with Income Below $10,000 in the United States is 4.9%.