Zip Codes with the Highest Percentage of Population Employed in Firefighting & Prevention in Baton Rouge, LA
RELATED REPORTS & OPTIONS
Firefighting & Prevention
Baton Rouge
Compare Zip Codes
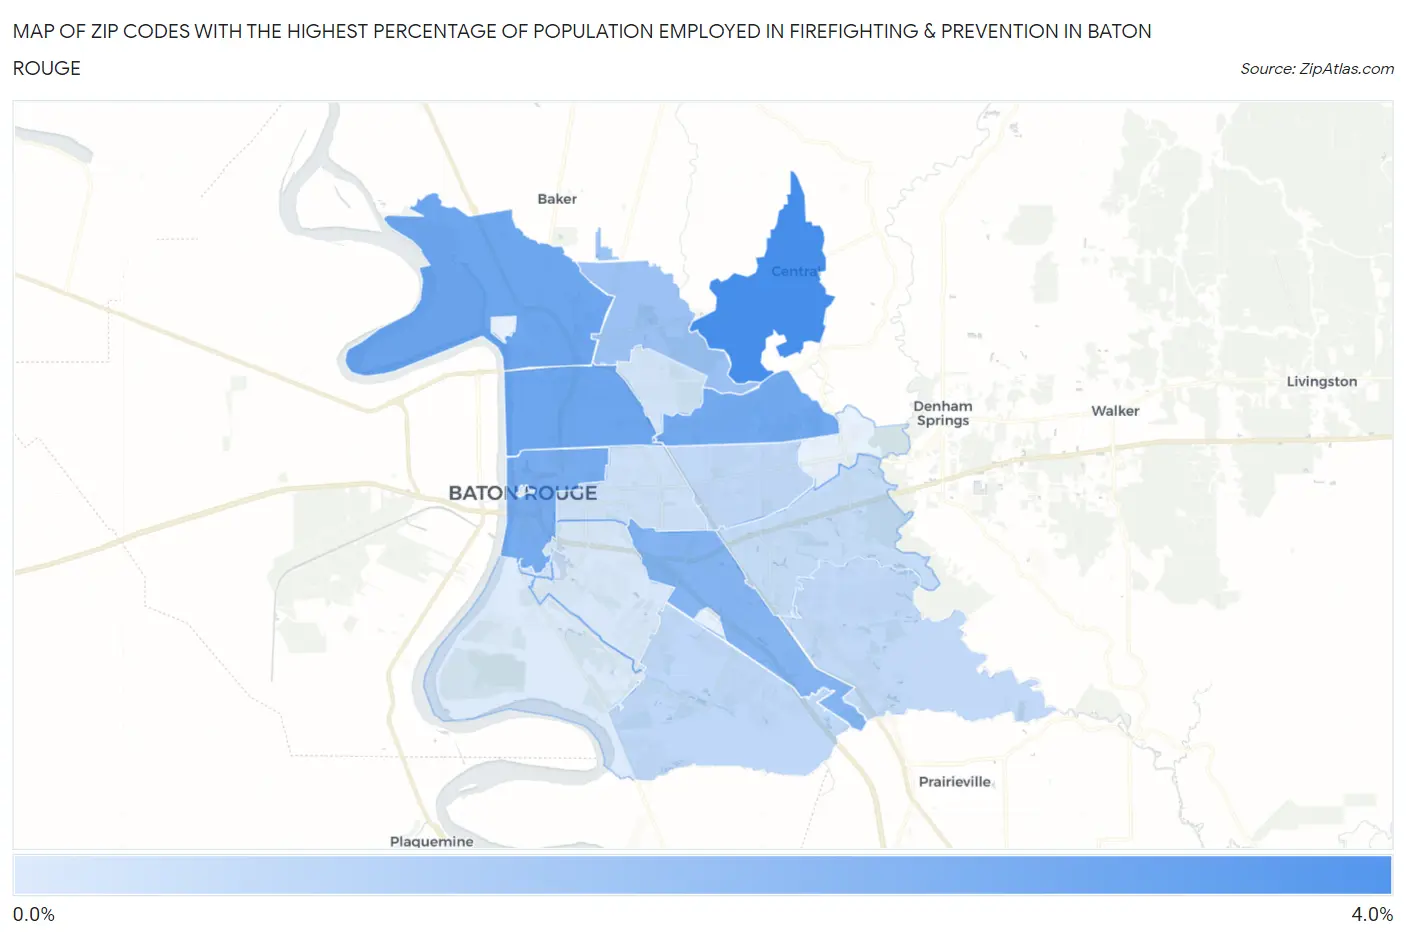
Map of Zip Codes with the Highest Percentage of Population Employed in Firefighting & Prevention in Baton Rouge
0.26%
3.2%
Zip Codes with the Highest Percentage of Population Employed in Firefighting & Prevention in Baton Rouge, LA
| Zip Code | % Employed | vs State | vs National | |
| 1. | 70818 | 3.2% | 1.3%(+1.91)#63 | 1.2%(+2.01)#2,025 |
| 2. | 70807 | 2.4% | 1.3%(+1.12)#90 | 1.2%(+1.23)#3,287 |
| 3. | 70805 | 2.4% | 1.3%(+1.12)#91 | 1.2%(+1.23)#3,301 |
| 4. | 70814 | 2.3% | 1.3%(+1.02)#96 | 1.2%(+1.13)#3,524 |
| 5. | 70802 | 2.2% | 1.3%(+0.935)#101 | 1.2%(+1.04)#3,772 |
| 6. | 70809 | 2.0% | 1.3%(+0.659)#130 | 1.2%(+0.768)#4,686 |
| 7. | 70811 | 1.5% | 1.3%(+0.208)#162 | 1.2%(+0.317)#6,951 |
| 8. | 70810 | 0.83% | 1.3%(-0.467)#228 | 1.2%(-0.358)#12,892 |
| 9. | 70817 | 0.81% | 1.3%(-0.485)#231 | 1.2%(-0.377)#13,107 |
| 10. | 70815 | 0.79% | 1.3%(-0.501)#234 | 1.2%(-0.392)#13,293 |
| 11. | 70816 | 0.72% | 1.3%(-0.574)#245 | 1.2%(-0.465)#14,085 |
| 12. | 70806 | 0.50% | 1.3%(-0.790)#279 | 1.2%(-0.681)#16,496 |
| 13. | 70803 | 0.50% | 1.3%(-0.791)#280 | 1.2%(-0.682)#16,507 |
| 14. | 70812 | 0.45% | 1.3%(-0.847)#289 | 1.2%(-0.738)#17,123 |
| 15. | 70808 | 0.36% | 1.3%(-0.939)#305 | 1.2%(-0.830)#18,161 |
| 16. | 70820 | 0.26% | 1.3%(-1.04)#319 | 1.2%(-0.928)#19,164 |
1
Common Questions
What are the Top 10 Zip Codes with the Highest Percentage of Population Employed in Firefighting & Prevention in Baton Rouge, LA?
Top 10 Zip Codes with the Highest Percentage of Population Employed in Firefighting & Prevention in Baton Rouge, LA are:
What zip code has the Highest Percentage of Population Employed in Firefighting & Prevention in Baton Rouge, LA?
70818 has the Highest Percentage of Population Employed in Firefighting & Prevention in Baton Rouge, LA with 3.2%.
What is the Percentage of Population Employed in Firefighting & Prevention in Baton Rouge, LA?
Percentage of Population Employed in Firefighting & Prevention in Baton Rouge is 1.2%.
What is the Percentage of Population Employed in Firefighting & Prevention in Louisiana?
Percentage of Population Employed in Firefighting & Prevention in Louisiana is 1.3%.
What is the Percentage of Population Employed in Firefighting & Prevention in the United States?
Percentage of Population Employed in Firefighting & Prevention in the United States is 1.2%.