Zip Codes with the Highest Percentage of Population with a Degree in Liberal Arts and History in Baton Rouge, LA
RELATED REPORTS & OPTIONS
Liberal Arts and History
Baton Rouge
Compare Zip Codes
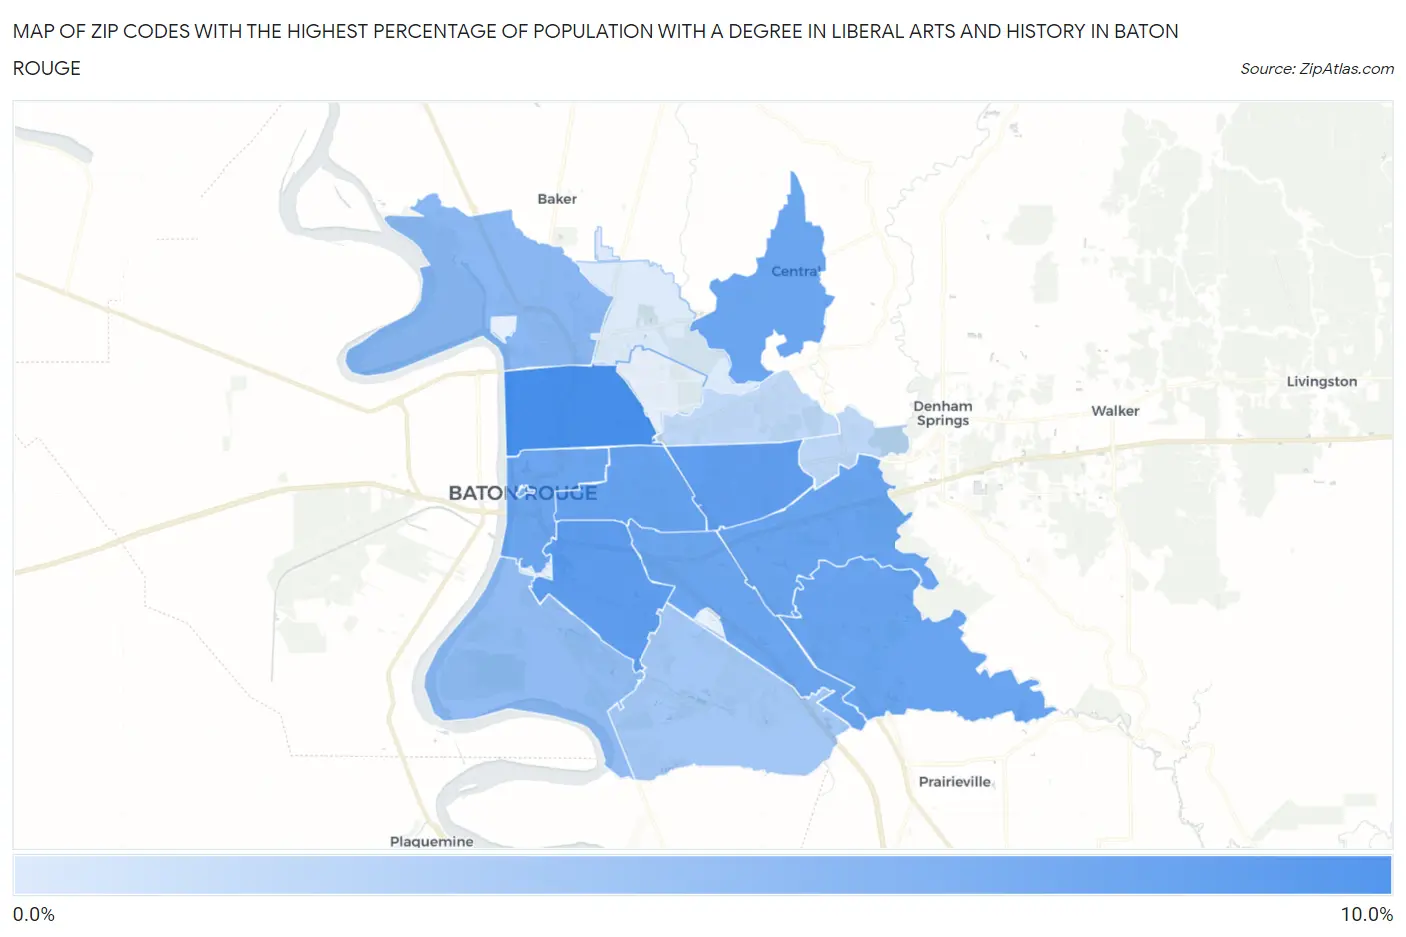
Map of Zip Codes with the Highest Percentage of Population with a Degree in Liberal Arts and History in Baton Rouge
1.3%
9.1%
Zip Codes with the Highest Percentage of Population with a Degree in Liberal Arts and History in Baton Rouge, LA
| Zip Code | % Graduates | vs State | vs National | |
| 1. | 70805 | 9.1% | 7.4%(+1.67)#137 | 4.9%(+4.25)#3,733 |
| 2. | 70808 | 7.9% | 7.4%(+0.448)#169 | 4.9%(+3.02)#5,037 |
| 3. | 70815 | 7.7% | 7.4%(+0.249)#176 | 4.9%(+2.83)#5,297 |
| 4. | 70806 | 7.5% | 7.4%(+0.037)#185 | 4.9%(+2.61)#5,610 |
| 5. | 70816 | 7.3% | 7.4%(-0.177)#196 | 4.9%(+2.40)#5,926 |
| 6. | 70817 | 7.3% | 7.4%(-0.187)#197 | 4.9%(+2.39)#5,947 |
| 7. | 70818 | 7.2% | 7.4%(-0.281)#200 | 4.9%(+2.30)#6,104 |
| 8. | 70802 | 7.1% | 7.4%(-0.326)#201 | 4.9%(+2.25)#6,200 |
| 9. | 70809 | 7.1% | 7.4%(-0.351)#203 | 4.9%(+2.23)#6,245 |
| 10. | 70801 | 6.4% | 7.4%(-1.07)#219 | 4.9%(+1.51)#7,598 |
| 11. | 70807 | 5.6% | 7.4%(-1.86)#253 | 4.9%(+0.721)#9,585 |
| 12. | 70820 | 5.1% | 7.4%(-2.30)#271 | 4.9%(+0.271)#10,895 |
| 13. | 70810 | 4.2% | 7.4%(-3.20)#297 | 4.9%(-0.627)#13,835 |
| 14. | 70819 | 3.0% | 7.4%(-4.48)#332 | 4.9%(-1.90)#18,471 |
| 15. | 70814 | 2.8% | 7.4%(-4.62)#337 | 4.9%(-2.04)#18,906 |
| 16. | 70811 | 1.3% | 7.4%(-6.18)#369 | 4.9%(-3.60)#22,924 |
1
Common Questions
What are the Top 10 Zip Codes with the Highest Percentage of Population with a Degree in Liberal Arts and History in Baton Rouge, LA?
Top 10 Zip Codes with the Highest Percentage of Population with a Degree in Liberal Arts and History in Baton Rouge, LA are:
What zip code has the Highest Percentage of Population with a Degree in Liberal Arts and History in Baton Rouge, LA?
70805 has the Highest Percentage of Population with a Degree in Liberal Arts and History in Baton Rouge, LA with 9.1%.
What is the Percentage of Population with a Degree in Liberal Arts and History in Baton Rouge, LA?
Percentage of Population with a Degree in Liberal Arts and History in Baton Rouge is 7.0%.
What is the Percentage of Population with a Degree in Liberal Arts and History in Louisiana?
Percentage of Population with a Degree in Liberal Arts and History in Louisiana is 7.4%.
What is the Percentage of Population with a Degree in Liberal Arts and History in the United States?
Percentage of Population with a Degree in Liberal Arts and History in the United States is 4.9%.