Zip Codes with the Highest Percentage of Self-Employed / Not Incorporated in Baton Rouge, LA
RELATED REPORTS & OPTIONS
Self-Employed / Not Incorporated
Baton Rouge
Compare Zip Codes
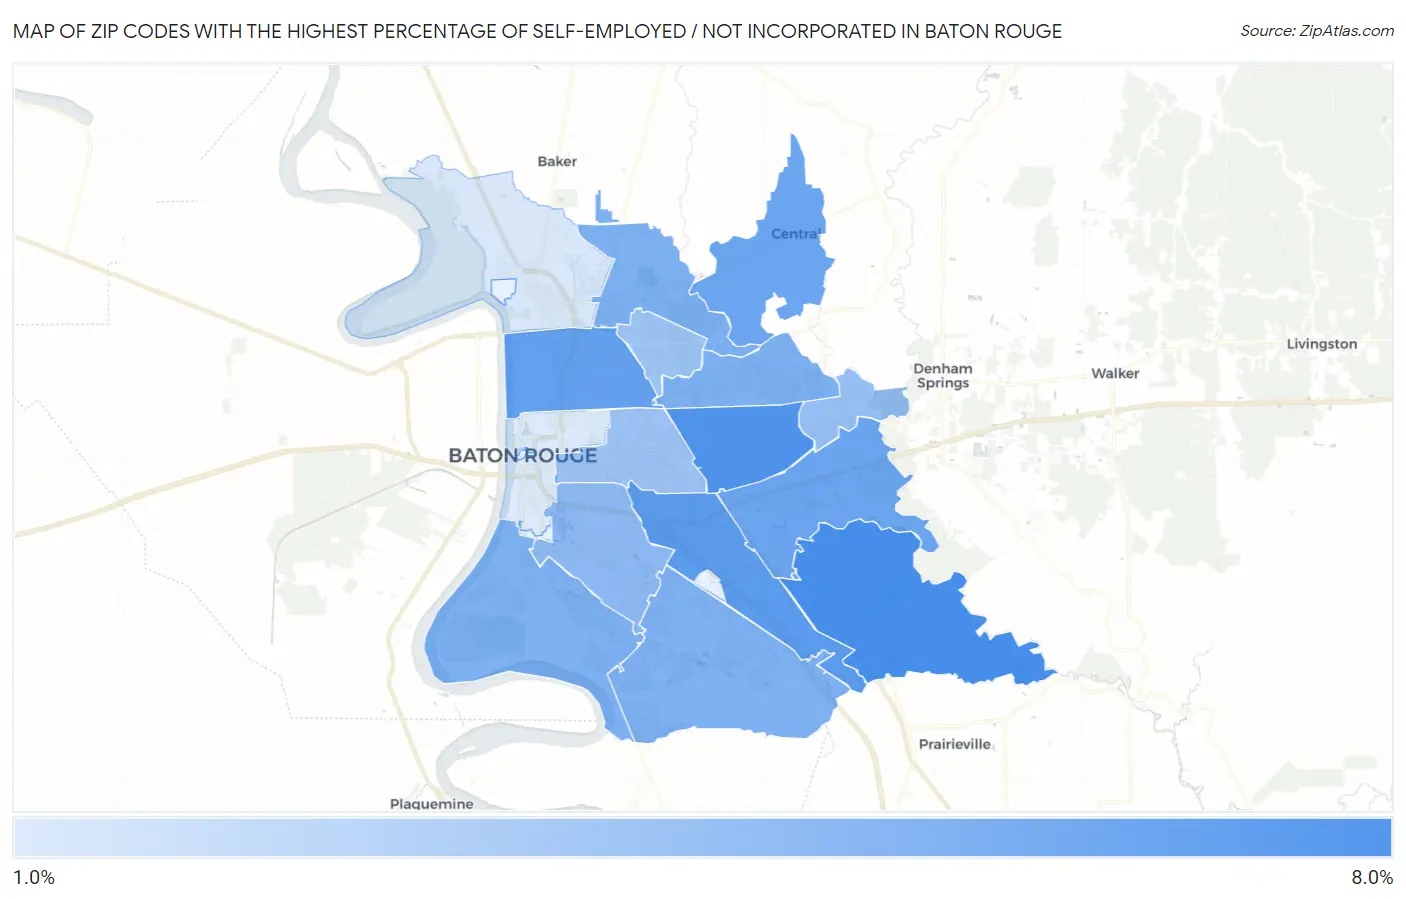
Map of Zip Codes with the Highest Percentage of Self-Employed / Not Incorporated in Baton Rouge
0.0%
8.0%
Zip Codes with the Highest Percentage of Self-Employed / Not Incorporated in Baton Rouge, LA
| Zip Code | % Self-Employed / Not Incorporated | vs State | vs National | |
| 1. | 70817 | 7.0% | 6.3%(+0.711)#178 | 5.8%(+1.19)#13,041 |
| 2. | 70815 | 6.6% | 6.3%(+0.349)#193 | 5.8%(+0.826)#14,005 |
| 3. | 70809 | 6.4% | 6.3%(+0.092)#201 | 5.8%(+0.569)#14,829 |
| 4. | 70805 | 6.0% | 6.3%(-0.269)#219 | 5.8%(+0.208)#15,997 |
| 5. | 70816 | 5.7% | 6.3%(-0.567)#236 | 5.8%(-0.090)#16,937 |
| 6. | 70818 | 5.7% | 6.3%(-0.590)#238 | 5.8%(-0.113)#17,028 |
| 7. | 70814 | 5.2% | 6.3%(-1.10)#270 | 5.8%(-0.618)#18,930 |
| 8. | 70811 | 5.1% | 6.3%(-1.15)#274 | 5.8%(-0.670)#19,126 |
| 9. | 70810 | 5.1% | 6.3%(-1.20)#278 | 5.8%(-0.719)#19,304 |
| 10. | 70820 | 5.1% | 6.3%(-1.21)#279 | 5.8%(-0.731)#19,340 |
| 11. | 70808 | 4.6% | 6.3%(-1.72)#301 | 5.8%(-1.24)#21,256 |
| 12. | 70819 | 4.3% | 6.3%(-2.01)#317 | 5.8%(-1.54)#22,412 |
| 13. | 70806 | 4.1% | 6.3%(-2.15)#325 | 5.8%(-1.68)#22,910 |
| 14. | 70812 | 3.9% | 6.3%(-2.35)#334 | 5.8%(-1.87)#23,581 |
| 15. | 70807 | 2.0% | 6.3%(-4.25)#418 | 5.8%(-3.77)#28,169 |
| 16. | 70802 | 1.9% | 6.3%(-4.41)#422 | 5.8%(-3.94)#28,393 |
1
Common Questions
What are the Top 10 Zip Codes with the Highest Percentage of Self-Employed / Not Incorporated in Baton Rouge, LA?
Top 10 Zip Codes with the Highest Percentage of Self-Employed / Not Incorporated in Baton Rouge, LA are:
What zip code has the Highest Percentage of Self-Employed / Not Incorporated in Baton Rouge, LA?
70817 has the Highest Percentage of Self-Employed / Not Incorporated in Baton Rouge, LA with 7.0%.
What is the Percentage of Self-Employed / Not Incorporated in Baton Rouge, LA?
Percentage of Self-Employed / Not Incorporated in Baton Rouge is 4.6%.
What is the Percentage of Self-Employed / Not Incorporated in Louisiana?
Percentage of Self-Employed / Not Incorporated in Louisiana is 6.3%.
What is the Percentage of Self-Employed / Not Incorporated in the United States?
Percentage of Self-Employed / Not Incorporated in the United States is 5.8%.