Zip Codes with the Highest Percentage of Population Employed in Installation, Maintenance & Repair in Baton Rouge, LA
RELATED REPORTS & OPTIONS
Installation, Maintenance & Repair
Baton Rouge
Compare Zip Codes
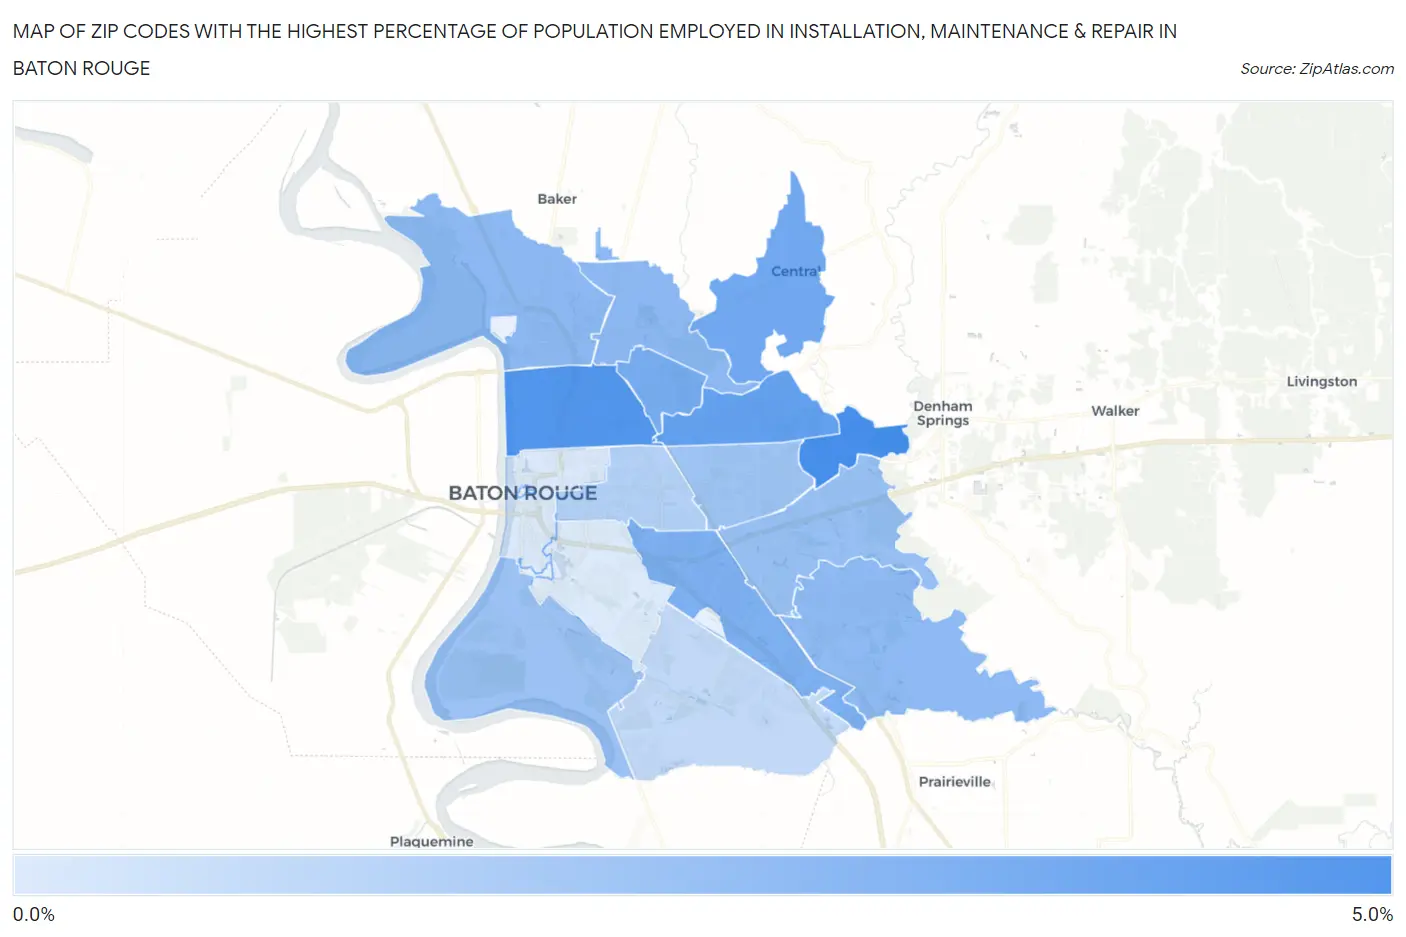
Map of Zip Codes with the Highest Percentage of Population Employed in Installation, Maintenance & Repair in Baton Rouge
0.72%
4.6%
Zip Codes with the Highest Percentage of Population Employed in Installation, Maintenance & Repair in Baton Rouge, LA
| Zip Code | % Employed | vs State | vs National | |
| 1. | 70819 | 4.6% | 3.7%(+0.969)#201 | 3.1%(+1.58)#9,868 |
| 2. | 70805 | 4.3% | 3.7%(+0.666)#217 | 3.1%(+1.28)#10,987 |
| 3. | 70814 | 3.9% | 3.7%(+0.249)#245 | 3.1%(+0.861)#12,671 |
| 4. | 70818 | 3.5% | 3.7%(-0.139)#276 | 3.1%(+0.473)#14,420 |
| 5. | 70812 | 3.4% | 3.7%(-0.296)#284 | 3.1%(+0.316)#15,156 |
| 6. | 70809 | 3.2% | 3.7%(-0.472)#291 | 3.1%(+0.140)#15,994 |
| 7. | 70807 | 2.8% | 3.7%(-0.843)#313 | 3.1%(-0.231)#17,818 |
| 8. | 70811 | 2.8% | 3.7%(-0.895)#321 | 3.1%(-0.283)#18,085 |
| 9. | 70817 | 2.8% | 3.7%(-0.909)#323 | 3.1%(-0.297)#18,159 |
| 10. | 70816 | 2.5% | 3.7%(-1.15)#340 | 3.1%(-0.535)#19,392 |
| 11. | 70820 | 2.4% | 3.7%(-1.26)#344 | 3.1%(-0.652)#19,989 |
| 12. | 70815 | 2.3% | 3.7%(-1.34)#346 | 3.1%(-0.728)#20,367 |
| 13. | 70806 | 1.8% | 3.7%(-1.91)#374 | 3.1%(-1.30)#23,045 |
| 14. | 70810 | 1.4% | 3.7%(-2.26)#390 | 3.1%(-1.65)#24,493 |
| 15. | 70802 | 0.80% | 3.7%(-2.88)#415 | 3.1%(-2.27)#26,502 |
| 16. | 70808 | 0.72% | 3.7%(-2.96)#417 | 3.1%(-2.35)#26,732 |
1
Common Questions
What are the Top 10 Zip Codes with the Highest Percentage of Population Employed in Installation, Maintenance & Repair in Baton Rouge, LA?
Top 10 Zip Codes with the Highest Percentage of Population Employed in Installation, Maintenance & Repair in Baton Rouge, LA are:
What zip code has the Highest Percentage of Population Employed in Installation, Maintenance & Repair in Baton Rouge, LA?
70819 has the Highest Percentage of Population Employed in Installation, Maintenance & Repair in Baton Rouge, LA with 4.6%.
What is the Percentage of Population Employed in Installation, Maintenance & Repair in Baton Rouge, LA?
Percentage of Population Employed in Installation, Maintenance & Repair in Baton Rouge is 2.2%.
What is the Percentage of Population Employed in Installation, Maintenance & Repair in Louisiana?
Percentage of Population Employed in Installation, Maintenance & Repair in Louisiana is 3.7%.
What is the Percentage of Population Employed in Installation, Maintenance & Repair in the United States?
Percentage of Population Employed in Installation, Maintenance & Repair in the United States is 3.1%.