Zip Codes with the Highest Percentage of Population Employed in Office & Administration in Baton Rouge, LA
RELATED REPORTS & OPTIONS
Office & Administration
Baton Rouge
Compare Zip Codes
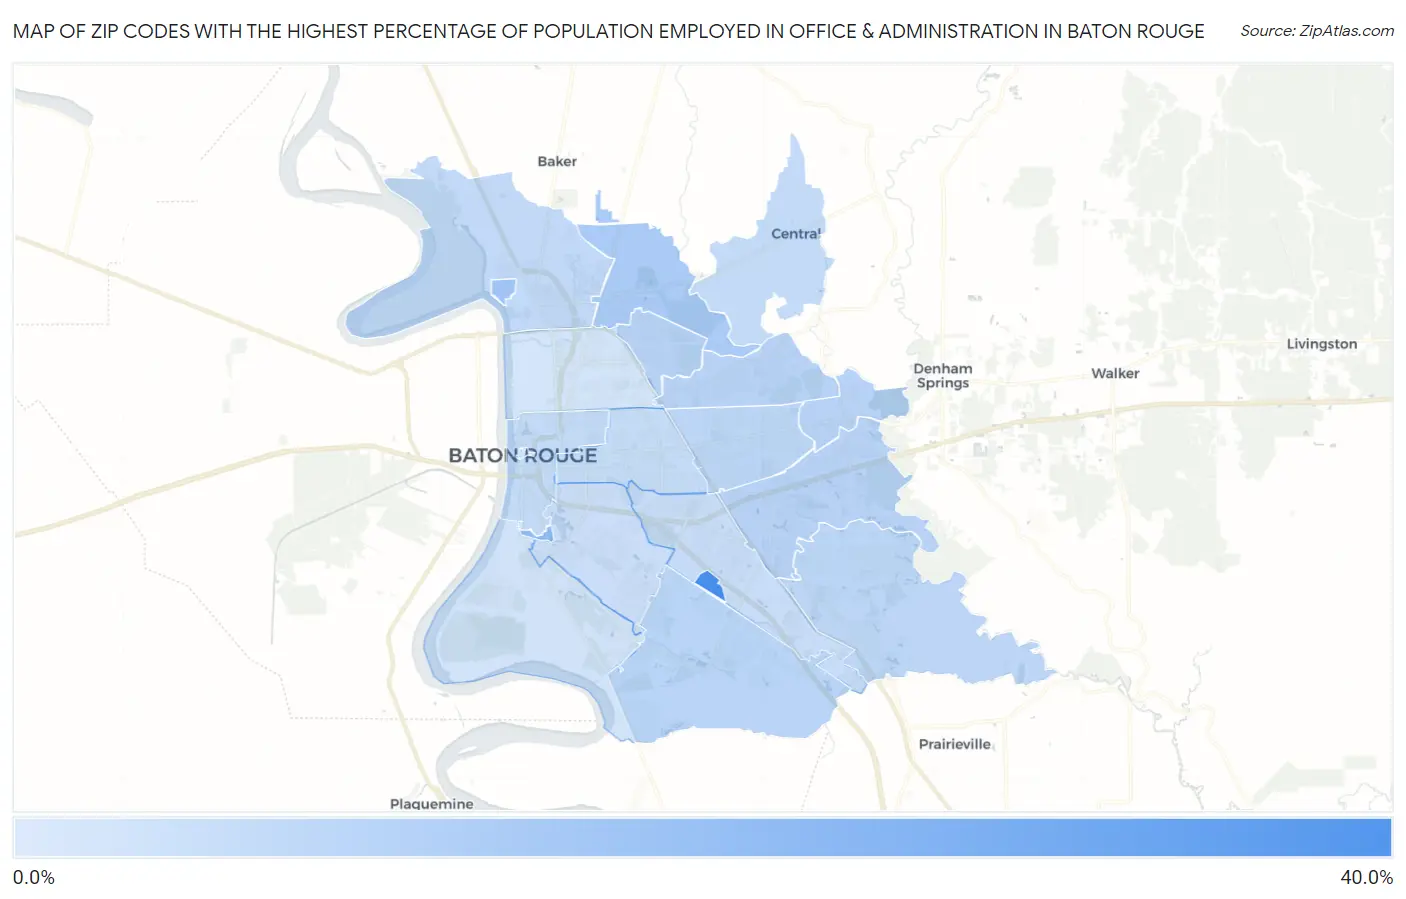
Map of Zip Codes with the Highest Percentage of Population Employed in Office & Administration in Baton Rouge
4.3%
35.5%
Zip Codes with the Highest Percentage of Population Employed in Office & Administration in Baton Rouge, LA
| Zip Code | % Employed | vs State | vs National | |
| 1. | 70836 | 35.5% | 10.6%(+24.9)#14 | 10.9%(+24.6)#367 |
| 2. | 70803 | 18.9% | 10.6%(+8.29)#39 | 10.9%(+8.04)#2,009 |
| 3. | 70813 | 15.6% | 10.6%(+5.00)#78 | 10.9%(+4.74)#3,920 |
| 4. | 70811 | 13.9% | 10.6%(+3.27)#118 | 10.9%(+3.01)#6,247 |
| 5. | 70819 | 11.4% | 10.6%(+0.756)#190 | 10.9%(+0.501)#12,695 |
| 6. | 70816 | 11.3% | 10.6%(+0.747)#191 | 10.9%(+0.492)#12,730 |
| 7. | 70814 | 11.1% | 10.6%(+0.514)#205 | 10.9%(+0.259)#13,459 |
| 8. | 70812 | 11.1% | 10.6%(+0.473)#209 | 10.9%(+0.217)#13,617 |
| 9. | 70810 | 10.6% | 10.6%(+0.037)#230 | 10.9%(-0.218)#15,002 |
| 10. | 70815 | 10.4% | 10.6%(-0.192)#240 | 10.9%(-0.447)#15,794 |
| 11. | 70817 | 10.4% | 10.6%(-0.211)#241 | 10.9%(-0.466)#15,856 |
| 12. | 70807 | 9.3% | 10.6%(-1.26)#294 | 10.9%(-1.51)#19,251 |
| 13. | 70802 | 9.2% | 10.6%(-1.42)#301 | 10.9%(-1.68)#19,723 |
| 14. | 70818 | 9.1% | 10.6%(-1.48)#303 | 10.9%(-1.73)#19,864 |
| 15. | 70806 | 8.7% | 10.6%(-1.87)#321 | 10.9%(-2.13)#21,070 |
| 16. | 70809 | 7.9% | 10.6%(-2.65)#356 | 10.9%(-2.91)#23,135 |
| 17. | 70808 | 7.8% | 10.6%(-2.84)#368 | 10.9%(-3.09)#23,548 |
| 18. | 70820 | 6.6% | 10.6%(-4.05)#395 | 10.9%(-4.30)#26,008 |
| 19. | 70805 | 5.9% | 10.6%(-4.73)#409 | 10.9%(-4.98)#27,039 |
| 20. | 70801 | 4.3% | 10.6%(-6.30)#437 | 10.9%(-6.56)#28,765 |
1
Common Questions
What are the Top 10 Zip Codes with the Highest Percentage of Population Employed in Office & Administration in Baton Rouge, LA?
Top 10 Zip Codes with the Highest Percentage of Population Employed in Office & Administration in Baton Rouge, LA are:
What zip code has the Highest Percentage of Population Employed in Office & Administration in Baton Rouge, LA?
70836 has the Highest Percentage of Population Employed in Office & Administration in Baton Rouge, LA with 35.5%.
What is the Percentage of Population Employed in Office & Administration in Baton Rouge, LA?
Percentage of Population Employed in Office & Administration in Baton Rouge is 9.0%.
What is the Percentage of Population Employed in Office & Administration in Louisiana?
Percentage of Population Employed in Office & Administration in Louisiana is 10.6%.
What is the Percentage of Population Employed in Office & Administration in the United States?
Percentage of Population Employed in Office & Administration in the United States is 10.9%.