Zip Codes with the Highest Percentage of Households with Income Below $10,000 in Denham Springs, LA
RELATED REPORTS & OPTIONS
Household Income | $0-10k
Denham Springs
Compare Zip Codes
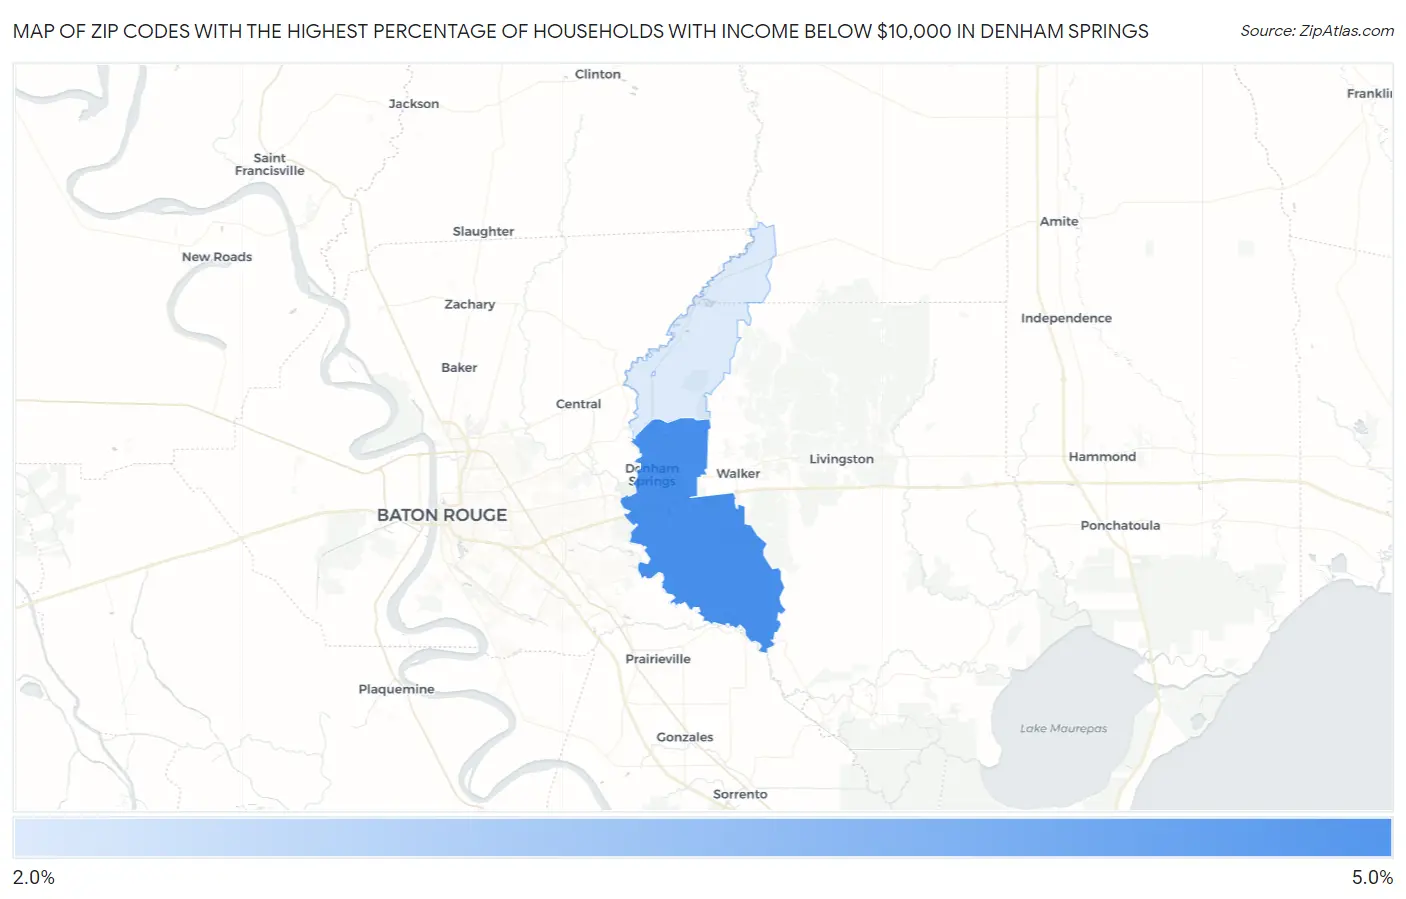
Map of Zip Codes with the Highest Percentage of Households with Income Below $10,000 in Denham Springs
2.9%
4.7%
Zip Codes with the Highest Percentage of Households with Income Below $10,000 in Denham Springs, LA
| Zip Code | Households with Income < $10k | vs State | vs National | |
| 1. | 70726 | 4.7% | 7.4%(-2.70)#322 | 4.9%(-0.200)#12,613 |
| 2. | 70706 | 2.9% | 7.4%(-4.50)#403 | 4.9%(-2.00)#19,874 |
1
Common Questions
What are the Top Zip Codes with the Highest Percentage of Households with Income Below $10,000 in Denham Springs, LA?
Top Zip Codes with the Highest Percentage of Households with Income Below $10,000 in Denham Springs, LA are:
What zip code has the Highest Percentage of Households with Income Below $10,000 in Denham Springs, LA?
70726 has the Highest Percentage of Households with Income Below $10,000 in Denham Springs, LA with 4.7%.
What is the Percentage of Households with Income Below $10,000 in Denham Springs, LA?
Percentage of Households with Income Below $10,000 in Denham Springs is 3.7%.
What is the Percentage of Households with Income Below $10,000 in Louisiana?
Percentage of Households with Income Below $10,000 in Louisiana is 7.4%.
What is the Percentage of Households with Income Below $10,000 in the United States?
Percentage of Households with Income Below $10,000 in the United States is 4.9%.