Zip Codes with the Highest Percentage of Families with Income Above $200,000 in Baton Rouge, LA
RELATED REPORTS & OPTIONS
Family Income | $200k+
Baton Rouge
Compare Zip Codes
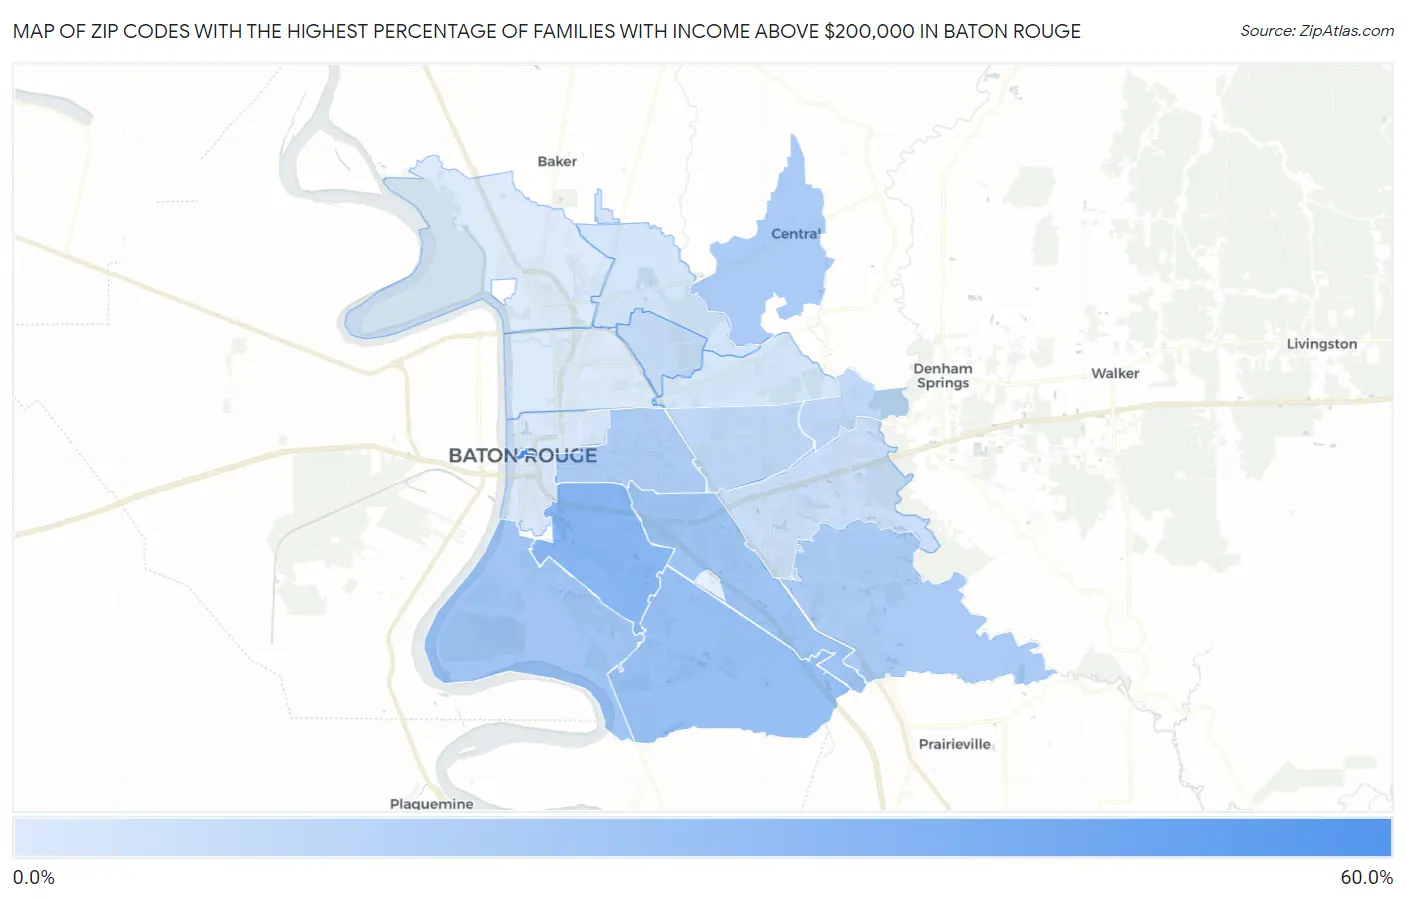
Map of Zip Codes with the Highest Percentage of Families with Income Above $200,000 in Baton Rouge
1.6%
55.6%
Zip Codes with the Highest Percentage of Families with Income Above $200,000 in Baton Rouge, LA
| Zip Code | Families with Income > $200k | vs State | vs National | |
| 1. | 70801 | 55.6% | 9.2%(+46.4)#2 | 14.8%(+40.8)#434 |
| 2. | 70808 | 29.3% | 9.2%(+20.1)#10 | 14.8%(+14.5)#2,619 |
| 3. | 70810 | 24.0% | 9.2%(+14.8)#16 | 14.8%(+9.20)#3,694 |
| 4. | 70809 | 21.2% | 9.2%(+12.0)#24 | 14.8%(+6.40)#4,438 |
| 5. | 70820 | 20.7% | 9.2%(+11.5)#25 | 14.8%(+5.90)#4,605 |
| 6. | 70817 | 17.4% | 9.2%(+8.20)#41 | 14.8%(+2.60)#5,806 |
| 7. | 70818 | 17.2% | 9.2%(+8.00)#46 | 14.8%(+2.40)#5,901 |
| 8. | 70806 | 16.6% | 9.2%(+7.40)#50 | 14.8%(+1.80)#6,165 |
| 9. | 70815 | 10.8% | 9.2%(+1.60)#98 | 14.8%(-4.00)#10,003 |
| 10. | 70819 | 10.6% | 9.2%(+1.40)#102 | 14.8%(-4.20)#10,233 |
| 11. | 70812 | 8.7% | 9.2%(-0.500)#132 | 14.8%(-6.10)#12,291 |
| 12. | 70816 | 6.9% | 9.2%(-2.30)#174 | 14.8%(-7.90)#14,841 |
| 13. | 70811 | 4.0% | 9.2%(-5.20)#278 | 14.8%(-10.8)#20,434 |
| 14. | 70814 | 3.9% | 9.2%(-5.30)#284 | 14.8%(-10.9)#20,659 |
| 15. | 70802 | 2.2% | 9.2%(-7.00)#339 | 14.8%(-12.6)#24,087 |
| 16. | 70807 | 1.8% | 9.2%(-7.40)#360 | 14.8%(-13.0)#24,796 |
| 17. | 70805 | 1.6% | 9.2%(-7.60)#369 | 14.8%(-13.2)#25,160 |
1
Common Questions
What are the Top 10 Zip Codes with the Highest Percentage of Families with Income Above $200,000 in Baton Rouge, LA?
Top 10 Zip Codes with the Highest Percentage of Families with Income Above $200,000 in Baton Rouge, LA are:
What zip code has the Highest Percentage of Families with Income Above $200,000 in Baton Rouge, LA?
70801 has the Highest Percentage of Families with Income Above $200,000 in Baton Rouge, LA with 55.6%.
What is the Percentage of Families with Income Above $200,000 in Baton Rouge, LA?
Percentage of Families with Income Above $200,000 in Baton Rouge is 12.3%.
What is the Percentage of Families with Income Above $200,000 in Louisiana?
Percentage of Families with Income Above $200,000 in Louisiana is 9.2%.
What is the Percentage of Families with Income Above $200,000 in the United States?
Percentage of Families with Income Above $200,000 in the United States is 14.8%.