Zip Codes with the Highest Percentage of Population Employed in Administrative & Support Services in Baton Rouge, LA
RELATED REPORTS & OPTIONS
Administrative & Support Services
Baton Rouge
Compare Zip Codes
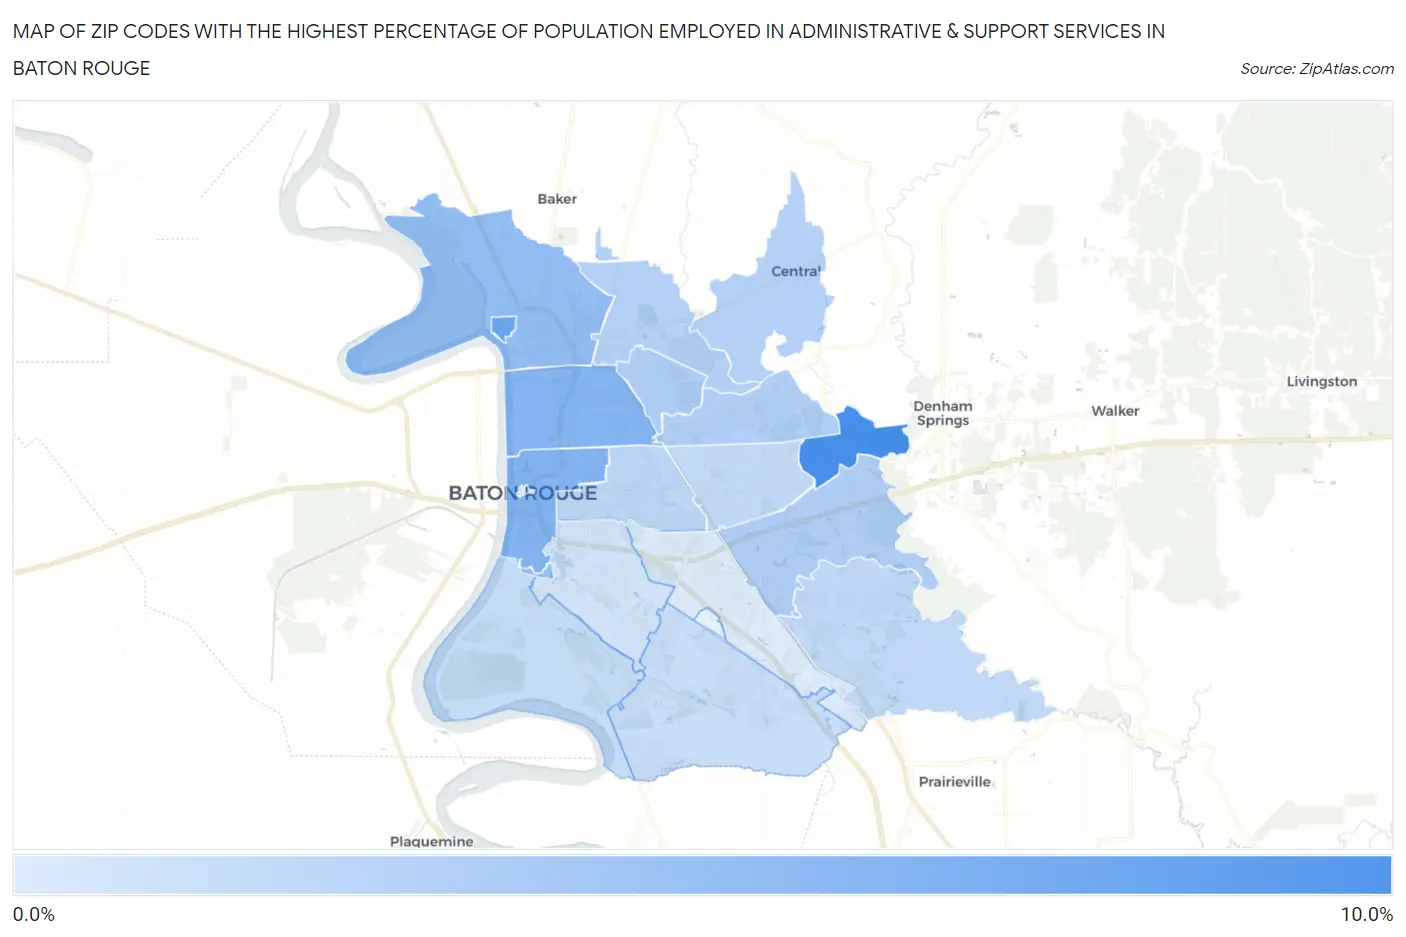
Map of Zip Codes with the Highest Percentage of Population Employed in Administrative & Support Services in Baton Rouge
1.4%
9.8%
Zip Codes with the Highest Percentage of Population Employed in Administrative & Support Services in Baton Rouge, LA
| Zip Code | % Employed | vs State | vs National | |
| 1. | 70819 | 9.8% | 3.8%(+6.06)#38 | 4.1%(+5.68)#1,354 |
| 2. | 70813 | 7.8% | 3.8%(+4.03)#54 | 4.1%(+3.65)#2,417 |
| 3. | 70802 | 6.4% | 3.8%(+2.65)#76 | 4.1%(+2.27)#4,039 |
| 4. | 70805 | 6.3% | 3.8%(+2.50)#80 | 4.1%(+2.12)#4,293 |
| 5. | 70807 | 5.4% | 3.8%(+1.67)#104 | 4.1%(+1.29)#5,988 |
| 6. | 70803 | 5.4% | 3.8%(+1.61)#109 | 4.1%(+1.22)#6,137 |
| 7. | 70816 | 4.0% | 3.8%(+0.194)#188 | 4.1%(-0.188)#10,852 |
| 8. | 70812 | 3.9% | 3.8%(+0.176)#189 | 4.1%(-0.207)#10,918 |
| 9. | 70814 | 3.8% | 3.8%(+0.046)#201 | 4.1%(-0.336)#11,476 |
| 10. | 70811 | 3.7% | 3.8%(-0.066)#212 | 4.1%(-0.449)#11,984 |
| 11. | 70818 | 3.7% | 3.8%(-0.068)#213 | 4.1%(-0.450)#11,992 |
| 12. | 70806 | 3.2% | 3.8%(-0.568)#236 | 4.1%(-0.951)#14,480 |
| 13. | 70817 | 2.9% | 3.8%(-0.820)#254 | 4.1%(-1.20)#15,749 |
| 14. | 70815 | 2.8% | 3.8%(-0.923)#260 | 4.1%(-1.31)#16,298 |
| 15. | 70820 | 2.7% | 3.8%(-1.06)#270 | 4.1%(-1.44)#17,017 |
| 16. | 70810 | 2.6% | 3.8%(-1.14)#281 | 4.1%(-1.52)#17,469 |
| 17. | 70808 | 2.1% | 3.8%(-1.70)#313 | 4.1%(-2.08)#20,290 |
| 18. | 70809 | 1.4% | 3.8%(-2.32)#349 | 4.1%(-2.70)#22,944 |
1
Common Questions
What are the Top 10 Zip Codes with the Highest Percentage of Population Employed in Administrative & Support Services in Baton Rouge, LA?
Top 10 Zip Codes with the Highest Percentage of Population Employed in Administrative & Support Services in Baton Rouge, LA are:
What zip code has the Highest Percentage of Population Employed in Administrative & Support Services in Baton Rouge, LA?
70819 has the Highest Percentage of Population Employed in Administrative & Support Services in Baton Rouge, LA with 9.8%.
What is the Percentage of Population Employed in Administrative & Support Services in Baton Rouge, LA?
Percentage of Population Employed in Administrative & Support Services in Baton Rouge is 3.8%.
What is the Percentage of Population Employed in Administrative & Support Services in Louisiana?
Percentage of Population Employed in Administrative & Support Services in Louisiana is 3.8%.
What is the Percentage of Population Employed in Administrative & Support Services in the United States?
Percentage of Population Employed in Administrative & Support Services in the United States is 4.1%.