Zip Codes with the Highest Percentage of Population Employed in Legal Services & Support in Baton Rouge, LA
RELATED REPORTS & OPTIONS
Legal Services & Support
Baton Rouge
Compare Zip Codes
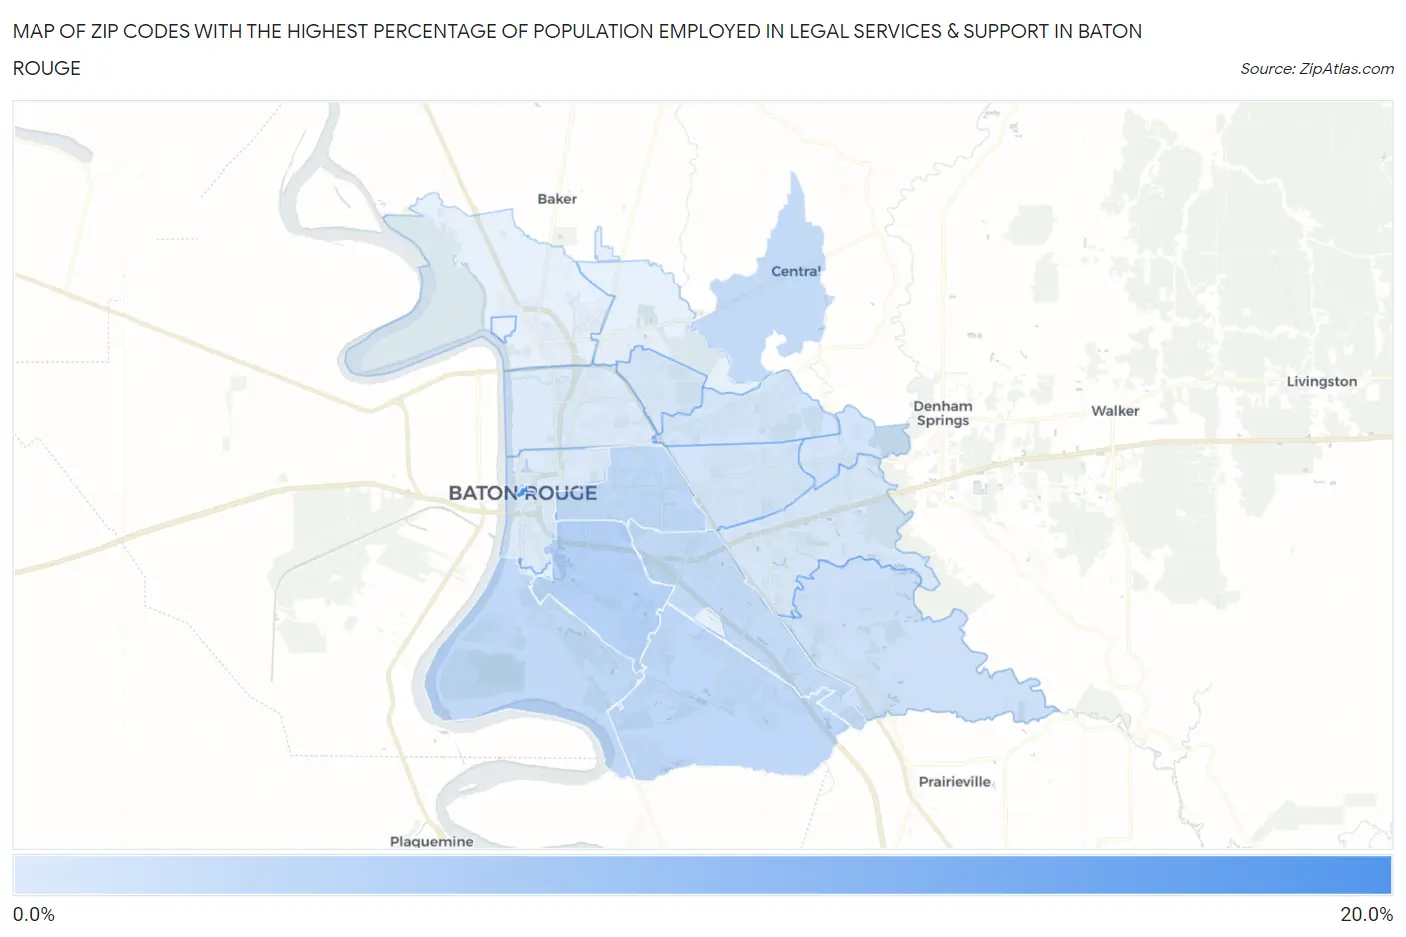
Map of Zip Codes with the Highest Percentage of Population Employed in Legal Services & Support in Baton Rouge
0.29%
16.0%
Zip Codes with the Highest Percentage of Population Employed in Legal Services & Support in Baton Rouge, LA
| Zip Code | % Employed | vs State | vs National | |
| 1. | 70801 | 16.0% | 1.3%(+14.7)#1 | 1.2%(+14.8)#72 |
| 2. | 70808 | 4.1% | 1.3%(+2.80)#15 | 1.2%(+2.95)#1,057 |
| 3. | 70806 | 3.3% | 1.3%(+2.02)#25 | 1.2%(+2.16)#1,536 |
| 4. | 70810 | 3.2% | 1.3%(+1.86)#29 | 1.2%(+2.01)#1,659 |
| 5. | 70820 | 3.1% | 1.3%(+1.81)#32 | 1.2%(+1.95)#1,715 |
| 6. | 70818 | 2.9% | 1.3%(+1.53)#37 | 1.2%(+1.68)#2,011 |
| 7. | 70809 | 2.7% | 1.3%(+1.41)#39 | 1.2%(+1.56)#2,145 |
| 8. | 70817 | 1.6% | 1.3%(+0.317)#86 | 1.2%(+0.464)#4,496 |
| 9. | 70814 | 1.3% | 1.3%(-0.066)#113 | 1.2%(+0.081)#6,131 |
| 10. | 70819 | 1.2% | 1.3%(-0.116)#119 | 1.2%(+0.031)#6,399 |
| 11. | 70815 | 1.1% | 1.3%(-0.219)#129 | 1.2%(-0.072)#7,081 |
| 12. | 70812 | 0.78% | 1.3%(-0.548)#165 | 1.2%(-0.401)#9,620 |
| 13. | 70816 | 0.76% | 1.3%(-0.571)#168 | 1.2%(-0.424)#9,823 |
| 14. | 70805 | 0.30% | 1.3%(-1.03)#236 | 1.2%(-0.885)#15,055 |
| 15. | 70802 | 0.29% | 1.3%(-1.04)#237 | 1.2%(-0.896)#15,174 |
1
Common Questions
What are the Top 10 Zip Codes with the Highest Percentage of Population Employed in Legal Services & Support in Baton Rouge, LA?
Top 10 Zip Codes with the Highest Percentage of Population Employed in Legal Services & Support in Baton Rouge, LA are:
What zip code has the Highest Percentage of Population Employed in Legal Services & Support in Baton Rouge, LA?
70801 has the Highest Percentage of Population Employed in Legal Services & Support in Baton Rouge, LA with 16.0%.
What is the Percentage of Population Employed in Legal Services & Support in Baton Rouge, LA?
Percentage of Population Employed in Legal Services & Support in Baton Rouge is 1.9%.
What is the Percentage of Population Employed in Legal Services & Support in Louisiana?
Percentage of Population Employed in Legal Services & Support in Louisiana is 1.3%.
What is the Percentage of Population Employed in Legal Services & Support in the United States?
Percentage of Population Employed in Legal Services & Support in the United States is 1.2%.