Zip Codes with the Highest Percentage of Population Employed in Life, Physical & Social Science in Baton Rouge, LA
RELATED REPORTS & OPTIONS
Life, Physical & Social Science
Baton Rouge
Compare Zip Codes
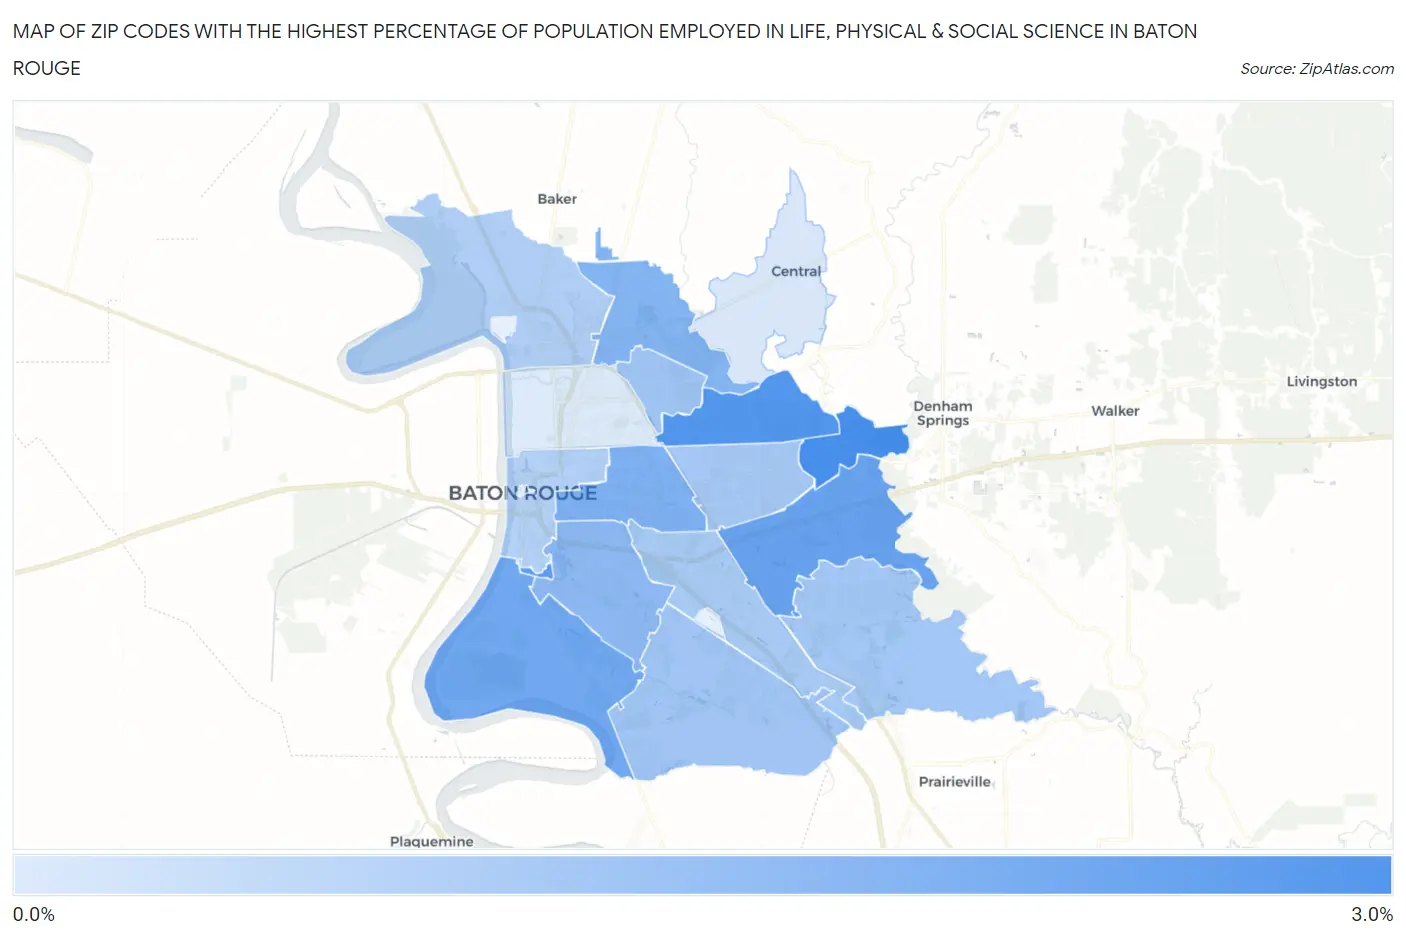
Map of Zip Codes with the Highest Percentage of Population Employed in Life, Physical & Social Science in Baton Rouge
0.25%
2.7%
Zip Codes with the Highest Percentage of Population Employed in Life, Physical & Social Science in Baton Rouge, LA
| Zip Code | % Employed | vs State | vs National | |
| 1. | 70819 | 2.7% | 0.98%(+1.77)#26 | 1.1%(+1.66)#2,179 |
| 2. | 70814 | 2.6% | 0.98%(+1.59)#28 | 1.1%(+1.48)#2,449 |
| 3. | 70803 | 2.4% | 0.98%(+1.37)#32 | 1.1%(+1.26)#2,840 |
| 4. | 70816 | 2.2% | 0.98%(+1.23)#38 | 1.1%(+1.12)#3,155 |
| 5. | 70820 | 2.0% | 0.98%(+1.06)#43 | 1.1%(+0.944)#3,584 |
| 6. | 70806 | 1.8% | 0.98%(+0.826)#53 | 1.1%(+0.713)#4,308 |
| 7. | 70811 | 1.7% | 0.98%(+0.744)#54 | 1.1%(+0.631)#4,624 |
| 8. | 70808 | 1.6% | 0.98%(+0.617)#63 | 1.1%(+0.505)#5,183 |
| 9. | 70812 | 1.2% | 0.98%(+0.252)#97 | 1.1%(+0.140)#7,263 |
| 10. | 70810 | 1.2% | 0.98%(+0.249)#99 | 1.1%(+0.136)#7,291 |
| 11. | 70817 | 1.2% | 0.98%(+0.209)#105 | 1.1%(+0.096)#7,579 |
| 12. | 70815 | 1.2% | 0.98%(+0.195)#106 | 1.1%(+0.083)#7,698 |
| 13. | 70809 | 1.1% | 0.98%(+0.162)#109 | 1.1%(+0.050)#7,930 |
| 14. | 70807 | 1.0% | 0.98%(+0.040)#123 | 1.1%(-0.073)#8,903 |
| 15. | 70802 | 0.95% | 0.98%(-0.030)#129 | 1.1%(-0.143)#9,513 |
| 16. | 70818 | 0.32% | 0.98%(-0.660)#226 | 1.1%(-0.773)#16,838 |
| 17. | 70805 | 0.25% | 0.98%(-0.732)#240 | 1.1%(-0.845)#17,676 |
1
Common Questions
What are the Top 10 Zip Codes with the Highest Percentage of Population Employed in Life, Physical & Social Science in Baton Rouge, LA?
Top 10 Zip Codes with the Highest Percentage of Population Employed in Life, Physical & Social Science in Baton Rouge, LA are:
What zip code has the Highest Percentage of Population Employed in Life, Physical & Social Science in Baton Rouge, LA?
70819 has the Highest Percentage of Population Employed in Life, Physical & Social Science in Baton Rouge, LA with 2.7%.
What is the Percentage of Population Employed in Life, Physical & Social Science in Baton Rouge, LA?
Percentage of Population Employed in Life, Physical & Social Science in Baton Rouge is 1.4%.
What is the Percentage of Population Employed in Life, Physical & Social Science in Louisiana?
Percentage of Population Employed in Life, Physical & Social Science in Louisiana is 0.98%.
What is the Percentage of Population Employed in Life, Physical & Social Science in the United States?
Percentage of Population Employed in Life, Physical & Social Science in the United States is 1.1%.