Zip Codes with the Most Immigrants from Asia in Baton Rouge, LA
RELATED REPORTS & OPTIONS
Asia
Baton Rouge
Compare Zip Codes
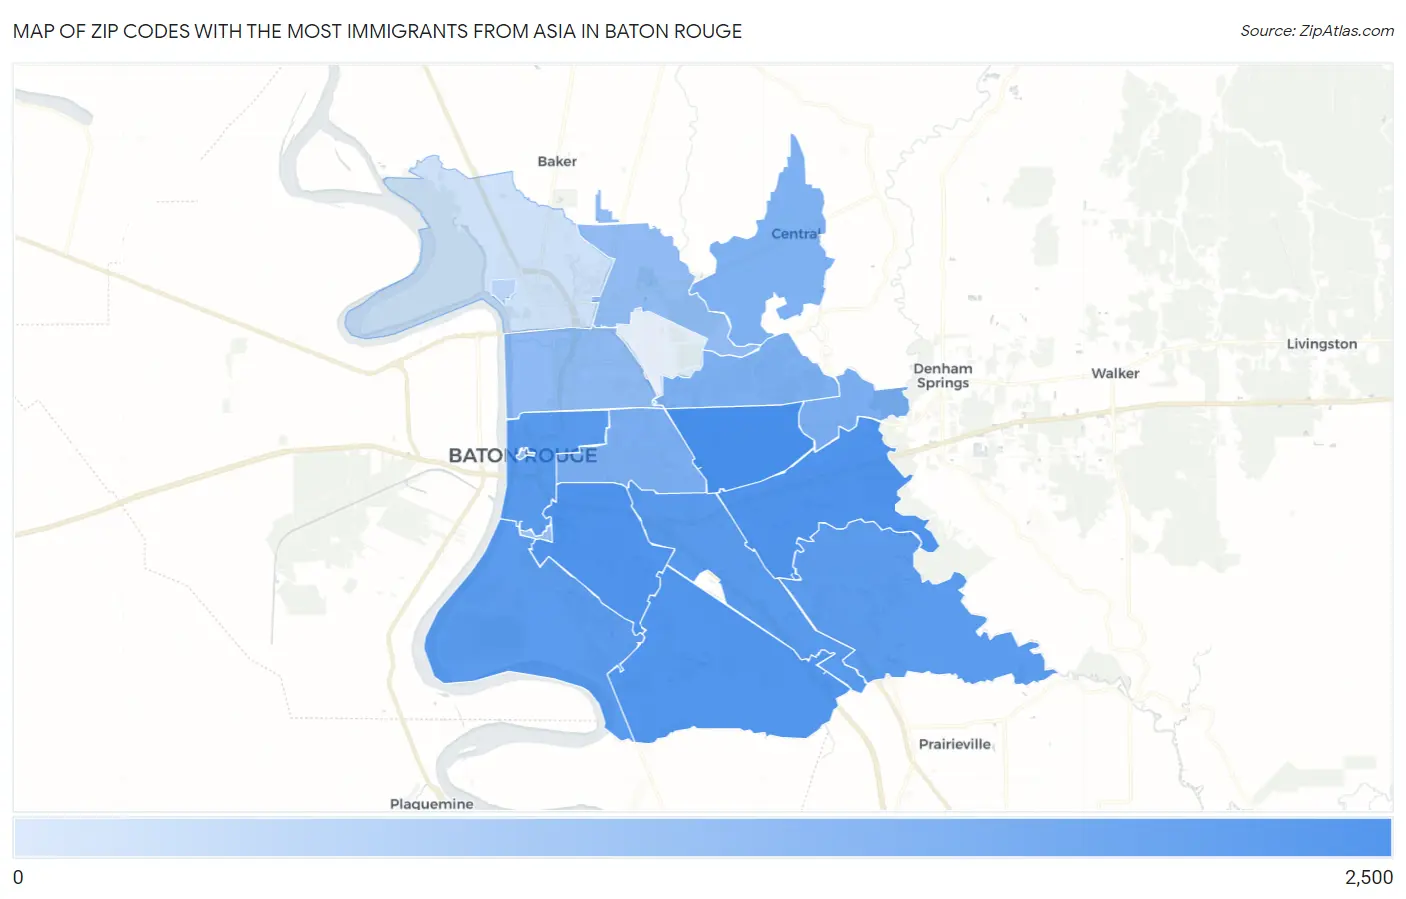
Map of Zip Codes with the Most Immigrants from Asia in Baton Rouge
1
2,390
Zip Codes with the Most Immigrants from Asia in Baton Rouge, LA
| Zip Code | Asia | vs State | vs National | |
| 1. | 70815 | 2,390 | 62,677(3.81%)#2 | 14,105,933(0.02%)#1,518 |
| 2. | 70808 | 1,485 | 62,677(2.37%)#8 | 14,105,933(0.01%)#2,323 |
| 3. | 70816 | 1,467 | 62,677(2.34%)#9 | 14,105,933(0.01%)#2,347 |
| 4. | 70810 | 1,303 | 62,677(2.08%)#12 | 14,105,933(0.01%)#2,600 |
| 5. | 70802 | 1,064 | 62,677(1.70%)#14 | 14,105,933(0.01%)#3,061 |
| 6. | 70809 | 977 | 62,677(1.56%)#17 | 14,105,933(0.01%)#3,277 |
| 7. | 70817 | 935 | 62,677(1.49%)#18 | 14,105,933(0.01%)#3,403 |
| 8. | 70820 | 876 | 62,677(1.40%)#21 | 14,105,933(0.01%)#3,566 |
| 9. | 70806 | 177 | 62,677(0.28%)#80 | 14,105,933(0.00%)#7,754 |
| 10. | 70819 | 172 | 62,677(0.27%)#83 | 14,105,933(0.00%)#7,846 |
| 11. | 70814 | 144 | 62,677(0.23%)#92 | 14,105,933(0.00%)#8,304 |
| 12. | 70818 | 140 | 62,677(0.22%)#95 | 14,105,933(0.00%)#8,371 |
| 13. | 70805 | 57 | 62,677(0.09%)#134 | 14,105,933(0.00%)#10,768 |
| 14. | 70811 | 48 | 62,677(0.08%)#146 | 14,105,933(0.00%)#11,256 |
| 15. | 70803 | 42 | 62,677(0.07%)#154 | 14,105,933(0.00%)#11,639 |
| 16. | 70801 | 38 | 62,677(0.06%)#157 | 14,105,933(0.00%)#11,936 |
| 17. | 70813 | 6 | 62,677(0.01%)#224 | 14,105,933(0.00%)#16,834 |
| 18. | 70807 | 1 | 62,677(0.00%)#251 | 14,105,933(0.00%)#18,820 |
1
Common Questions
What are the Top 10 Zip Codes with the Most Immigrants from Asia in Baton Rouge, LA?
Top 10 Zip Codes with the Most Immigrants from Asia in Baton Rouge, LA are:
What zip code has the Most Immigrants from Asia in Baton Rouge, LA?
70815 has the Most Immigrants from Asia in Baton Rouge, LA with 2,390.
What is the Total Immigrants from Asia in Baton Rouge, LA?
Total Immigrants from Asia in Baton Rouge is 7,428.
What is the Total Immigrants from Asia in Louisiana?
Total Immigrants from Asia in Louisiana is 62,677.
What is the Total Immigrants from Asia in the United States?
Total Immigrants from Asia in the United States is 14,105,933.