Zip Codes with the Highest Percentage of Population Employed in Computer & Mathematics in Baton Rouge, LA
RELATED REPORTS & OPTIONS
Computer & Mathematics
Baton Rouge
Compare Zip Codes
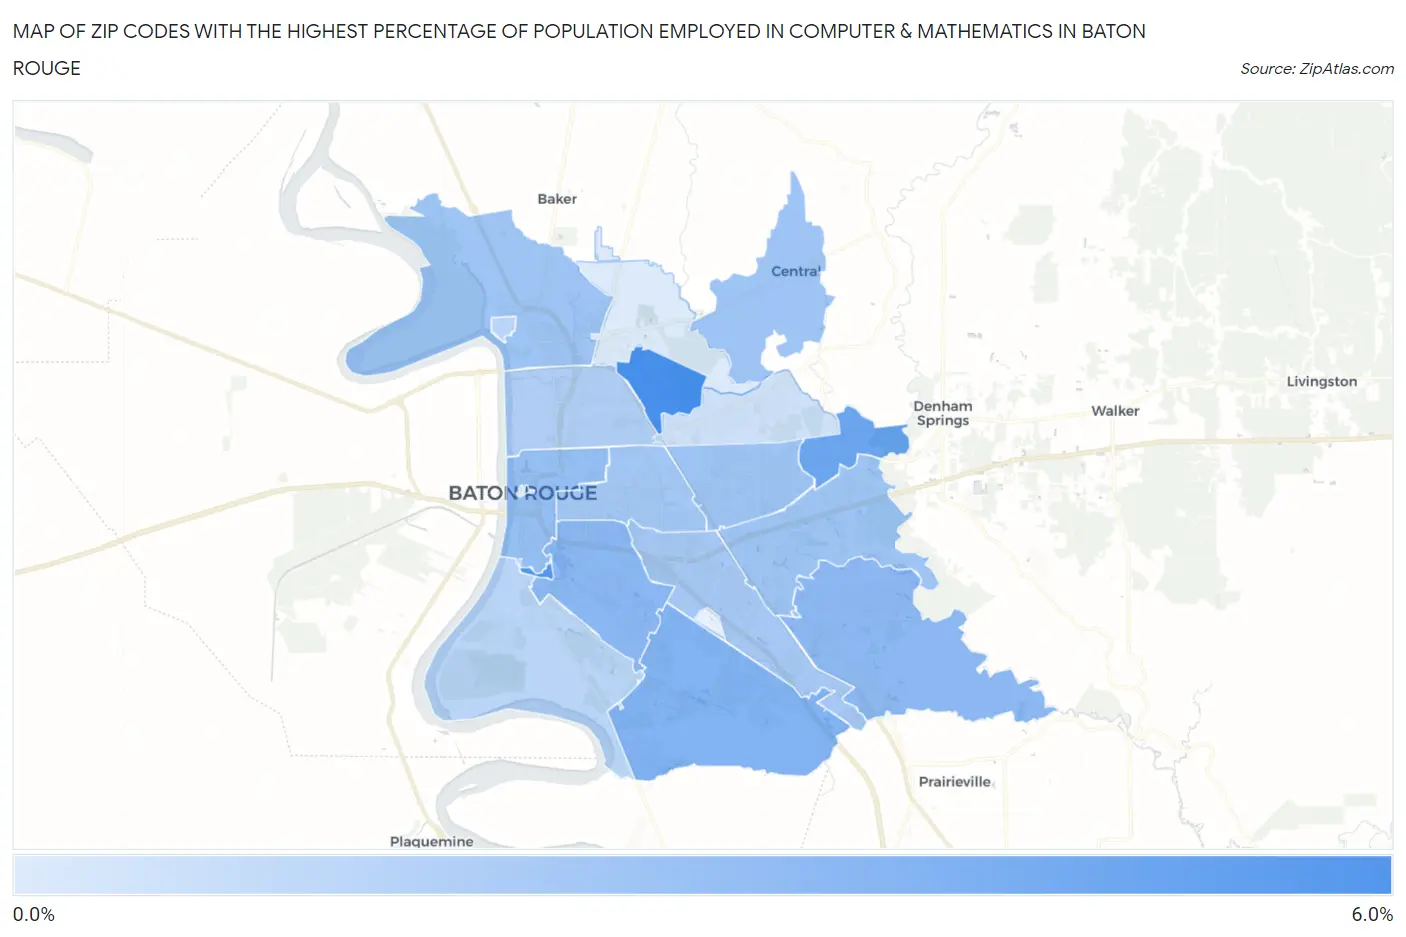
Map of Zip Codes with the Highest Percentage of Population Employed in Computer & Mathematics in Baton Rouge
0.22%
5.5%
Zip Codes with the Highest Percentage of Population Employed in Computer & Mathematics in Baton Rouge, LA
| Zip Code | % Employed | vs State | vs National | |
| 1. | 70812 | 5.5% | 1.7%(+3.79)#12 | 3.5%(+1.96)#2,806 |
| 2. | 70803 | 5.0% | 1.7%(+3.35)#14 | 3.5%(+1.51)#3,321 |
| 3. | 70819 | 4.2% | 1.7%(+2.49)#21 | 3.5%(+0.649)#4,667 |
| 4. | 70810 | 3.5% | 1.7%(+1.76)#29 | 3.5%(-0.074)#6,343 |
| 5. | 70808 | 3.1% | 1.7%(+1.43)#41 | 3.5%(-0.405)#7,354 |
| 6. | 70817 | 3.0% | 1.7%(+1.35)#45 | 3.5%(-0.482)#7,592 |
| 7. | 70802 | 2.7% | 1.7%(+1.04)#57 | 3.5%(-0.802)#8,739 |
| 8. | 70807 | 2.4% | 1.7%(+0.713)#78 | 3.5%(-1.12)#10,037 |
| 9. | 70816 | 2.4% | 1.7%(+0.669)#81 | 3.5%(-1.17)#10,204 |
| 10. | 70815 | 2.3% | 1.7%(+0.653)#82 | 3.5%(-1.18)#10,268 |
| 11. | 70818 | 2.3% | 1.7%(+0.651)#83 | 3.5%(-1.19)#10,277 |
| 12. | 70806 | 2.2% | 1.7%(+0.510)#90 | 3.5%(-1.33)#10,905 |
| 13. | 70809 | 2.2% | 1.7%(+0.480)#94 | 3.5%(-1.36)#11,043 |
| 14. | 70805 | 1.8% | 1.7%(+0.139)#124 | 3.5%(-1.70)#12,643 |
| 15. | 70813 | 1.4% | 1.7%(-0.287)#160 | 3.5%(-2.12)#14,955 |
| 16. | 70820 | 1.4% | 1.7%(-0.297)#164 | 3.5%(-2.13)#15,005 |
| 17. | 70814 | 0.71% | 1.7%(-0.978)#239 | 3.5%(-2.82)#19,192 |
| 18. | 70811 | 0.22% | 1.7%(-1.47)#290 | 3.5%(-3.30)#21,980 |
1
Common Questions
What are the Top 10 Zip Codes with the Highest Percentage of Population Employed in Computer & Mathematics in Baton Rouge, LA?
Top 10 Zip Codes with the Highest Percentage of Population Employed in Computer & Mathematics in Baton Rouge, LA are:
What zip code has the Highest Percentage of Population Employed in Computer & Mathematics in Baton Rouge, LA?
70812 has the Highest Percentage of Population Employed in Computer & Mathematics in Baton Rouge, LA with 5.5%.
What is the Percentage of Population Employed in Computer & Mathematics in Baton Rouge, LA?
Percentage of Population Employed in Computer & Mathematics in Baton Rouge is 2.5%.
What is the Percentage of Population Employed in Computer & Mathematics in Louisiana?
Percentage of Population Employed in Computer & Mathematics in Louisiana is 1.7%.
What is the Percentage of Population Employed in Computer & Mathematics in the United States?
Percentage of Population Employed in Computer & Mathematics in the United States is 3.5%.