Zip Codes with the Highest Percentage of Population Employed in Community & Social Service in Baton Rouge, LA
RELATED REPORTS & OPTIONS
Community & Social Service
Baton Rouge
Compare Zip Codes
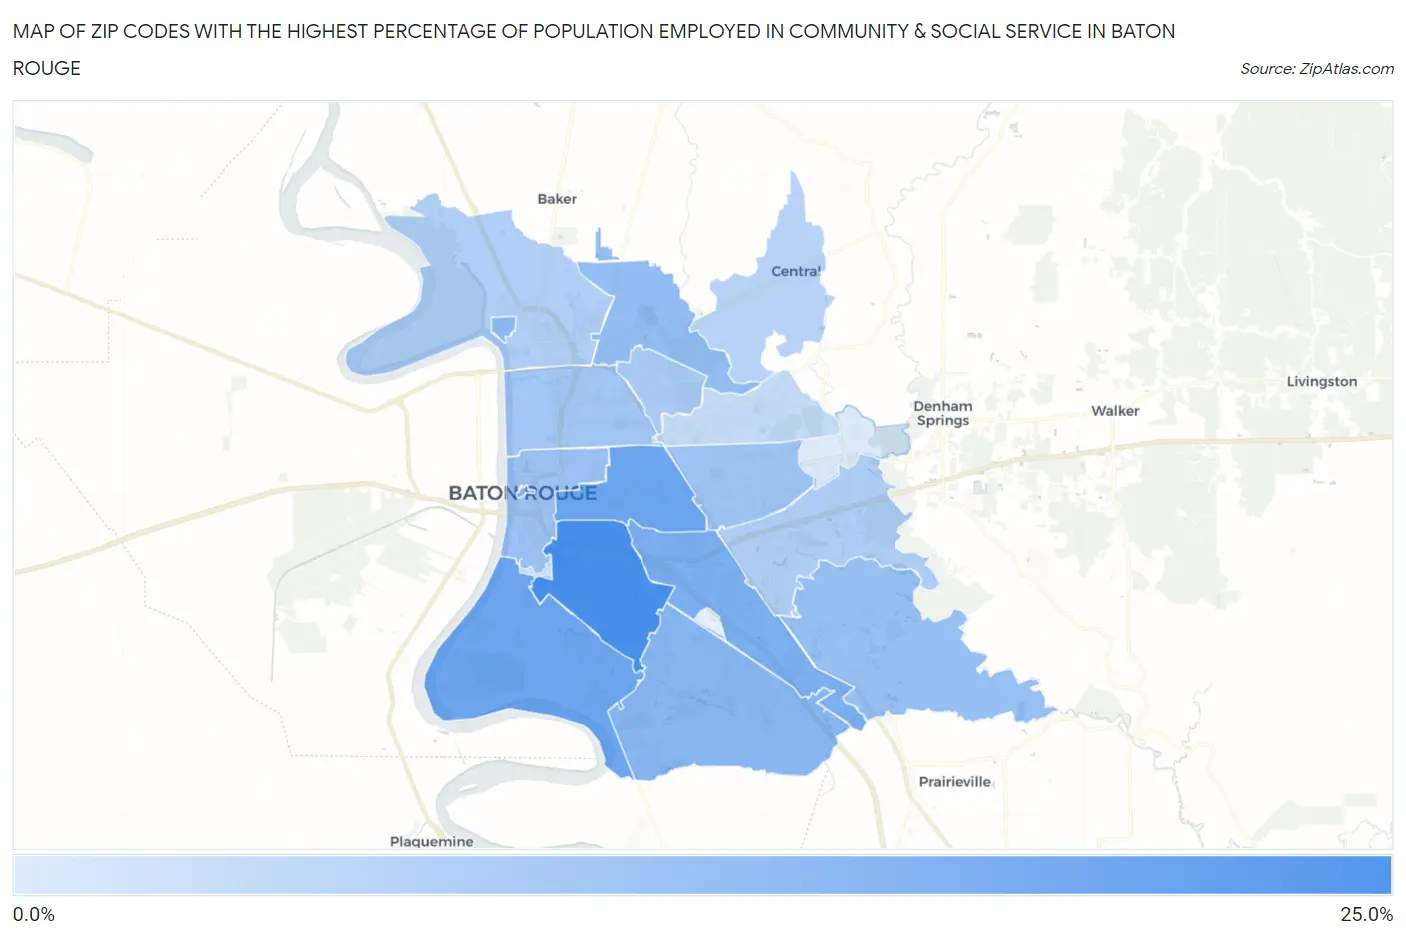
Map of Zip Codes with the Highest Percentage of Population Employed in Community & Social Service in Baton Rouge
4.4%
24.1%
Zip Codes with the Highest Percentage of Population Employed in Community & Social Service in Baton Rouge, LA
| Zip Code | % Employed | vs State | vs National | |
| 1. | 70808 | 24.1% | 11.4%(+12.7)#21 | 11.2%(+12.9)#1,095 |
| 2. | 70806 | 19.1% | 11.4%(+7.66)#37 | 11.2%(+7.86)#2,361 |
| 3. | 70820 | 18.6% | 11.4%(+7.20)#41 | 11.2%(+7.40)#2,547 |
| 4. | 70809 | 16.6% | 11.4%(+5.22)#53 | 11.2%(+5.41)#3,630 |
| 5. | 70801 | 16.0% | 11.4%(+4.60)#60 | 11.2%(+4.80)#4,060 |
| 6. | 70810 | 15.1% | 11.4%(+3.70)#76 | 11.2%(+3.89)#4,861 |
| 7. | 70813 | 14.8% | 11.4%(+3.39)#80 | 11.2%(+3.59)#5,158 |
| 8. | 70811 | 13.6% | 11.4%(+2.15)#104 | 11.2%(+2.34)#6,669 |
| 9. | 70817 | 13.1% | 11.4%(+1.67)#111 | 11.2%(+1.86)#7,431 |
| 10. | 70802 | 12.5% | 11.4%(+1.05)#128 | 11.2%(+1.25)#8,490 |
| 11. | 70815 | 12.1% | 11.4%(+0.738)#134 | 11.2%(+0.935)#9,060 |
| 12. | 70805 | 11.6% | 11.4%(+0.153)#154 | 11.2%(+0.350)#10,316 |
| 13. | 70812 | 10.6% | 11.4%(-0.841)#200 | 11.2%(-0.644)#12,701 |
| 14. | 70816 | 10.1% | 11.4%(-1.29)#216 | 11.2%(-1.09)#13,818 |
| 15. | 70807 | 9.9% | 11.4%(-1.47)#224 | 11.2%(-1.27)#14,266 |
| 16. | 70818 | 8.9% | 11.4%(-2.47)#262 | 11.2%(-2.27)#16,981 |
| 17. | 70814 | 7.6% | 11.4%(-3.86)#314 | 11.2%(-3.66)#20,756 |
| 18. | 70803 | 6.2% | 11.4%(-5.20)#364 | 11.2%(-5.00)#23,923 |
| 19. | 70819 | 4.4% | 11.4%(-6.97)#418 | 11.2%(-6.78)#27,026 |
1
Common Questions
What are the Top 10 Zip Codes with the Highest Percentage of Population Employed in Community & Social Service in Baton Rouge, LA?
Top 10 Zip Codes with the Highest Percentage of Population Employed in Community & Social Service in Baton Rouge, LA are:
What zip code has the Highest Percentage of Population Employed in Community & Social Service in Baton Rouge, LA?
70808 has the Highest Percentage of Population Employed in Community & Social Service in Baton Rouge, LA with 24.1%.
What is the Percentage of Population Employed in Community & Social Service in Baton Rouge, LA?
Percentage of Population Employed in Community & Social Service in Baton Rouge is 15.3%.
What is the Percentage of Population Employed in Community & Social Service in Louisiana?
Percentage of Population Employed in Community & Social Service in Louisiana is 11.4%.
What is the Percentage of Population Employed in Community & Social Service in the United States?
Percentage of Population Employed in Community & Social Service in the United States is 11.2%.