Cities with the Highest Percentage of Black / African American Population in Georgia
RELATED REPORTS & OPTIONS
Black / African American
Georgia
Compare Cities
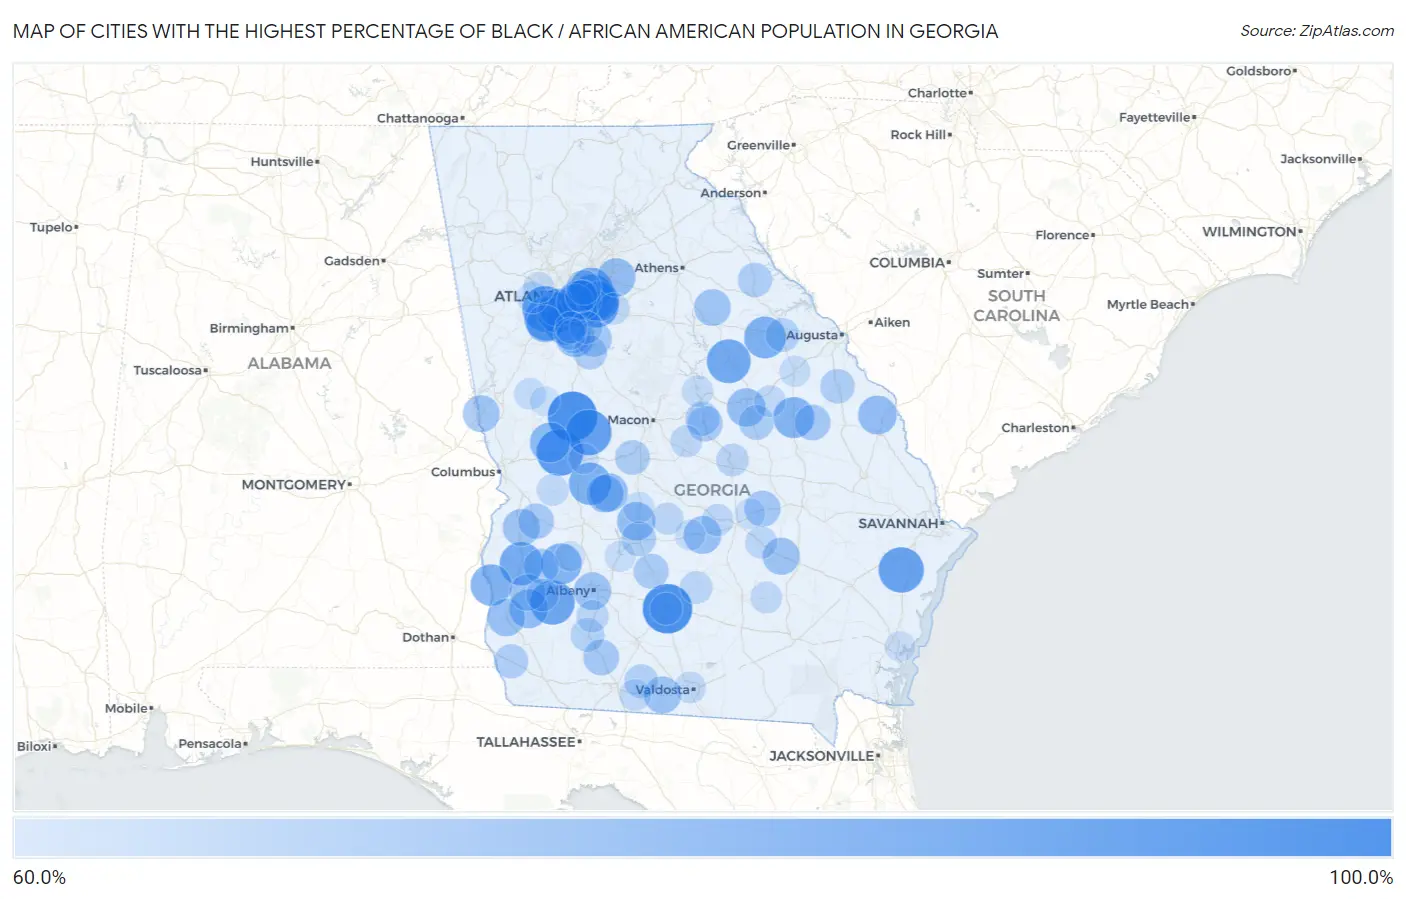
Map of Cities with the Highest Percentage of Black / African American Population in Georgia
0.0%
100.0%
Cities with the Highest Percentage of Black / African American Population in Georgia
| City | Black / African American | vs State | vs National | |
| 1. | Unionville | 100.0% | 31.5%(+68.5)#1 | 12.5%(+87.5)#2 |
| 2. | Lincoln Park | 100.0% | 31.5%(+68.5)#2 | 12.5%(+87.5)#5 |
| 3. | Musella | 100.0% | 31.5%(+68.5)#3 | 12.5%(+87.5)#22 |
| 4. | Gough | 94.8% | 31.5%(+63.3)#4 | 12.5%(+82.3)#116 |
| 5. | Junction City | 94.1% | 31.5%(+62.7)#5 | 12.5%(+81.7)#122 |
| 6. | Panthersville | 92.9% | 31.5%(+61.4)#6 | 12.5%(+80.4)#140 |
| 7. | Redan | 92.5% | 31.5%(+61.0)#7 | 12.5%(+80.0)#148 |
| 8. | Salem | 92.0% | 31.5%(+60.6)#8 | 12.5%(+79.6)#154 |
| 9. | Riceboro | 91.4% | 31.5%(+60.0)#9 | 12.5%(+78.9)#160 |
| 10. | South Fulton | 91.3% | 31.5%(+59.8)#10 | 12.5%(+78.8)#161 |
| 11. | Stonecrest | 90.9% | 31.5%(+59.4)#11 | 12.5%(+78.4)#170 |
| 12. | Leary | 89.5% | 31.5%(+58.1)#12 | 12.5%(+77.1)#194 |
| 13. | Union City | 88.3% | 31.5%(+56.8)#13 | 12.5%(+75.8)#215 |
| 14. | Sparta | 88.2% | 31.5%(+56.8)#14 | 12.5%(+75.7)#218 |
| 15. | Cuthbert | 87.1% | 31.5%(+55.6)#15 | 12.5%(+74.6)#239 |
| 16. | Stone Mountain | 85.4% | 31.5%(+54.0)#16 | 12.5%(+73.0)#272 |
| 17. | Ideal | 85.0% | 31.5%(+53.5)#17 | 12.5%(+72.5)#284 |
| 18. | Riverdale | 84.4% | 31.5%(+53.0)#18 | 12.5%(+71.9)#295 |
| 19. | Camak | 84.1% | 31.5%(+52.6)#19 | 12.5%(+71.6)#300 |
| 20. | Fort Gaines | 83.3% | 31.5%(+51.8)#20 | 12.5%(+70.8)#318 |
| 21. | Wadley | 82.5% | 31.5%(+51.1)#21 | 12.5%(+70.1)#333 |
| 22. | College Park | 82.2% | 31.5%(+50.8)#22 | 12.5%(+69.8)#338 |
| 23. | Dawson | 82.2% | 31.5%(+50.8)#23 | 12.5%(+69.8)#339 |
| 24. | Lithonia | 81.8% | 31.5%(+50.3)#24 | 12.5%(+69.3)#351 |
| 25. | Candler Mcafee | 81.3% | 31.5%(+49.8)#25 | 12.5%(+68.8)#361 |
| 26. | Talbotton | 80.6% | 31.5%(+49.2)#26 | 12.5%(+68.2)#373 |
| 27. | Arlington | 78.1% | 31.5%(+46.6)#27 | 12.5%(+65.6)#433 |
| 28. | Hiltonia | 77.9% | 31.5%(+46.4)#28 | 12.5%(+65.4)#436 |
| 29. | Lovejoy | 77.9% | 31.5%(+46.4)#29 | 12.5%(+65.4)#437 |
| 30. | Grayson | 77.4% | 31.5%(+45.9)#30 | 12.5%(+64.9)#444 |
| 31. | Tennille | 77.3% | 31.5%(+45.8)#31 | 12.5%(+64.8)#448 |
| 32. | Vienna | 77.2% | 31.5%(+45.7)#32 | 12.5%(+64.7)#452 |
| 33. | Montezuma | 77.0% | 31.5%(+45.5)#33 | 12.5%(+64.5)#454 |
| 34. | East Point | 76.4% | 31.5%(+44.9)#34 | 12.5%(+63.9)#463 |
| 35. | Rhine | 76.1% | 31.5%(+44.6)#35 | 12.5%(+63.6)#471 |
| 36. | Blakely | 75.6% | 31.5%(+44.2)#36 | 12.5%(+63.2)#484 |
| 37. | Albany | 75.6% | 31.5%(+44.1)#37 | 12.5%(+63.1)#486 |
| 38. | Oglethorpe | 75.5% | 31.5%(+44.0)#38 | 12.5%(+63.0)#488 |
| 39. | Fairburn | 75.3% | 31.5%(+43.8)#39 | 12.5%(+62.8)#492 |
| 40. | Gresham Park | 74.7% | 31.5%(+43.3)#40 | 12.5%(+62.3)#504 |
| 41. | Quitman | 74.6% | 31.5%(+43.2)#41 | 12.5%(+62.1)#510 |
| 42. | Graham | 74.6% | 31.5%(+43.1)#42 | 12.5%(+62.1)#512 |
| 43. | Lumpkin | 74.4% | 31.5%(+42.9)#43 | 12.5%(+61.9)#518 |
| 44. | West Point | 74.1% | 31.5%(+42.6)#44 | 12.5%(+61.6)#522 |
| 45. | Woodville | 73.9% | 31.5%(+42.5)#45 | 12.5%(+61.5)#523 |
| 46. | Edison | 73.3% | 31.5%(+41.8)#46 | 12.5%(+60.8)#546 |
| 47. | Glenwood | 72.7% | 31.5%(+41.2)#47 | 12.5%(+60.2)#557 |
| 48. | Mcdonough | 72.5% | 31.5%(+41.1)#48 | 12.5%(+60.1)#560 |
| 49. | Eulonia | 72.5% | 31.5%(+41.0)#49 | 12.5%(+60.0)#561 |
| 50. | Meigs | 72.2% | 31.5%(+40.7)#50 | 12.5%(+59.7)#565 |
| 51. | Midville | 71.9% | 31.5%(+40.4)#51 | 12.5%(+59.4)#572 |
| 52. | Richland | 71.6% | 31.5%(+40.1)#52 | 12.5%(+59.1)#583 |
| 53. | Irwinton | 71.3% | 31.5%(+39.9)#53 | 12.5%(+58.9)#588 |
| 54. | Shellman | 70.8% | 31.5%(+39.3)#54 | 12.5%(+58.3)#600 |
| 55. | Ashburn | 70.5% | 31.5%(+39.0)#55 | 12.5%(+58.0)#609 |
| 56. | Fort Valley | 70.2% | 31.5%(+38.7)#56 | 12.5%(+57.7)#615 |
| 57. | Harrison | 70.1% | 31.5%(+38.7)#57 | 12.5%(+57.7)#618 |
| 58. | Clarkston | 69.9% | 31.5%(+38.4)#58 | 12.5%(+57.4)#623 |
| 59. | Cordele | 69.7% | 31.5%(+38.3)#59 | 12.5%(+57.3)#625 |
| 60. | Bonanza | 69.4% | 31.5%(+37.9)#60 | 12.5%(+56.9)#634 |
| 61. | Waynesboro | 69.4% | 31.5%(+37.9)#61 | 12.5%(+56.9)#635 |
| 62. | Tignall | 69.3% | 31.5%(+37.8)#62 | 12.5%(+56.8)#636 |
| 63. | Mcintyre | 69.1% | 31.5%(+37.6)#63 | 12.5%(+56.6)#643 |
| 64. | Donalsonville | 68.8% | 31.5%(+37.4)#64 | 12.5%(+56.4)#649 |
| 65. | Heron Bay | 68.7% | 31.5%(+37.2)#65 | 12.5%(+56.2)#652 |
| 66. | Barwick | 68.4% | 31.5%(+36.9)#66 | 12.5%(+55.9)#661 |
| 67. | Thomson | 68.3% | 31.5%(+36.8)#67 | 12.5%(+55.8)#664 |
| 68. | Camilla | 68.1% | 31.5%(+36.6)#68 | 12.5%(+55.6)#669 |
| 69. | Dublin | 66.1% | 31.5%(+34.6)#69 | 12.5%(+53.6)#707 |
| 70. | Stockbridge | 66.0% | 31.5%(+34.5)#70 | 12.5%(+53.5)#710 |
| 71. | Ocilla | 65.8% | 31.5%(+34.4)#71 | 12.5%(+53.3)#712 |
| 72. | Morgan | 65.6% | 31.5%(+34.1)#72 | 12.5%(+53.1)#714 |
| 73. | Baconton | 65.5% | 31.5%(+34.0)#73 | 12.5%(+53.0)#722 |
| 74. | Phillipsburg | 65.1% | 31.5%(+33.6)#74 | 12.5%(+52.6)#736 |
| 75. | Lumber City | 65.0% | 31.5%(+33.6)#75 | 12.5%(+52.6)#741 |
| 76. | Irondale | 65.0% | 31.5%(+33.6)#76 | 12.5%(+52.6)#742 |
| 77. | Chauncey | 64.8% | 31.5%(+33.3)#77 | 12.5%(+52.3)#748 |
| 78. | Pineview | 64.7% | 31.5%(+33.2)#78 | 12.5%(+52.2)#749 |
| 79. | Jonesboro | 64.6% | 31.5%(+33.2)#79 | 12.5%(+52.2)#752 |
| 80. | Jeffersonville | 64.6% | 31.5%(+33.1)#80 | 12.5%(+52.1)#754 |
| 81. | Buena Vista | 64.3% | 31.5%(+32.8)#81 | 12.5%(+51.8)#761 |
| 82. | Belvedere Park | 64.2% | 31.5%(+32.7)#82 | 12.5%(+51.7)#763 |
| 83. | Boston | 64.2% | 31.5%(+32.7)#83 | 12.5%(+51.7)#764 |
| 84. | Conyers | 64.0% | 31.5%(+32.6)#84 | 12.5%(+51.5)#769 |
| 85. | Nicholls | 63.9% | 31.5%(+32.5)#85 | 12.5%(+51.5)#772 |
| 86. | Davisboro | 63.9% | 31.5%(+32.5)#86 | 12.5%(+51.5)#773 |
| 87. | Remerton | 63.9% | 31.5%(+32.5)#87 | 12.5%(+51.4)#775 |
| 88. | Douglasville | 63.8% | 31.5%(+32.3)#88 | 12.5%(+51.3)#782 |
| 89. | Hardwick | 63.7% | 31.5%(+32.2)#89 | 12.5%(+51.2)#785 |
| 90. | Greenville | 63.7% | 31.5%(+32.2)#90 | 12.5%(+51.2)#786 |
| 91. | Pinehurst | 63.2% | 31.5%(+31.7)#91 | 12.5%(+50.7)#798 |
| 92. | Austell | 62.9% | 31.5%(+31.5)#92 | 12.5%(+50.5)#805 |
| 93. | Wrens | 62.8% | 31.5%(+31.4)#93 | 12.5%(+50.4)#807 |
| 94. | Warwick | 62.6% | 31.5%(+31.1)#94 | 12.5%(+50.1)#815 |
| 95. | Abbeville | 62.5% | 31.5%(+31.0)#95 | 12.5%(+50.0)#817 |
| 96. | Alamo | 62.1% | 31.5%(+30.6)#96 | 12.5%(+49.6)#833 |
| 97. | Butler | 61.9% | 31.5%(+30.4)#97 | 12.5%(+49.4)#839 |
| 98. | Brunswick | 61.5% | 31.5%(+30.0)#98 | 12.5%(+49.0)#848 |
| 99. | Woodbury | 61.0% | 31.5%(+29.5)#99 | 12.5%(+48.5)#863 |
| 100. | Bronwood | 61.0% | 31.5%(+29.5)#100 | 12.5%(+48.5)#864 |
Common Questions
What are the Top 10 Cities with the Highest Percentage of Black / African American Population in Georgia?
Top 10 Cities with the Highest Percentage of Black / African American Population in Georgia are:
#1
100.0%
#2
100.0%
#3
94.1%
#4
92.9%
#5
92.5%
#6
92.0%
#7
91.4%
#8
91.3%
#9
90.9%
#10
89.5%
What city has the Highest Percentage of Black / African American Population in Georgia?
Unionville has the Highest Percentage of Black / African American Population in Georgia with 100.0%.
What is the Percentage of Black / African American Population in the State of Georgia?
Percentage of Black / African American Population in Georgia is 31.5%.
What is the Percentage of Black / African American Population in the United States?
Percentage of Black / African American Population in the United States is 12.5%.