Junction City, GA Map & Demographics
Junction City Map
Junction City Overview
$19,483
PER CAPITA INCOME
$45,000
AVG HOUSEHOLD INCOME
0.36
INEQUALITY / GINI INDEX
409
TOTAL POPULATION
220
MALE POPULATION
189
FEMALE POPULATION
116.40
MALES / 100 FEMALES
85.91
FEMALES / 100 MALES
44.5
MEDIAN AGE
4.0
AVG FAMILY SIZE
3.5
AVG HOUSEHOLD SIZE
149
LABOR FORCE [ PEOPLE ]
44.0%
PERCENT IN LABOR FORCE
6.0%
UNEMPLOYMENT RATE
Junction City Zip Codes
Junction City Area Codes
Income in Junction City
Income Overview in Junction City
| Characteristic | Number | Measure |
| Per Capita Income | 409 | $19,483 |
| Median Family Income | 95 | $0 |
| Mean Family Income | 95 | $68,693 |
| Median Household Income | 116 | $45,000 |
| Mean Household Income | 116 | $60,630 |
| Income Deficit | 95 | $0 |
| Wage / Income Gap (%) | 409 | 0.00% |
| Wage / Income Gap ($) | 409 | 100.00¢ per $1 |
| Gini / Inequality Index | 409 | 0.36 |
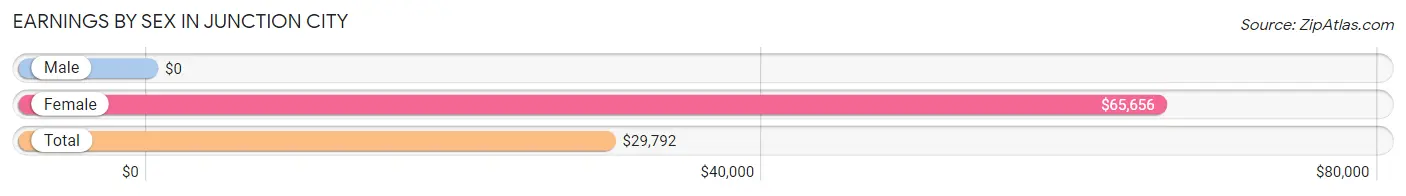
Earnings by Sex in Junction City
| Sex | Number | Average Earnings |
| Male | 116 (66.3%) | $0 |
| Female | 59 (33.7%) | $65,656 |
| Total | 175 (100.0%) | $29,792 |
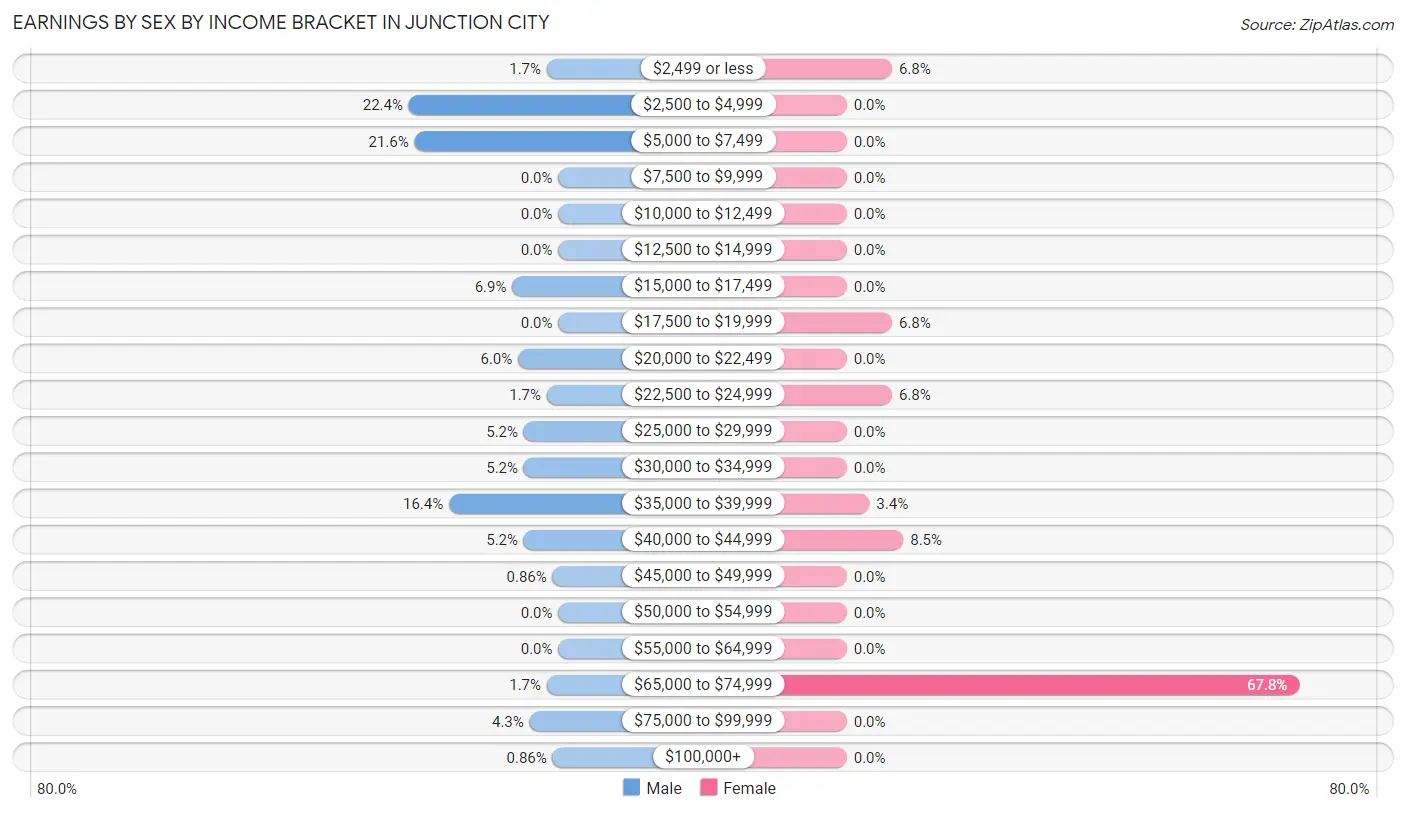
Earnings by Sex by Income Bracket in Junction City
The most common earnings brackets in Junction City are $2,500 to $4,999 for men (26 | 22.4%) and $65,000 to $74,999 for women (40 | 67.8%).
| Income | Male | Female |
| $2,499 or less | 2 (1.7%) | 4 (6.8%) |
| $2,500 to $4,999 | 26 (22.4%) | 0 (0.0%) |
| $5,000 to $7,499 | 25 (21.5%) | 0 (0.0%) |
| $7,500 to $9,999 | 0 (0.0%) | 0 (0.0%) |
| $10,000 to $12,499 | 0 (0.0%) | 0 (0.0%) |
| $12,500 to $14,999 | 0 (0.0%) | 0 (0.0%) |
| $15,000 to $17,499 | 8 (6.9%) | 0 (0.0%) |
| $17,500 to $19,999 | 0 (0.0%) | 4 (6.8%) |
| $20,000 to $22,499 | 7 (6.0%) | 0 (0.0%) |
| $22,500 to $24,999 | 2 (1.7%) | 4 (6.8%) |
| $25,000 to $29,999 | 6 (5.2%) | 0 (0.0%) |
| $30,000 to $34,999 | 6 (5.2%) | 0 (0.0%) |
| $35,000 to $39,999 | 19 (16.4%) | 2 (3.4%) |
| $40,000 to $44,999 | 6 (5.2%) | 5 (8.5%) |
| $45,000 to $49,999 | 1 (0.9%) | 0 (0.0%) |
| $50,000 to $54,999 | 0 (0.0%) | 0 (0.0%) |
| $55,000 to $64,999 | 0 (0.0%) | 0 (0.0%) |
| $65,000 to $74,999 | 2 (1.7%) | 40 (67.8%) |
| $75,000 to $99,999 | 5 (4.3%) | 0 (0.0%) |
| $100,000+ | 1 (0.9%) | 0 (0.0%) |
| Total | 116 (100.0%) | 59 (100.0%) |
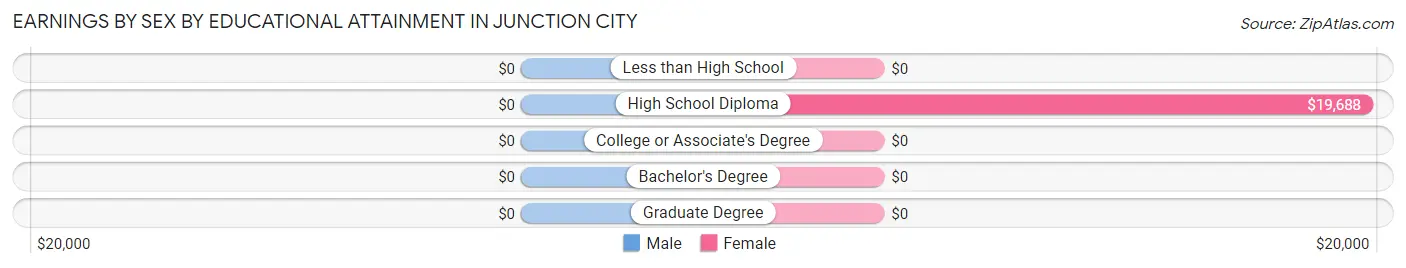
Earnings by Sex by Educational Attainment in Junction City
| Educational Attainment | Male Income | Female Income |
| Less than High School | - | - |
| High School Diploma | - | - |
| College or Associate's Degree | - | - |
| Bachelor's Degree | - | - |
| Graduate Degree | - | - |
| Total | - | - |
Family Income in Junction City
Family Income Brackets in Junction City
According to the Junction City family income data, there are 37 families falling into the $100,000 to $149,999 income range, which is the most common income bracket and makes up 39.0% of all families.
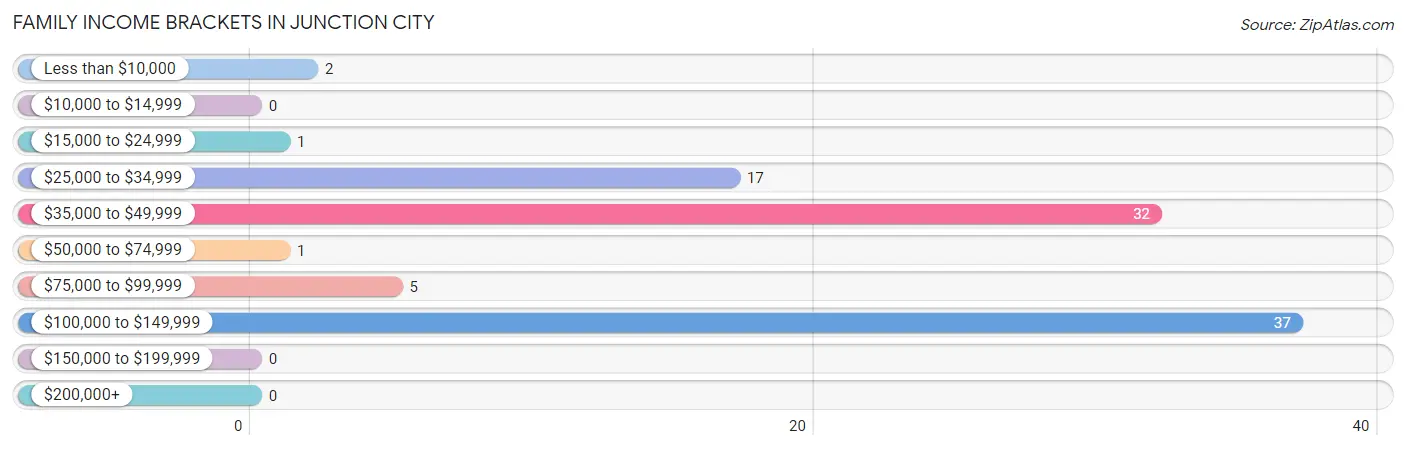
| Income Bracket | # Families | % Families |
| Less than $10,000 | 2 | 2.1% |
| $10,000 to $14,999 | 0 | 0.0% |
| $15,000 to $24,999 | 1 | 1.1% |
| $25,000 to $34,999 | 17 | 17.9% |
| $35,000 to $49,999 | 32 | 33.7% |
| $50,000 to $74,999 | 1 | 1.1% |
| $75,000 to $99,999 | 5 | 5.3% |
| $100,000 to $149,999 | 37 | 38.9% |
| $150,000 to $199,999 | 0 | 0.0% |
| $200,000+ | 0 | 0.0% |
Family Income by Famaliy Size in Junction City
6-person families (28 | 29.5%) account for the highest median family income in Junction City with $113,654 per family, while 2-person families (37 | 39.0%) have the highest median income of $21,042 per family member.
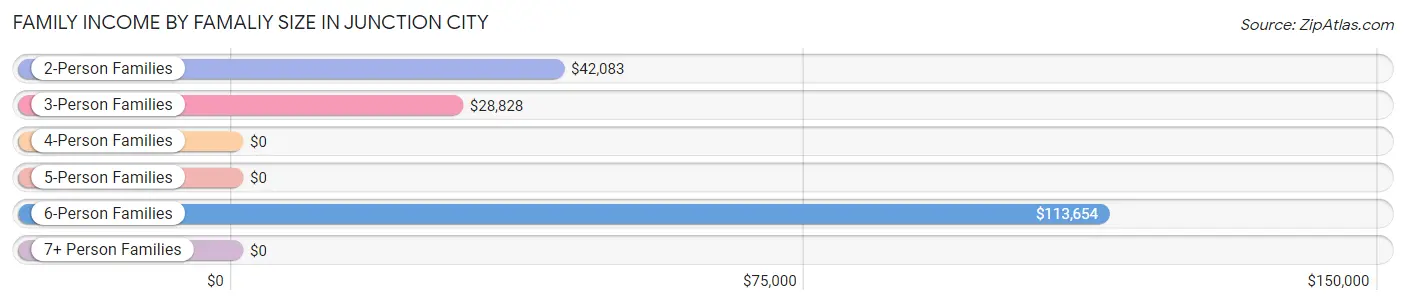
| Income Bracket | # Families | Median Income |
| 2-Person Families | 37 (39.0%) | $42,083 |
| 3-Person Families | 21 (22.1%) | $28,828 |
| 4-Person Families | 6 (6.3%) | $0 |
| 5-Person Families | 3 (3.2%) | $0 |
| 6-Person Families | 28 (29.5%) | $113,654 |
| 7+ Person Families | 0 (0.0%) | $0 |
| Total | 95 (100.0%) | $0 |
Family Income by Number of Earners in Junction City
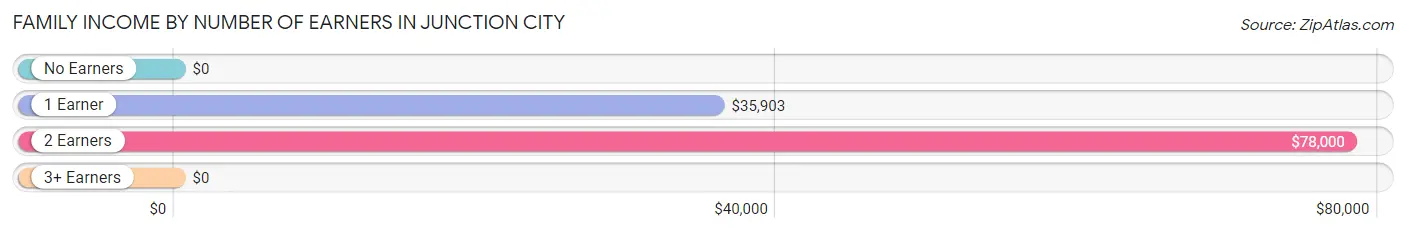
| Number of Earners | # Families | Median Income |
| No Earners | 3 (3.2%) | $0 |
| 1 Earner | 49 (51.6%) | $35,903 |
| 2 Earners | 14 (14.7%) | $78,000 |
| 3+ Earners | 29 (30.5%) | $0 |
| Total | 95 (100.0%) | $0 |
Household Income in Junction City
Household Income Brackets in Junction City
With 37 households falling in the category, the $100,000 to $149,999 income range is the most frequent in Junction City, accounting for 31.9% of all households.
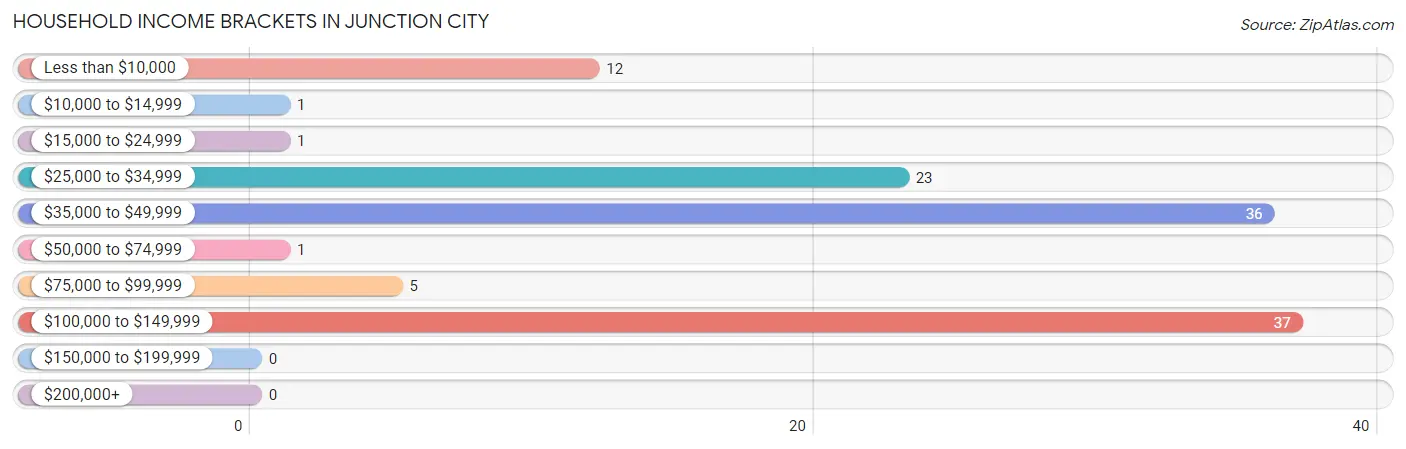
| Income Bracket | # Households | % Households |
| Less than $10,000 | 12 | 10.3% |
| $10,000 to $14,999 | 1 | 0.9% |
| $15,000 to $24,999 | 1 | 0.9% |
| $25,000 to $34,999 | 23 | 19.8% |
| $35,000 to $49,999 | 36 | 31.0% |
| $50,000 to $74,999 | 1 | 0.9% |
| $75,000 to $99,999 | 5 | 4.3% |
| $100,000 to $149,999 | 37 | 31.9% |
| $150,000 to $199,999 | 0 | 0.0% |
| $200,000+ | 0 | 0.0% |
Household Income by Householder Age in Junction City
The median household income in Junction City is $45,000, with the highest median household income of $29,844 found in the 45 to 64 years age bracket for the primary householder. A total of 56 households (48.3%) fall into this category. Meanwhile, the 15 to 24 years age bracket for the primary householder has the lowest median household income of $0, with 6 households (5.2%) in this group.
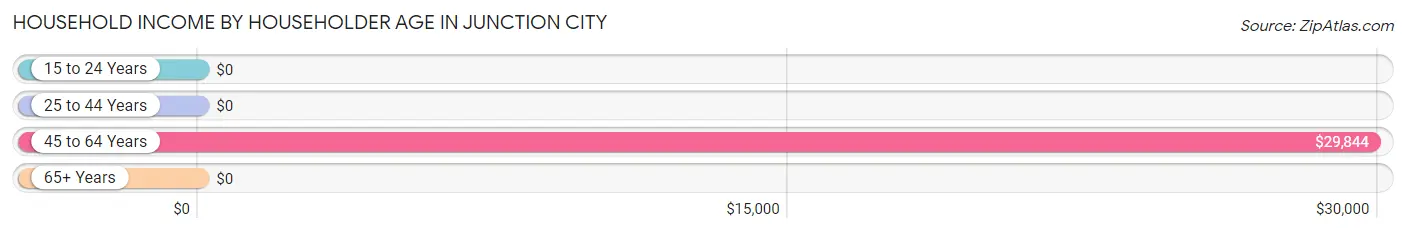
| Income Bracket | # Households | Median Income |
| 15 to 24 Years | 6 (5.2%) | $0 |
| 25 to 44 Years | 9 (7.8%) | $0 |
| 45 to 64 Years | 56 (48.3%) | $29,844 |
| 65+ Years | 45 (38.8%) | $0 |
| Total | 116 (100.0%) | $45,000 |
Poverty in Junction City
Income Below Poverty by Sex and Age in Junction City
With 8.2% poverty level for males and 11.1% for females among the residents of Junction City, 6 to 11 year old males and 16 and 17 year old females are the most vulnerable to poverty, with 2 males (100.0%) and 3 females (100.0%) in their respective age groups living below the poverty level.
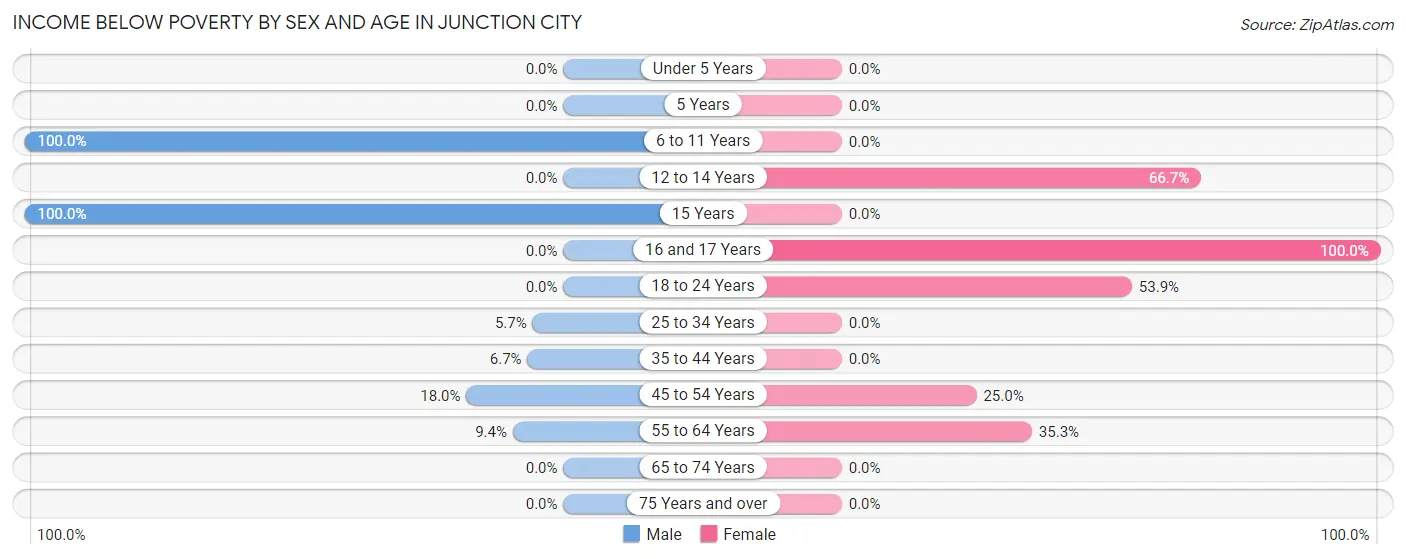
| Age Bracket | Male | Female |
| Under 5 Years | 0 (0.0%) | 0 (0.0%) |
| 5 Years | 0 (0.0%) | 0 (0.0%) |
| 6 to 11 Years | 2 (100.0%) | 0 (0.0%) |
| 12 to 14 Years | 0 (0.0%) | 2 (66.7%) |
| 15 Years | 1 (100.0%) | 0 (0.0%) |
| 16 and 17 Years | 0 (0.0%) | 3 (100.0%) |
| 18 to 24 Years | 0 (0.0%) | 7 (53.8%) |
| 25 to 34 Years | 2 (5.7%) | 0 (0.0%) |
| 35 to 44 Years | 1 (6.7%) | 0 (0.0%) |
| 45 to 54 Years | 9 (18.0%) | 3 (25.0%) |
| 55 to 64 Years | 3 (9.4%) | 6 (35.3%) |
| 65 to 74 Years | 0 (0.0%) | 0 (0.0%) |
| 75 Years and over | 0 (0.0%) | 0 (0.0%) |
| Total | 18 (8.2%) | 21 (11.1%) |
Income Above Poverty by Sex and Age in Junction City
According to the poverty statistics in Junction City, males aged under 5 years and females aged 6 to 11 years are the age groups that are most secure financially, with 100.0% of males and 100.0% of females in these age groups living above the poverty line.
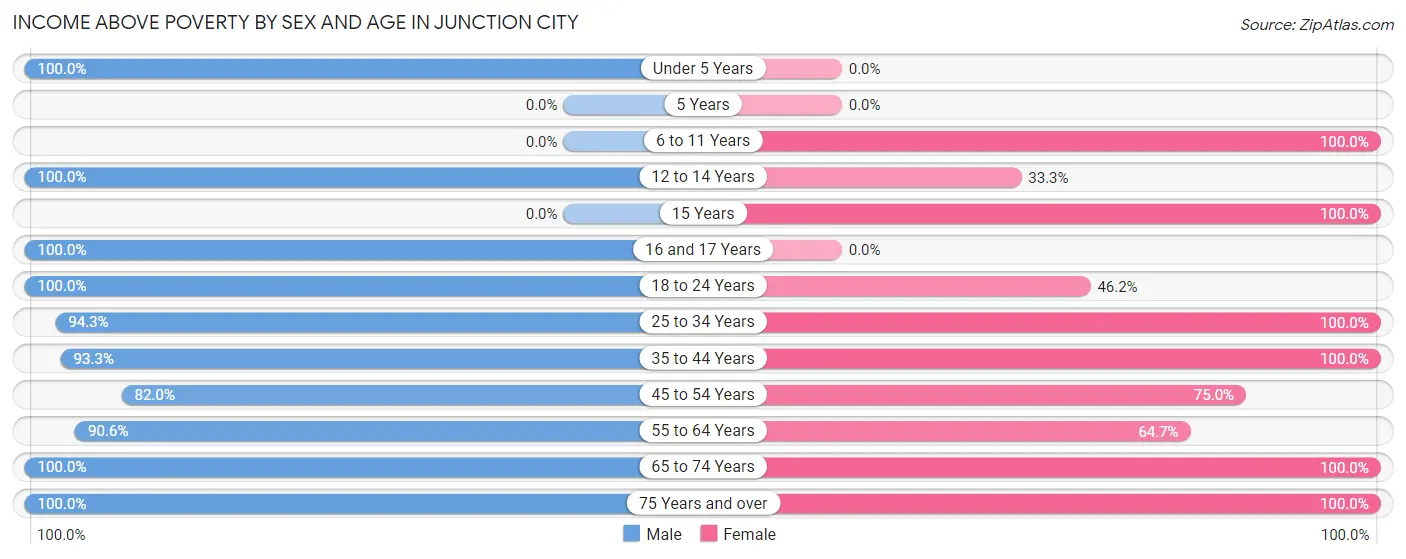
| Age Bracket | Male | Female |
| Under 5 Years | 16 (100.0%) | 0 (0.0%) |
| 5 Years | 0 (0.0%) | 0 (0.0%) |
| 6 to 11 Years | 0 (0.0%) | 43 (100.0%) |
| 12 to 14 Years | 1 (100.0%) | 1 (33.3%) |
| 15 Years | 0 (0.0%) | 4 (100.0%) |
| 16 and 17 Years | 2 (100.0%) | 0 (0.0%) |
| 18 to 24 Years | 39 (100.0%) | 6 (46.2%) |
| 25 to 34 Years | 33 (94.3%) | 4 (100.0%) |
| 35 to 44 Years | 14 (93.3%) | 45 (100.0%) |
| 45 to 54 Years | 41 (82.0%) | 9 (75.0%) |
| 55 to 64 Years | 29 (90.6%) | 11 (64.7%) |
| 65 to 74 Years | 1 (100.0%) | 4 (100.0%) |
| 75 Years and over | 26 (100.0%) | 41 (100.0%) |
| Total | 202 (91.8%) | 168 (88.9%) |
Income Below Poverty Among Married-Couple Families in Junction City
The poverty statistics for married-couple families in Junction City show that 2.5% or 1 of the total 40 families live below the poverty line. Families with 3 or 4 children have the highest poverty rate of 100.0%, comprising of 1 families. On the other hand, families with no children have the lowest poverty rate of 0.0%, which includes 0 families.
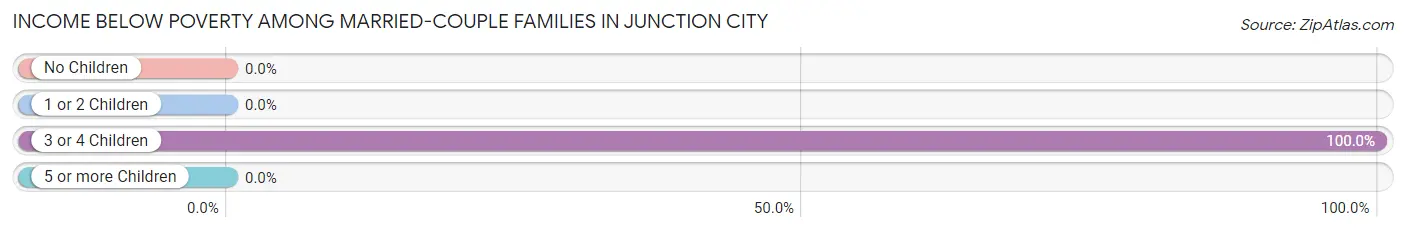
| Children | Above Poverty | Below Poverty |
| No Children | 7 (100.0%) | 0 (0.0%) |
| 1 or 2 Children | 32 (100.0%) | 0 (0.0%) |
| 3 or 4 Children | 0 (0.0%) | 1 (100.0%) |
| 5 or more Children | 0 (0.0%) | 0 (0.0%) |
| Total | 39 (97.5%) | 1 (2.5%) |
Income Below Poverty Among Single-Parent Households in Junction City
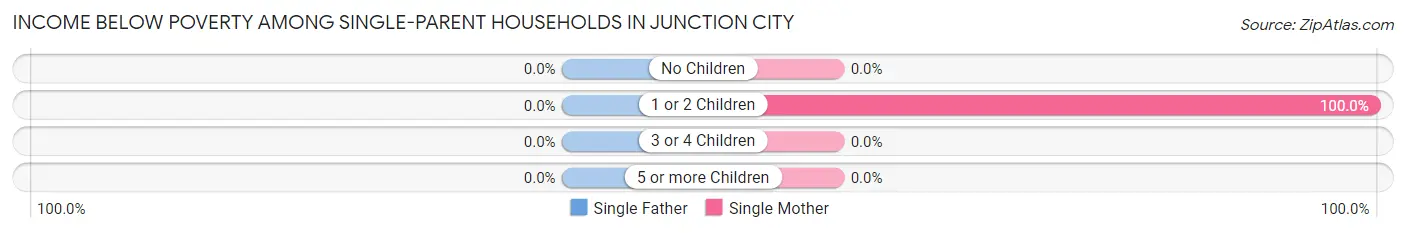
| Children | Single Father | Single Mother |
| No Children | 0 (0.0%) | 0 (0.0%) |
| 1 or 2 Children | 0 (0.0%) | 2 (100.0%) |
| 3 or 4 Children | 0 (0.0%) | 0 (0.0%) |
| 5 or more Children | 0 (0.0%) | 0 (0.0%) |
| Total | 0 (0.0%) | 2 (6.1%) |
Income Below Poverty Among Married-Couple vs Single-Parent Households in Junction City
The poverty data for Junction City shows that 1 of the married-couple family households (2.5%) and 2 of the single-parent households (3.6%) are living below the poverty level. Within the married-couple family households, those with 3 or 4 children have the highest poverty rate, with 1 households (100.0%) falling below the poverty line. Among the single-parent households, those with 1 or 2 children have the highest poverty rate, with 2 household (40.0%) living below poverty.
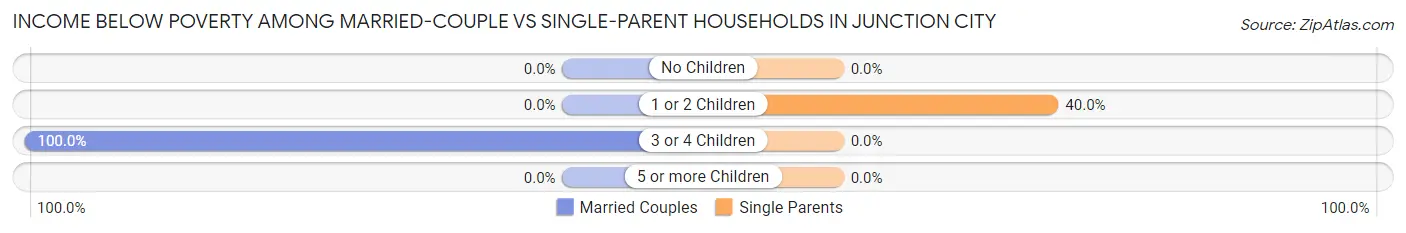
| Children | Married-Couple Families | Single-Parent Households |
| No Children | 0 (0.0%) | 0 (0.0%) |
| 1 or 2 Children | 0 (0.0%) | 2 (40.0%) |
| 3 or 4 Children | 1 (100.0%) | 0 (0.0%) |
| 5 or more Children | 0 (0.0%) | 0 (0.0%) |
| Total | 1 (2.5%) | 2 (3.6%) |
Race in Junction City
The most populous races in Junction City are Black / African American (385 | 94.1%), White / Caucasian (21 | 5.1%), and Two or more Races (3 | 0.7%).
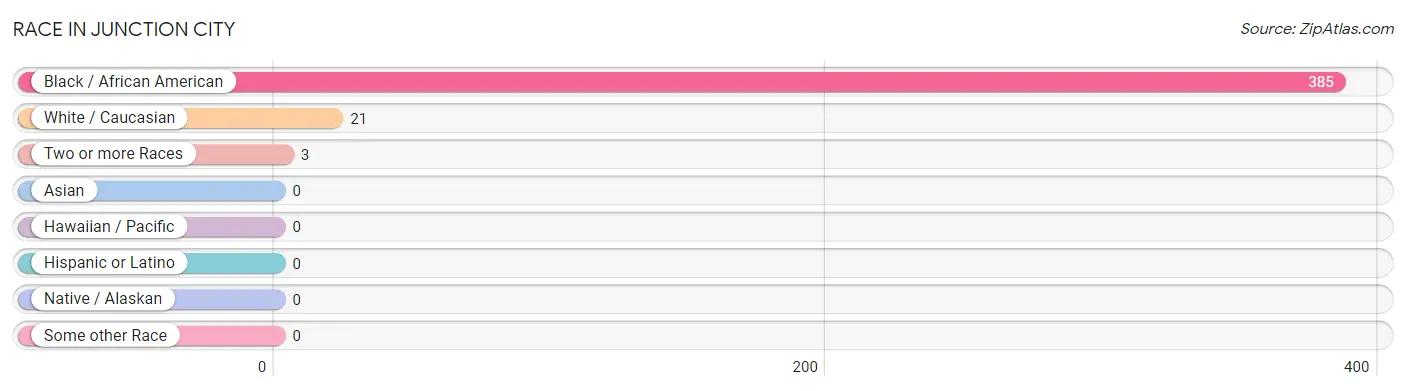
| Race | # Population | % Population |
| Asian | 0 | 0.0% |
| Black / African American | 385 | 94.1% |
| Hawaiian / Pacific | 0 | 0.0% |
| Hispanic or Latino | 0 | 0.0% |
| Native / Alaskan | 0 | 0.0% |
| White / Caucasian | 21 | 5.1% |
| Two or more Races | 3 | 0.7% |
| Some other Race | 0 | 0.0% |
| Total | 409 | 100.0% |
Ancestry in Junction City
The most populous ancestries reported in Junction City are American (14 | 3.4%), Greek (2 | 0.5%), Irish (2 | 0.5%), French (1 | 0.2%), and German (1 | 0.2%), together accounting for 4.9% of all Junction City residents.
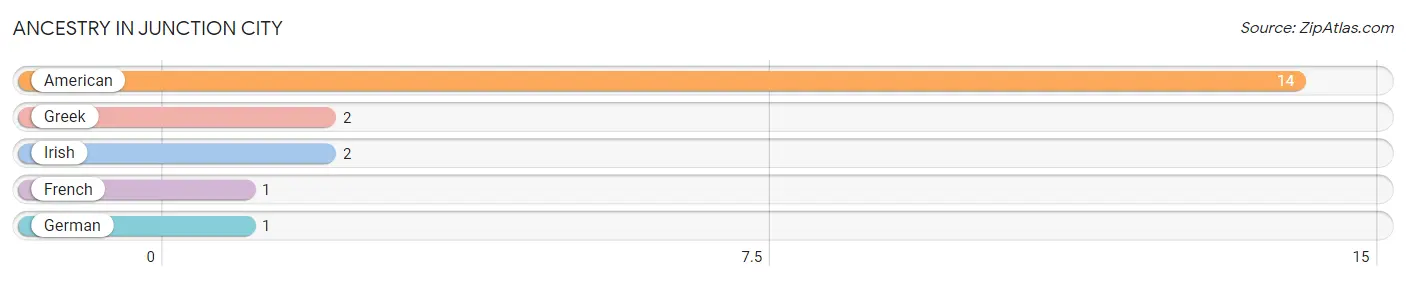
| Ancestry | # Population | % Population |
| American | 14 | 3.4% |
| French | 1 | 0.2% |
| German | 1 | 0.2% |
| Greek | 2 | 0.5% |
| Irish | 2 | 0.5% | View All 5 Rows |
Immigrants in Junction City

| Immigration Origin | # Population | % Population | View All 0 Rows |
Sex and Age in Junction City
Sex and Age in Junction City
The most populous age groups in Junction City are 50 to 54 Years (41 | 18.6%) for men and 10 to 14 Years (46 | 24.3%) for women.
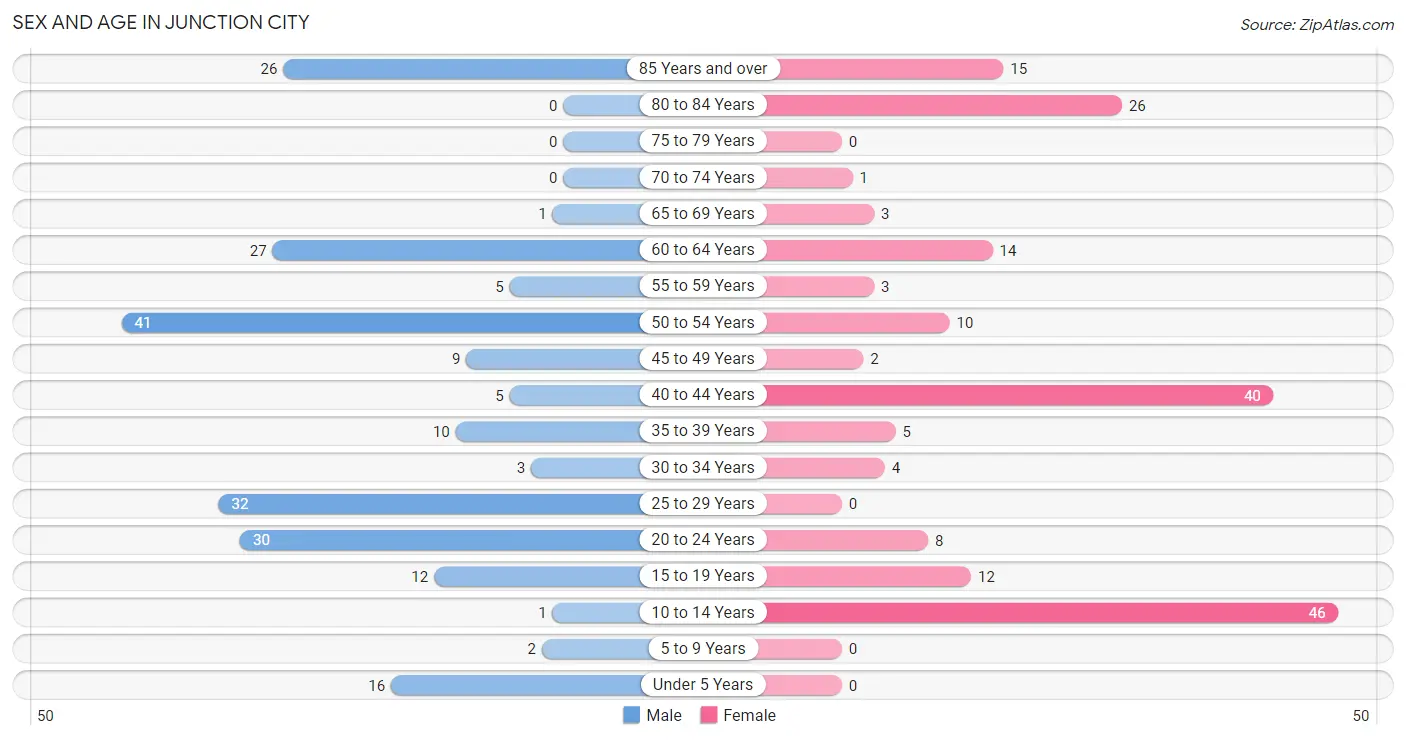
| Age Bracket | Male | Female |
| Under 5 Years | 16 (7.3%) | 0 (0.0%) |
| 5 to 9 Years | 2 (0.9%) | 0 (0.0%) |
| 10 to 14 Years | 1 (0.4%) | 46 (24.3%) |
| 15 to 19 Years | 12 (5.4%) | 12 (6.4%) |
| 20 to 24 Years | 30 (13.6%) | 8 (4.2%) |
| 25 to 29 Years | 32 (14.5%) | 0 (0.0%) |
| 30 to 34 Years | 3 (1.4%) | 4 (2.1%) |
| 35 to 39 Years | 10 (4.5%) | 5 (2.6%) |
| 40 to 44 Years | 5 (2.3%) | 40 (21.2%) |
| 45 to 49 Years | 9 (4.1%) | 2 (1.1%) |
| 50 to 54 Years | 41 (18.6%) | 10 (5.3%) |
| 55 to 59 Years | 5 (2.3%) | 3 (1.6%) |
| 60 to 64 Years | 27 (12.3%) | 14 (7.4%) |
| 65 to 69 Years | 1 (0.4%) | 3 (1.6%) |
| 70 to 74 Years | 0 (0.0%) | 1 (0.5%) |
| 75 to 79 Years | 0 (0.0%) | 0 (0.0%) |
| 80 to 84 Years | 0 (0.0%) | 26 (13.8%) |
| 85 Years and over | 26 (11.8%) | 15 (7.9%) |
| Total | 220 (100.0%) | 189 (100.0%) |
Families and Households in Junction City
Median Family Size in Junction City
The median family size in Junction City is 3.97 persons per family, with married-couple families (40 | 42.1%) accounting for the largest median family size of 5.48 persons per family. On the other hand, single female/mother families (33 | 34.7%) represent the smallest median family size with 2.27 persons per family.
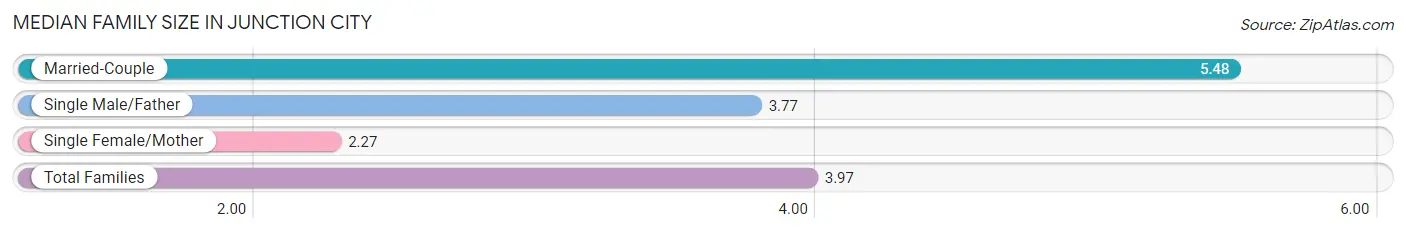
| Family Type | # Families | Family Size |
| Married-Couple | 40 (42.1%) | 5.48 |
| Single Male/Father | 22 (23.2%) | 3.77 |
| Single Female/Mother | 33 (34.7%) | 2.27 |
| Total Families | 95 (100.0%) | 3.97 |
Median Household Size in Junction City
The median household size in Junction City is 3.53 persons per household, with married-couple households (40 | 34.5%) accounting for the largest median household size of 5.48 persons per household. non-family households (21 | 18.1%) represent the smallest median household size with 1.19 persons per household.
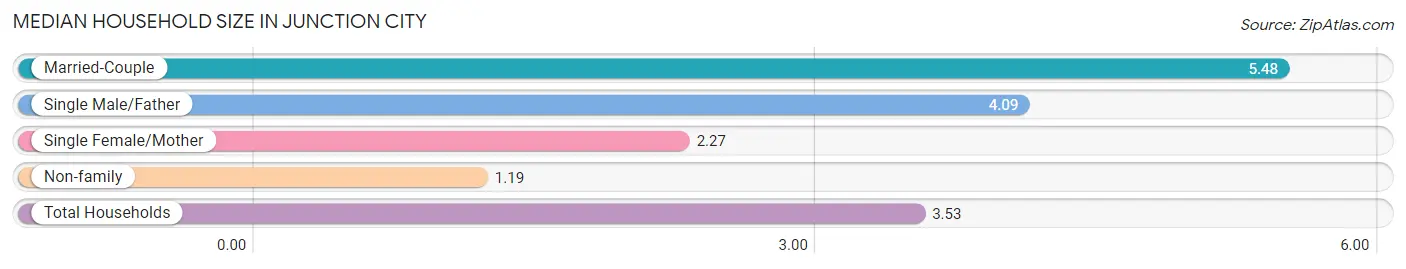
| Household Type | # Households | Household Size |
| Married-Couple | 40 (34.5%) | 5.48 |
| Single Male/Father | 22 (19.0%) | 4.09 |
| Single Female/Mother | 33 (28.4%) | 2.27 |
| Non-family | 21 (18.1%) | 1.19 |
| Total Households | 116 (100.0%) | 3.53 |
Household Size by Marriage Status in Junction City
Out of a total of 116 households in Junction City, 95 (81.9%) are family households, while 21 (18.1%) are nonfamily households. The most numerous type of family households are 2-person households, comprising 34, and the most common type of nonfamily households are 1-person households, comprising 18.
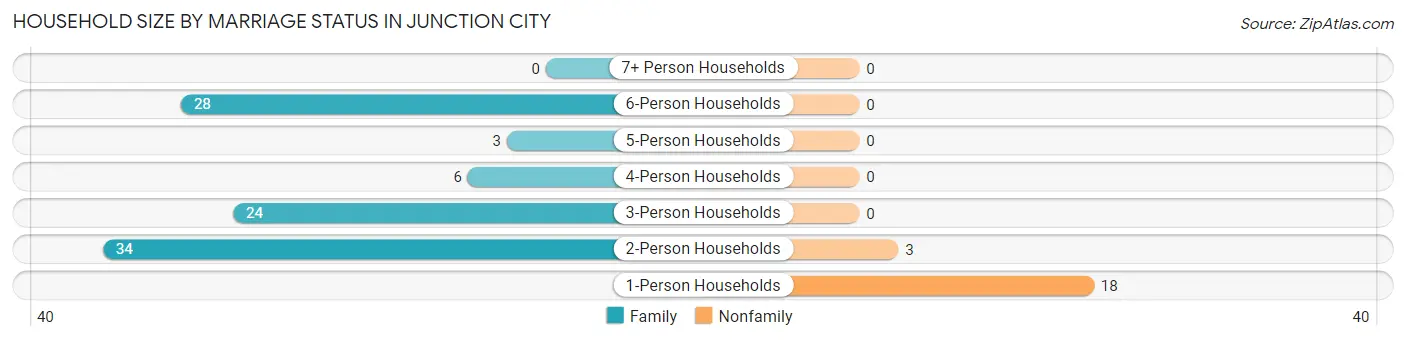
| Household Size | Family Households | Nonfamily Households |
| 1-Person Households | - | 18 (15.5%) |
| 2-Person Households | 34 (29.3%) | 3 (2.6%) |
| 3-Person Households | 24 (20.7%) | 0 (0.0%) |
| 4-Person Households | 6 (5.2%) | 0 (0.0%) |
| 5-Person Households | 3 (2.6%) | 0 (0.0%) |
| 6-Person Households | 28 (24.1%) | 0 (0.0%) |
| 7+ Person Households | 0 (0.0%) | 0 (0.0%) |
| Total | 95 (81.9%) | 21 (18.1%) |
Female Fertility in Junction City
Fertility by Age in Junction City
| Age Bracket | Women with Births | Births / 1,000 Women |
| 15 to 19 years | 0 (0.0%) | 0.0 |
| 20 to 34 years | 0 (0.0%) | 0.0 |
| 35 to 50 years | 0 (0.0%) | 0.0 |
| Total | 0 (0.0%) | 0.0 |
Fertility by Age by Marriage Status in Junction City
| Age Bracket | Married | Unmarried |
| 15 to 19 years | 0 (0.0%) | 0 (0.0%) |
| 20 to 34 years | 0 (0.0%) | 0 (0.0%) |
| 35 to 50 years | 0 (0.0%) | 0 (0.0%) |
| Total | 0 (0.0%) | 0 (0.0%) |
Fertility by Education in Junction City
| Educational Attainment | Women with Births | Births / 1,000 Women |
| Less than High School | 0 (0.0%) | 0.0 |
| High School Diploma | 0 (0.0%) | 0.0 |
| College or Associate's Degree | 0 (0.0%) | 0.0 |
| Bachelor's Degree | 0 (0.0%) | 0.0 |
| Graduate Degree | 0 (0.0%) | 0.0 |
| Total | 0 (0.0%) | 0.0 |
Fertility by Education by Marriage Status in Junction City
| Educational Attainment | Married | Unmarried |
| Less than High School | 0 (0.0%) | 0 (0.0%) |
| High School Diploma | 0 (0.0%) | 0 (0.0%) |
| College or Associate's Degree | 0 (0.0%) | 0 (0.0%) |
| Bachelor's Degree | 0 (0.0%) | 0 (0.0%) |
| Graduate Degree | 0 (0.0%) | 0 (0.0%) |
| Total | 0 (0.0%) | 0 (0.0%) |
Employment Characteristics in Junction City
Employment by Class of Employer in Junction City
Among the 140 employed individuals in Junction City, private company employees (105 | 75.0%), local government employees (16 | 11.4%), and state government employees (13 | 9.3%) make up the most common classes of employment.
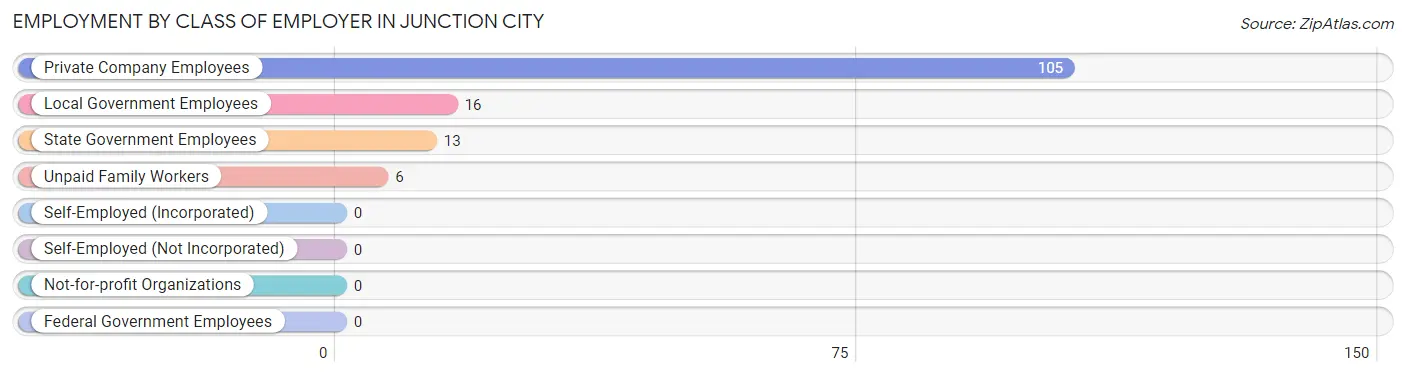
| Employer Class | # Employees | % Employees |
| Private Company Employees | 105 | 75.0% |
| Self-Employed (Incorporated) | 0 | 0.0% |
| Self-Employed (Not Incorporated) | 0 | 0.0% |
| Not-for-profit Organizations | 0 | 0.0% |
| Local Government Employees | 16 | 11.4% |
| State Government Employees | 13 | 9.3% |
| Federal Government Employees | 0 | 0.0% |
| Unpaid Family Workers | 6 | 4.3% |
| Total | 140 | 100.0% |
Employment Status by Age in Junction City
According to the labor force statistics for Junction City, out of the total population over 16 years of age (339), 44.0% or 149 individuals are in the labor force, with 6.0% or 9 of them unemployed. The age group with the highest labor force participation rate is 35 to 44 years, with 100.0% or 60 individuals in the labor force. Within the labor force, the 16 to 19 years age range has the highest percentage of unemployed individuals, with 75.0% or 9 of them being unemployed.
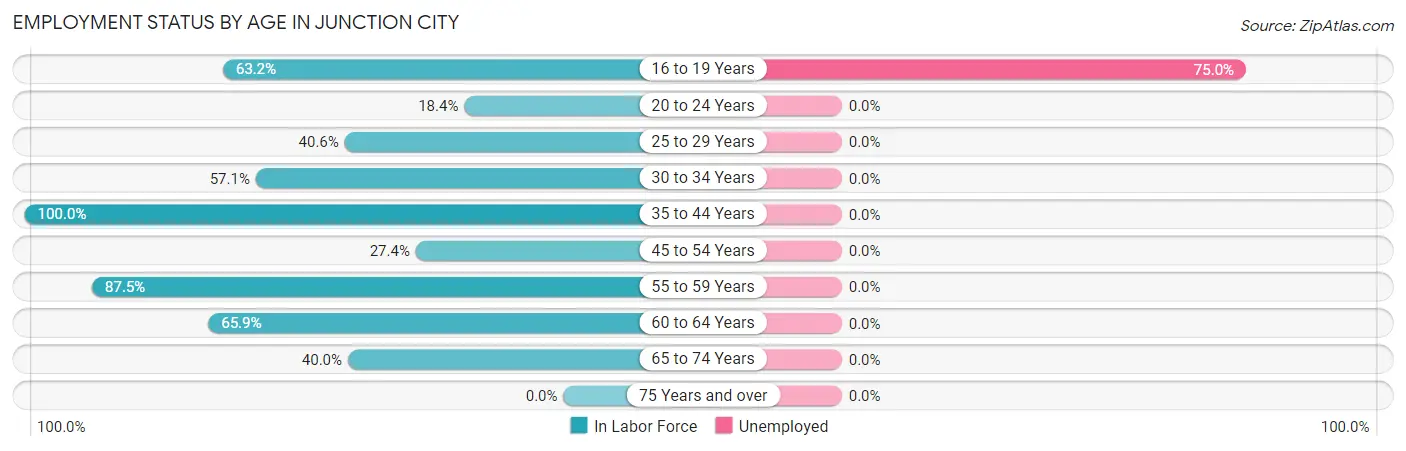
| Age Bracket | In Labor Force | Unemployed |
| 16 to 19 Years | 12 (63.2%) | 9 (75.0%) |
| 20 to 24 Years | 7 (18.4%) | 0 (0.0%) |
| 25 to 29 Years | 13 (40.6%) | 0 (0.0%) |
| 30 to 34 Years | 4 (57.1%) | 0 (0.0%) |
| 35 to 44 Years | 60 (100.0%) | 0 (0.0%) |
| 45 to 54 Years | 17 (27.4%) | 0 (0.0%) |
| 55 to 59 Years | 7 (87.5%) | 0 (0.0%) |
| 60 to 64 Years | 27 (65.9%) | 0 (0.0%) |
| 65 to 74 Years | 2 (40.0%) | 0 (0.0%) |
| 75 Years and over | 0 (0.0%) | 0 (0.0%) |
| Total | 149 (44.0%) | 9 (6.0%) |
Employment Status by Educational Attainment in Junction City
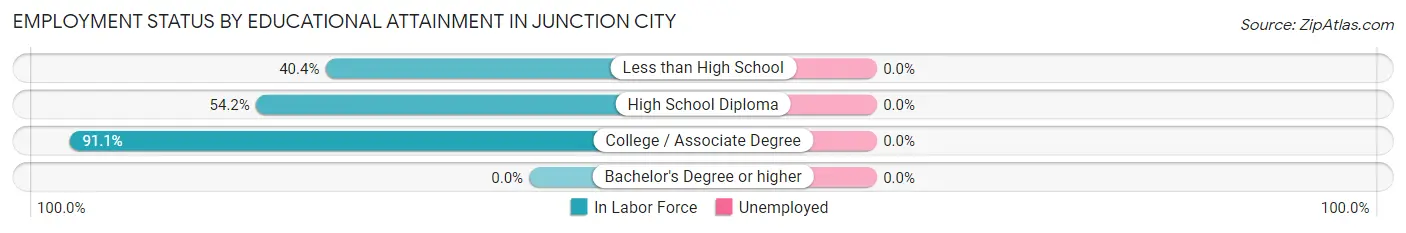
| Educational Attainment | In Labor Force | Unemployed |
| Less than High School | 19 (40.4%) | 0 (0.0%) |
| High School Diploma | 58 (54.2%) | 0 (0.0%) |
| College / Associate Degree | 51 (91.1%) | 0 (0.0%) |
| Bachelor's Degree or higher | 0 (0.0%) | 0 (0.0%) |
| Total | 128 (61.0%) | 0 (0.0%) |
Employment Occupations by Sex in Junction City
Management, Business, Science and Arts Occupations
The most common Management, Business, Science and Arts occupations in Junction City are Health Diagnosing & Treating (40 | 28.6%), Health Technologists (40 | 28.6%), Computers, Engineering & Science (7 | 5.0%), Management (6 | 4.3%), and Life, Physical & Social Science (5 | 3.6%).
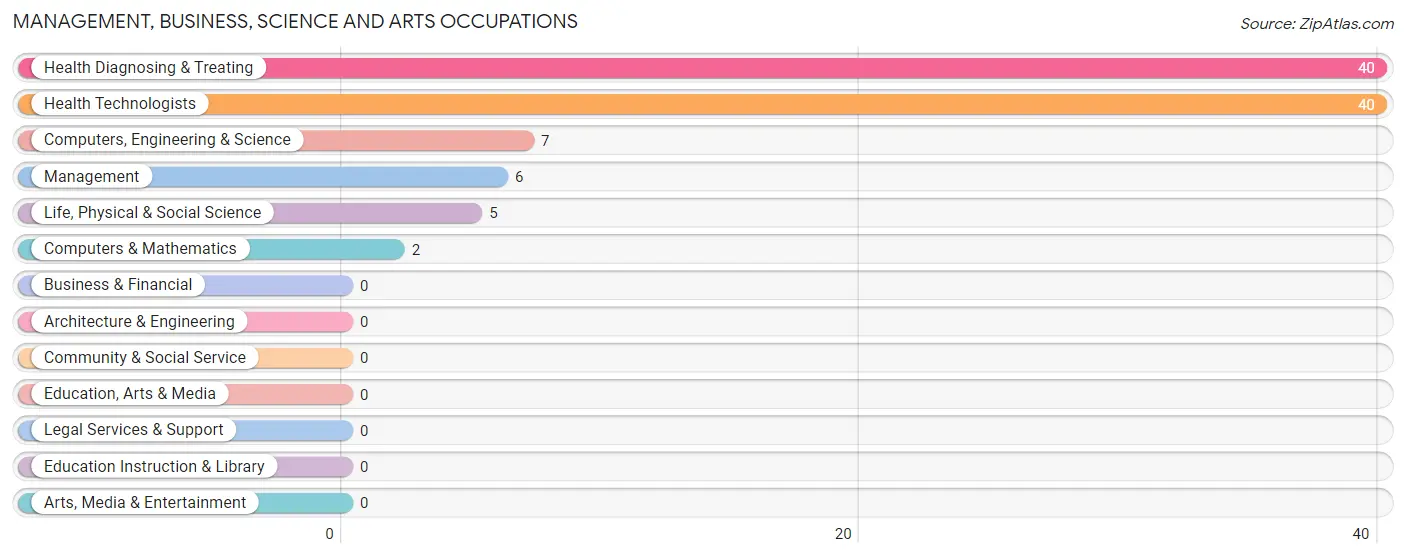
Management, Business, Science and Arts Occupations by Sex
Within the Management, Business, Science and Arts occupations in Junction City, the most male-oriented occupations are Management (100.0%), Computers & Mathematics (100.0%), and Computers, Engineering & Science (28.6%), while the most female-oriented occupations are Life, Physical & Social Science (100.0%), Health Diagnosing & Treating (100.0%), and Health Technologists (100.0%).
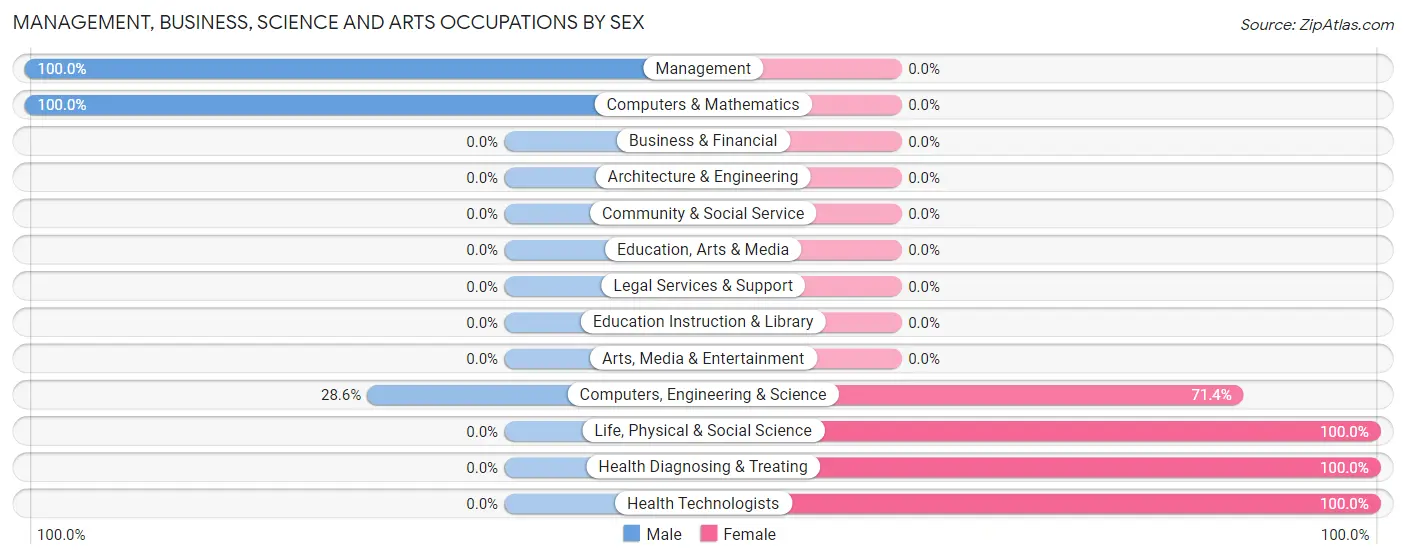
| Occupation | Male | Female |
| Management | 6 (100.0%) | 0 (0.0%) |
| Business & Financial | 0 (0.0%) | 0 (0.0%) |
| Computers, Engineering & Science | 2 (28.6%) | 5 (71.4%) |
| Computers & Mathematics | 2 (100.0%) | 0 (0.0%) |
| Architecture & Engineering | 0 (0.0%) | 0 (0.0%) |
| Life, Physical & Social Science | 0 (0.0%) | 5 (100.0%) |
| Community & Social Service | 0 (0.0%) | 0 (0.0%) |
| Education, Arts & Media | 0 (0.0%) | 0 (0.0%) |
| Legal Services & Support | 0 (0.0%) | 0 (0.0%) |
| Education Instruction & Library | 0 (0.0%) | 0 (0.0%) |
| Arts, Media & Entertainment | 0 (0.0%) | 0 (0.0%) |
| Health Diagnosing & Treating | 0 (0.0%) | 40 (100.0%) |
| Health Technologists | 0 (0.0%) | 40 (100.0%) |
| Total (Category) | 8 (15.1%) | 45 (84.9%) |
| Total (Overall) | 81 (57.9%) | 59 (42.1%) |
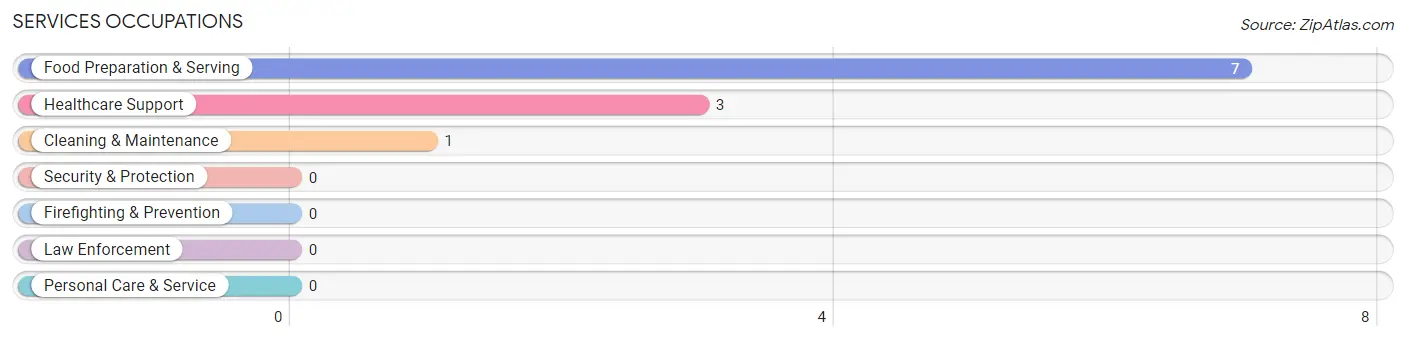
Services Occupations
The most common Services occupations in Junction City are Food Preparation & Serving (7 | 5.0%), Healthcare Support (3 | 2.1%), and Cleaning & Maintenance (1 | 0.7%).
Services Occupations by Sex
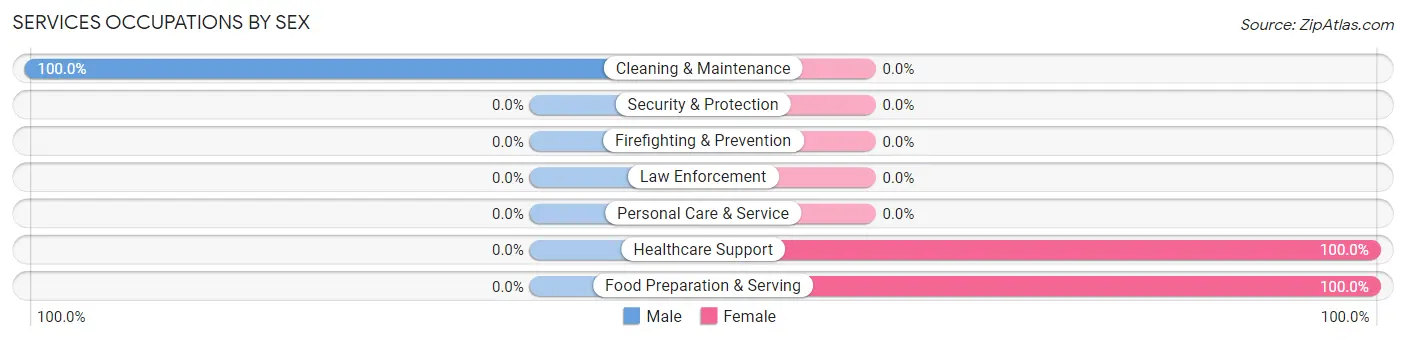
| Occupation | Male | Female |
| Healthcare Support | 0 (0.0%) | 3 (100.0%) |
| Security & Protection | 0 (0.0%) | 0 (0.0%) |
| Firefighting & Prevention | 0 (0.0%) | 0 (0.0%) |
| Law Enforcement | 0 (0.0%) | 0 (0.0%) |
| Food Preparation & Serving | 0 (0.0%) | 7 (100.0%) |
| Cleaning & Maintenance | 1 (100.0%) | 0 (0.0%) |
| Personal Care & Service | 0 (0.0%) | 0 (0.0%) |
| Total (Category) | 1 (9.1%) | 10 (90.9%) |
| Total (Overall) | 81 (57.9%) | 59 (42.1%) |
Sales and Office Occupations
The most common Sales and Office occupations in Junction City are , and Office & Administration (12 | 8.6%).
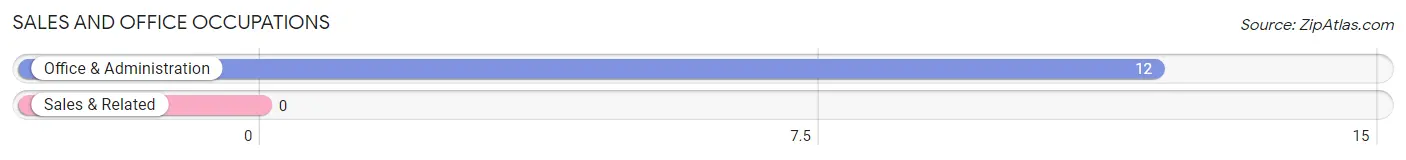
Sales and Office Occupations by Sex
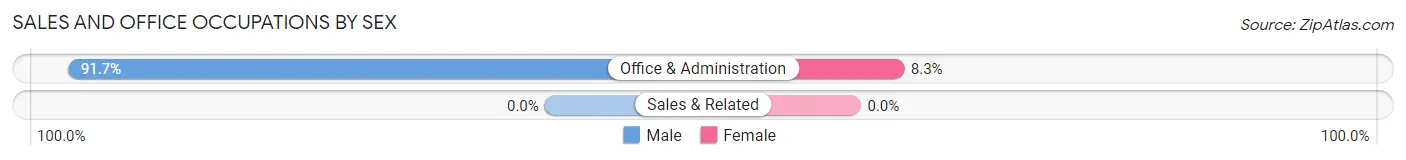
| Occupation | Male | Female |
| Sales & Related | 0 (0.0%) | 0 (0.0%) |
| Office & Administration | 11 (91.7%) | 1 (8.3%) |
| Total (Category) | 11 (91.7%) | 1 (8.3%) |
| Total (Overall) | 81 (57.9%) | 59 (42.1%) |
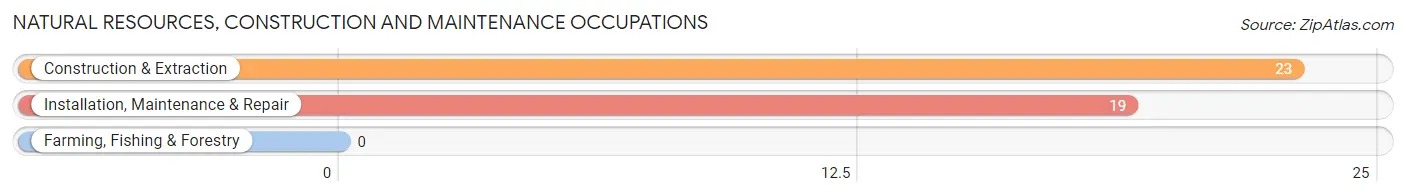
Natural Resources, Construction and Maintenance Occupations
The most common Natural Resources, Construction and Maintenance occupations in Junction City are Construction & Extraction (23 | 16.4%), and Installation, Maintenance & Repair (19 | 13.6%).
Natural Resources, Construction and Maintenance Occupations by Sex
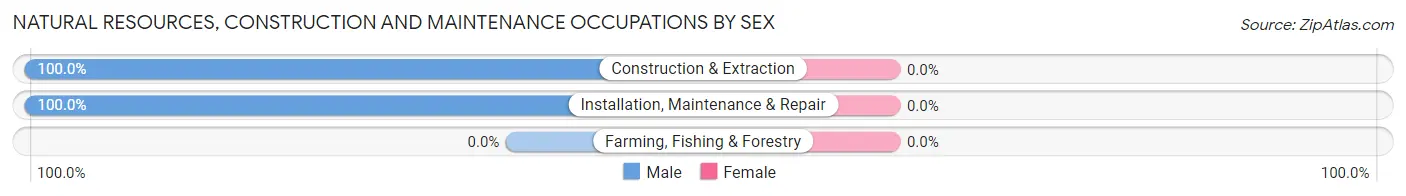
| Occupation | Male | Female |
| Farming, Fishing & Forestry | 0 (0.0%) | 0 (0.0%) |
| Construction & Extraction | 23 (100.0%) | 0 (0.0%) |
| Installation, Maintenance & Repair | 19 (100.0%) | 0 (0.0%) |
| Total (Category) | 42 (100.0%) | 0 (0.0%) |
| Total (Overall) | 81 (57.9%) | 59 (42.1%) |
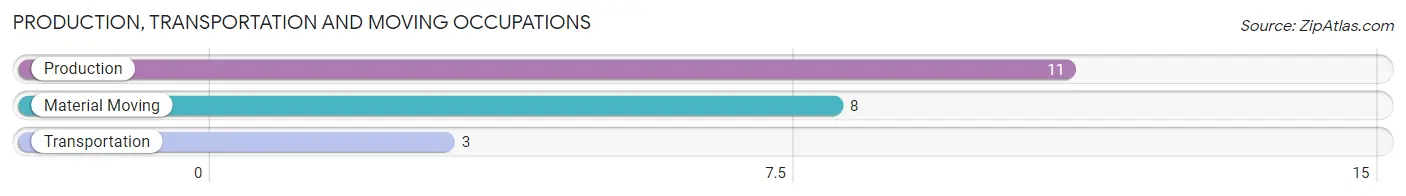
Production, Transportation and Moving Occupations
The most common Production, Transportation and Moving occupations in Junction City are Production (11 | 7.9%), Material Moving (8 | 5.7%), and Transportation (3 | 2.1%).
Production, Transportation and Moving Occupations by Sex
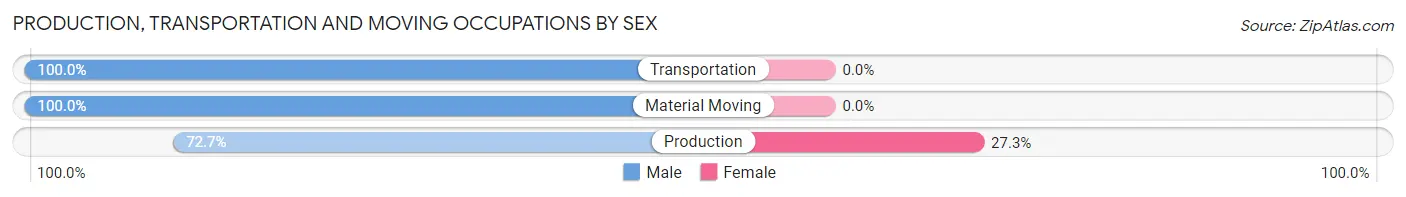
| Occupation | Male | Female |
| Production | 8 (72.7%) | 3 (27.3%) |
| Transportation | 3 (100.0%) | 0 (0.0%) |
| Material Moving | 8 (100.0%) | 0 (0.0%) |
| Total (Category) | 19 (86.4%) | 3 (13.6%) |
| Total (Overall) | 81 (57.9%) | 59 (42.1%) |
Employment Industries by Sex in Junction City
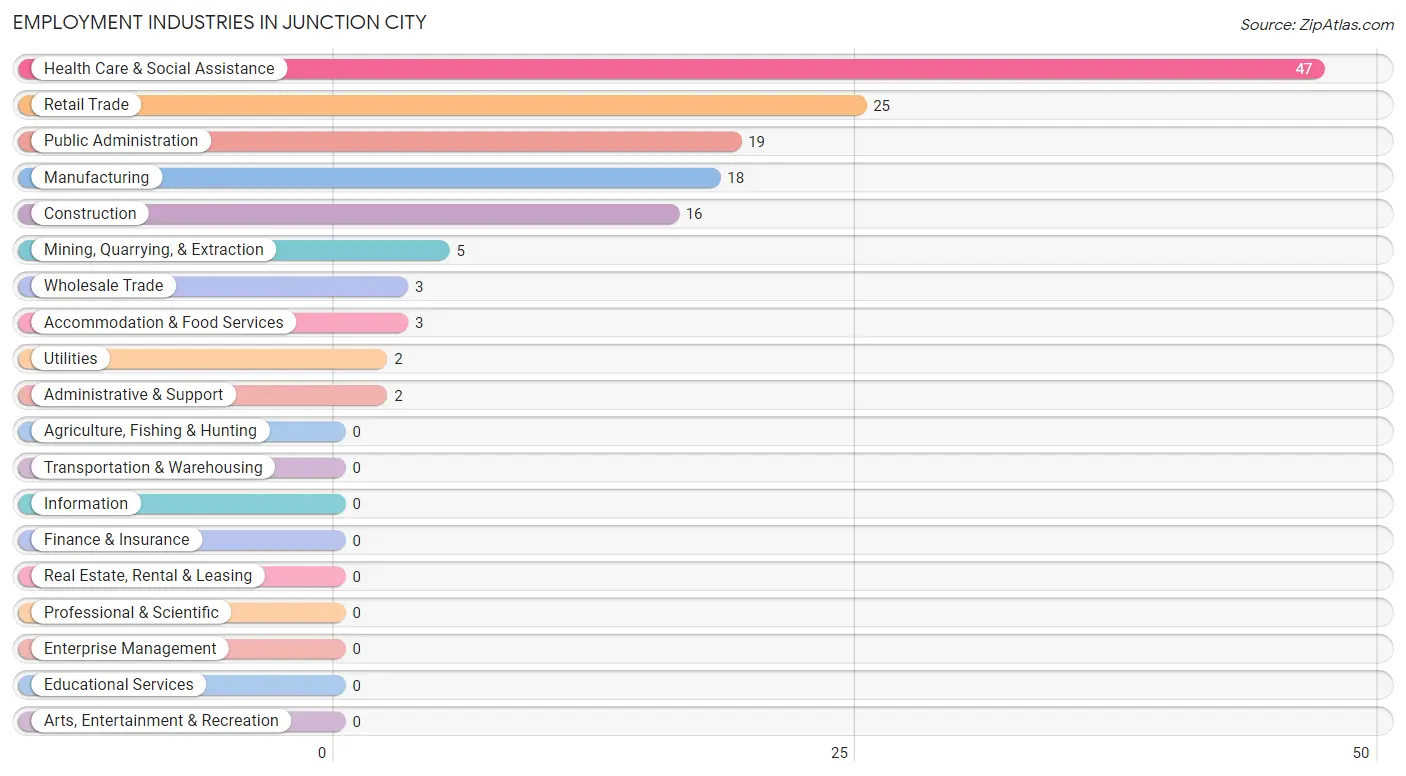
Employment Industries in Junction City
The major employment industries in Junction City include Health Care & Social Assistance (47 | 33.6%), Retail Trade (25 | 17.9%), Public Administration (19 | 13.6%), Manufacturing (18 | 12.9%), and Construction (16 | 11.4%).
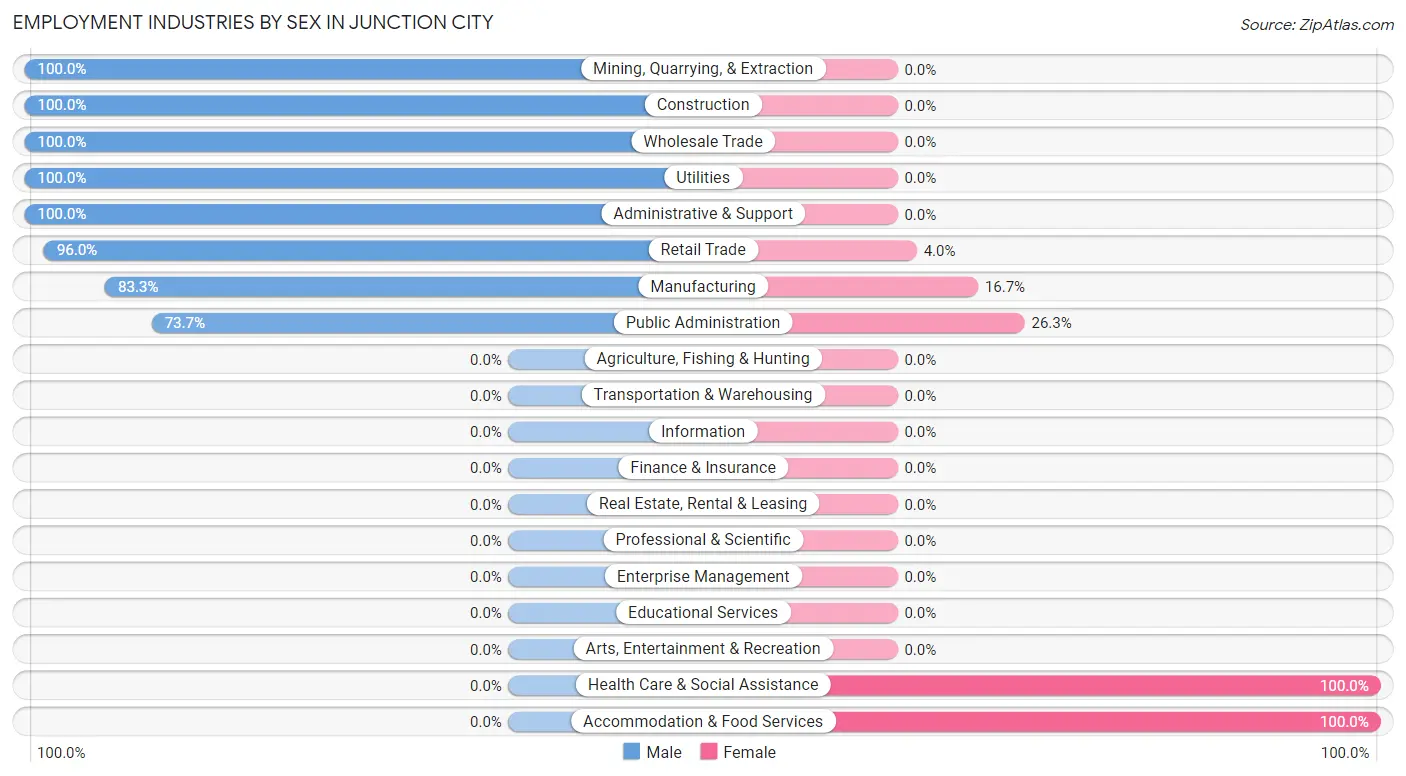
Employment Industries by Sex in Junction City
The Junction City industries that see more men than women are Mining, Quarrying, & Extraction (100.0%), Construction (100.0%), and Wholesale Trade (100.0%), whereas the industries that tend to have a higher number of women are Health Care & Social Assistance (100.0%), Accommodation & Food Services (100.0%), and Public Administration (26.3%).
| Industry | Male | Female |
| Agriculture, Fishing & Hunting | 0 (0.0%) | 0 (0.0%) |
| Mining, Quarrying, & Extraction | 5 (100.0%) | 0 (0.0%) |
| Construction | 16 (100.0%) | 0 (0.0%) |
| Manufacturing | 15 (83.3%) | 3 (16.7%) |
| Wholesale Trade | 3 (100.0%) | 0 (0.0%) |
| Retail Trade | 24 (96.0%) | 1 (4.0%) |
| Transportation & Warehousing | 0 (0.0%) | 0 (0.0%) |
| Utilities | 2 (100.0%) | 0 (0.0%) |
| Information | 0 (0.0%) | 0 (0.0%) |
| Finance & Insurance | 0 (0.0%) | 0 (0.0%) |
| Real Estate, Rental & Leasing | 0 (0.0%) | 0 (0.0%) |
| Professional & Scientific | 0 (0.0%) | 0 (0.0%) |
| Enterprise Management | 0 (0.0%) | 0 (0.0%) |
| Administrative & Support | 2 (100.0%) | 0 (0.0%) |
| Educational Services | 0 (0.0%) | 0 (0.0%) |
| Health Care & Social Assistance | 0 (0.0%) | 47 (100.0%) |
| Arts, Entertainment & Recreation | 0 (0.0%) | 0 (0.0%) |
| Accommodation & Food Services | 0 (0.0%) | 3 (100.0%) |
| Public Administration | 14 (73.7%) | 5 (26.3%) |
| Total | 81 (57.9%) | 59 (42.1%) |
Education in Junction City
School Enrollment in Junction City
The most common levels of schooling among the 57 students in Junction City are elementary school (43 | 75.4%), high school (5 | 8.8%), and college / undergraduate (5 | 8.8%).
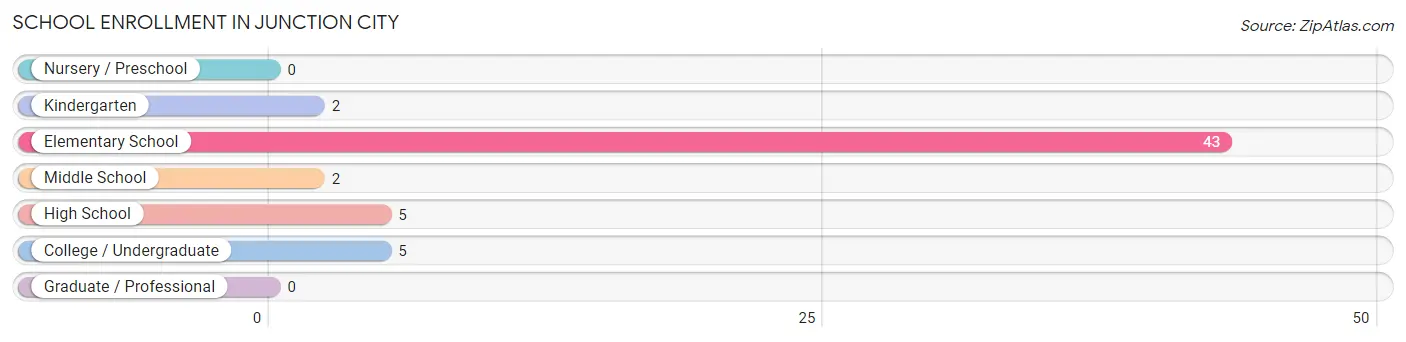
| School Level | # Students | % Students |
| Nursery / Preschool | 0 | 0.0% |
| Kindergarten | 2 | 3.5% |
| Elementary School | 43 | 75.4% |
| Middle School | 2 | 3.5% |
| High School | 5 | 8.8% |
| College / Undergraduate | 5 | 8.8% |
| Graduate / Professional | 0 | 0.0% |
| Total | 57 | 100.0% |
School Enrollment by Age by Funding Source in Junction City
Out of a total of 57 students who are enrolled in schools in Junction City, 5 (8.8%) attend a private institution, while the remaining 52 (91.2%) are enrolled in public schools. The age group of 18 to 19 year olds has the highest likelihood of being enrolled in private schools, with 5 (100.0% in the age bracket) enrolled. Conversely, the age group of 5 to 9 year old has the lowest likelihood of being enrolled in a private school, with 2 (100.0% in the age bracket) attending a public institution.
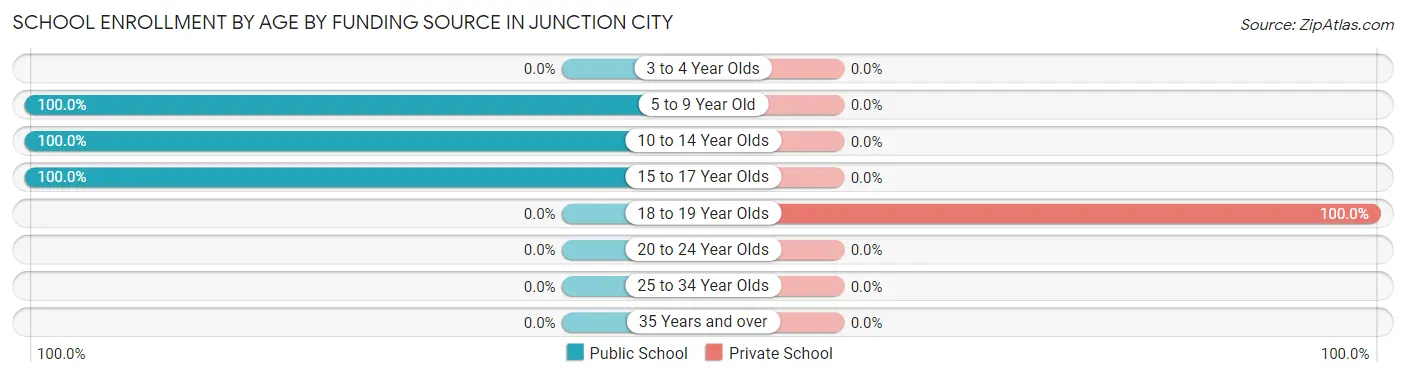
| Age Bracket | Public School | Private School |
| 3 to 4 Year Olds | 0 (0.0%) | 0 (0.0%) |
| 5 to 9 Year Old | 2 (100.0%) | 0 (0.0%) |
| 10 to 14 Year Olds | 45 (100.0%) | 0 (0.0%) |
| 15 to 17 Year Olds | 5 (100.0%) | 0 (0.0%) |
| 18 to 19 Year Olds | 0 (0.0%) | 5 (100.0%) |
| 20 to 24 Year Olds | 0 (0.0%) | 0 (0.0%) |
| 25 to 34 Year Olds | 0 (0.0%) | 0 (0.0%) |
| 35 Years and over | 0 (0.0%) | 0 (0.0%) |
| Total | 52 (91.2%) | 5 (8.8%) |
Educational Attainment by Field of Study in Junction City
, and visual & performing arts (1 | 100.0%) are the most common fields of study among 1 individuals in Junction City who have obtained a bachelor's degree or higher.
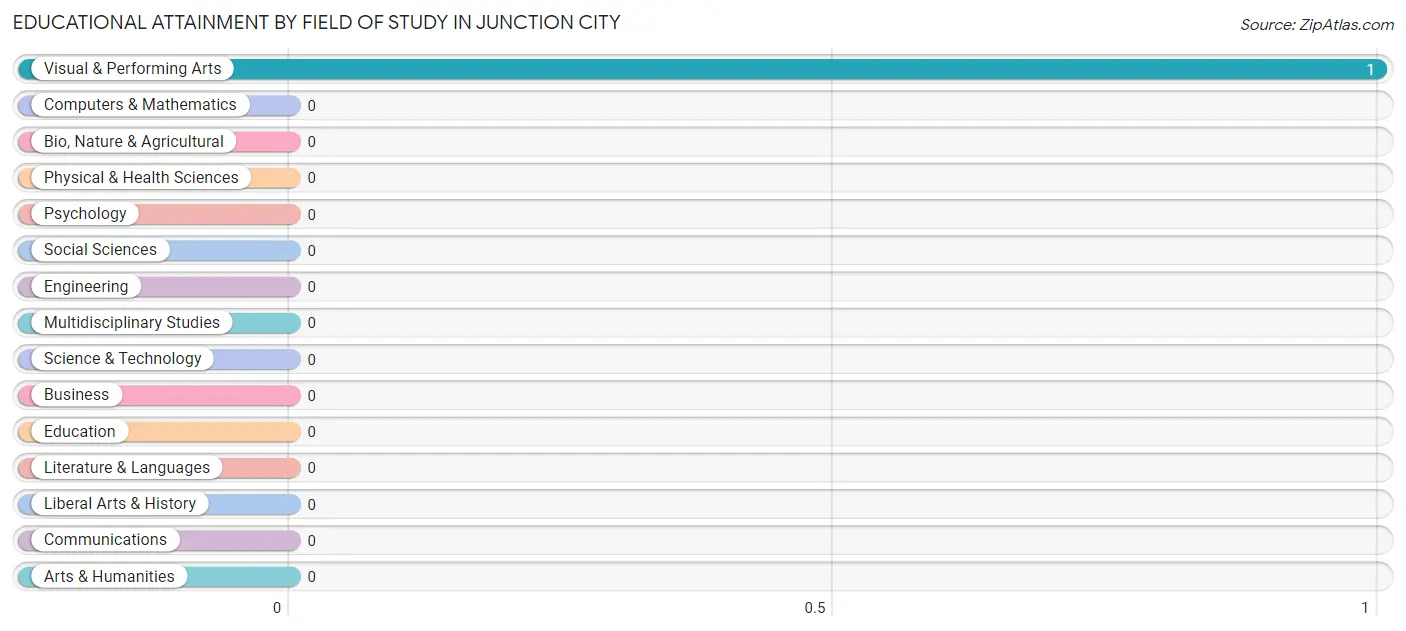
| Field of Study | # Graduates | % Graduates |
| Computers & Mathematics | 0 | 0.0% |
| Bio, Nature & Agricultural | 0 | 0.0% |
| Physical & Health Sciences | 0 | 0.0% |
| Psychology | 0 | 0.0% |
| Social Sciences | 0 | 0.0% |
| Engineering | 0 | 0.0% |
| Multidisciplinary Studies | 0 | 0.0% |
| Science & Technology | 0 | 0.0% |
| Business | 0 | 0.0% |
| Education | 0 | 0.0% |
| Literature & Languages | 0 | 0.0% |
| Liberal Arts & History | 0 | 0.0% |
| Visual & Performing Arts | 1 | 100.0% |
| Communications | 0 | 0.0% |
| Arts & Humanities | 0 | 0.0% |
| Total | 1 | 100.0% |
Transportation & Commute in Junction City
Vehicle Availability by Sex in Junction City
The most prevalent vehicle ownership categories in Junction City are males with 1 vehicle (47, accounting for 58.0%) and females with 1 vehicle (1, making up 79.7%).
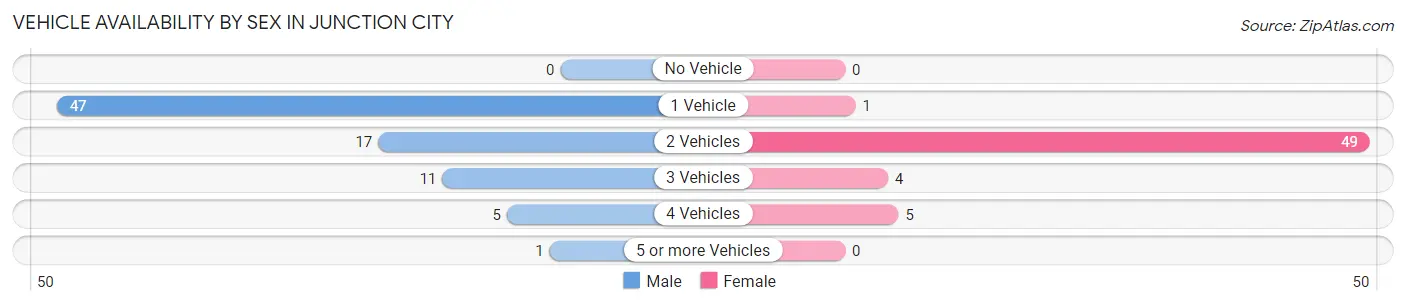
| Vehicles Available | Male | Female |
| No Vehicle | 0 (0.0%) | 0 (0.0%) |
| 1 Vehicle | 47 (58.0%) | 1 (1.7%) |
| 2 Vehicles | 17 (21.0%) | 49 (83.1%) |
| 3 Vehicles | 11 (13.6%) | 4 (6.8%) |
| 4 Vehicles | 5 (6.2%) | 5 (8.5%) |
| 5 or more Vehicles | 1 (1.2%) | 0 (0.0%) |
| Total | 81 (100.0%) | 59 (100.0%) |
Commute Time in Junction City
The most frequently occuring commute durations in Junction City are 35 to 39 minutes (41 commuters, 30.4%), 30 to 34 minutes (27 commuters, 20.0%), and 40 to 44 minutes (16 commuters, 11.8%).
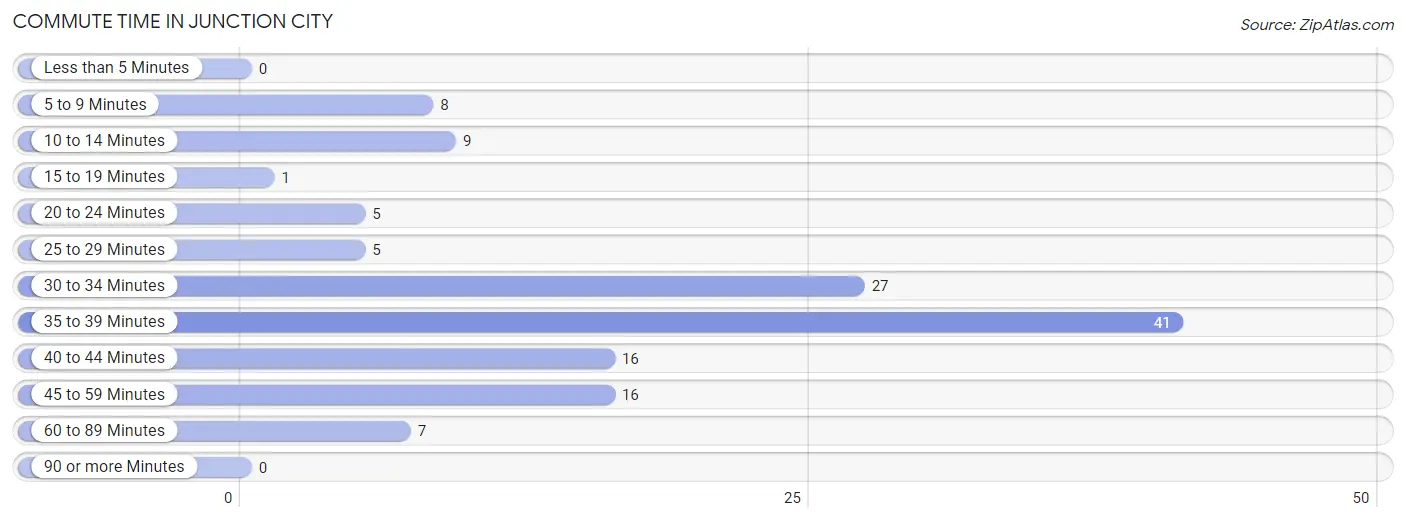
| Commute Time | # Commuters | % Commuters |
| Less than 5 Minutes | 0 | 0.0% |
| 5 to 9 Minutes | 8 | 5.9% |
| 10 to 14 Minutes | 9 | 6.7% |
| 15 to 19 Minutes | 1 | 0.7% |
| 20 to 24 Minutes | 5 | 3.7% |
| 25 to 29 Minutes | 5 | 3.7% |
| 30 to 34 Minutes | 27 | 20.0% |
| 35 to 39 Minutes | 41 | 30.4% |
| 40 to 44 Minutes | 16 | 11.8% |
| 45 to 59 Minutes | 16 | 11.8% |
| 60 to 89 Minutes | 7 | 5.2% |
| 90 or more Minutes | 0 | 0.0% |
Commute Time by Sex in Junction City
The most common commute times in Junction City are 30 to 34 minutes (27 commuters, 33.3%) for males and 35 to 39 minutes (41 commuters, 75.9%) for females.
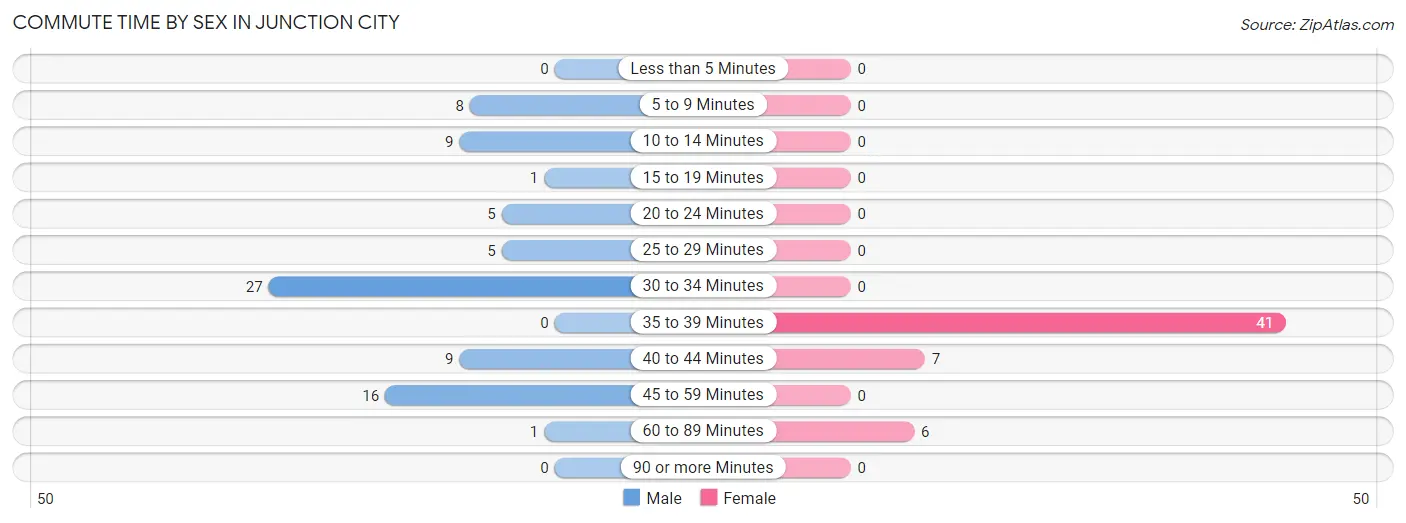
| Commute Time | Male | Female |
| Less than 5 Minutes | 0 (0.0%) | 0 (0.0%) |
| 5 to 9 Minutes | 8 (9.9%) | 0 (0.0%) |
| 10 to 14 Minutes | 9 (11.1%) | 0 (0.0%) |
| 15 to 19 Minutes | 1 (1.2%) | 0 (0.0%) |
| 20 to 24 Minutes | 5 (6.2%) | 0 (0.0%) |
| 25 to 29 Minutes | 5 (6.2%) | 0 (0.0%) |
| 30 to 34 Minutes | 27 (33.3%) | 0 (0.0%) |
| 35 to 39 Minutes | 0 (0.0%) | 41 (75.9%) |
| 40 to 44 Minutes | 9 (11.1%) | 7 (13.0%) |
| 45 to 59 Minutes | 16 (19.8%) | 0 (0.0%) |
| 60 to 89 Minutes | 1 (1.2%) | 6 (11.1%) |
| 90 or more Minutes | 0 (0.0%) | 0 (0.0%) |
Time of Departure to Work by Sex in Junction City
The most frequent times of departure to work in Junction City are 6:30 AM to 6:59 AM (27, 33.3%) for males and 7:00 AM to 7:29 AM (48, 88.9%) for females.
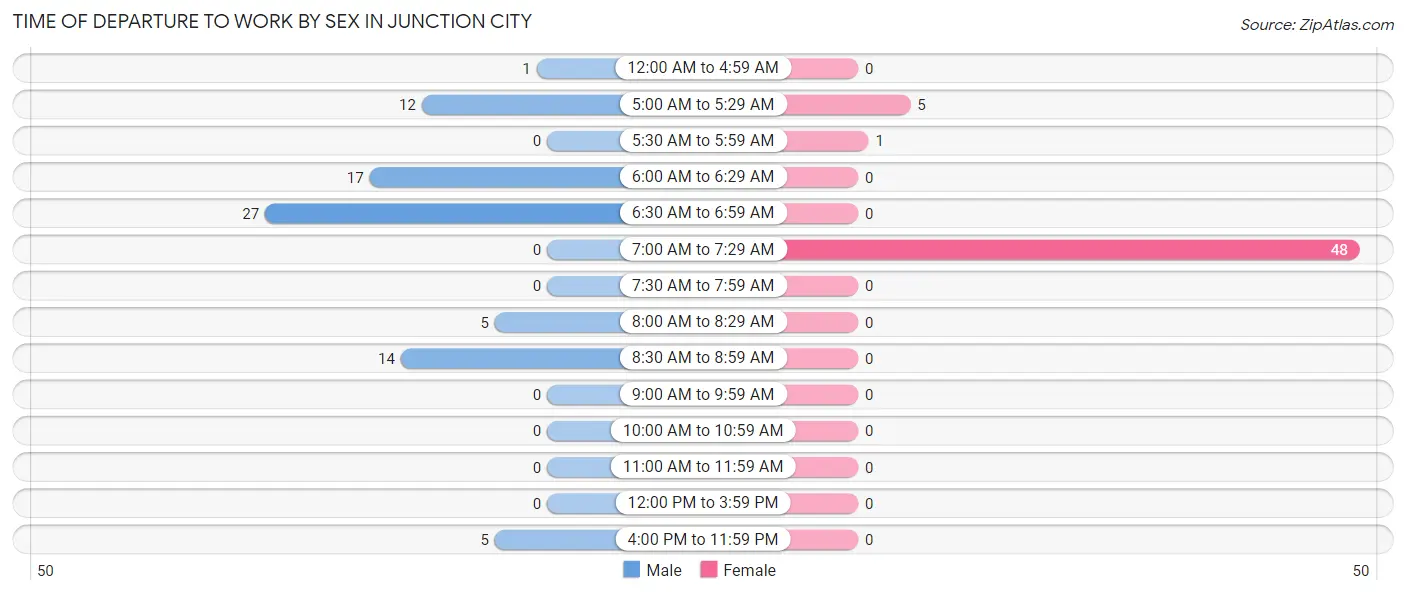
| Time of Departure | Male | Female |
| 12:00 AM to 4:59 AM | 1 (1.2%) | 0 (0.0%) |
| 5:00 AM to 5:29 AM | 12 (14.8%) | 5 (9.3%) |
| 5:30 AM to 5:59 AM | 0 (0.0%) | 1 (1.8%) |
| 6:00 AM to 6:29 AM | 17 (21.0%) | 0 (0.0%) |
| 6:30 AM to 6:59 AM | 27 (33.3%) | 0 (0.0%) |
| 7:00 AM to 7:29 AM | 0 (0.0%) | 48 (88.9%) |
| 7:30 AM to 7:59 AM | 0 (0.0%) | 0 (0.0%) |
| 8:00 AM to 8:29 AM | 5 (6.2%) | 0 (0.0%) |
| 8:30 AM to 8:59 AM | 14 (17.3%) | 0 (0.0%) |
| 9:00 AM to 9:59 AM | 0 (0.0%) | 0 (0.0%) |
| 10:00 AM to 10:59 AM | 0 (0.0%) | 0 (0.0%) |
| 11:00 AM to 11:59 AM | 0 (0.0%) | 0 (0.0%) |
| 12:00 PM to 3:59 PM | 0 (0.0%) | 0 (0.0%) |
| 4:00 PM to 11:59 PM | 5 (6.2%) | 0 (0.0%) |
| Total | 81 (100.0%) | 54 (100.0%) |
Housing Occupancy in Junction City
Occupancy by Ownership in Junction City
Of the total 116 dwellings in Junction City, owner-occupied units account for 83 (71.6%), while renter-occupied units make up 33 (28.4%).
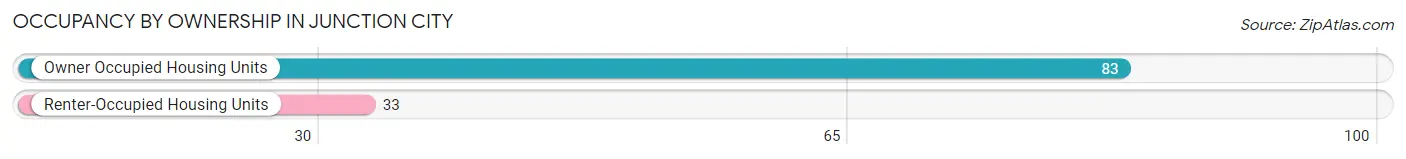
| Occupancy | # Housing Units | % Housing Units |
| Owner Occupied Housing Units | 83 | 71.6% |
| Renter-Occupied Housing Units | 33 | 28.4% |
| Total Occupied Housing Units | 116 | 100.0% |
Occupancy by Household Size in Junction City
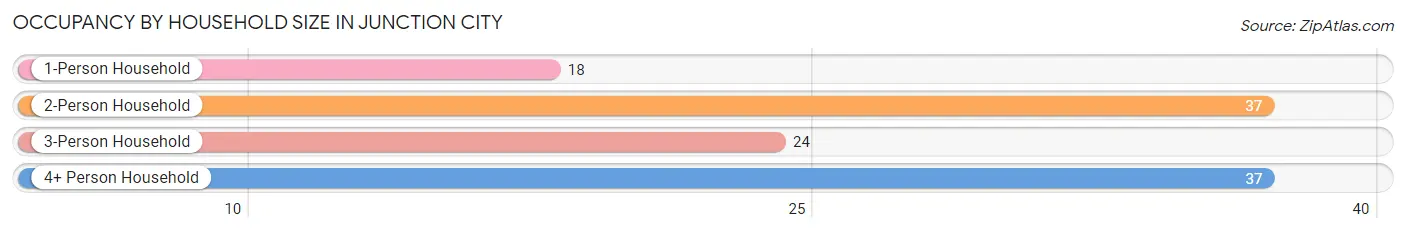
| Household Size | # Housing Units | % Housing Units |
| 1-Person Household | 18 | 15.5% |
| 2-Person Household | 37 | 31.9% |
| 3-Person Household | 24 | 20.7% |
| 4+ Person Household | 37 | 31.9% |
| Total Housing Units | 116 | 100.0% |
Occupancy by Ownership by Household Size in Junction City
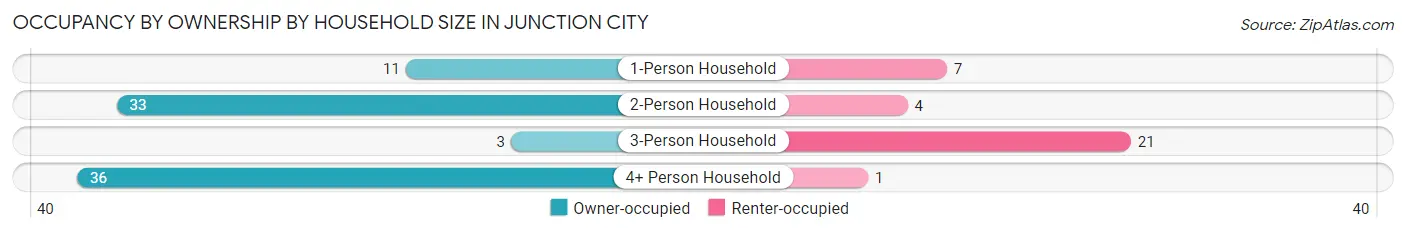
| Household Size | Owner-occupied | Renter-occupied |
| 1-Person Household | 11 (61.1%) | 7 (38.9%) |
| 2-Person Household | 33 (89.2%) | 4 (10.8%) |
| 3-Person Household | 3 (12.5%) | 21 (87.5%) |
| 4+ Person Household | 36 (97.3%) | 1 (2.7%) |
| Total Housing Units | 83 (71.6%) | 33 (28.4%) |
Occupancy by Educational Attainment in Junction City
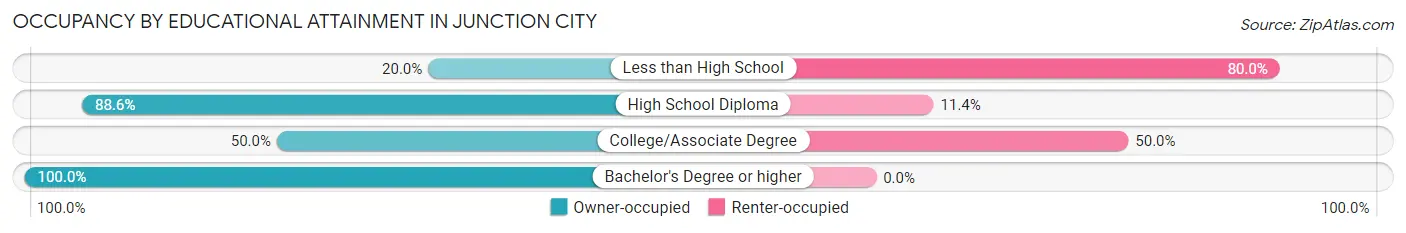
| Household Size | Owner-occupied | Renter-occupied |
| Less than High School | 4 (20.0%) | 16 (80.0%) |
| High School Diploma | 70 (88.6%) | 9 (11.4%) |
| College/Associate Degree | 8 (50.0%) | 8 (50.0%) |
| Bachelor's Degree or higher | 1 (100.0%) | 0 (0.0%) |
Occupancy by Age of Householder in Junction City
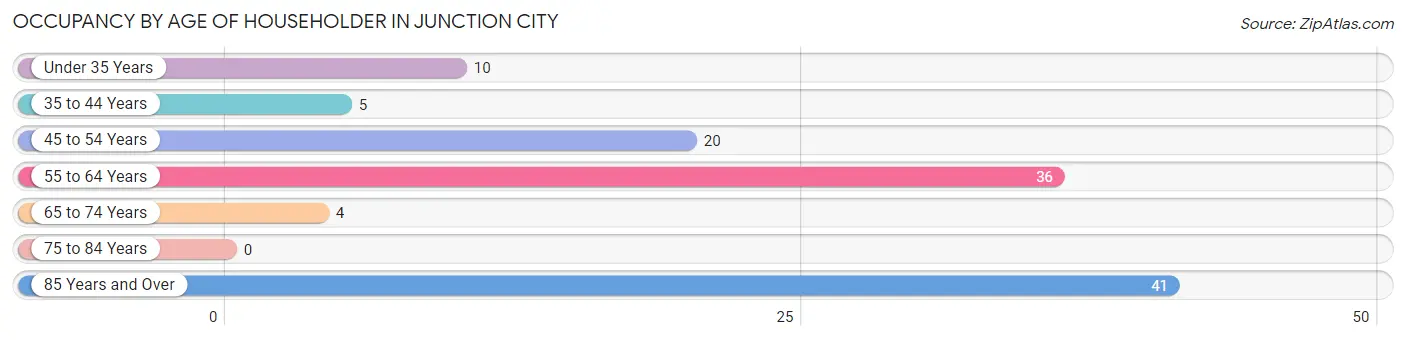
| Age Bracket | # Households | % Households |
| Under 35 Years | 10 | 8.6% |
| 35 to 44 Years | 5 | 4.3% |
| 45 to 54 Years | 20 | 17.2% |
| 55 to 64 Years | 36 | 31.0% |
| 65 to 74 Years | 4 | 3.5% |
| 75 to 84 Years | 0 | 0.0% |
| 85 Years and Over | 41 | 35.3% |
| Total | 116 | 100.0% |
Housing Finances in Junction City
Median Income by Occupancy in Junction City
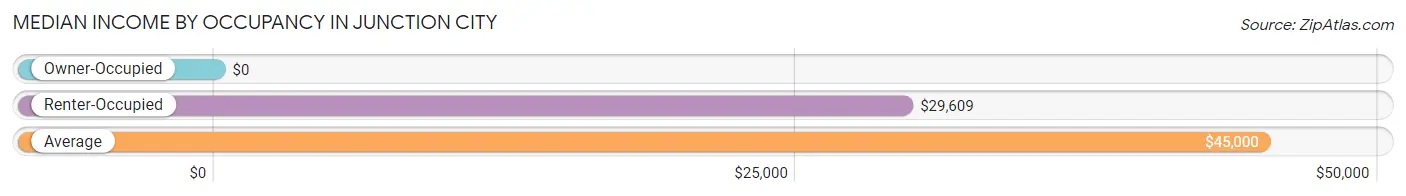
| Occupancy Type | # Households | Median Income |
| Owner-Occupied | 83 (71.6%) | $0 |
| Renter-Occupied | 33 (28.4%) | $29,609 |
| Average | 116 (100.0%) | $45,000 |
Occupancy by Householder Income Bracket in Junction City
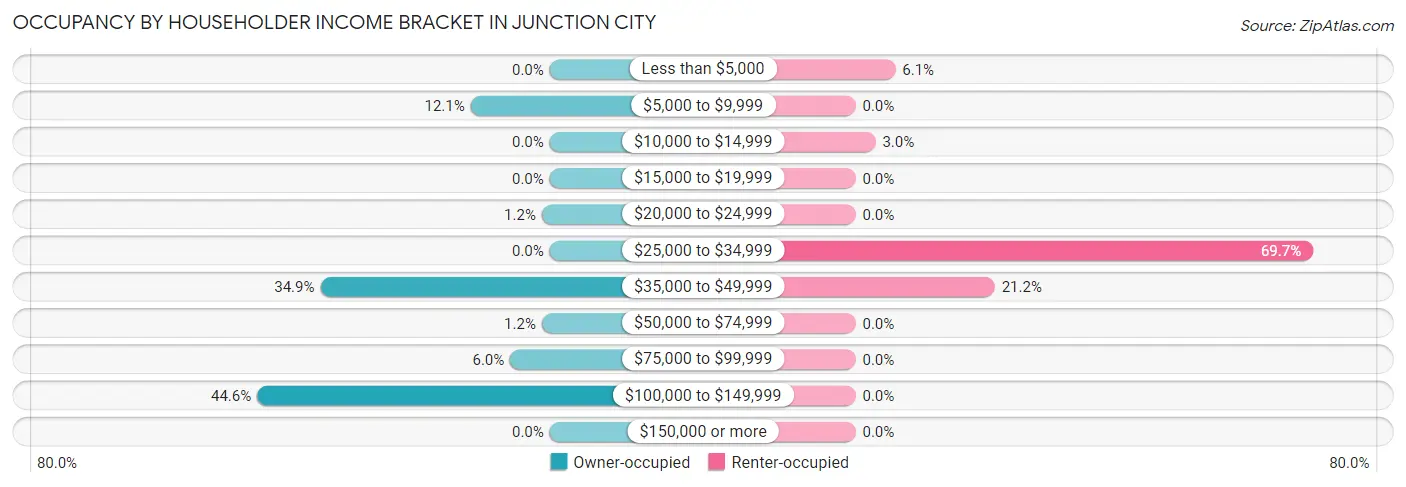
| Income Bracket | Owner-occupied | Renter-occupied |
| Less than $5,000 | 0 (0.0%) | 2 (6.1%) |
| $5,000 to $9,999 | 10 (12.0%) | 0 (0.0%) |
| $10,000 to $14,999 | 0 (0.0%) | 1 (3.0%) |
| $15,000 to $19,999 | 0 (0.0%) | 0 (0.0%) |
| $20,000 to $24,999 | 1 (1.2%) | 0 (0.0%) |
| $25,000 to $34,999 | 0 (0.0%) | 23 (69.7%) |
| $35,000 to $49,999 | 29 (34.9%) | 7 (21.2%) |
| $50,000 to $74,999 | 1 (1.2%) | 0 (0.0%) |
| $75,000 to $99,999 | 5 (6.0%) | 0 (0.0%) |
| $100,000 to $149,999 | 37 (44.6%) | 0 (0.0%) |
| $150,000 or more | 0 (0.0%) | 0 (0.0%) |
| Total | 83 (100.0%) | 33 (100.0%) |
Monthly Housing Cost Tiers in Junction City
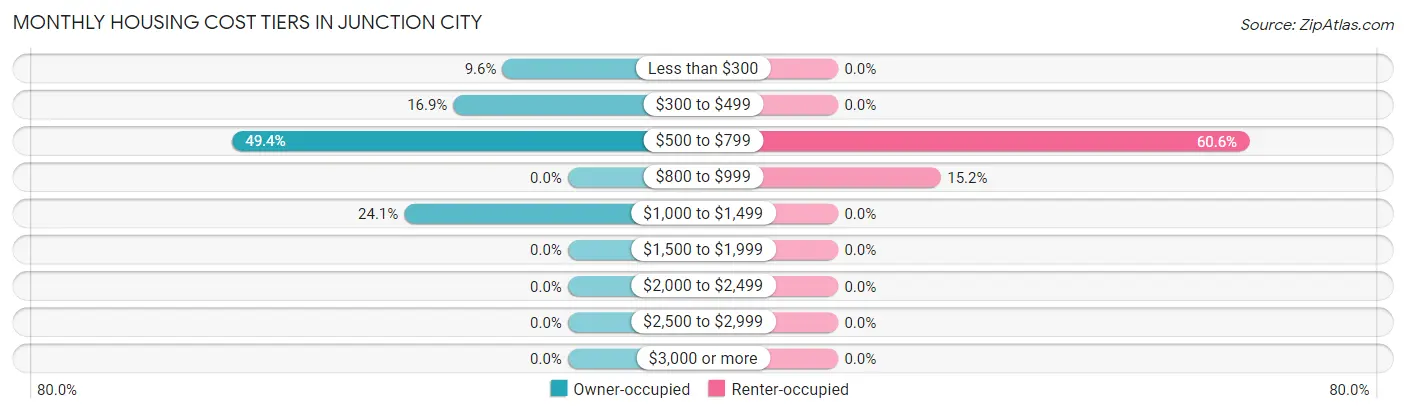
| Monthly Cost | Owner-occupied | Renter-occupied |
| Less than $300 | 8 (9.6%) | 0 (0.0%) |
| $300 to $499 | 14 (16.9%) | 0 (0.0%) |
| $500 to $799 | 41 (49.4%) | 20 (60.6%) |
| $800 to $999 | 0 (0.0%) | 5 (15.1%) |
| $1,000 to $1,499 | 20 (24.1%) | 0 (0.0%) |
| $1,500 to $1,999 | 0 (0.0%) | 0 (0.0%) |
| $2,000 to $2,499 | 0 (0.0%) | 0 (0.0%) |
| $2,500 to $2,999 | 0 (0.0%) | 0 (0.0%) |
| $3,000 or more | 0 (0.0%) | 0 (0.0%) |
| Total | 83 (100.0%) | 33 (100.0%) |
Physical Housing Characteristics in Junction City
Housing Structures in Junction City
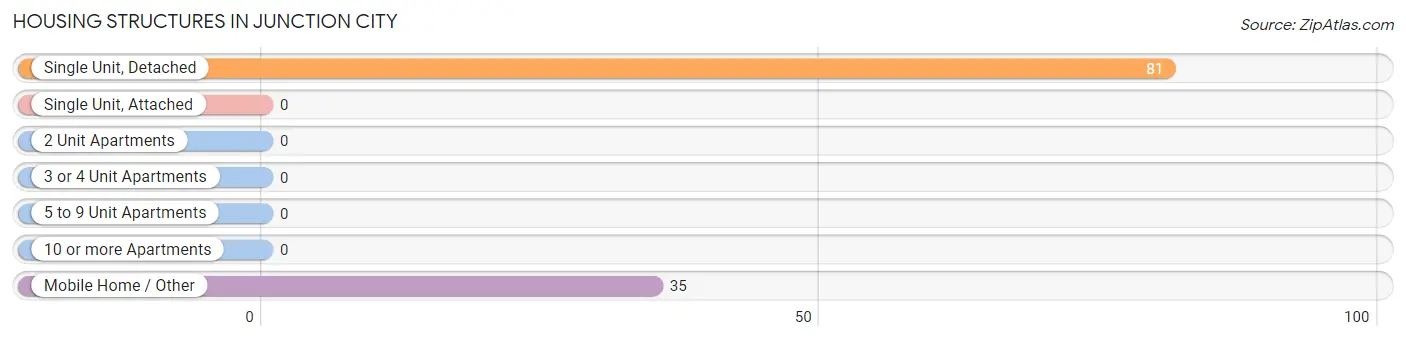
| Structure Type | # Housing Units | % Housing Units |
| Single Unit, Detached | 81 | 69.8% |
| Single Unit, Attached | 0 | 0.0% |
| 2 Unit Apartments | 0 | 0.0% |
| 3 or 4 Unit Apartments | 0 | 0.0% |
| 5 to 9 Unit Apartments | 0 | 0.0% |
| 10 or more Apartments | 0 | 0.0% |
| Mobile Home / Other | 35 | 30.2% |
| Total | 116 | 100.0% |
Housing Structures by Occupancy in Junction City
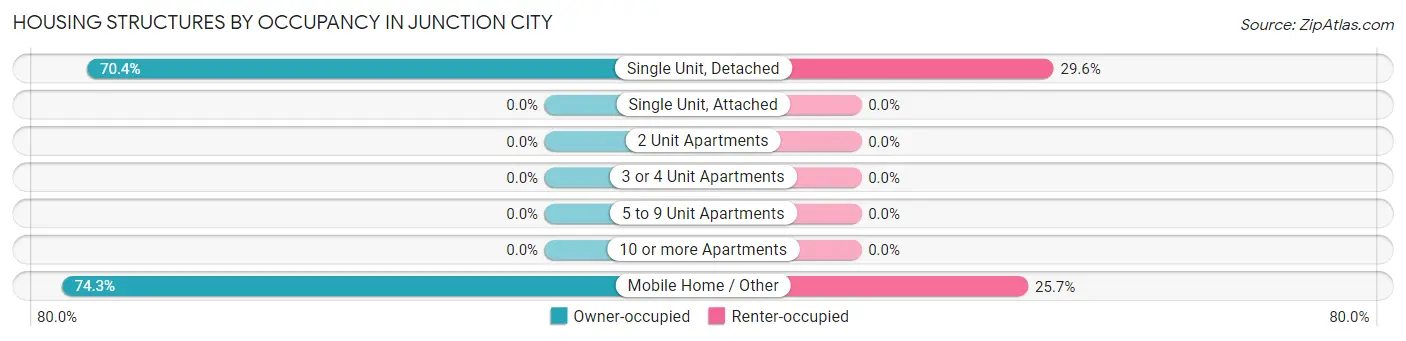
| Structure Type | Owner-occupied | Renter-occupied |
| Single Unit, Detached | 57 (70.4%) | 24 (29.6%) |
| Single Unit, Attached | 0 (0.0%) | 0 (0.0%) |
| 2 Unit Apartments | 0 (0.0%) | 0 (0.0%) |
| 3 or 4 Unit Apartments | 0 (0.0%) | 0 (0.0%) |
| 5 to 9 Unit Apartments | 0 (0.0%) | 0 (0.0%) |
| 10 or more Apartments | 0 (0.0%) | 0 (0.0%) |
| Mobile Home / Other | 26 (74.3%) | 9 (25.7%) |
| Total | 83 (71.6%) | 33 (28.4%) |
Housing Structures by Number of Rooms in Junction City
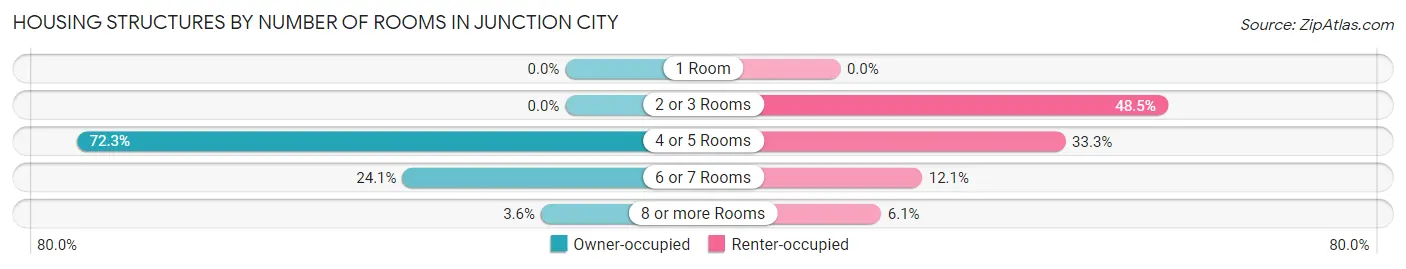
| Number of Rooms | Owner-occupied | Renter-occupied |
| 1 Room | 0 (0.0%) | 0 (0.0%) |
| 2 or 3 Rooms | 0 (0.0%) | 16 (48.5%) |
| 4 or 5 Rooms | 60 (72.3%) | 11 (33.3%) |
| 6 or 7 Rooms | 20 (24.1%) | 4 (12.1%) |
| 8 or more Rooms | 3 (3.6%) | 2 (6.1%) |
| Total | 83 (100.0%) | 33 (100.0%) |
Housing Structure by Heating Type in Junction City
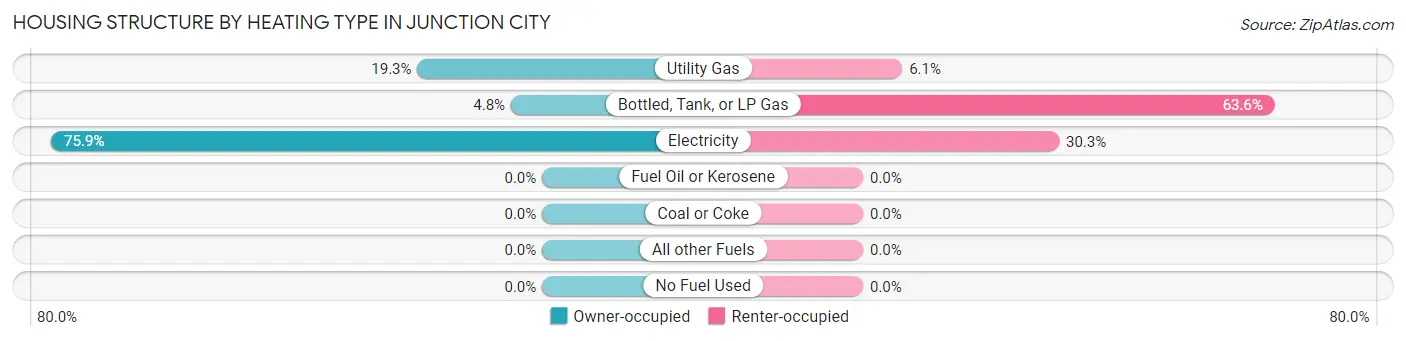
| Heating Type | Owner-occupied | Renter-occupied |
| Utility Gas | 16 (19.3%) | 2 (6.1%) |
| Bottled, Tank, or LP Gas | 4 (4.8%) | 21 (63.6%) |
| Electricity | 63 (75.9%) | 10 (30.3%) |
| Fuel Oil or Kerosene | 0 (0.0%) | 0 (0.0%) |
| Coal or Coke | 0 (0.0%) | 0 (0.0%) |
| All other Fuels | 0 (0.0%) | 0 (0.0%) |
| No Fuel Used | 0 (0.0%) | 0 (0.0%) |
| Total | 83 (100.0%) | 33 (100.0%) |
Household Vehicle Usage in Junction City
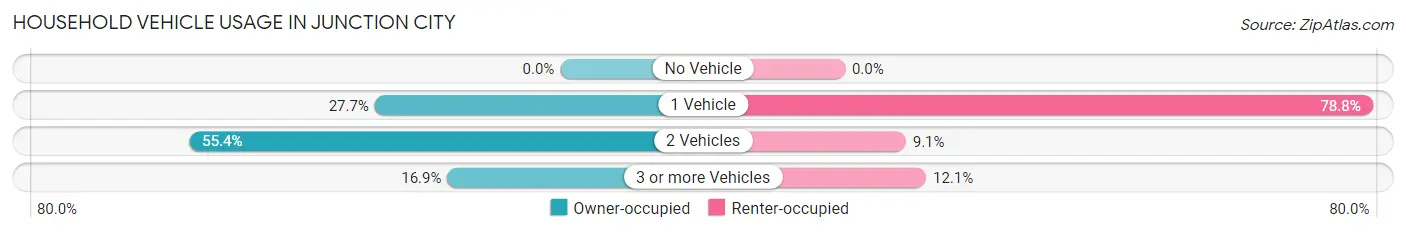
| Vehicles per Household | Owner-occupied | Renter-occupied |
| No Vehicle | 0 (0.0%) | 0 (0.0%) |
| 1 Vehicle | 23 (27.7%) | 26 (78.8%) |
| 2 Vehicles | 46 (55.4%) | 3 (9.1%) |
| 3 or more Vehicles | 14 (16.9%) | 4 (12.1%) |
| Total | 83 (100.0%) | 33 (100.0%) |
Real Estate & Mortgages in Junction City
Real Estate and Mortgage Overview in Junction City
| Characteristic | Without Mortgage | With Mortgage |
| Housing Units | 55 | 28 |
| Median Property Value | $33,200 | $0 |
| Median Household Income | $112,933 | $0 |
| Monthly Housing Costs | $615 | $0 |
| Real Estate Taxes | $627 | $5 |
Property Value by Mortgage Status in Junction City
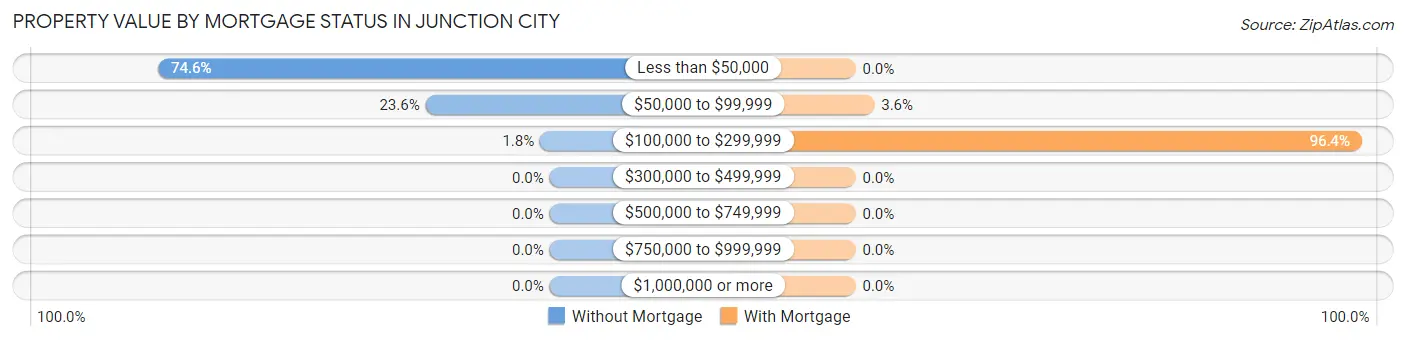
| Property Value | Without Mortgage | With Mortgage |
| Less than $50,000 | 41 (74.6%) | 0 (0.0%) |
| $50,000 to $99,999 | 13 (23.6%) | 1 (3.6%) |
| $100,000 to $299,999 | 1 (1.8%) | 27 (96.4%) |
| $300,000 to $499,999 | 0 (0.0%) | 0 (0.0%) |
| $500,000 to $749,999 | 0 (0.0%) | 0 (0.0%) |
| $750,000 to $999,999 | 0 (0.0%) | 0 (0.0%) |
| $1,000,000 or more | 0 (0.0%) | 0 (0.0%) |
| Total | 55 (100.0%) | 28 (100.0%) |
Household Income by Mortgage Status in Junction City
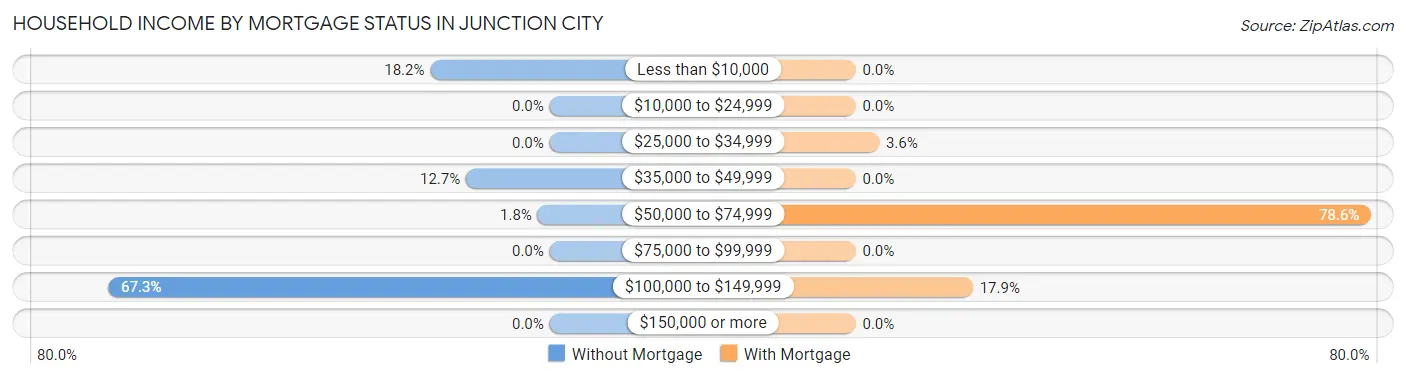
| Household Income | Without Mortgage | With Mortgage |
| Less than $10,000 | 10 (18.2%) | 0 (0.0%) |
| $10,000 to $24,999 | 0 (0.0%) | 0 (0.0%) |
| $25,000 to $34,999 | 0 (0.0%) | 1 (3.6%) |
| $35,000 to $49,999 | 7 (12.7%) | 0 (0.0%) |
| $50,000 to $74,999 | 1 (1.8%) | 22 (78.6%) |
| $75,000 to $99,999 | 0 (0.0%) | 0 (0.0%) |
| $100,000 to $149,999 | 37 (67.3%) | 5 (17.9%) |
| $150,000 or more | 0 (0.0%) | 0 (0.0%) |
| Total | 55 (100.0%) | 28 (100.0%) |
Property Value to Household Income Ratio in Junction City
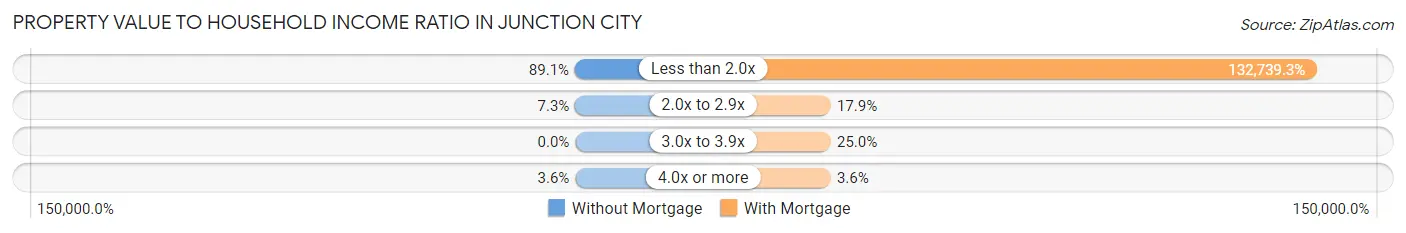
| Value-to-Income Ratio | Without Mortgage | With Mortgage |
| Less than 2.0x | 49 (89.1%) | 37,167 (132,739.3%) |
| 2.0x to 2.9x | 4 (7.3%) | 5 (17.9%) |
| 3.0x to 3.9x | 0 (0.0%) | 7 (25.0%) |
| 4.0x or more | 2 (3.6%) | 1 (3.6%) |
| Total | 55 (100.0%) | 28 (100.0%) |
Real Estate Taxes by Mortgage Status in Junction City
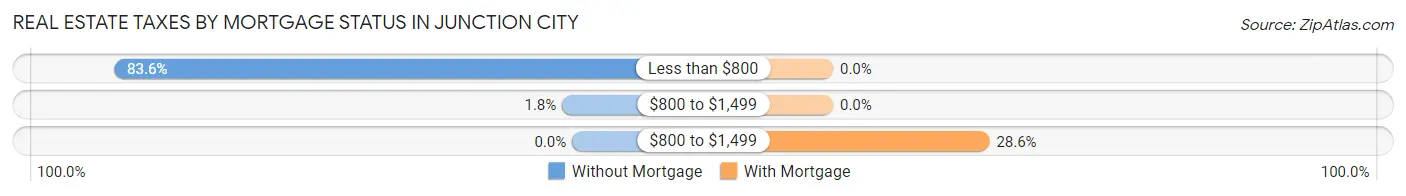
| Property Taxes | Without Mortgage | With Mortgage |
| Less than $800 | 46 (83.6%) | 0 (0.0%) |
| $800 to $1,499 | 1 (1.8%) | 0 (0.0%) |
| $800 to $1,499 | 0 (0.0%) | 8 (28.6%) |
| Total | 55 (100.0%) | 28 (100.0%) |
Health & Disability in Junction City
Health Insurance Coverage by Age in Junction City
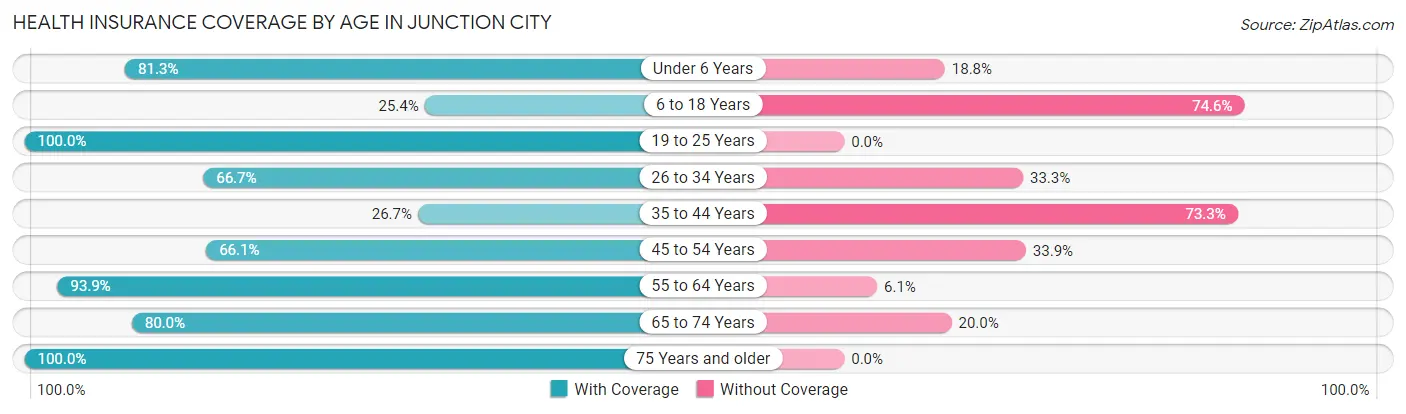
| Age Bracket | With Coverage | Without Coverage |
| Under 6 Years | 13 (81.2%) | 3 (18.8%) |
| 6 to 18 Years | 15 (25.4%) | 44 (74.6%) |
| 19 to 25 Years | 52 (100.0%) | 0 (0.0%) |
| 26 to 34 Years | 26 (66.7%) | 13 (33.3%) |
| 35 to 44 Years | 16 (26.7%) | 44 (73.3%) |
| 45 to 54 Years | 41 (66.1%) | 21 (33.9%) |
| 55 to 64 Years | 46 (93.9%) | 3 (6.1%) |
| 65 to 74 Years | 4 (80.0%) | 1 (20.0%) |
| 75 Years and older | 67 (100.0%) | 0 (0.0%) |
| Total | 280 (68.5%) | 129 (31.5%) |
Health Insurance Coverage by Citizenship Status in Junction City
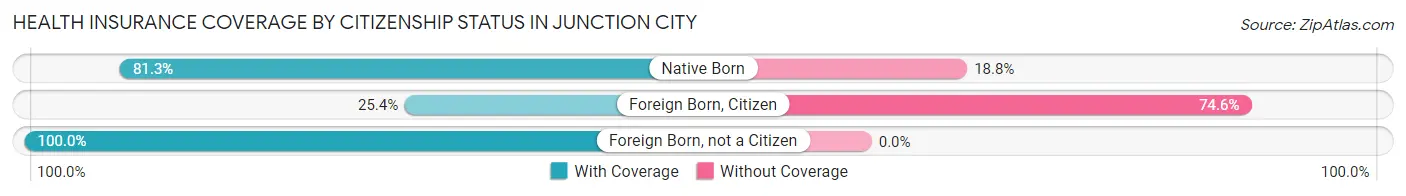
| Citizenship Status | With Coverage | Without Coverage |
| Native Born | 13 (81.2%) | 3 (18.8%) |
| Foreign Born, Citizen | 15 (25.4%) | 44 (74.6%) |
| Foreign Born, not a Citizen | 52 (100.0%) | 0 (0.0%) |
Health Insurance Coverage by Household Income in Junction City
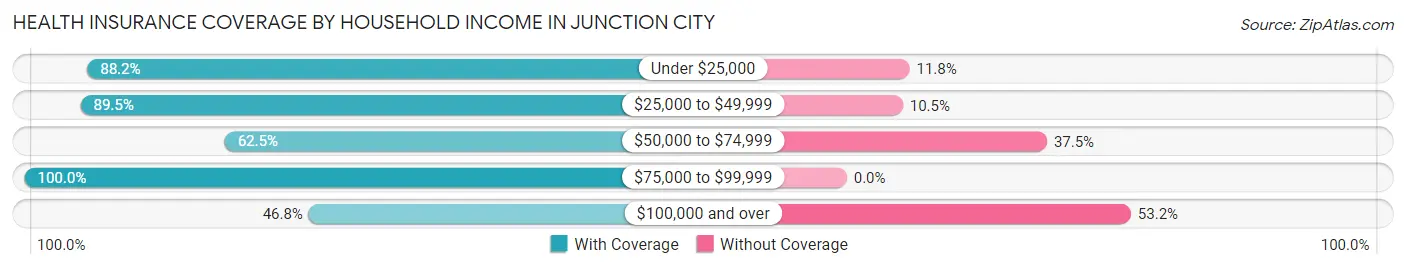
| Household Income | With Coverage | Without Coverage |
| Under $25,000 | 15 (88.2%) | 2 (11.8%) |
| $25,000 to $49,999 | 145 (89.5%) | 17 (10.5%) |
| $50,000 to $74,999 | 5 (62.5%) | 3 (37.5%) |
| $75,000 to $99,999 | 21 (100.0%) | 0 (0.0%) |
| $100,000 and over | 94 (46.8%) | 107 (53.2%) |
Public vs Private Health Insurance Coverage by Age in Junction City
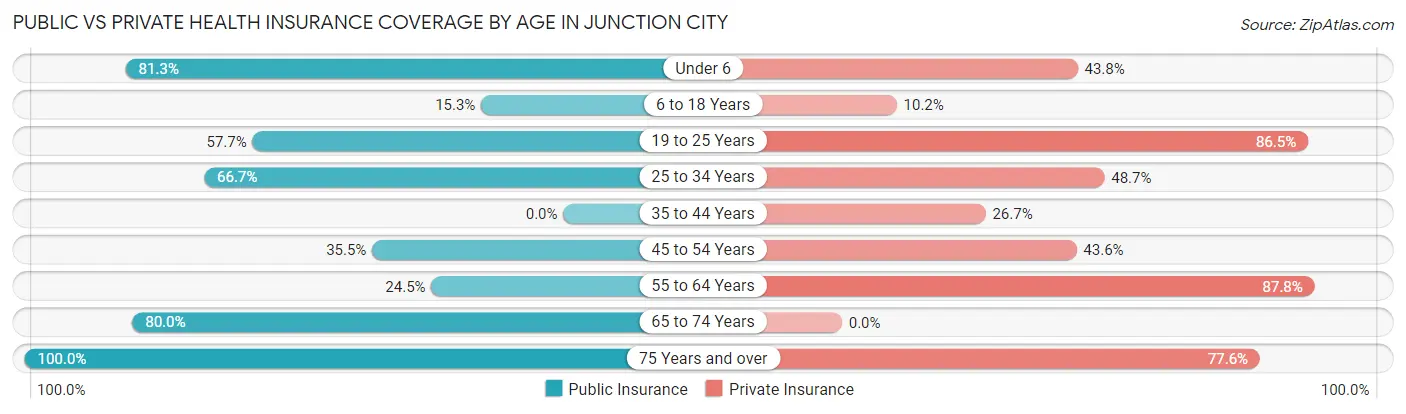
| Age Bracket | Public Insurance | Private Insurance |
| Under 6 | 13 (81.2%) | 7 (43.8%) |
| 6 to 18 Years | 9 (15.2%) | 6 (10.2%) |
| 19 to 25 Years | 30 (57.7%) | 45 (86.5%) |
| 25 to 34 Years | 26 (66.7%) | 19 (48.7%) |
| 35 to 44 Years | 0 (0.0%) | 16 (26.7%) |
| 45 to 54 Years | 22 (35.5%) | 27 (43.5%) |
| 55 to 64 Years | 12 (24.5%) | 43 (87.8%) |
| 65 to 74 Years | 4 (80.0%) | 0 (0.0%) |
| 75 Years and over | 67 (100.0%) | 52 (77.6%) |
| Total | 183 (44.7%) | 215 (52.6%) |
Disability Status by Sex by Age in Junction City
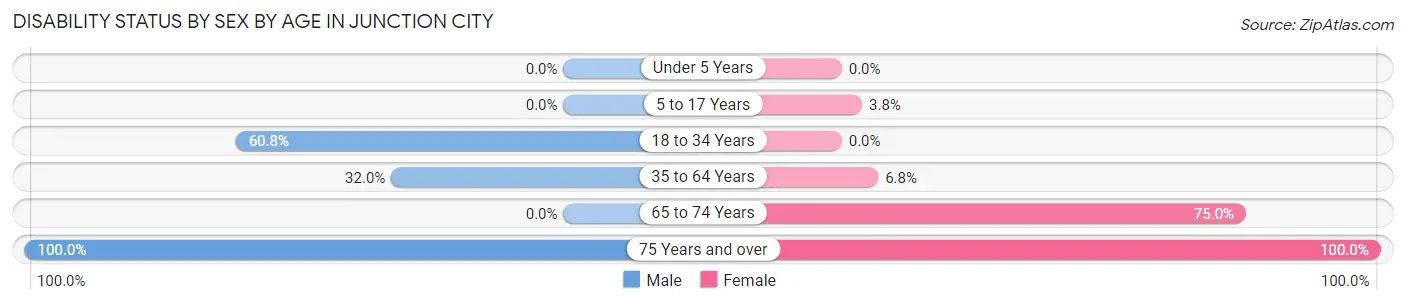
| Age Bracket | Male | Female |
| Under 5 Years | 0 (0.0%) | 0 (0.0%) |
| 5 to 17 Years | 0 (0.0%) | 2 (3.8%) |
| 18 to 34 Years | 45 (60.8%) | 0 (0.0%) |
| 35 to 64 Years | 31 (32.0%) | 5 (6.8%) |
| 65 to 74 Years | 0 (0.0%) | 3 (75.0%) |
| 75 Years and over | 26 (100.0%) | 41 (100.0%) |
Disability Class by Sex by Age in Junction City
Disability Class: Hearing Difficulty
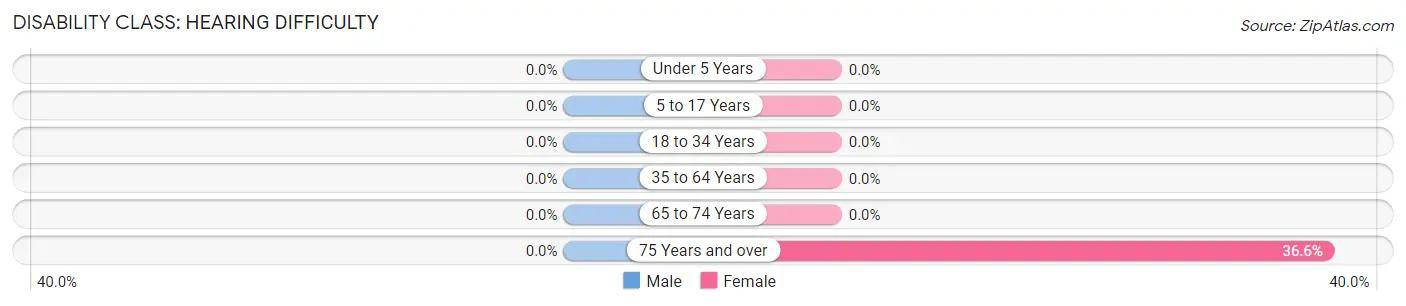
| Age Bracket | Male | Female |
| Under 5 Years | 0 (0.0%) | 0 (0.0%) |
| 5 to 17 Years | 0 (0.0%) | 0 (0.0%) |
| 18 to 34 Years | 0 (0.0%) | 0 (0.0%) |
| 35 to 64 Years | 0 (0.0%) | 0 (0.0%) |
| 65 to 74 Years | 0 (0.0%) | 0 (0.0%) |
| 75 Years and over | 0 (0.0%) | 15 (36.6%) |
Disability Class: Vision Difficulty
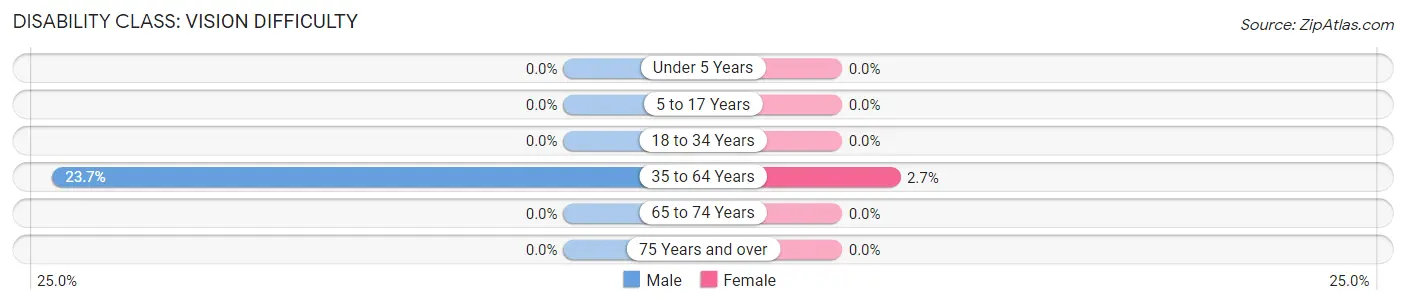
| Age Bracket | Male | Female |
| Under 5 Years | 0 (0.0%) | 0 (0.0%) |
| 5 to 17 Years | 0 (0.0%) | 0 (0.0%) |
| 18 to 34 Years | 0 (0.0%) | 0 (0.0%) |
| 35 to 64 Years | 23 (23.7%) | 2 (2.7%) |
| 65 to 74 Years | 0 (0.0%) | 0 (0.0%) |
| 75 Years and over | 0 (0.0%) | 0 (0.0%) |
Disability Class: Cognitive Difficulty
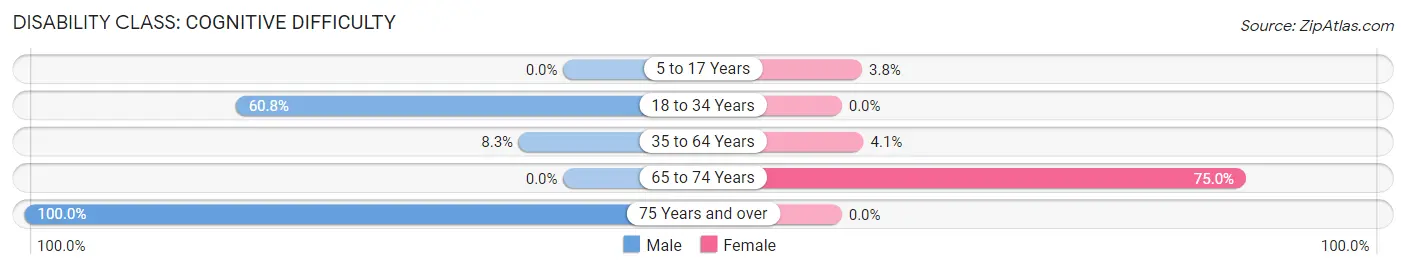
| Age Bracket | Male | Female |
| 5 to 17 Years | 0 (0.0%) | 2 (3.8%) |
| 18 to 34 Years | 45 (60.8%) | 0 (0.0%) |
| 35 to 64 Years | 8 (8.3%) | 3 (4.1%) |
| 65 to 74 Years | 0 (0.0%) | 3 (75.0%) |
| 75 Years and over | 26 (100.0%) | 0 (0.0%) |
Disability Class: Ambulatory Difficulty
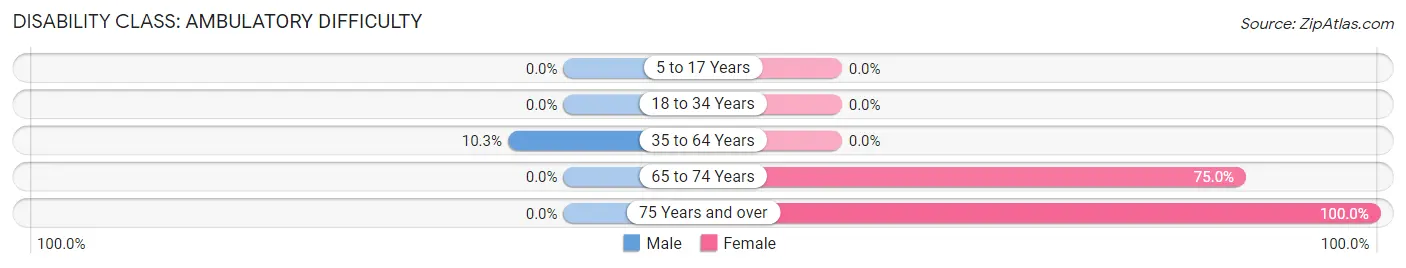
| Age Bracket | Male | Female |
| 5 to 17 Years | 0 (0.0%) | 0 (0.0%) |
| 18 to 34 Years | 0 (0.0%) | 0 (0.0%) |
| 35 to 64 Years | 10 (10.3%) | 0 (0.0%) |
| 65 to 74 Years | 0 (0.0%) | 3 (75.0%) |
| 75 Years and over | 0 (0.0%) | 41 (100.0%) |
Disability Class: Self-Care Difficulty
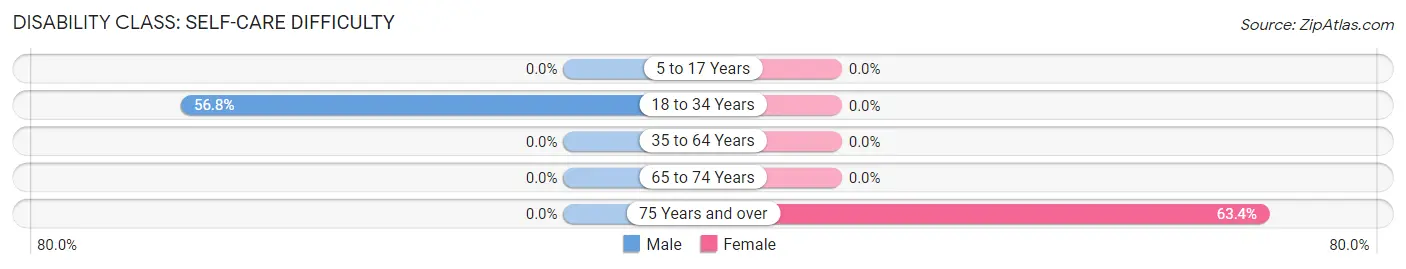
| Age Bracket | Male | Female |
| 5 to 17 Years | 0 (0.0%) | 0 (0.0%) |
| 18 to 34 Years | 42 (56.8%) | 0 (0.0%) |
| 35 to 64 Years | 0 (0.0%) | 0 (0.0%) |
| 65 to 74 Years | 0 (0.0%) | 0 (0.0%) |
| 75 Years and over | 0 (0.0%) | 26 (63.4%) |
Technology Access in Junction City
Computing Device Access in Junction City
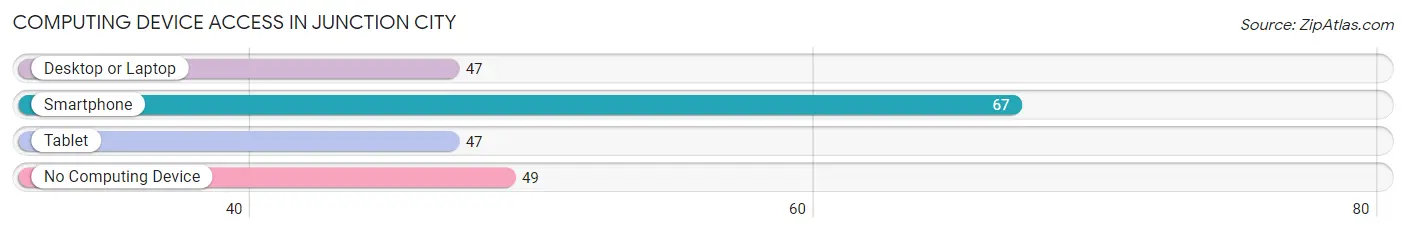
| Device Type | # Households | % Households |
| Desktop or Laptop | 47 | 40.5% |
| Smartphone | 67 | 57.8% |
| Tablet | 47 | 40.5% |
| No Computing Device | 49 | 42.2% |
| Total | 116 | 100.0% |
Internet Access in Junction City
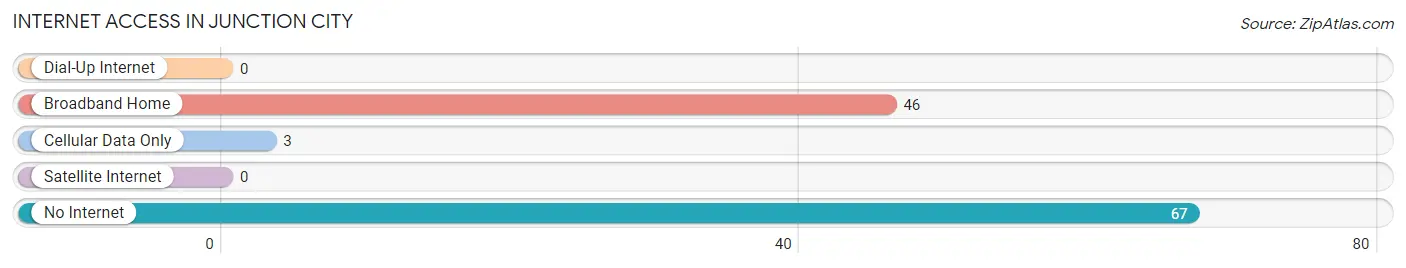
| Internet Type | # Households | % Households |
| Dial-Up Internet | 0 | 0.0% |
| Broadband Home | 46 | 39.7% |
| Cellular Data Only | 3 | 2.6% |
| Satellite Internet | 0 | 0.0% |
| No Internet | 67 | 57.8% |
| Total | 116 | 100.0% |
Junction City Summary
Junction City is a small city located in Johnson County, Georgia, United States. It is situated in the foothills of the Appalachian Mountains, approximately 30 miles south of Athens and 70 miles northeast of Atlanta. The city has a population of 1,845 as of the 2010 census, and is the county seat of Johnson County.
History
Junction City was founded in 1854 by the Georgia General Assembly as the county seat of Johnson County. The city was named for its location at the junction of two major roads, the Old Federal Road and the Old Savannah Road. The city was incorporated in 1856 and has remained the county seat ever since.
In the late 19th century, Junction City was a thriving agricultural center, with cotton, corn, and tobacco being the main crops. The city was also home to several sawmills and gristmills, as well as a number of small businesses.
In the early 20th century, Junction City experienced a period of growth and prosperity. The city was home to several banks, a hotel, a movie theater, and a variety of other businesses. The city also had a thriving African-American community, with several churches, schools, and businesses.
Geography
Junction City is located in the foothills of the Appalachian Mountains, approximately 30 miles south of Athens and 70 miles northeast of Atlanta. The city is situated at the junction of two major roads, the Old Federal Road and the Old Savannah Road. The city is surrounded by rolling hills and forests, and is located near the Oconee National Forest.
The city has a total area of 2.2 square miles, all of which is land. The city is located at an elevation of 890 feet above sea level.
Economy
The economy of Junction City is largely based on agriculture and tourism. The city is home to several farms, which produce a variety of crops, including cotton, corn, and tobacco. The city is also home to several small businesses, including restaurants, retail stores, and service providers.
The city is also a popular tourist destination, with several attractions, including the Oconee National Forest, the Old Federal Road, and the Old Savannah Road. The city is also home to several festivals and events, including the annual Johnson County Fair and the Junction City Music Festival.
Demographics
As of the 2010 census, the population of Junction City was 1,845. The racial makeup of the city was 79.2% White, 17.3% African American, 0.3% Native American, 0.3% Asian, 0.1% Pacific Islander, 1.2% from other races, and 1.6% from two or more races. Hispanic or Latino of any race were 2.7% of the population.
The median household income in Junction City was $30,938, and the median family income was $37,813. The per capita income for the city was $15,945. About 17.3% of families and 20.2% of the population were below the poverty line, including 28.3% of those under age 18 and 15.2% of those age 65 or over.
Common Questions
What is Per Capita Income in Junction City?
Per Capita income in Junction City is $19,483.
What is the Median Household income in Junction City?
Median Household Income in Junction City is $45,000.
What is Inequality or Gini Index in Junction City?
Inequality or Gini Index in Junction City is 0.36.
What is the Total Population of Junction City?
Total Population of Junction City is 409.
What is the Total Male Population of Junction City?
Total Male Population of Junction City is 220.
What is the Total Female Population of Junction City?
Total Female Population of Junction City is 189.
What is the Ratio of Males per 100 Females in Junction City?
There are 116.40 Males per 100 Females in Junction City.
What is the Ratio of Females per 100 Males in Junction City?
There are 85.91 Females per 100 Males in Junction City.
What is the Median Population Age in Junction City?
Median Population Age in Junction City is 44.5 Years.
What is the Average Family Size in Junction City
Average Family Size in Junction City is 4.0 People.
What is the Average Household Size in Junction City
Average Household Size in Junction City is 3.5 People.
How Large is the Labor Force in Junction City?
There are 149 People in the Labor Forcein in Junction City.
What is the Percentage of People in the Labor Force in Junction City?
44.0% of People are in the Labor Force in Junction City.
What is the Unemployment Rate in Junction City?
Unemployment Rate in Junction City is 6.0%.